On Friday Palantir and CrowdStrike lost 7%, the software fund 4.8% and the hyperscalers 2%; the Nasdaq 100 closed under the line it has held since the March low. The money went to staples, health care and energy. What the supply and demand gauges say about the fibre-gap fear, why the flow board has not caught up with Friday yet, and how the Hypergrowth book bought back its calls into the drop.

1 · This Week’s Action
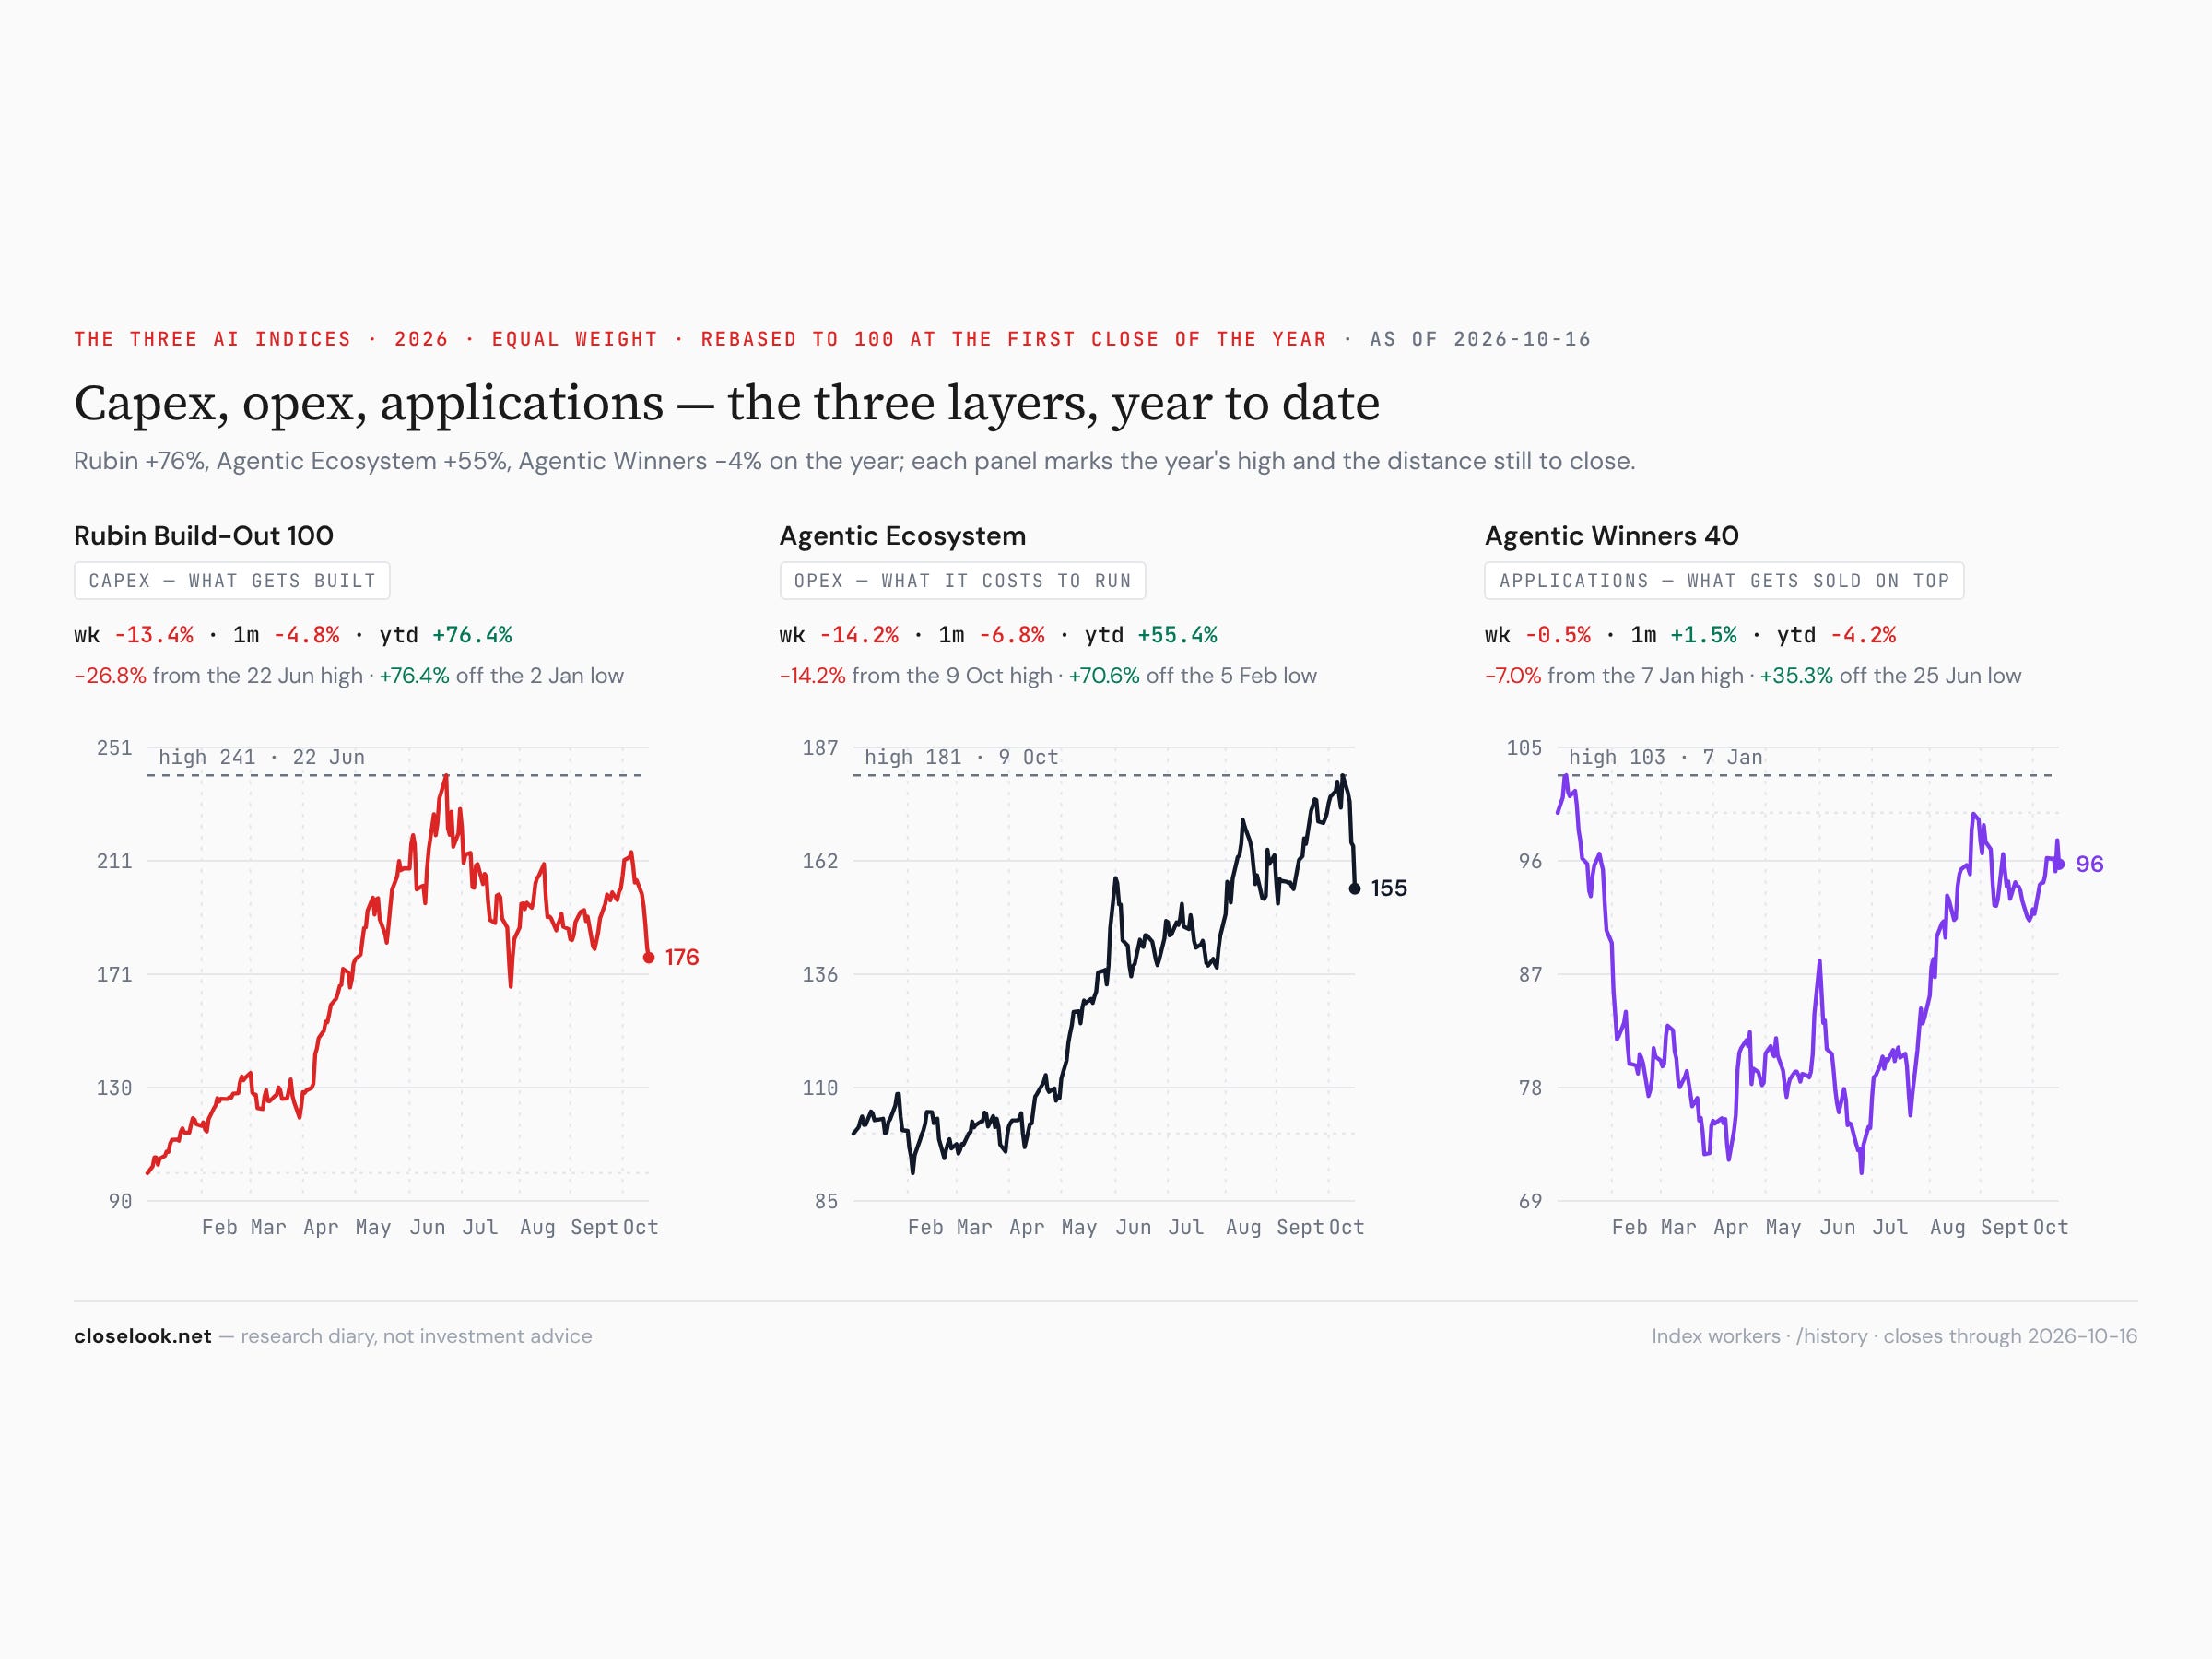
The week in one line: the whole AI stack was sold — the builders and the operators from Monday, the applications on Friday. Capex (Rubin Build-Out) −13.45% to 1,813.50; opex (Agentic Ecosystem) −14.16% to 1,533.41; applications (Agentic Winners 40) −0.50% to 937.97. The builder had five of its 130 members up on the week. The runner between them, which made a record a week ago, had none of its 34 up. The applications index was up about 1.5% through Thursday and lost 2.0% on Friday alone.
Friday was the day the winners were sold — all of them. Up to Thursday this looked like last week again: chips out, software in. ServiceNow closed 6.1% higher on Thursday while TSMC’s careful words on 2027 sent the chip fund lower. Then on Friday the selling reached the companies that had been the shelter. Palantir −7.2%, CrowdStrike −7.0%, ServiceNow −4.4%, Oracle −4.6%, Meta −3.7%, Alphabet −2.5%, Microsoft and Amazon −1.9% each. The software fund IGV lost 4.8% on the day, the chip fund SOXX 4.1%, the Nasdaq 100 fund QQQ 2.5%. It looked like broad profit taking across everything that had worked in AI this year, into a weekend with the big reports still ahead.
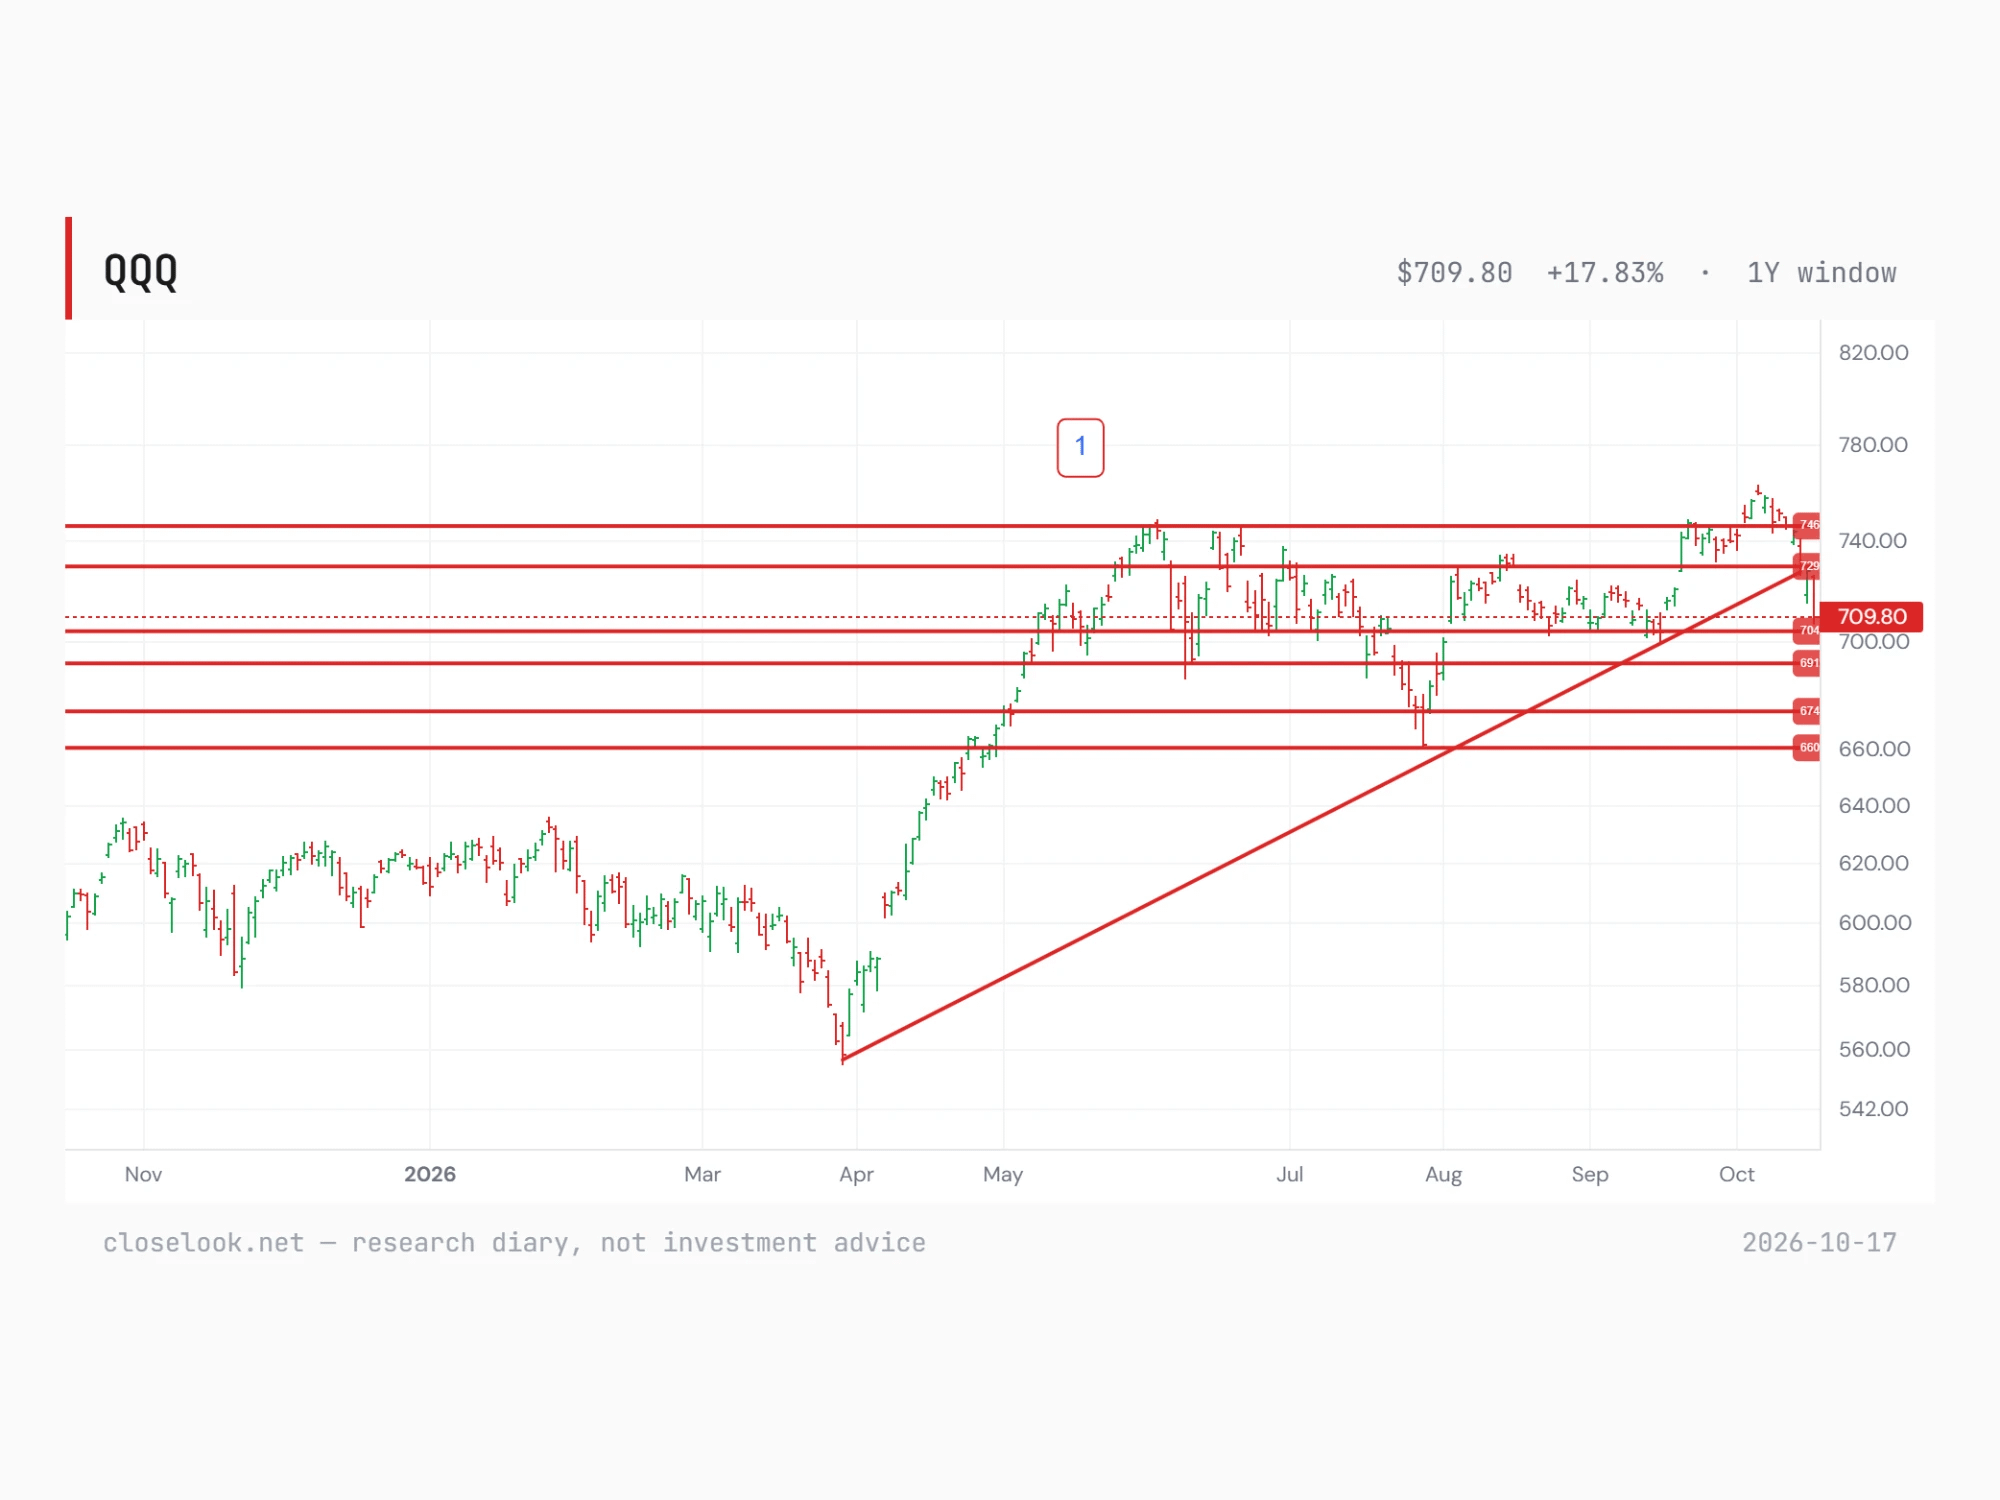
The line on the Nasdaq 100 broke. The editor’s chart below draws the line from the 30 March low through the August low. It ran at about 729 on Friday; QQQ closed at 709.80, −5.52% on the week, under it for the first time since the line was drawn. The levels underneath: 704 (the mid-September low), 691, 674 and 660 (the summer low). The chip fund closed 24.7% under its June high; the tech sector fund XLK lost 7.7% on the week.
Where the money went. Not out of the market — into the parts of it with no AI story. Consumer staples (XLP) +5.0% to their highest close since 3 March, health care (XLV) +3.45% with a one-year closing high on Thursday, energy (XLE) +4.9%. The equal-weight S&P 500 rose 0.5% while the Nasdaq 100 fell 5.5%.
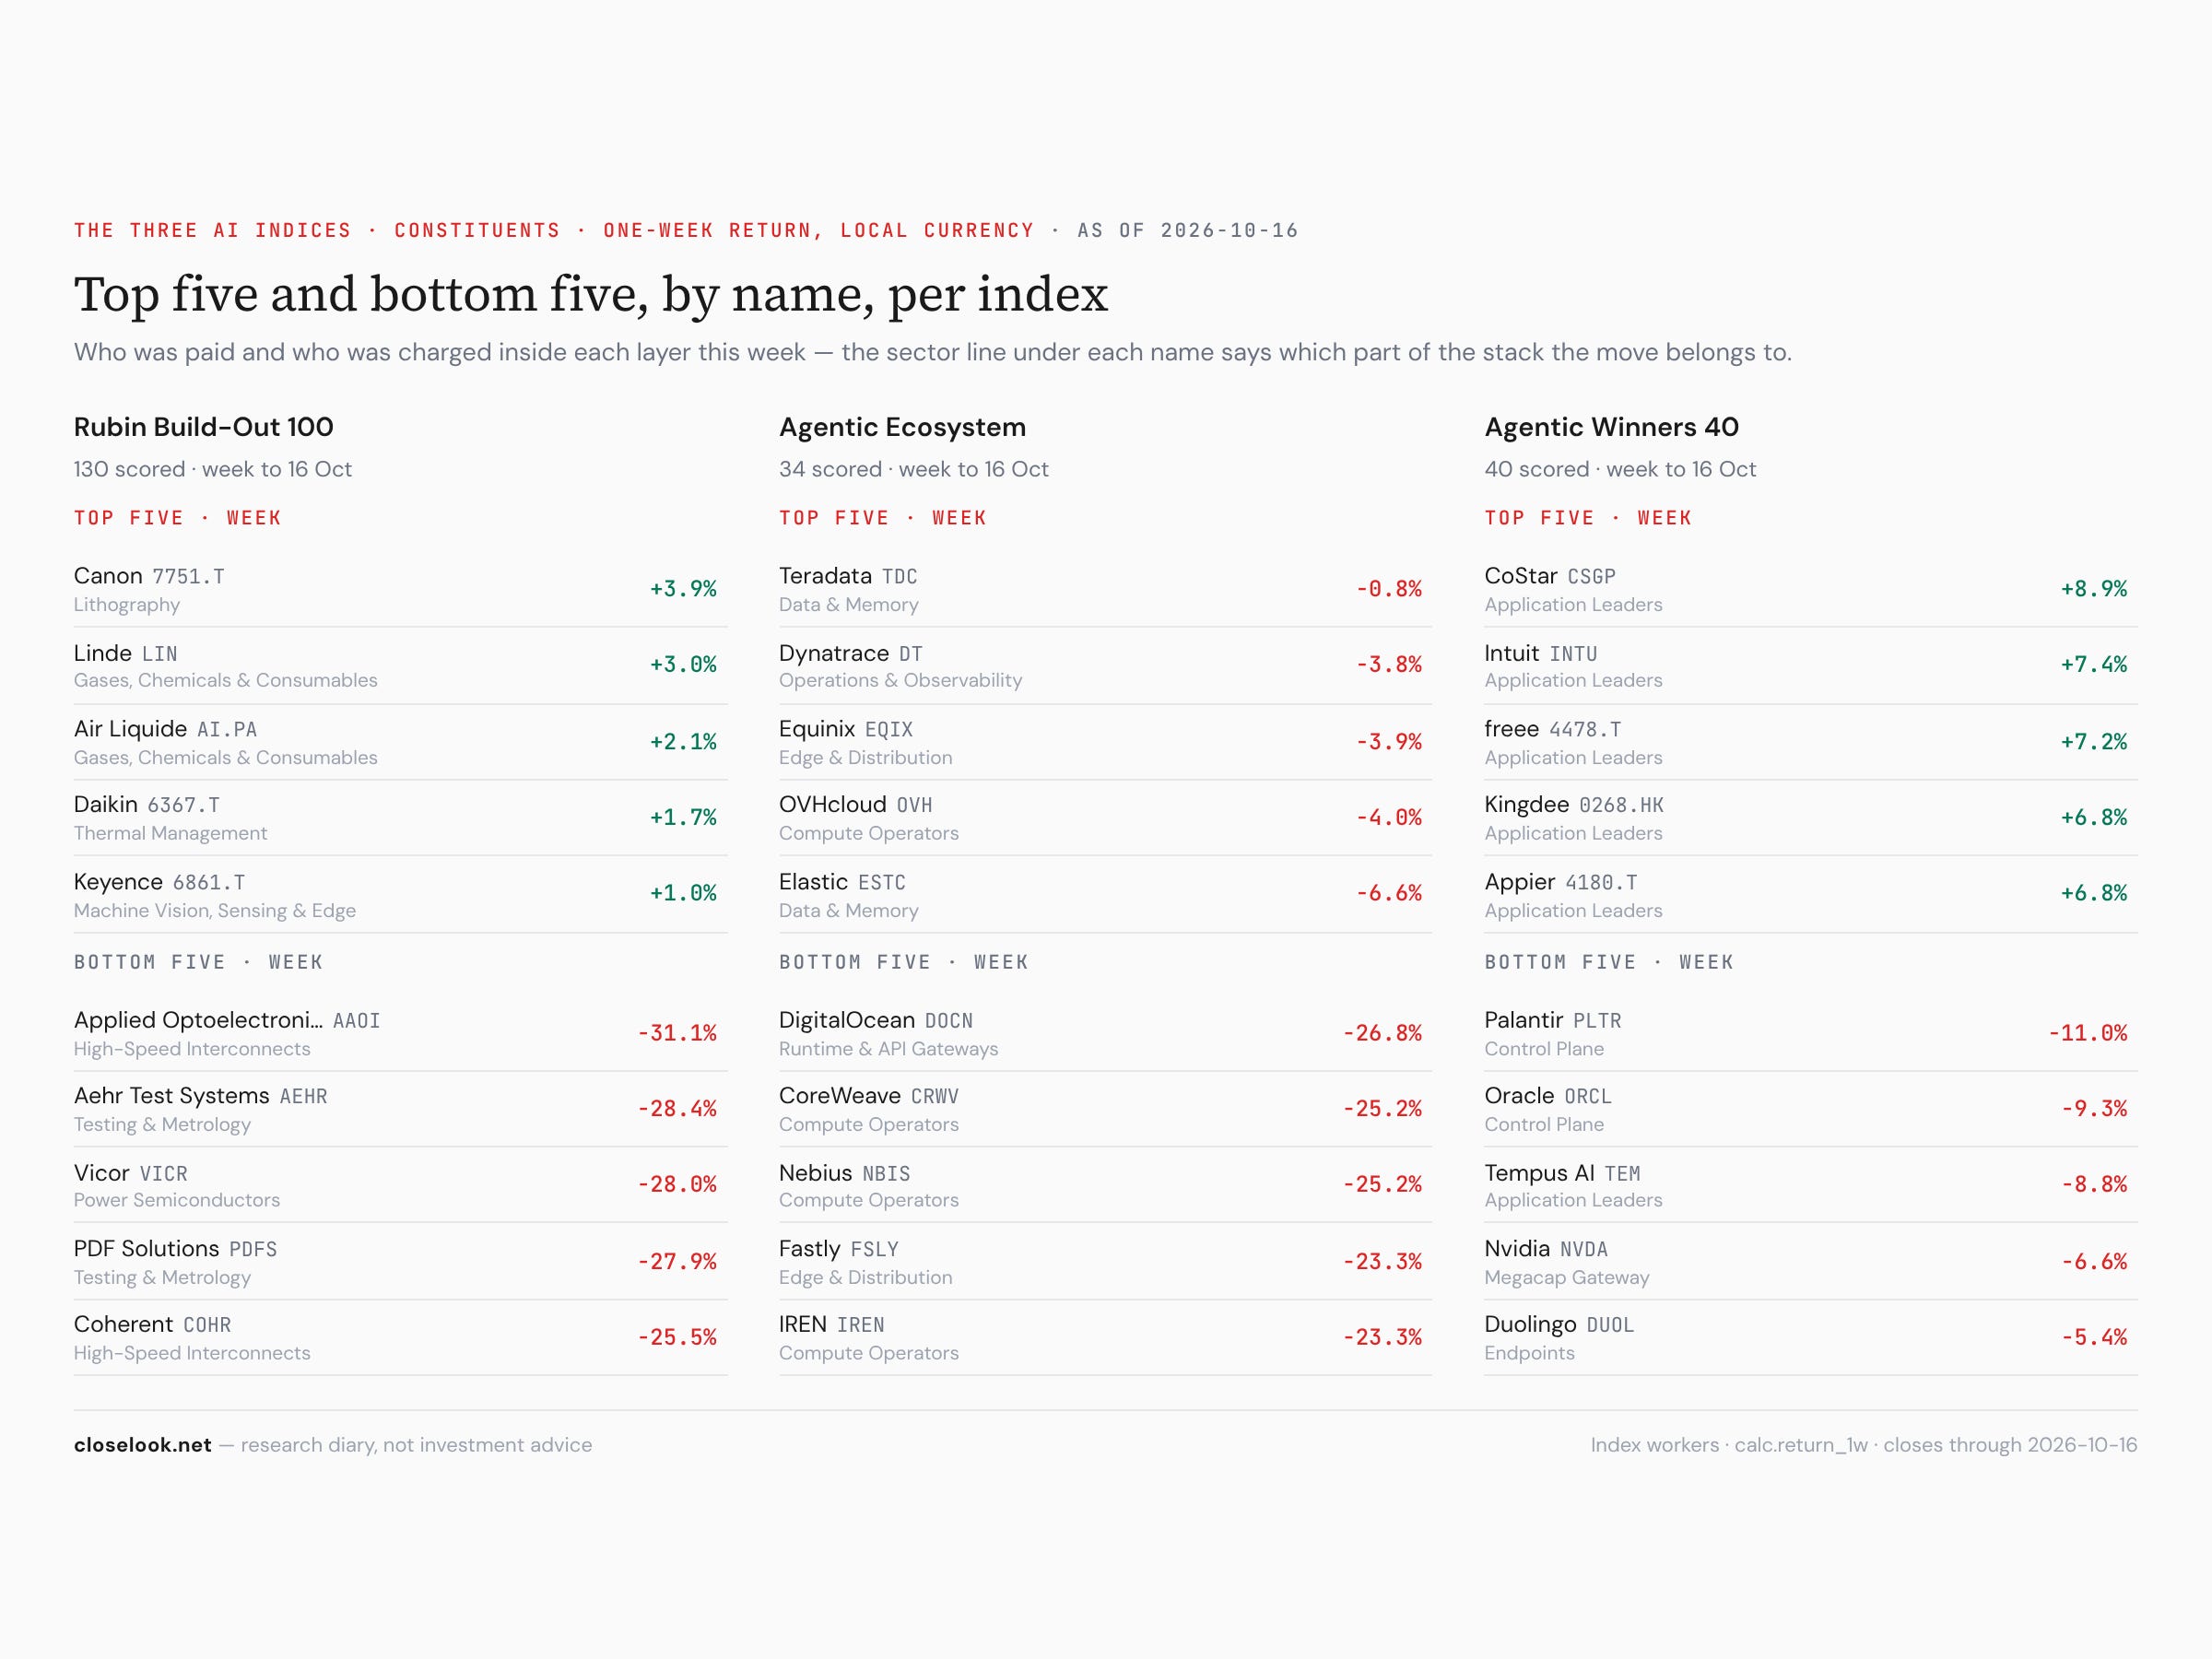
The ten worst of the week, across all three indices — the optics, the test tools, the neoclouds. Applied Optoelectronics −31.1%, Aehr Test Systems −28.4%, Vicor −28.0%, PDF Solutions −27.9%, DigitalOcean −26.8%, Coherent −25.5%, Cohu −25.5%, Lumentum −25.3%, Kioxia −25.3%, Fabrinet −25.3%. CoreWeave and Nebius fell 25.2% each. The ten best — software sold on price earlier in the year: CoStar +8.9%, Intuit +7.4%, freee +7.2%, Kingdee +6.8%, Appier +6.8%, Dassault Systèmes +6.2%, Salesforce +5.1%, Veeva +4.8%, SAP +4.4%, Canon +3.9%. Intuit and CoStar are still down about half on the year; this was a bounce in the cheapest names, not a turn in the group.
2 · The AI Board — where each layer stands
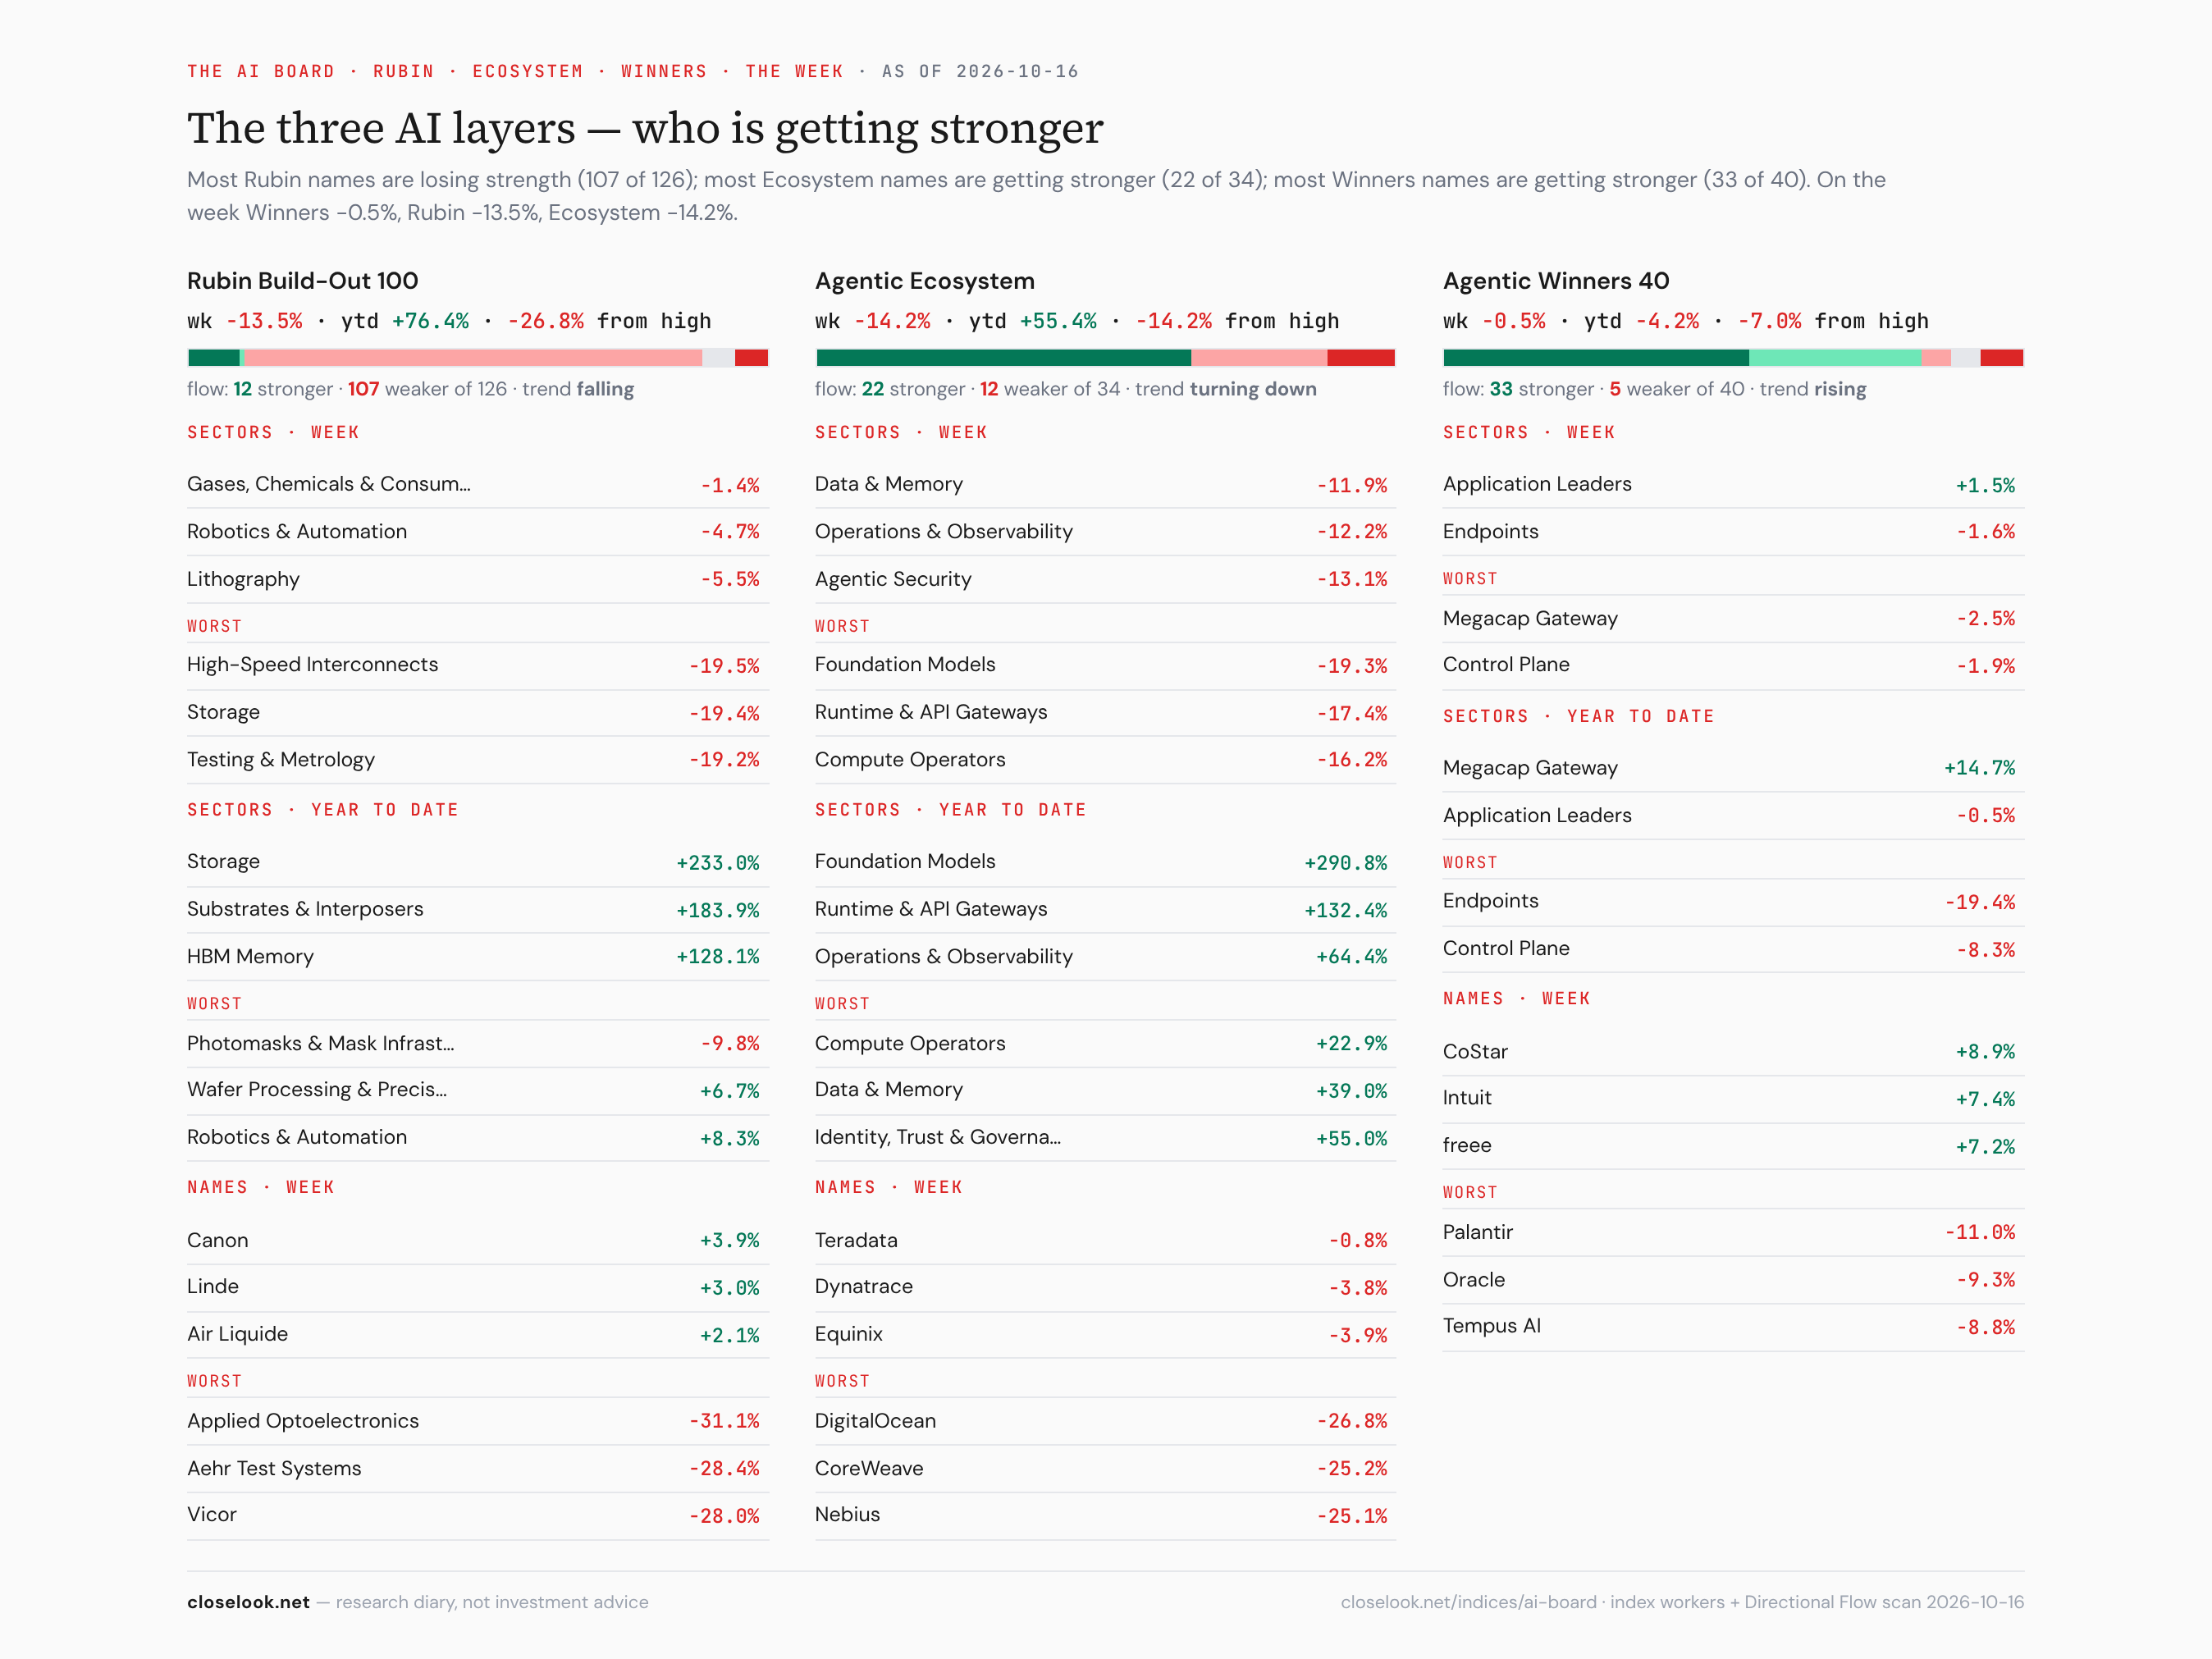
The house AI Board puts the three layers side by side, with the Directional Flow score under each — a measure of whether a stock’s trend is gaining or losing force. Its sentence of the day: most Rubin names are losing strength (107 of 126); most Ecosystem names are getting stronger (22 of 34); most Winners names are getting stronger (33 of 40).
Read that sentence with care this week, because two thirds of it is behind the price. The flow score is built from trends over weeks; it does not move in a day. The Ecosystem lost 14.2% in a week and every one of its members fell, and the flow still counts 22 of 34 as gaining force — its average is now turning down. The Winners lost 2% on Friday, and the flow still counts 33 of 40 as stronger, because their trends were improving until Thursday. The builder’s flow is the only one that has caught up: 12 stronger, 107 weaker, the average down 17.5 points in a month. Last week the flow led the price. This week the price moved faster than the flow can, and the honest reading is that the board will show Friday’s break over the coming week, not today.
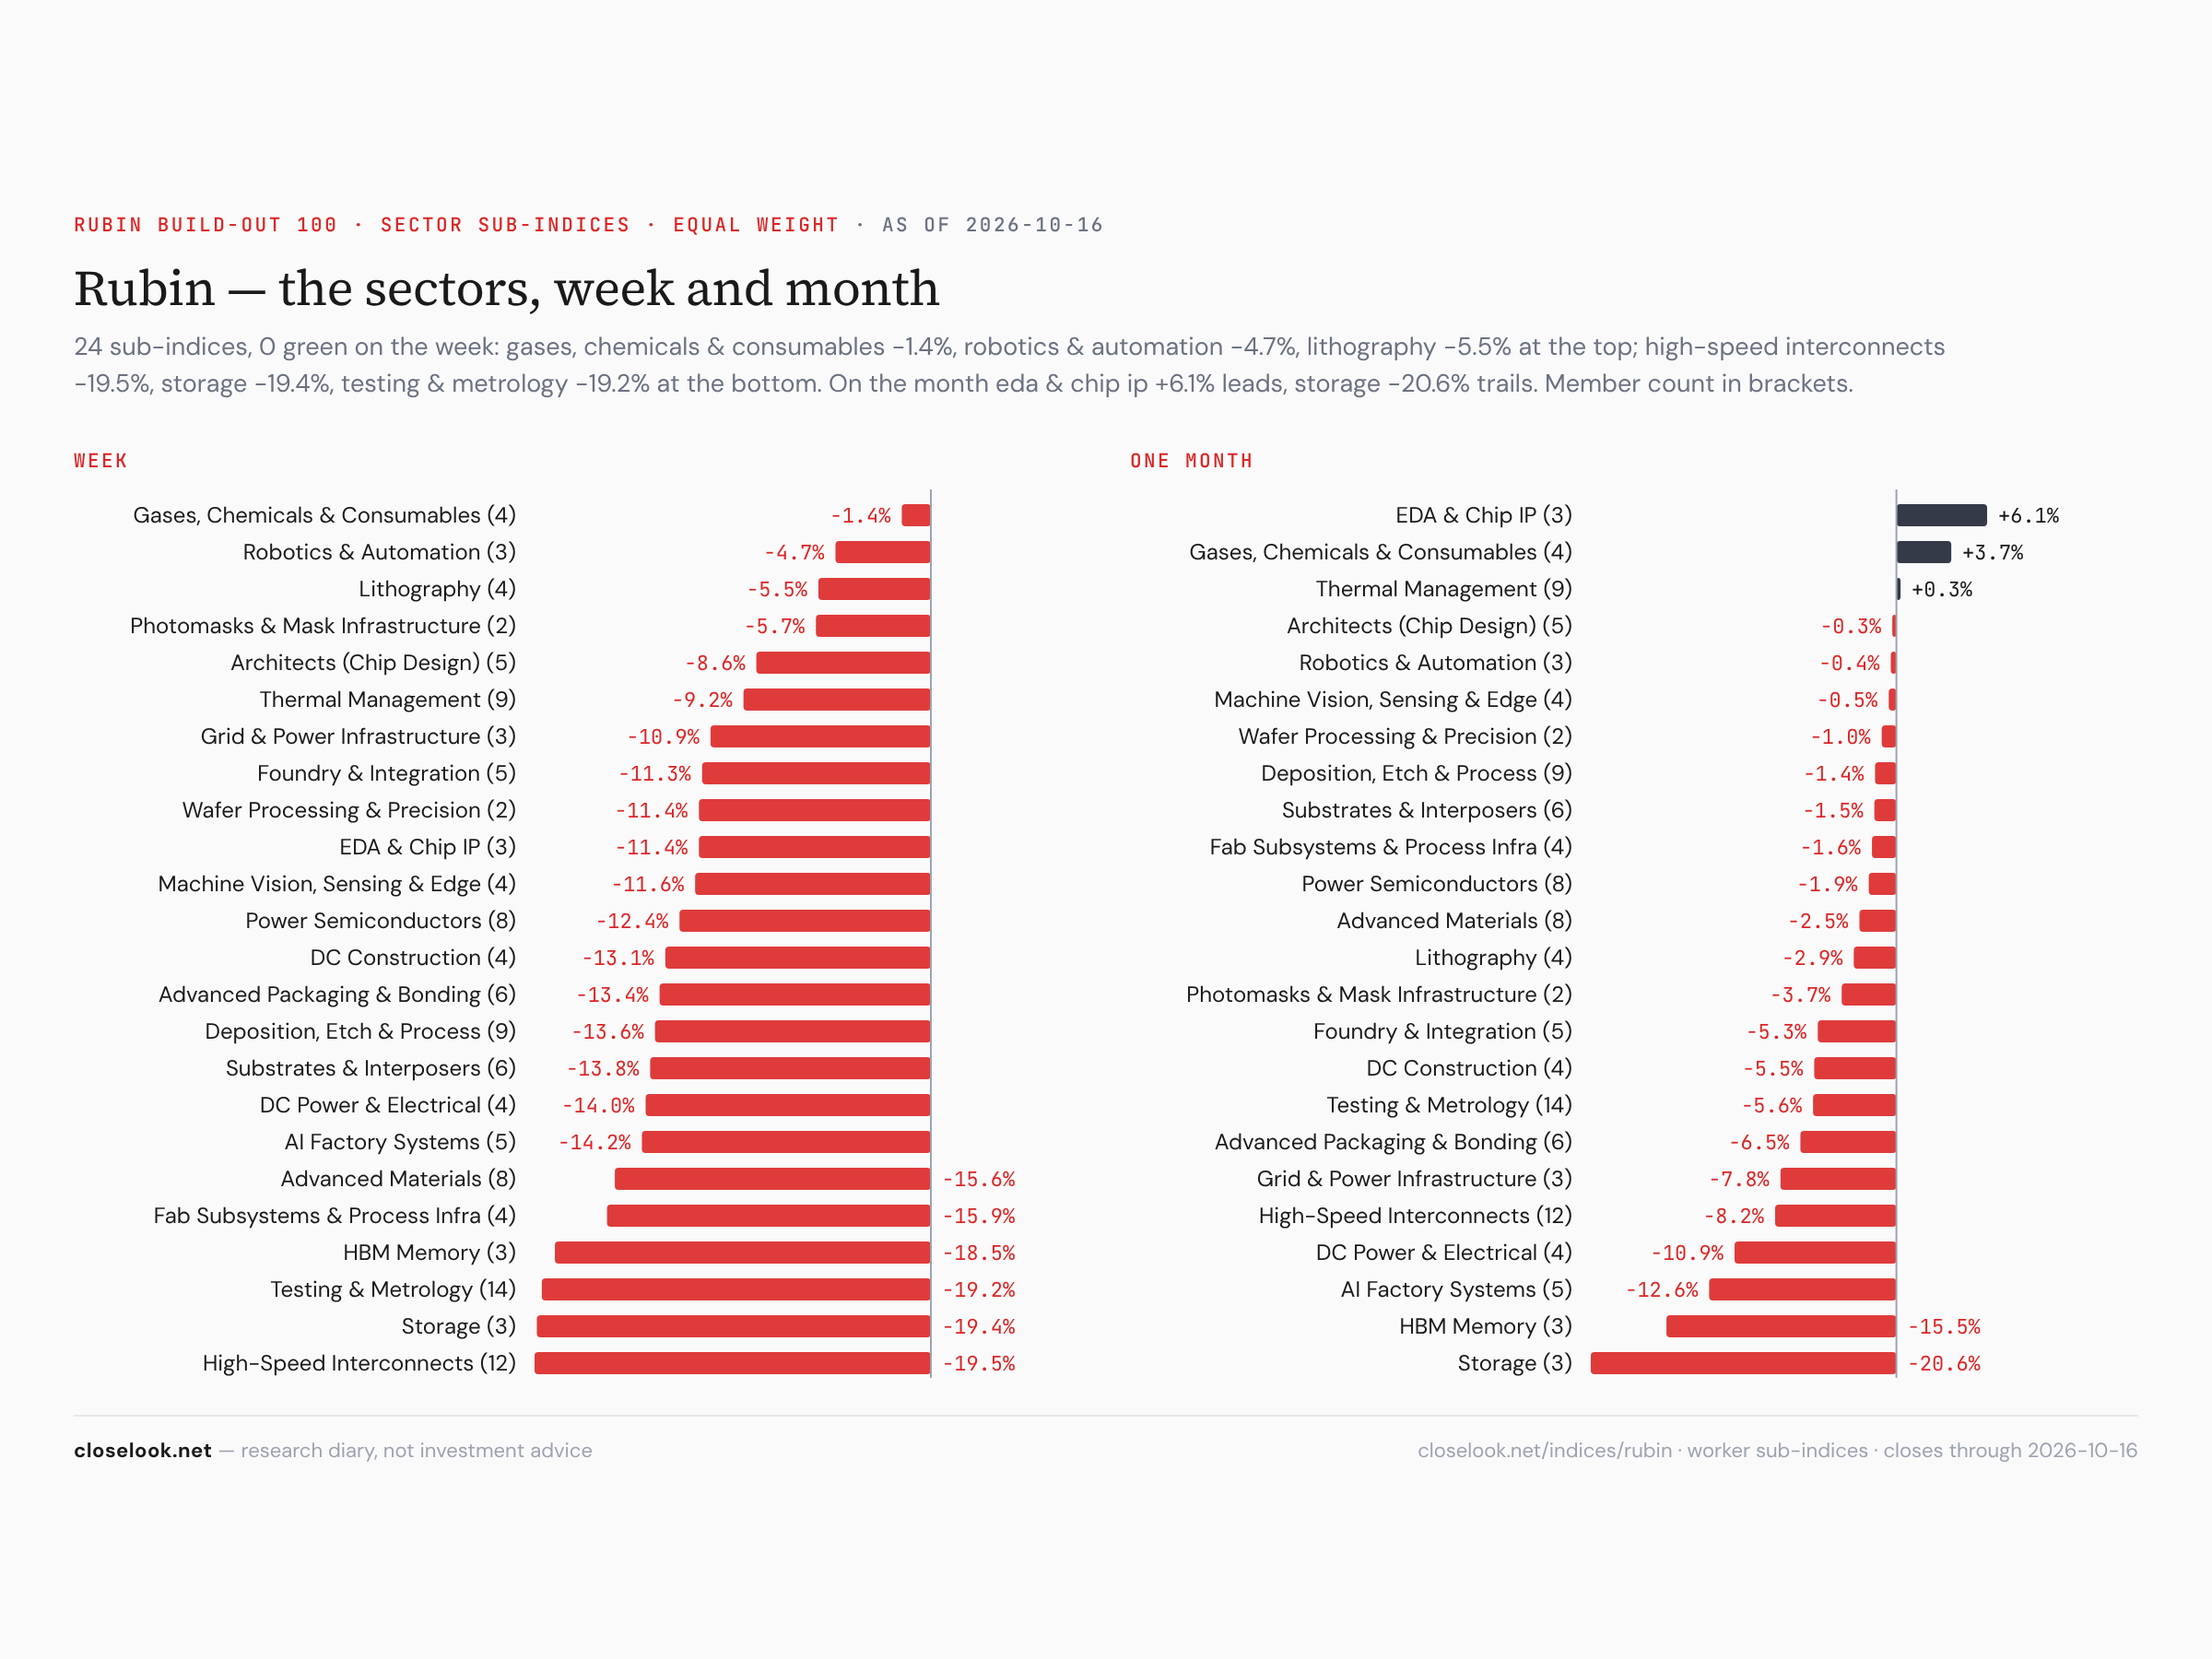
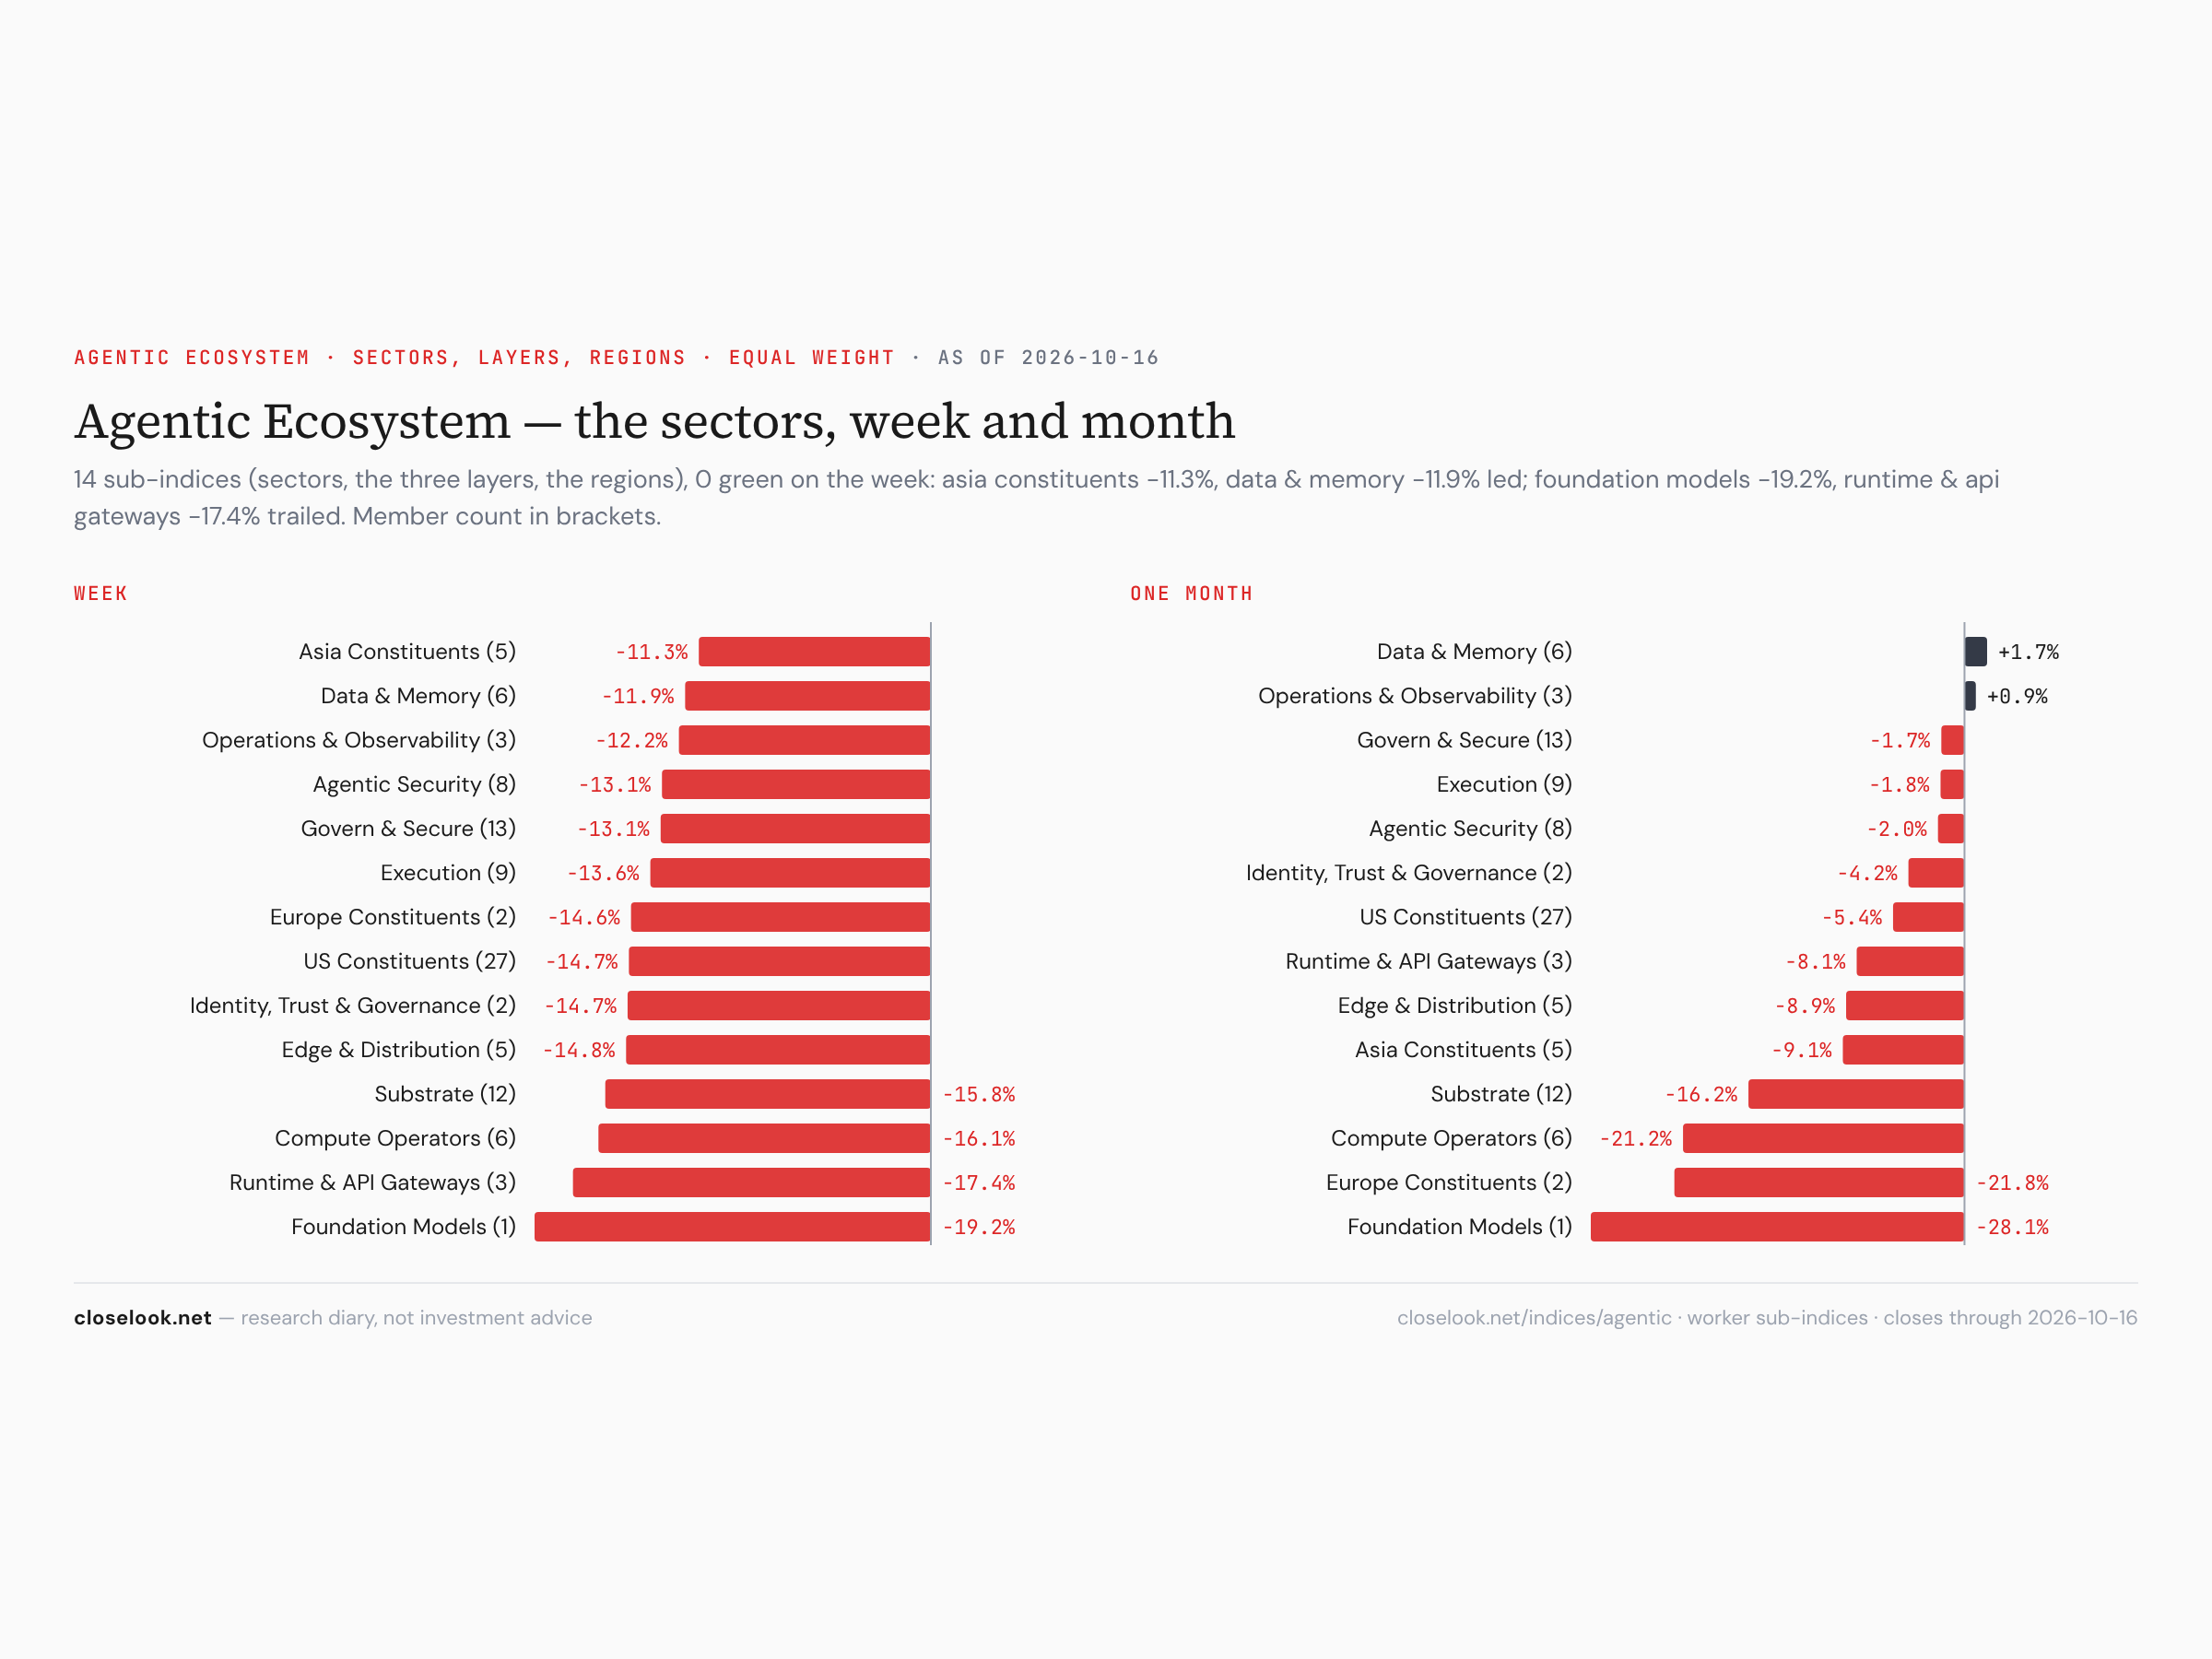
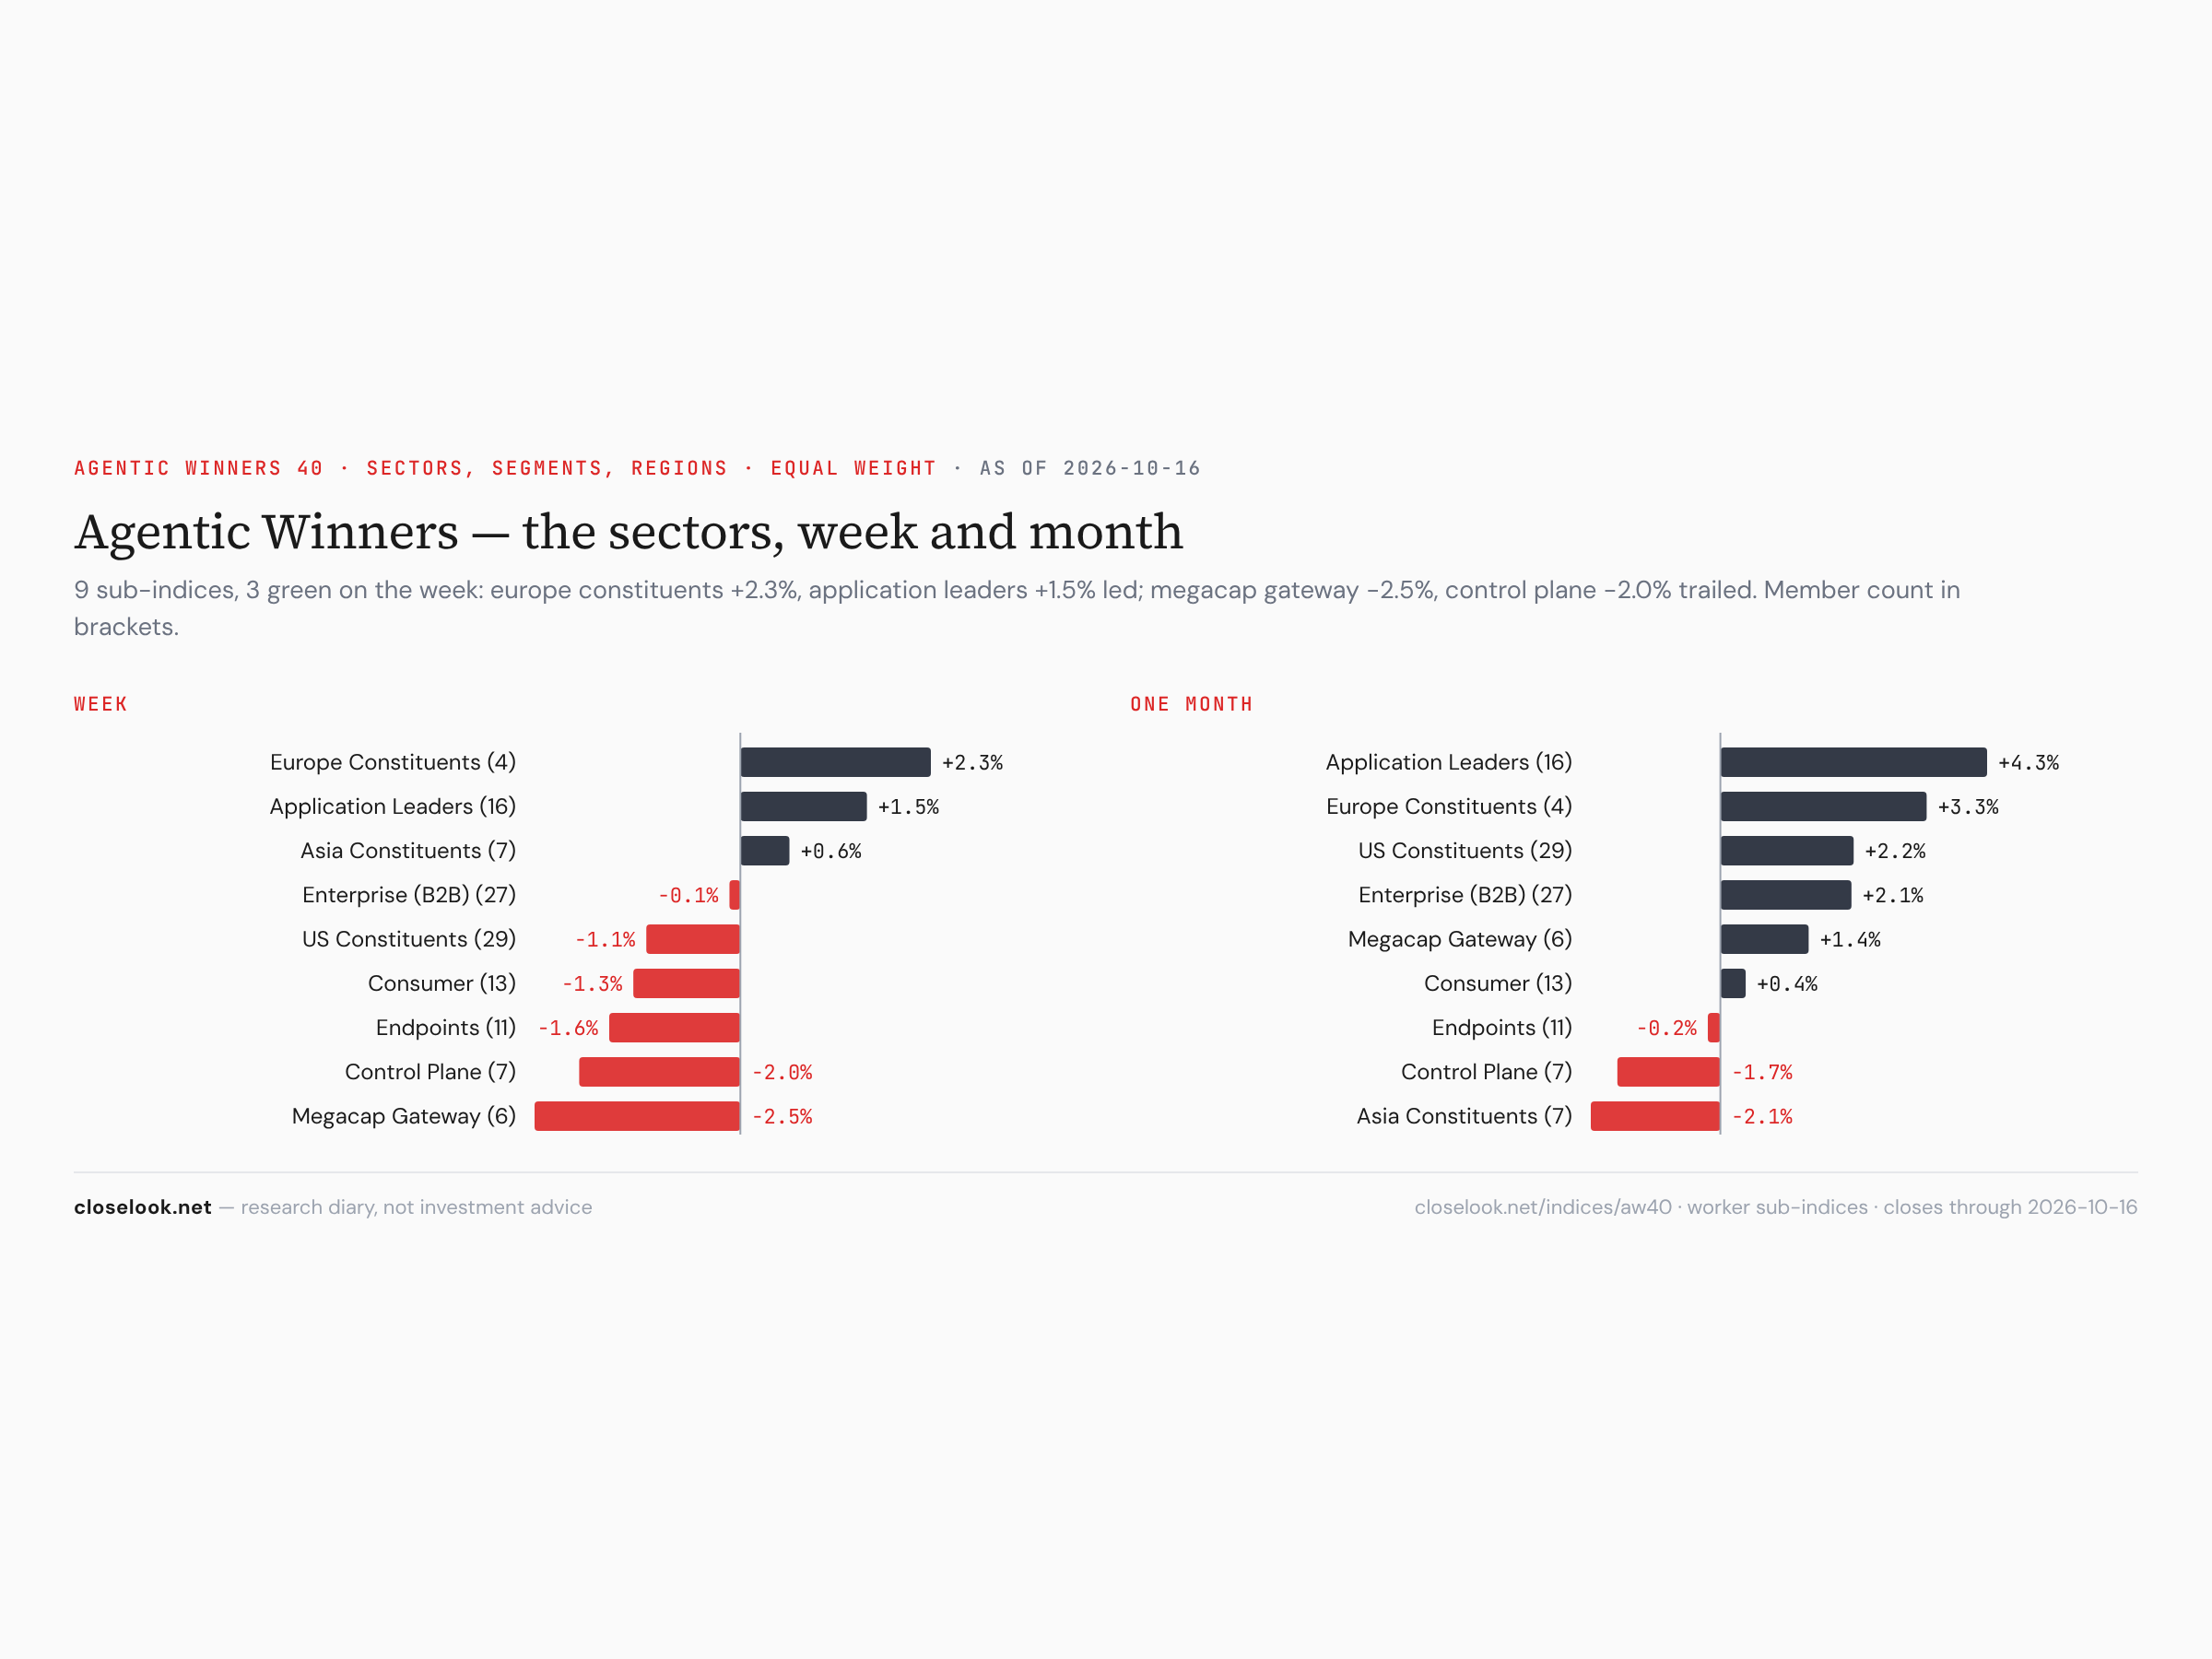
Inside each layer. In the builder, no sector rose: the best was gases, chemicals and consumables at −1.4%, the worst high-speed interconnects −19.5%, storage −19.4%, testing and metrology −19.2% — the year’s winners (storage is still +233% on the year). In the operators, foundation models −19.3%, runtime and API gateways −17.4%, compute operators −16.2%; even the best, data and memory, fell 11.9%. In the applications, application leaders +1.5% was the best sleeve; the megacap gateway — the hyperscalers and the chip leader — −2.5%, the control plane −1.9%.
The NVIDIA ecosystem book (Jensen) fell 14.0% on the week, 5.6% on Friday.
3 · The Three Functional Indices — index, sectors, stocks
We read the three together because they are three stages of one spend: capex (what gets built), opex (what it costs to run), applications (what gets sold on top). HALO, the growth index with no AI thesis, is the control.
Rubin Build-Out — capex
−13.45% to 1,813.50, −1.8% on Friday; 26.8% under the June 22 high, +76.4% on the year. Five of 130 members up, the median member −14.36%. It was a steady week of selling, not one crash: Korea’s memory scare on Tuesday, hot inflation on Wednesday, TSMC on Thursday, and the whole complex on Friday. ASML’s record quarter on Wednesday — with demand, it said, outrunning supply in 2027 and 2028 — and TSMC’s record quarter with a 66.4% gross margin on Thursday did not stop it. Both were strong; both were sold. The question the market is asking is not this year’s numbers but how long the spending lasts.
Agentic Ecosystem — opex
−14.16% to 1,533.41, −5.8% on Friday; a record on 9 October, and every point of the 14.2% from that record came this week. +55.4% on the year. Not one of 34 members rose; the median −14.06%. DigitalOcean −26.8%, CoreWeave −25.2%, Nebius −25.2%, Fastly −23.3%, IREN −23.3%. The companies that rent out computing power and sell access to models — the part of the stack that borrows most to grow — fell hardest. The best of the week fell too: Teradata −0.8%, Dynatrace −3.8%, Equinix −3.9%.
Agentic Winners 40 — applications
−0.50% to 937.97, −2.0% on Friday; −4.2% on the year, 7.0% under its January high. Twenty of 40 members up, the median +0.25%. Up to Thursday the group was doing what it did last week — gaining while the builders fell. Friday took the week away. The losers were the names that had carried it: Palantir −11.0% on the week, Oracle −9.3%, Tempus AI −8.8%, Nvidia −6.6% (the index holds it as the gateway to the stack). The winners were the cheap software platforms: CoStar, Intuit, freee, Kingdee, Appier.
The control group. HALO slipped 0.49% with 58 of 100 members up. §5 has the detail.
4 · The Stack, Instrument by Instrument
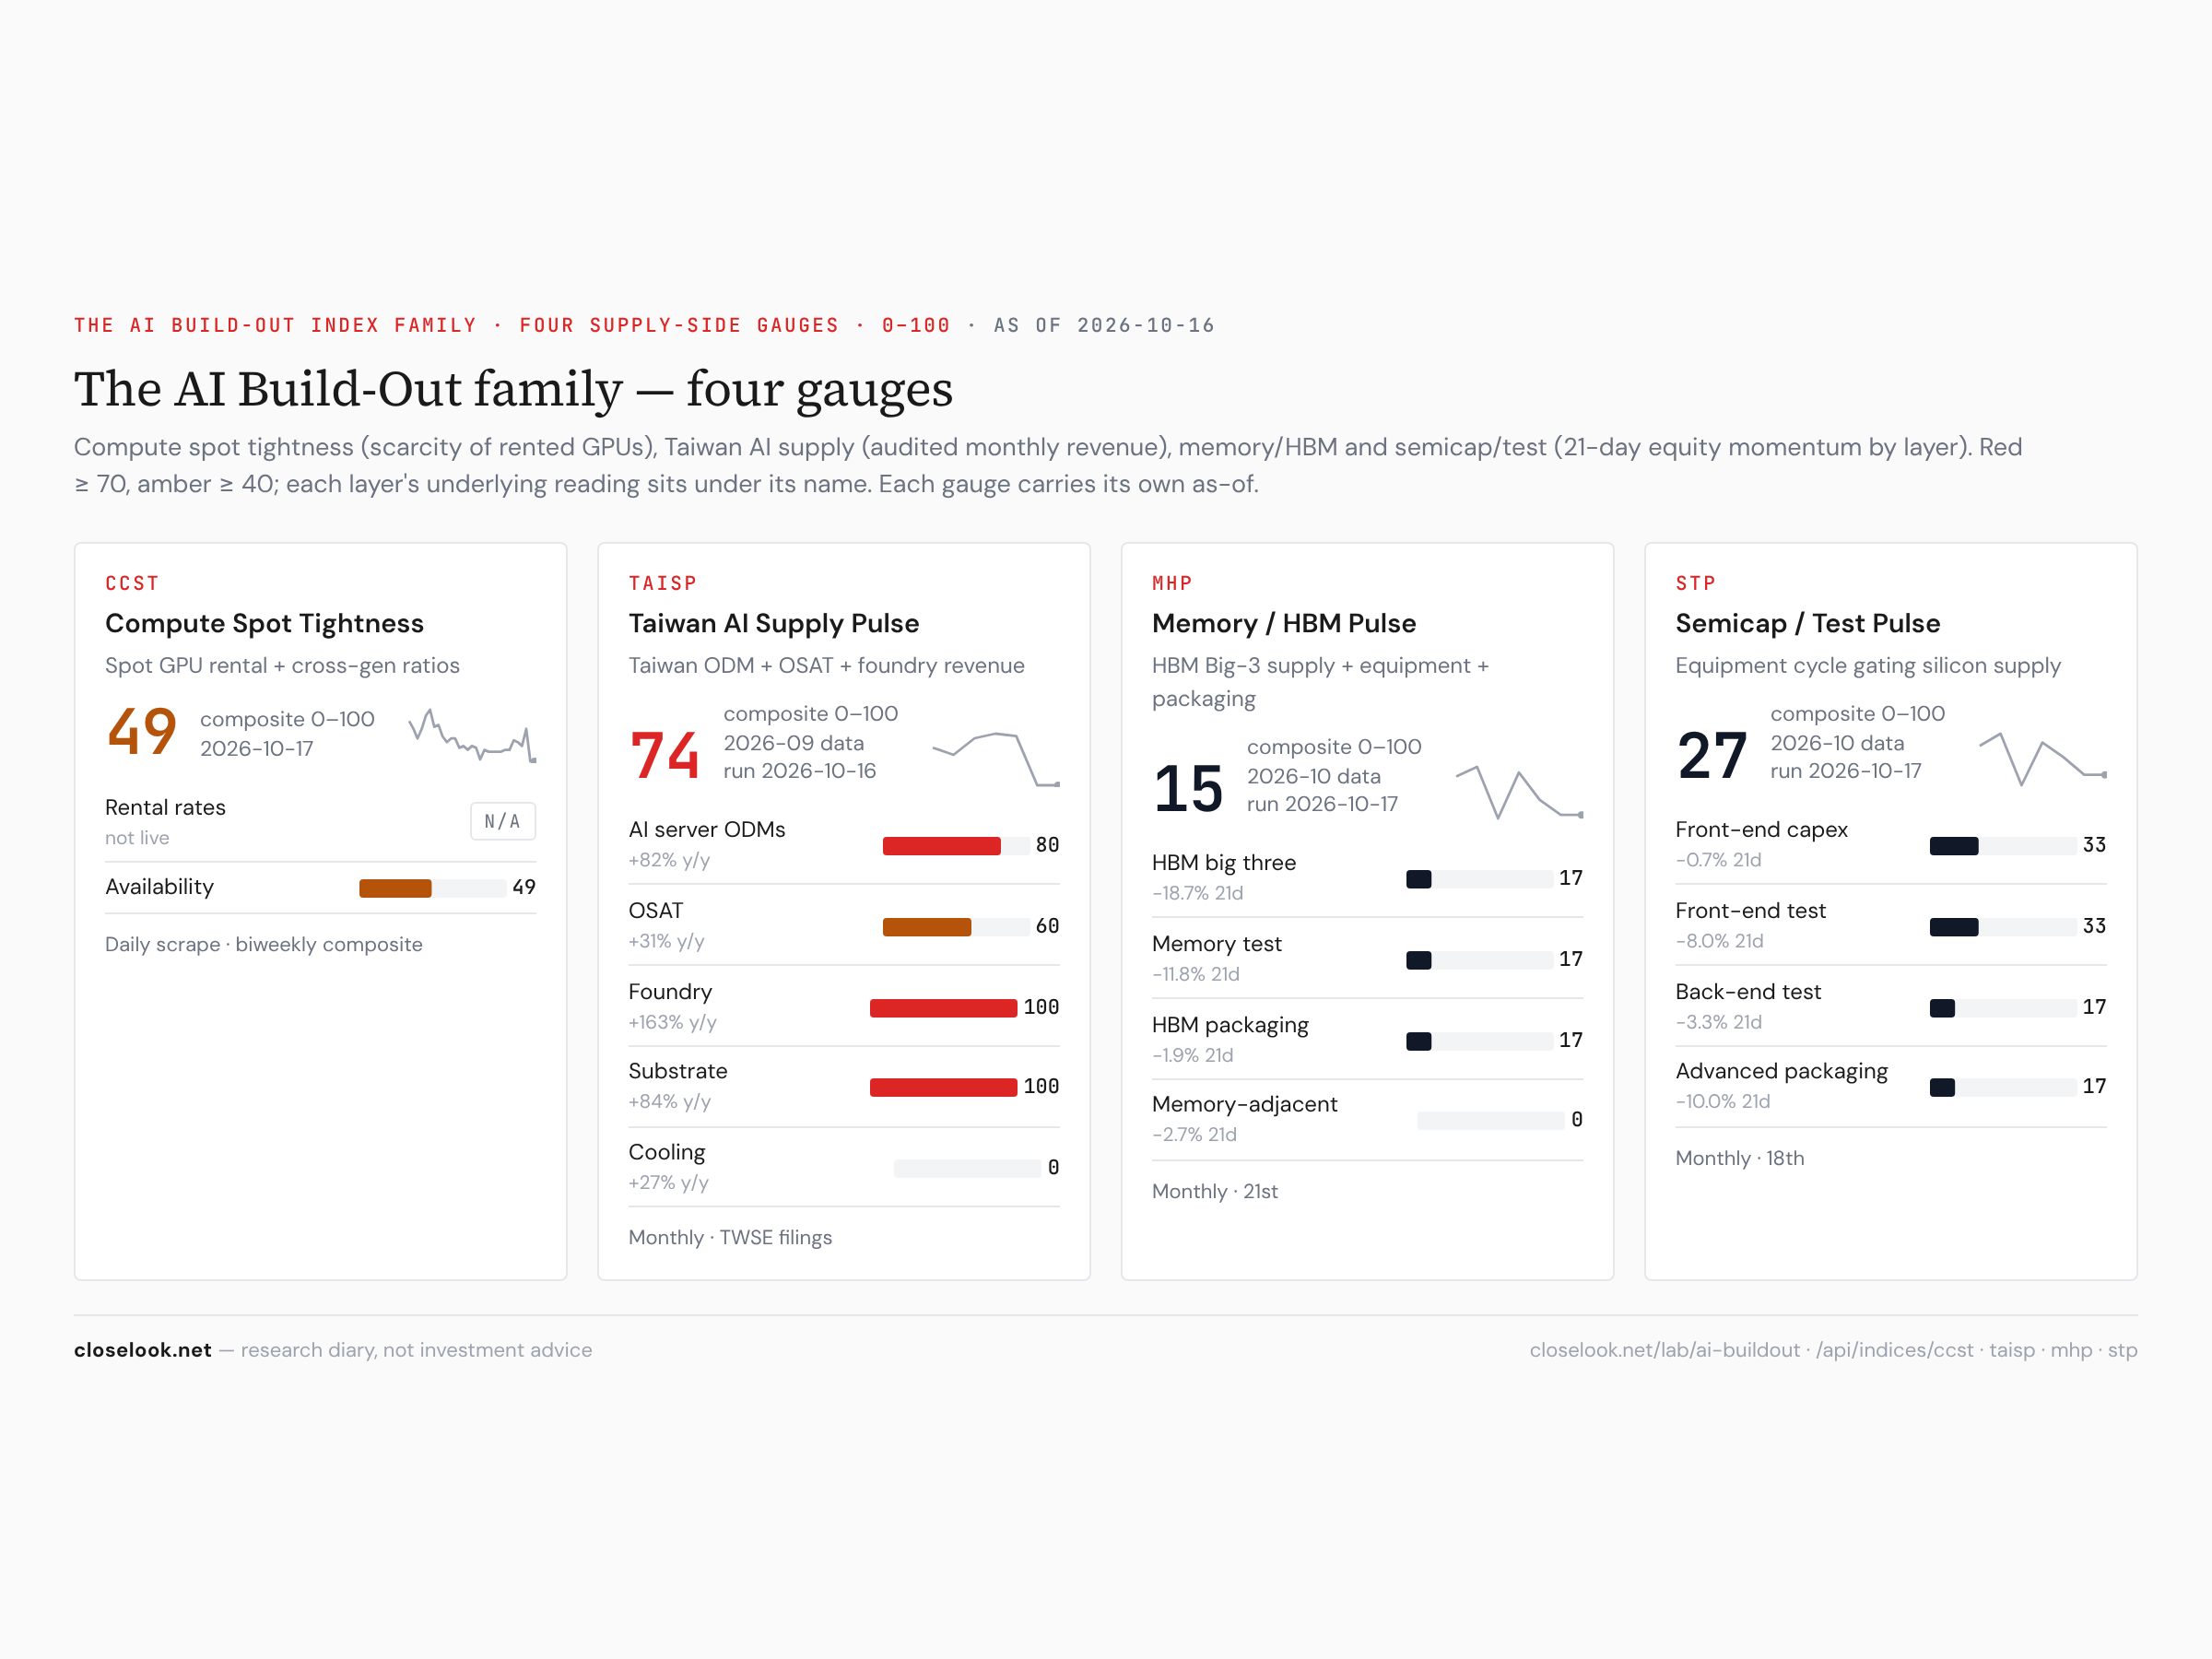
The supply gauges — cooling hard. The four supply-side gauges of the AI Build-Out family: the Taiwan AI Supply Pulse at 74 (95 a week ago), compute spot tightness 49 (54), the Semicap / Test Pulse 27 (67), the Memory / HBM Pulse 15 (32). The equipment and memory gauges read 21-day stock momentum, so they follow the price — but the speed of the fall is the point: the memory gauge has gone from 55 to 15 in two weeks.
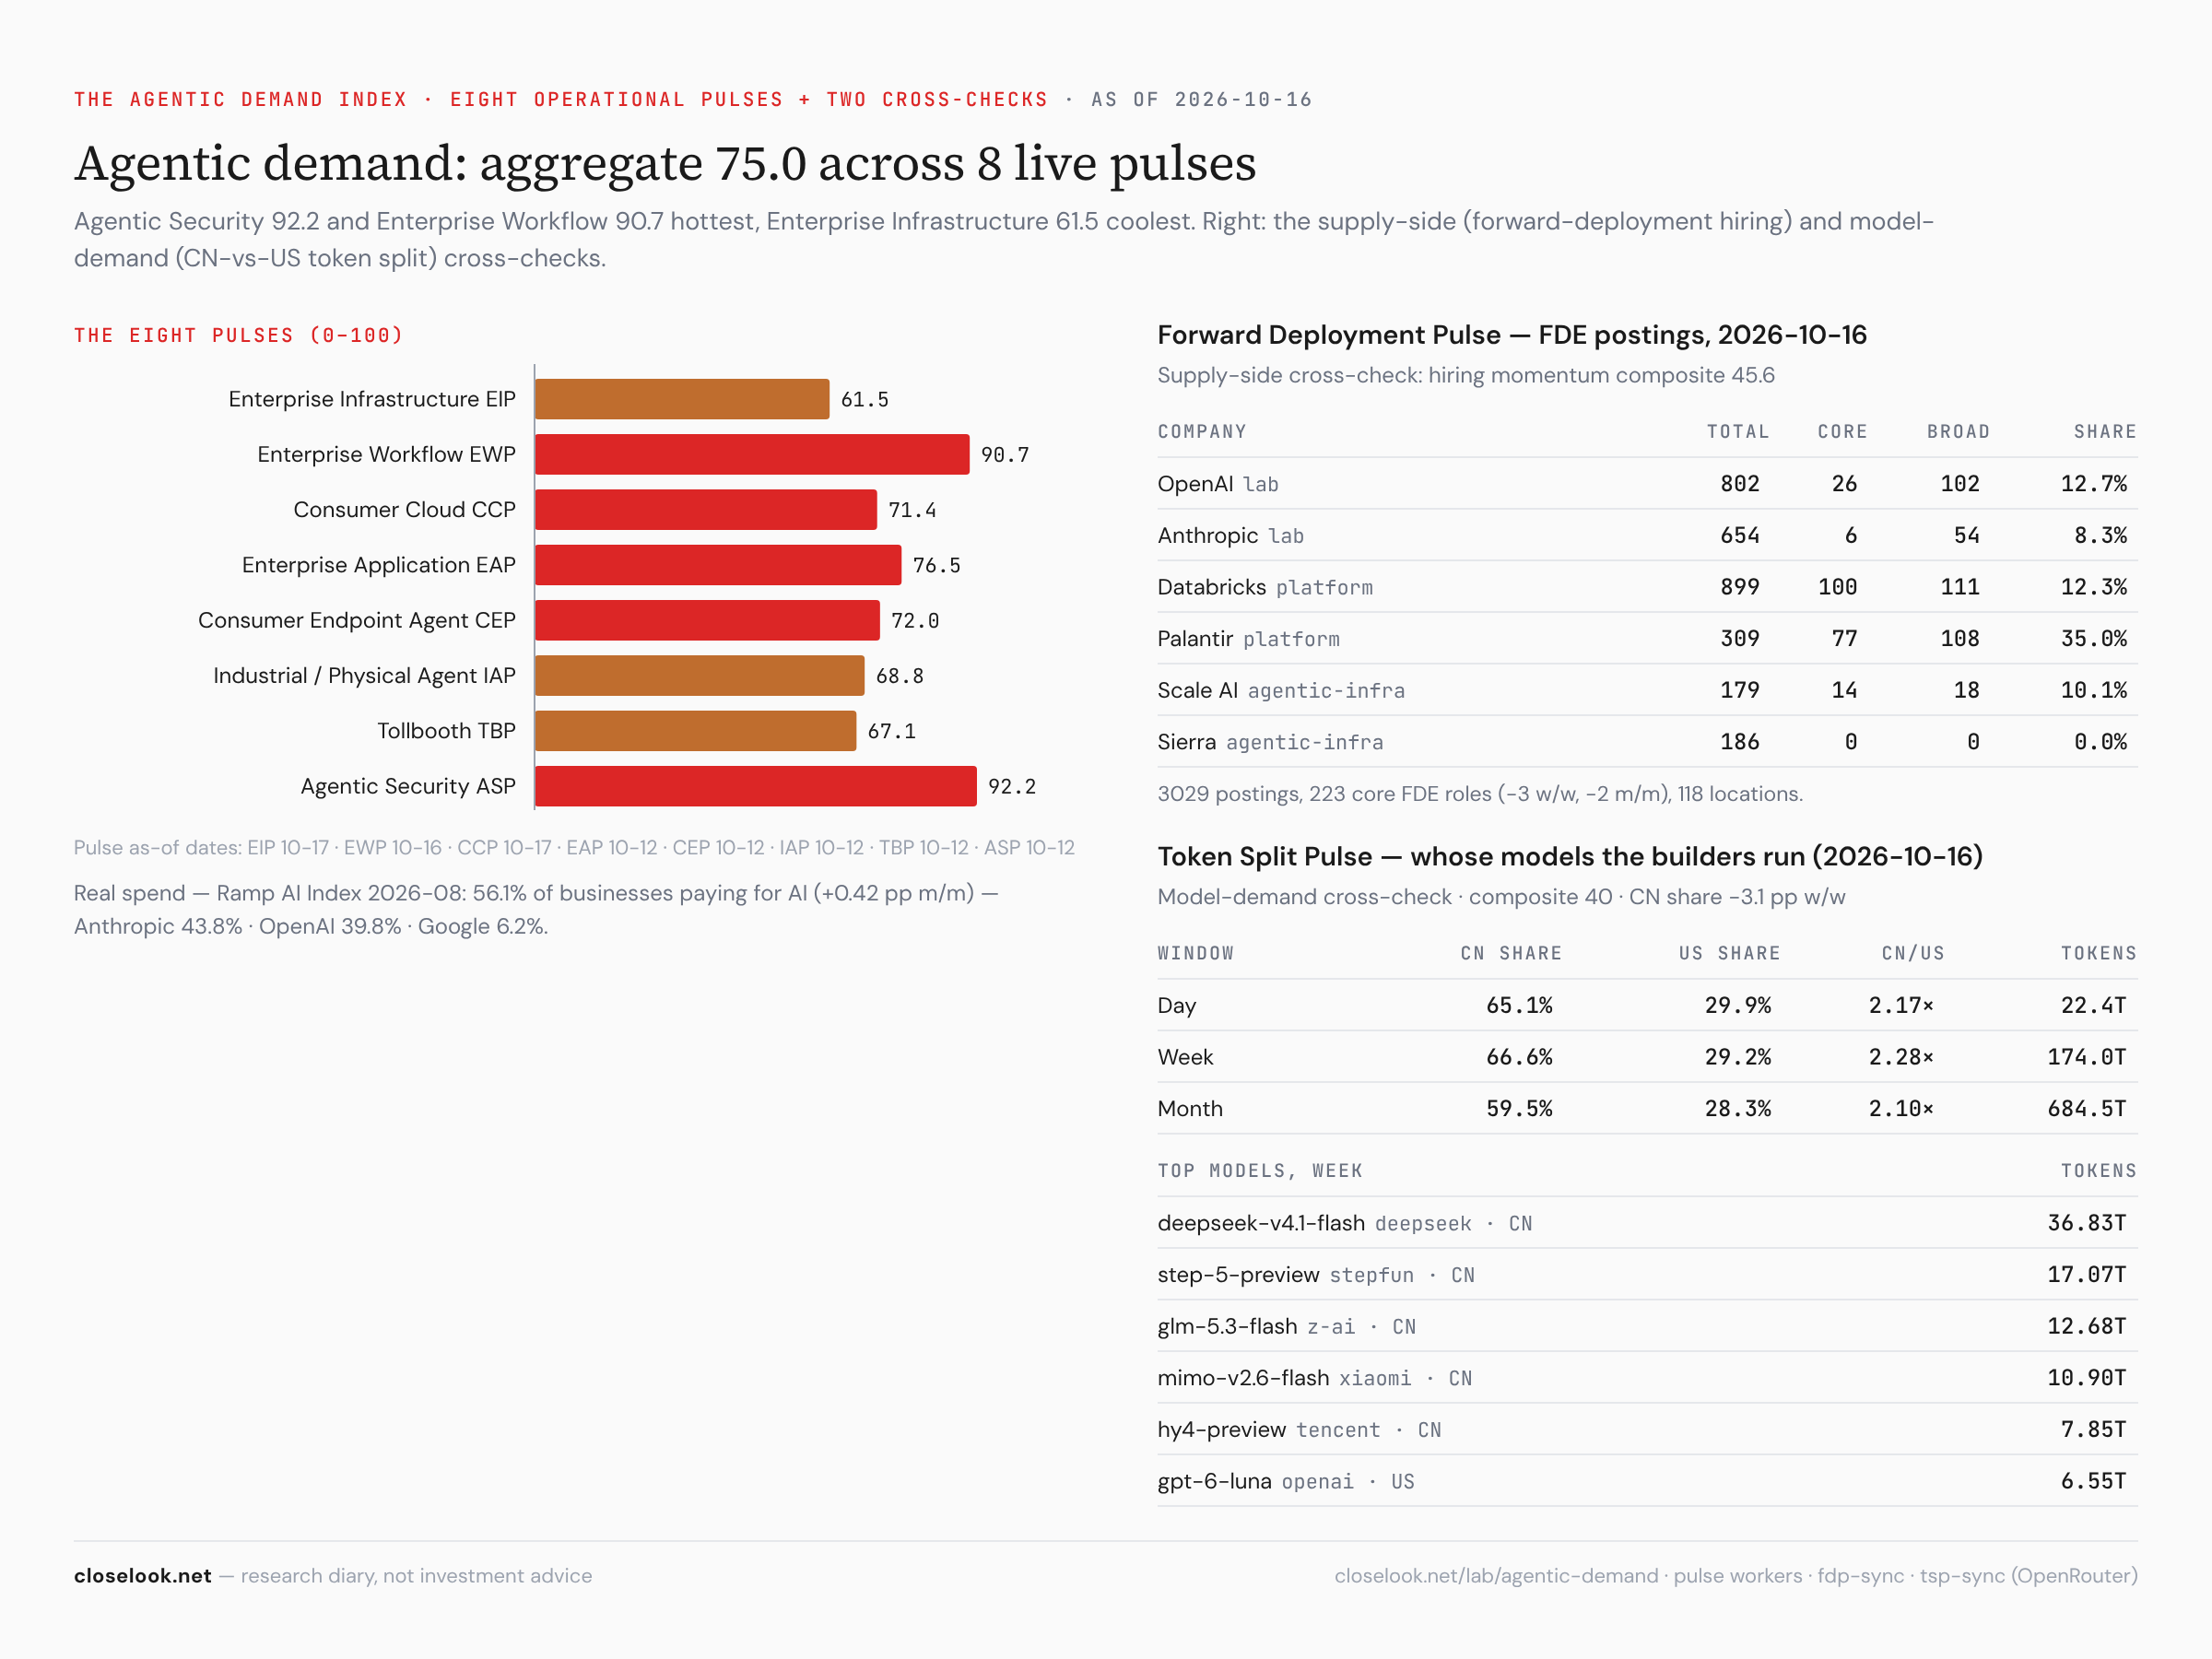
The demand gauges — holding. The house Agentic Demand index reads what companies say about AI demand on their calls and in their usage. It reads 75.0 across eight live pulses — agentic security 92.2, enterprise workflow 90.7, enterprise infrastructure the coolest at 61.5. This is the test for the fear that ran through the week — that the build-out is a repeat of the fibre glut of 2000, with capacity built far ahead of use. In 2000 the use never came. Today the demand side reads above the supply side, and the week’s news supported it: Anthropic’s numbers, reported from its pre-IPO meetings, put third-quarter revenue near 16.8 billion dollars and 1.70 dollars of revenue for every dollar of computing (FT). A gap would look like the demand index falling under 70 while the build-out held. This week it was the other way round.
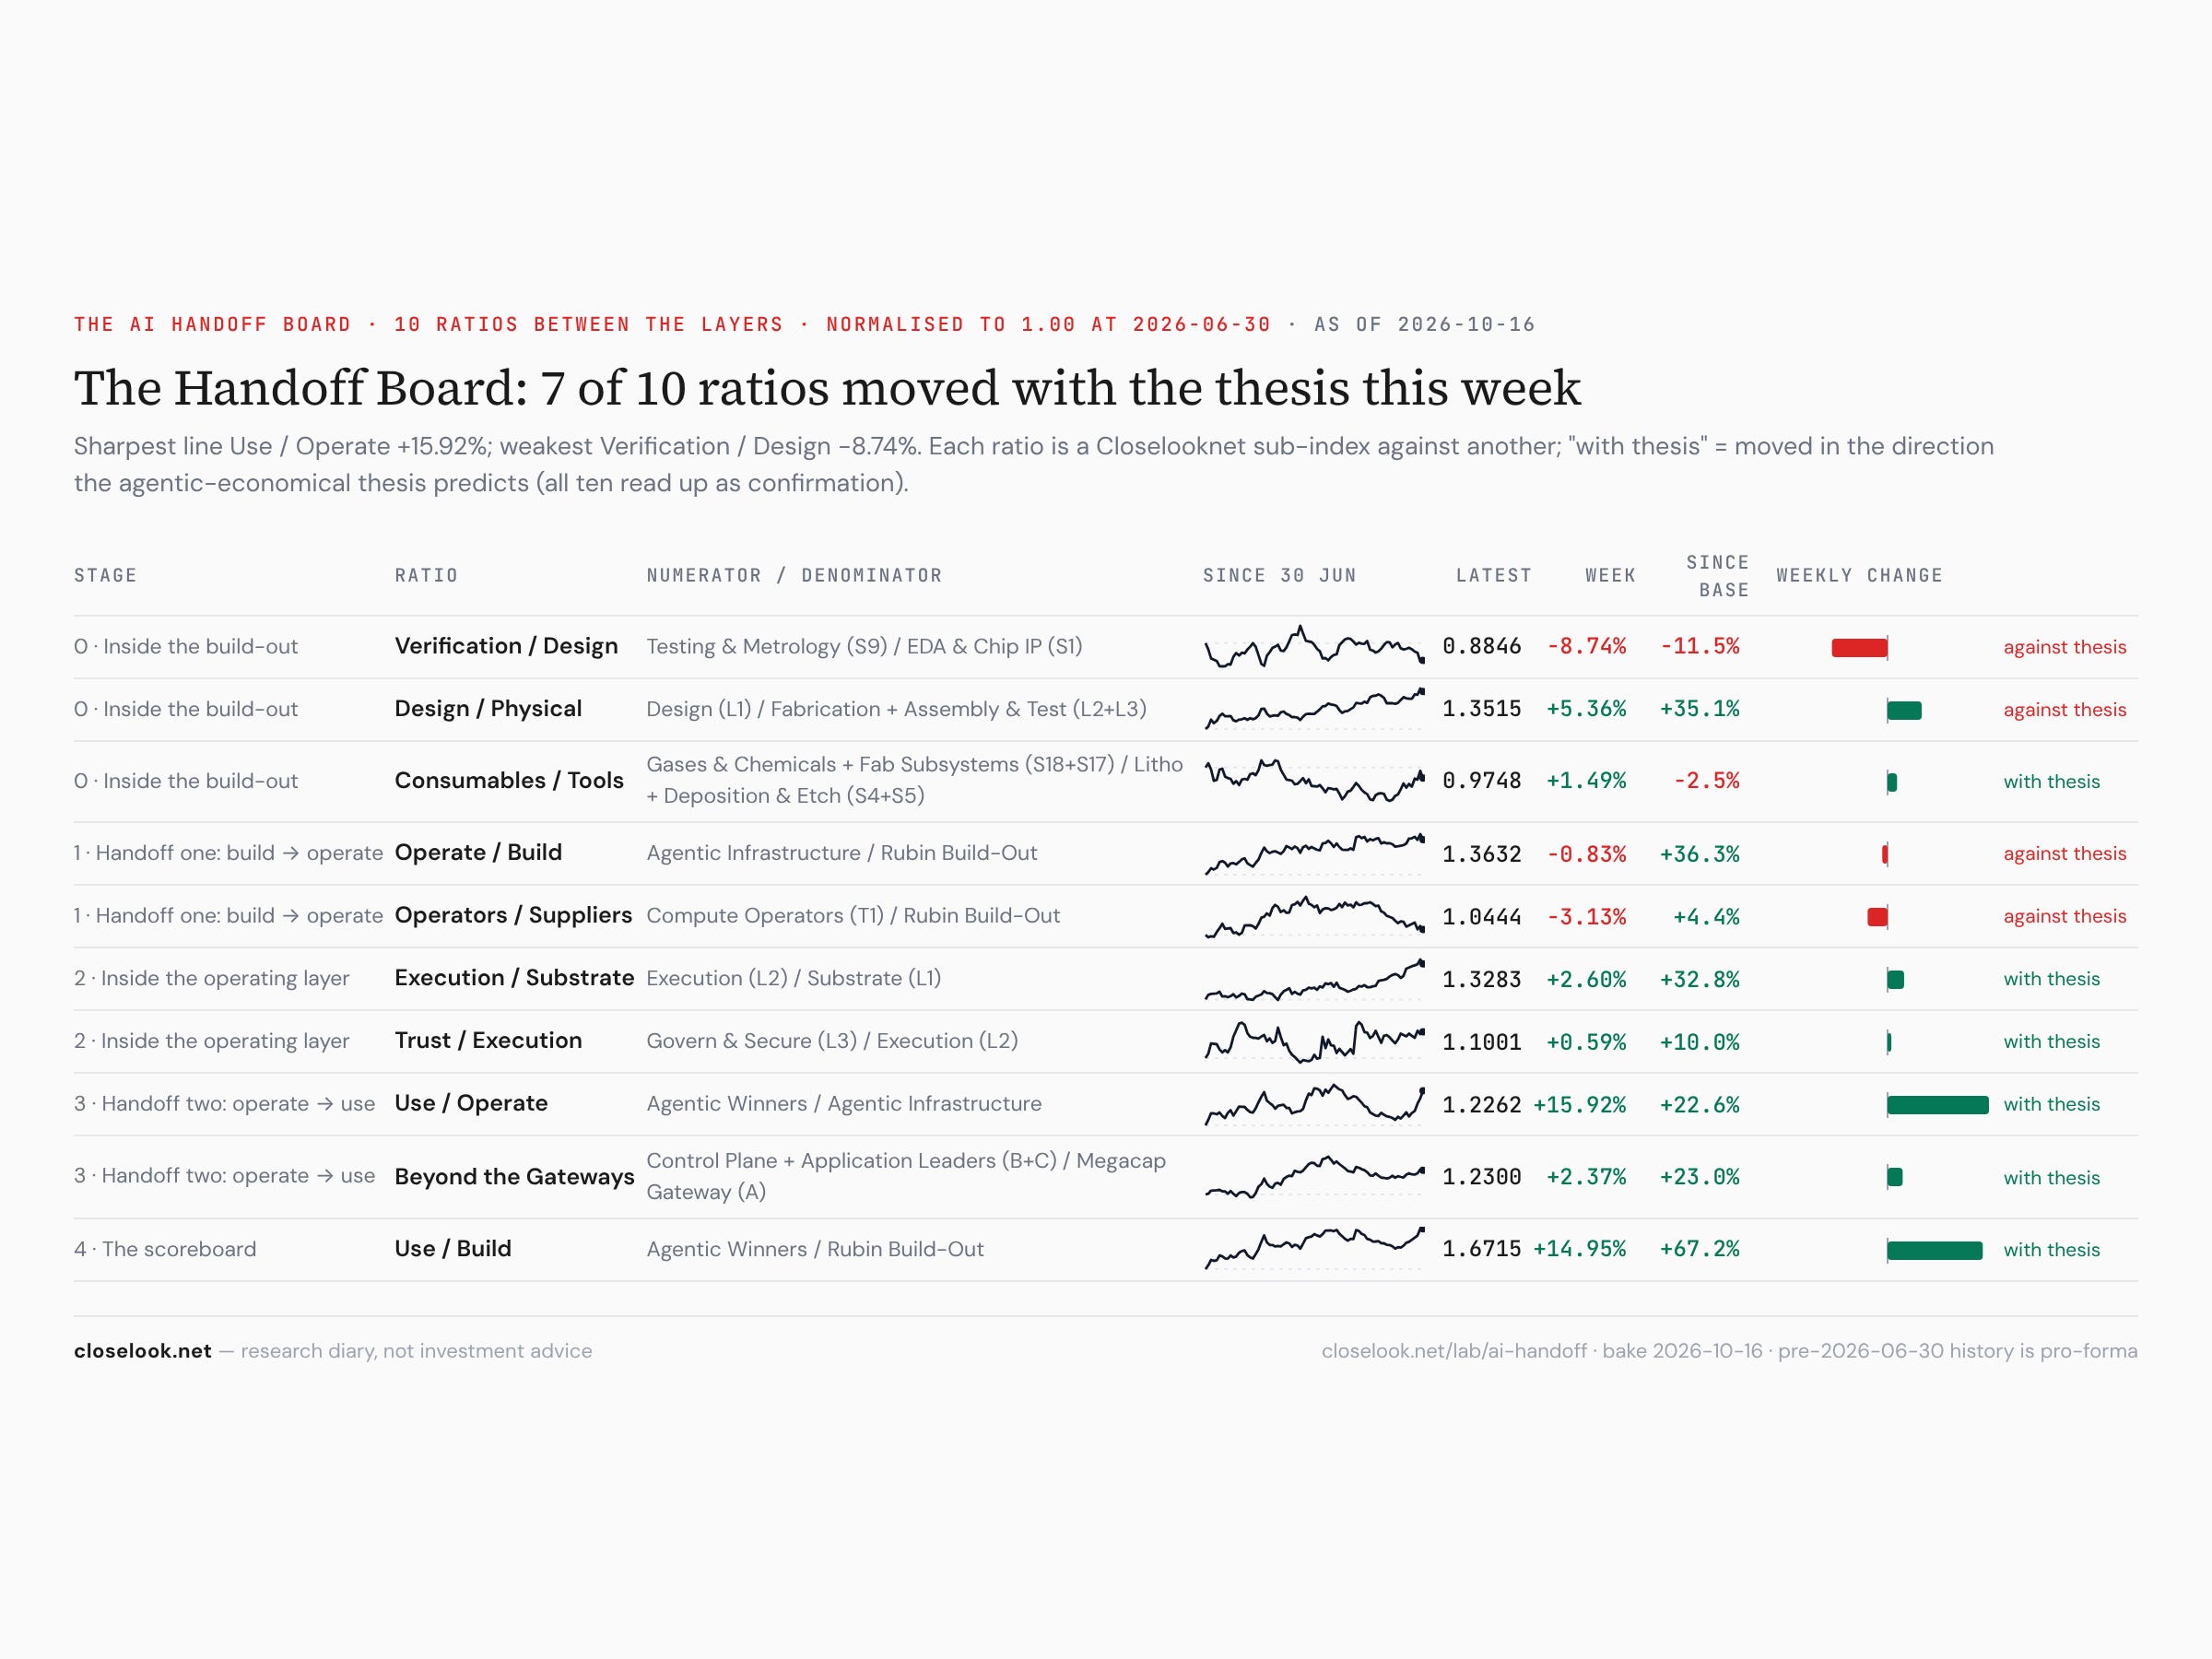
The handoff — up the stack, by falling less. The house AI Handoff Board tracks money moving from one layer to the next. Use over build +15.0%, use over operate +15.9%, design over physical +5.4% — the applications fell far less than the builders and the operators. Verification over design −8.7%: the test-tool makers fell hardest of all.
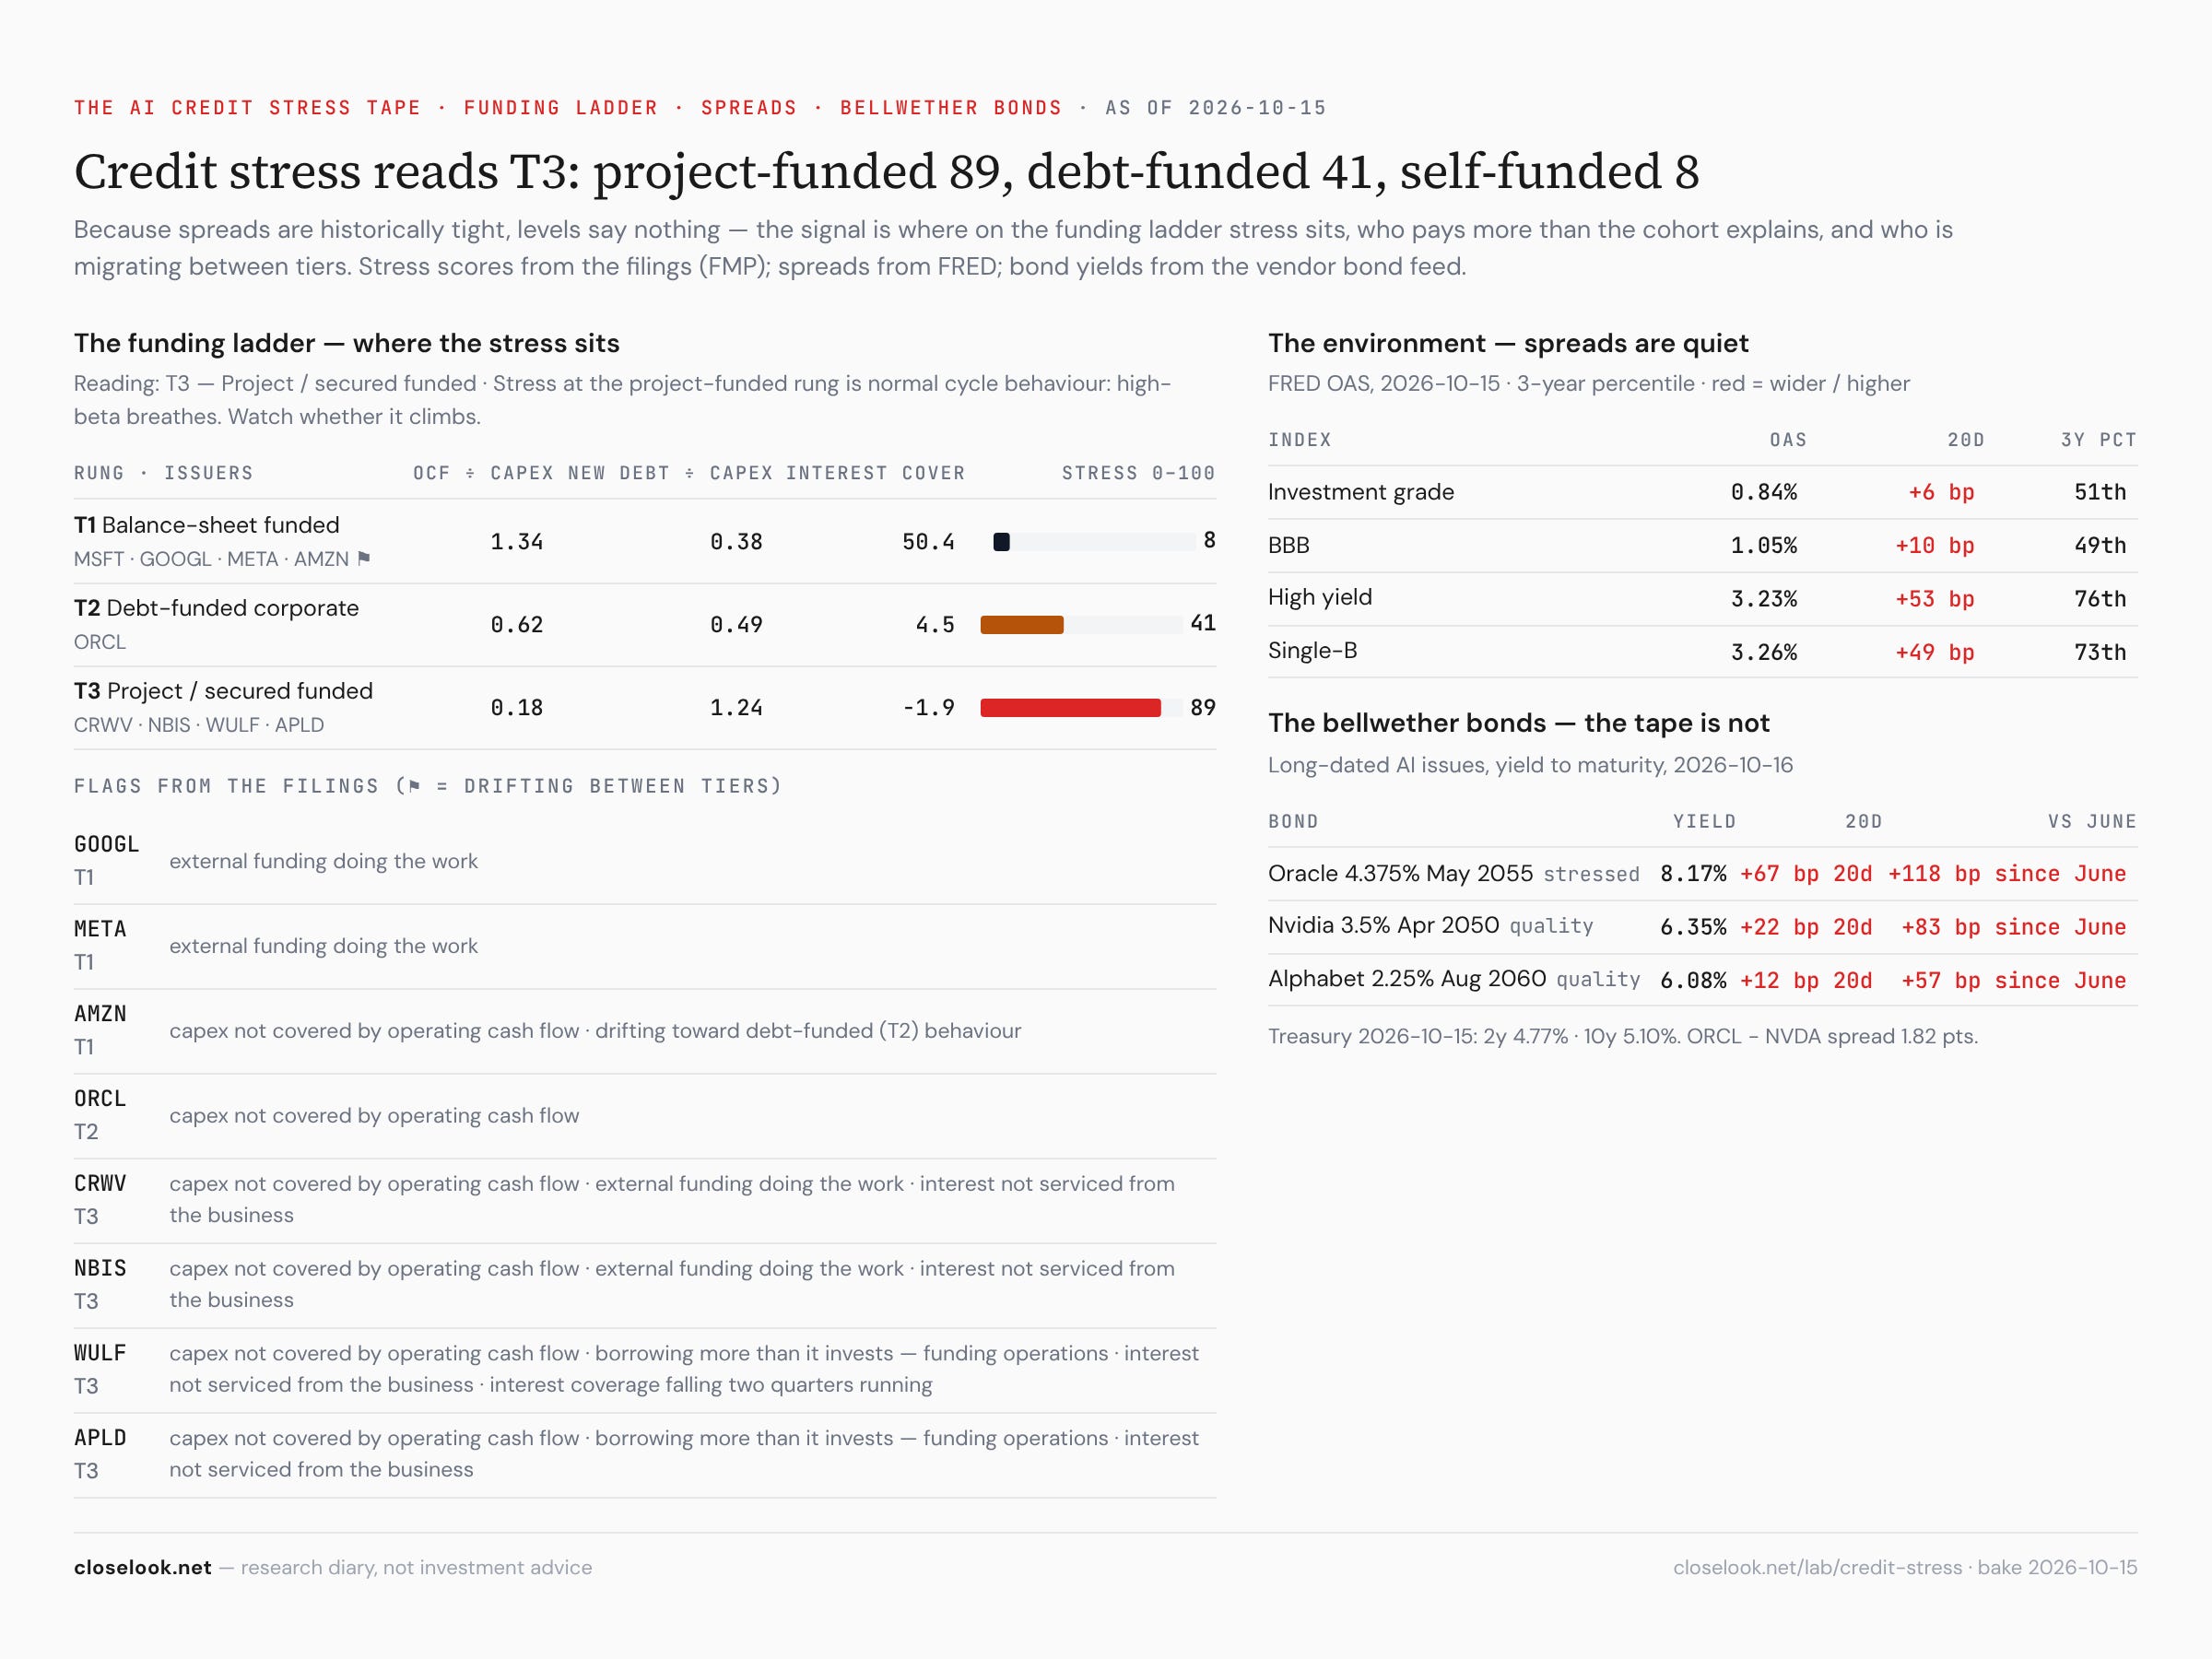
The credit tape — the borrowers pay more. The house AI Credit Stress tape reads stress at the project-funded rung — CoreWeave, Nebius, the data-centre builders — at 89 of 100, against 41 for debt-funded Oracle and 8 for the cash-funded hyperscalers. Oracle’s 2055 bond yields 8.17%, 67 basis points more than twenty days ago; high-yield spreads widened 53 basis points in the same time. The stocks that fell 25% this week are the ones whose funding costs are rising.