


This week’s edition of Closelook@US Stock Markets, dated July 12, 2026.

Last week we drew two lines and said the market would have to choose: SOXX at 554 and NVIDIA at 191. This week it chose — twice. Tuesday broke the first line and looked like the start of a correction. By Thursday the break had reversed, extended, and been paid for with the largest foreign US listing on record. And underneath the round trip sits the real story: where the buying went. Not to the architect — down the stack, to the layers that had not yet repriced. Which happens to be exactly where the AI dollar itself is headed. That is this week’s letter.
1 · This Week’s Action Free
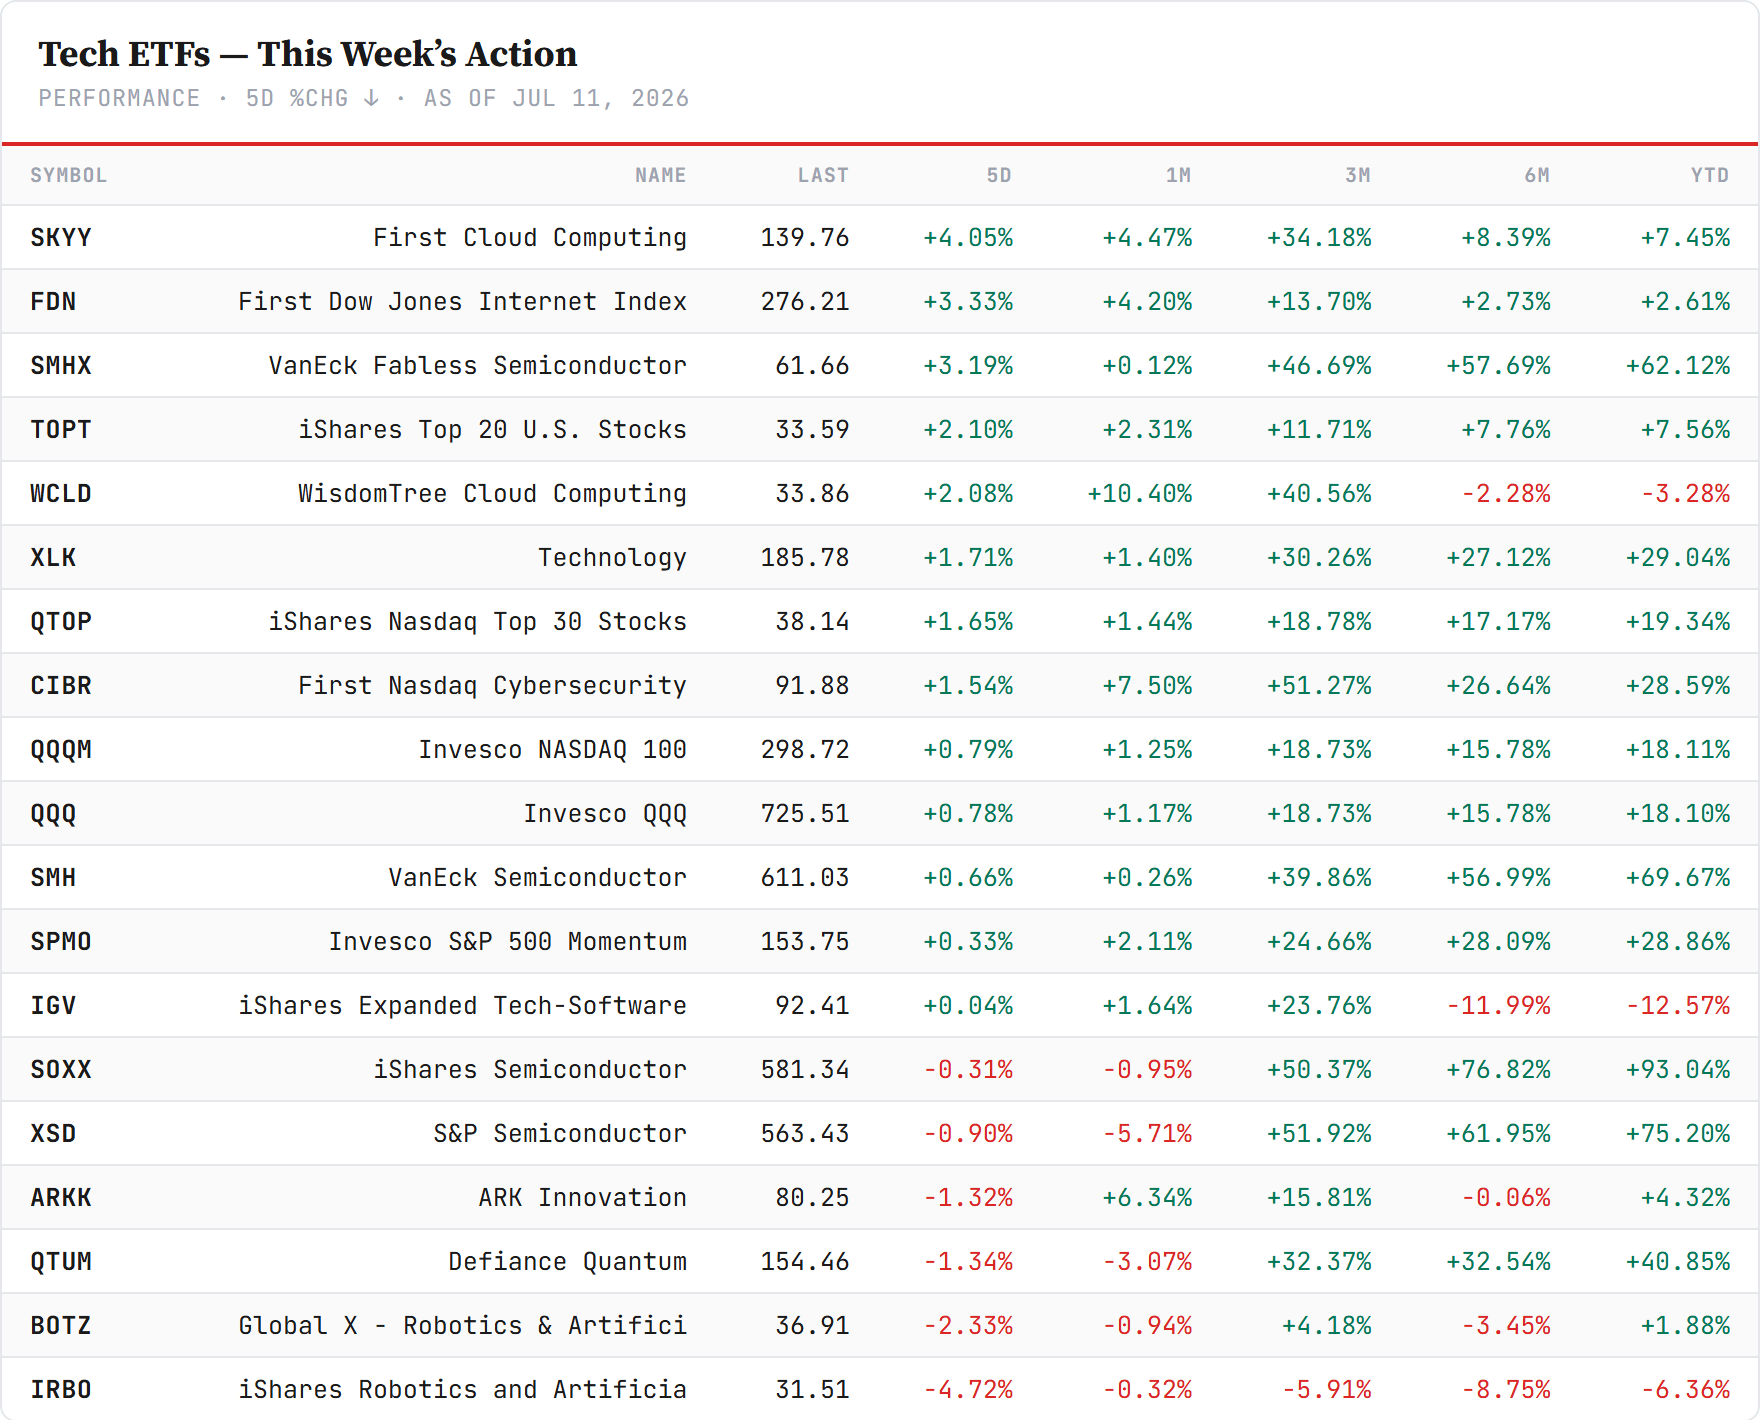
The tape, day by day. Monday was setup. Tuesday was the software day — SOXX broke 554 and our build-out index had its worst session of the series (−5.6%). Wednesday reversed it: SOXX reclaimed the line at 562, NVIDIA rose 3.7% back above 200, Broadcom added 4.8% on the ~$30B Apple deal. Thursday extended: SOXX +3.5% to 581.7 — the second close above 554 — Micron +4.5% to a $1.12 trillion market cap, software green on a semi day for the first all-green session of the four indices since Monday. Friday resolved the week in character: the memory complex took profits into the SK Hynix debut, while the architect had its comeback — NVIDIA +4.0% to 210.96, back above its 50-day, and SOXX closed at 581.3, flat on the day and twenty-seven points above the line it broke on Tuesday. The week’s net: SOXX −0.3%. The round trip was violent; the destination was where it started. That is what a shakeout looks like on a weekly print.
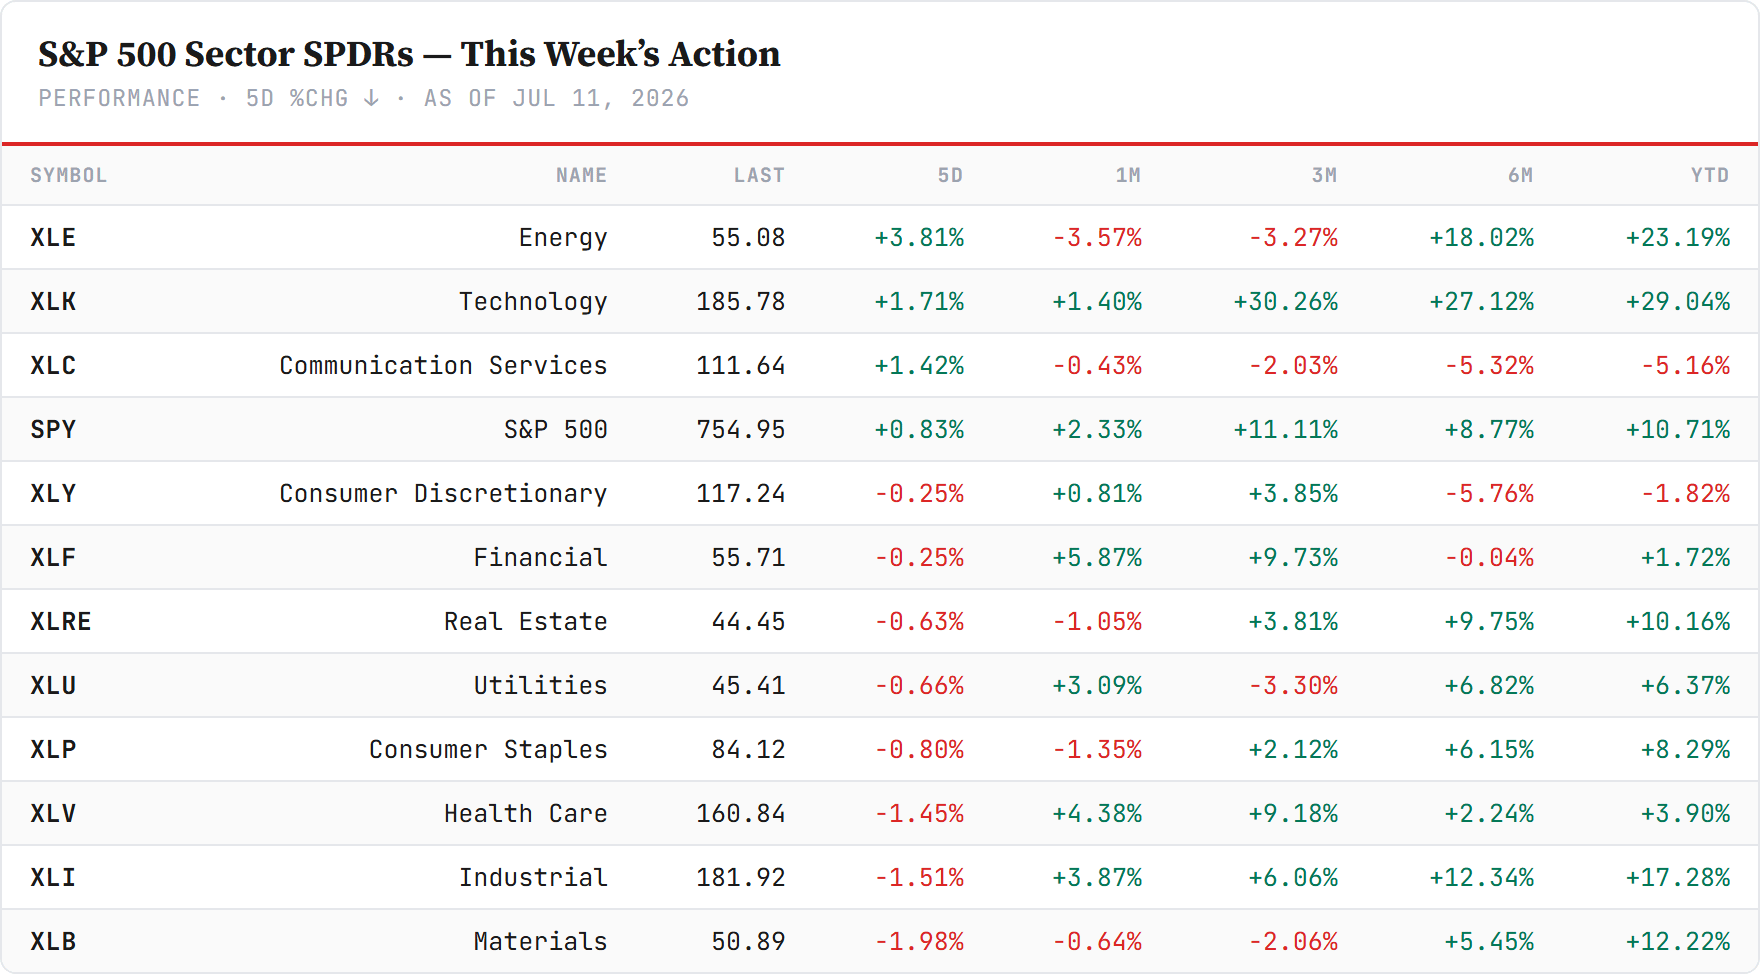
The sector read. Energy led the week (+3.8%) as oil caught a real bid — the “oil isn’t buying the war” read of recent weeks weakened this week. Tech (+1.7%) and communications (+1.4%) carried the rest; every other sector closed red, with materials (−2.0%) and industrials (−1.5%) at the bottom. Narrow, commodity-accented risk-on.
The macro frame. The FOMC minutes put rate hikes back on the distribution as a contingency — the hawkish tail is alive, the 10-year sits near 4.5%, and the long end sold off again into the weekend. Gold eased but held the 4,000 belief line; bitcoin continued its repair (+4% on the week). The rates question is not resolved; it simply was not this week’s headline. Tuesday it becomes the headline.
2 · The State Free
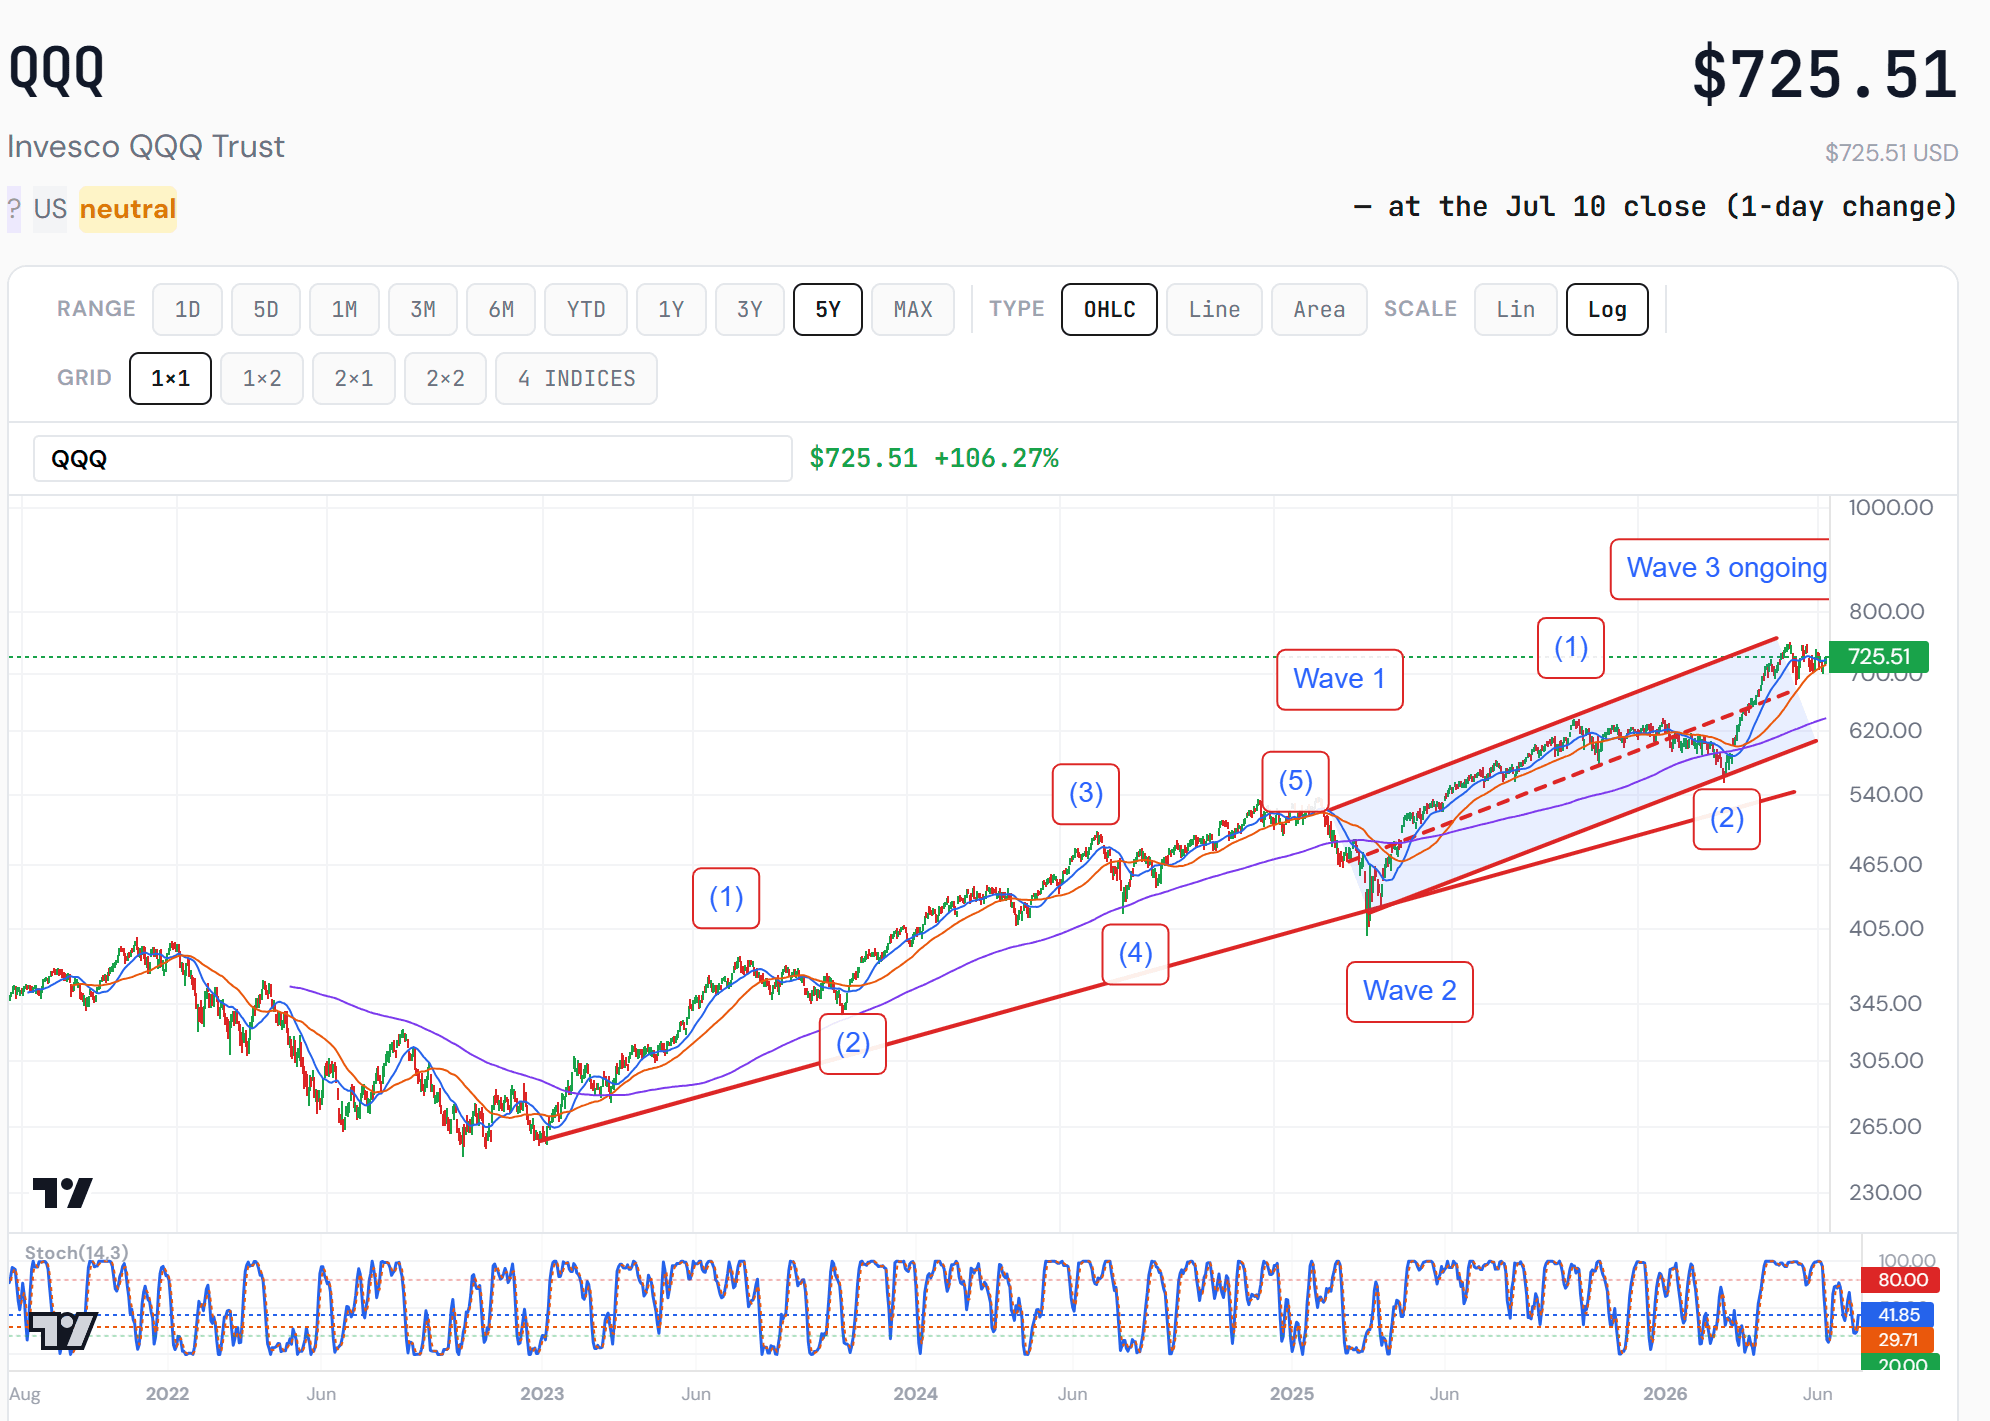
The count, updated. The five-year view puts the week in its structural place. The advance from the late-2022 low counts as a completed five — that was Wave 1, topping in early 2025. The spring-2025 flush was Wave 2. Everything since is Wave 3, ongoing: its own first sub-wave completed into the winter, its second bottomed at the spring-2026 low, and price now rides the upper half of the red channel in the third-of-third — the strongest part of the sequence, if the count is right. Tuesday’s break never seriously threatened the channel midline, let alone the lower rail; the weekly stochastic has reset to mid-range rather than overbought. The bearish alternative — a completed five at the high — needed the break to stick, and it lasted one session. The channel rails are the count’s own invalidation levels: the midline is where the bulls get their first real question, the lower rail is where the count dies.
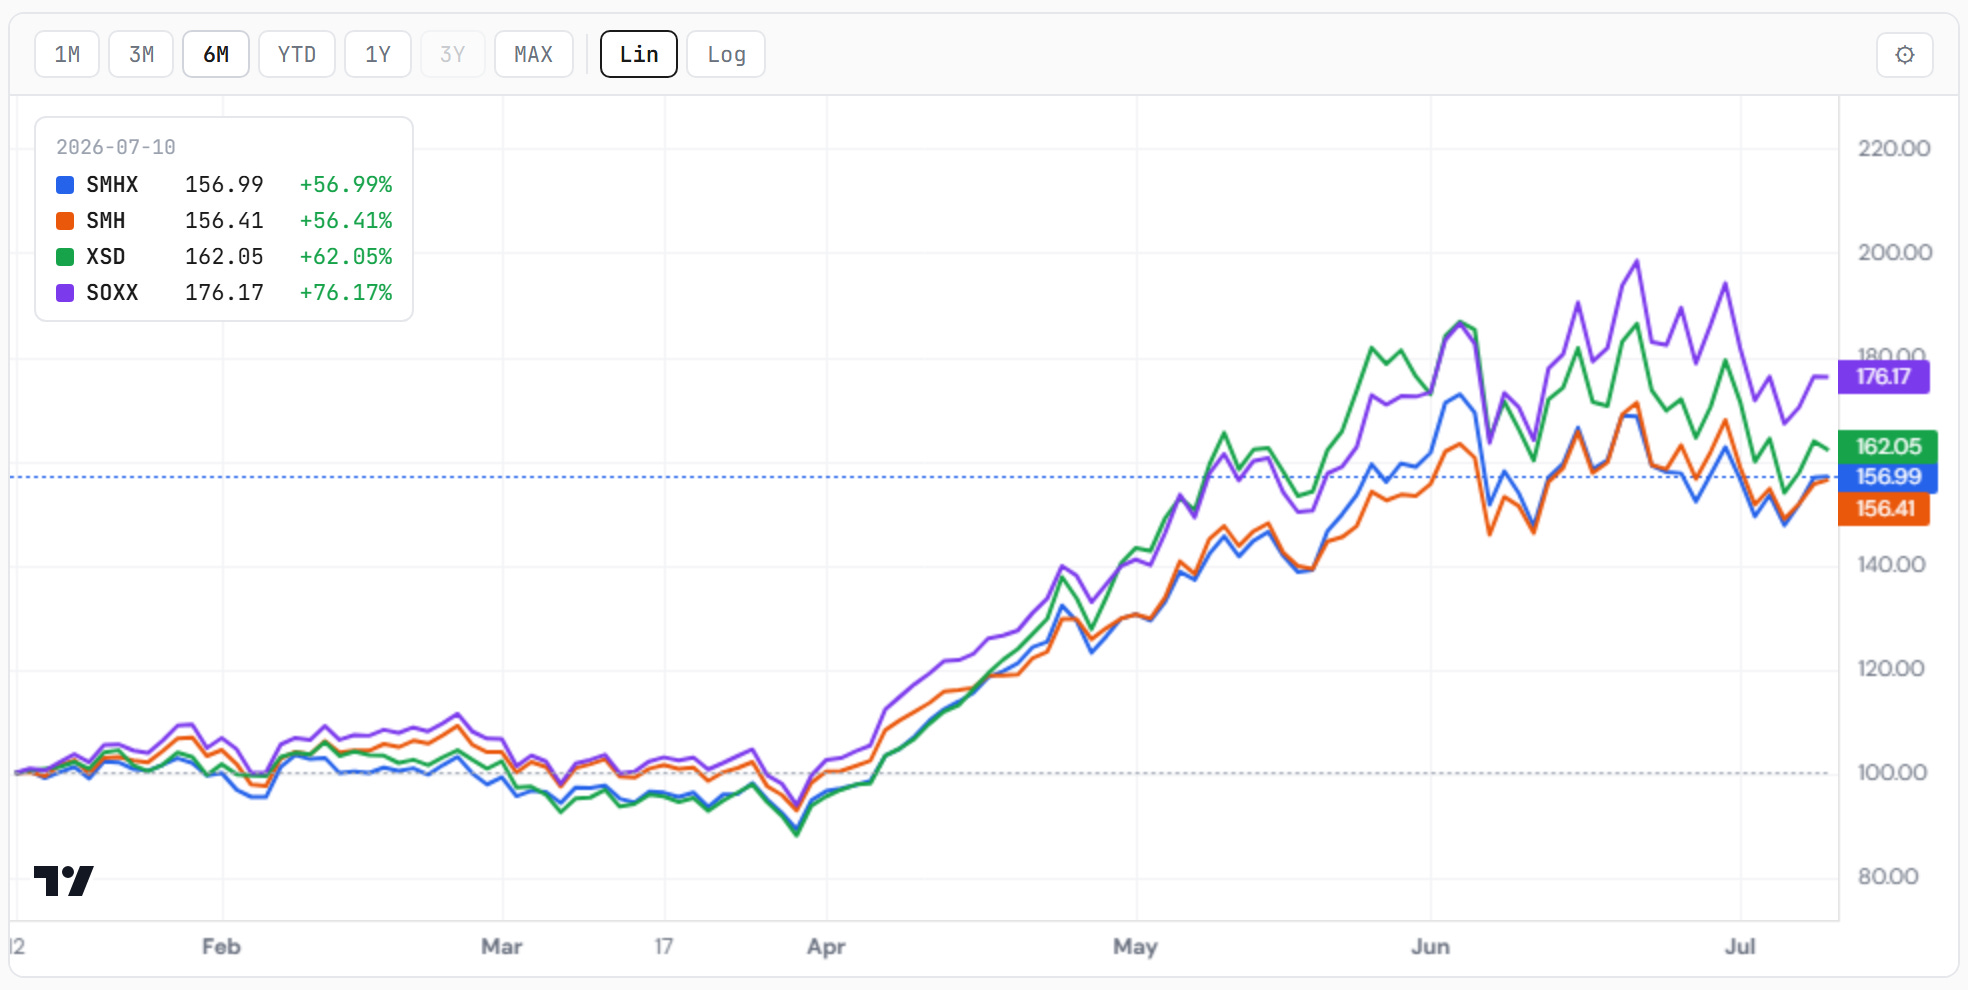
The semi complex — the group that decided the week. The four semiconductor wrappers tell the shakeout story in one frame: Tuesday’s break, Wednesday’s reclaim, Thursday’s extension — and a Friday that held the ground. The fabless sleeve (SMHX, +3.2% on the week) led the complex out while the broad wrappers ended flat: break → reclaim → extend is the signature of forced selling absorbed by size, not the start of distribution.
Inside the buying — down the stack. The detail that separates this reversal from a simple bounce: on the strongest day of the week the architect sat out. NVIDIA closed red on Thursday while the layers beneath it re-rated — Storage +6.9%, Deposition & Etch +6.1%, Advanced Packaging +5.7% inside our build-out index, and Micron closed the day worth $1.12 trillion, roughly ten times its 52-week low, still near 6.6x forward earnings. Capital did not chase the top of the stack; it bought the layers that had not yet repriced. That broadens the trade rather than narrowing it.
Where the dollar itself is going. The down-the-stack buying is not a one-week quirk — it mirrors the migration of the AI dollar itself. Last week’s Global edition traced the geography: of every $100 the hyperscalers spend, roughly $45–55 stays in the US — but what stays is the design and IP margin, the cloud economics and the concrete, while the physical system bill runs through the supply chain.
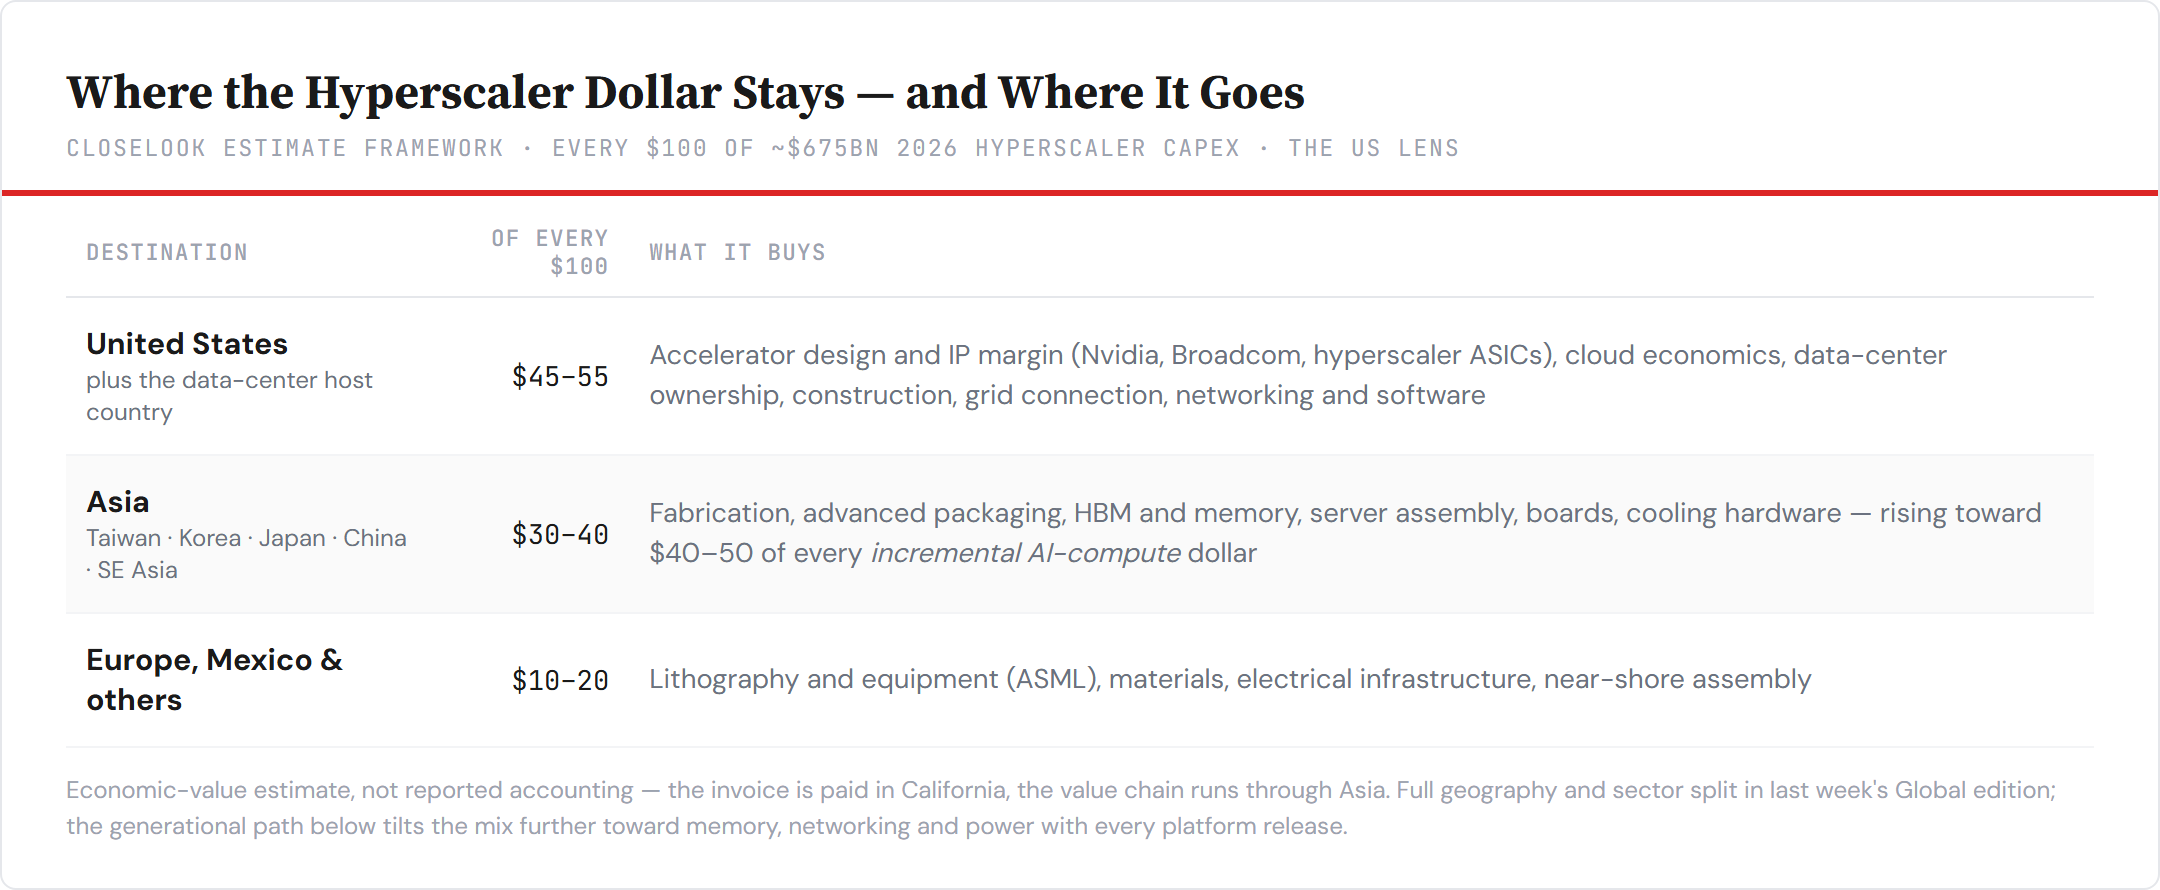
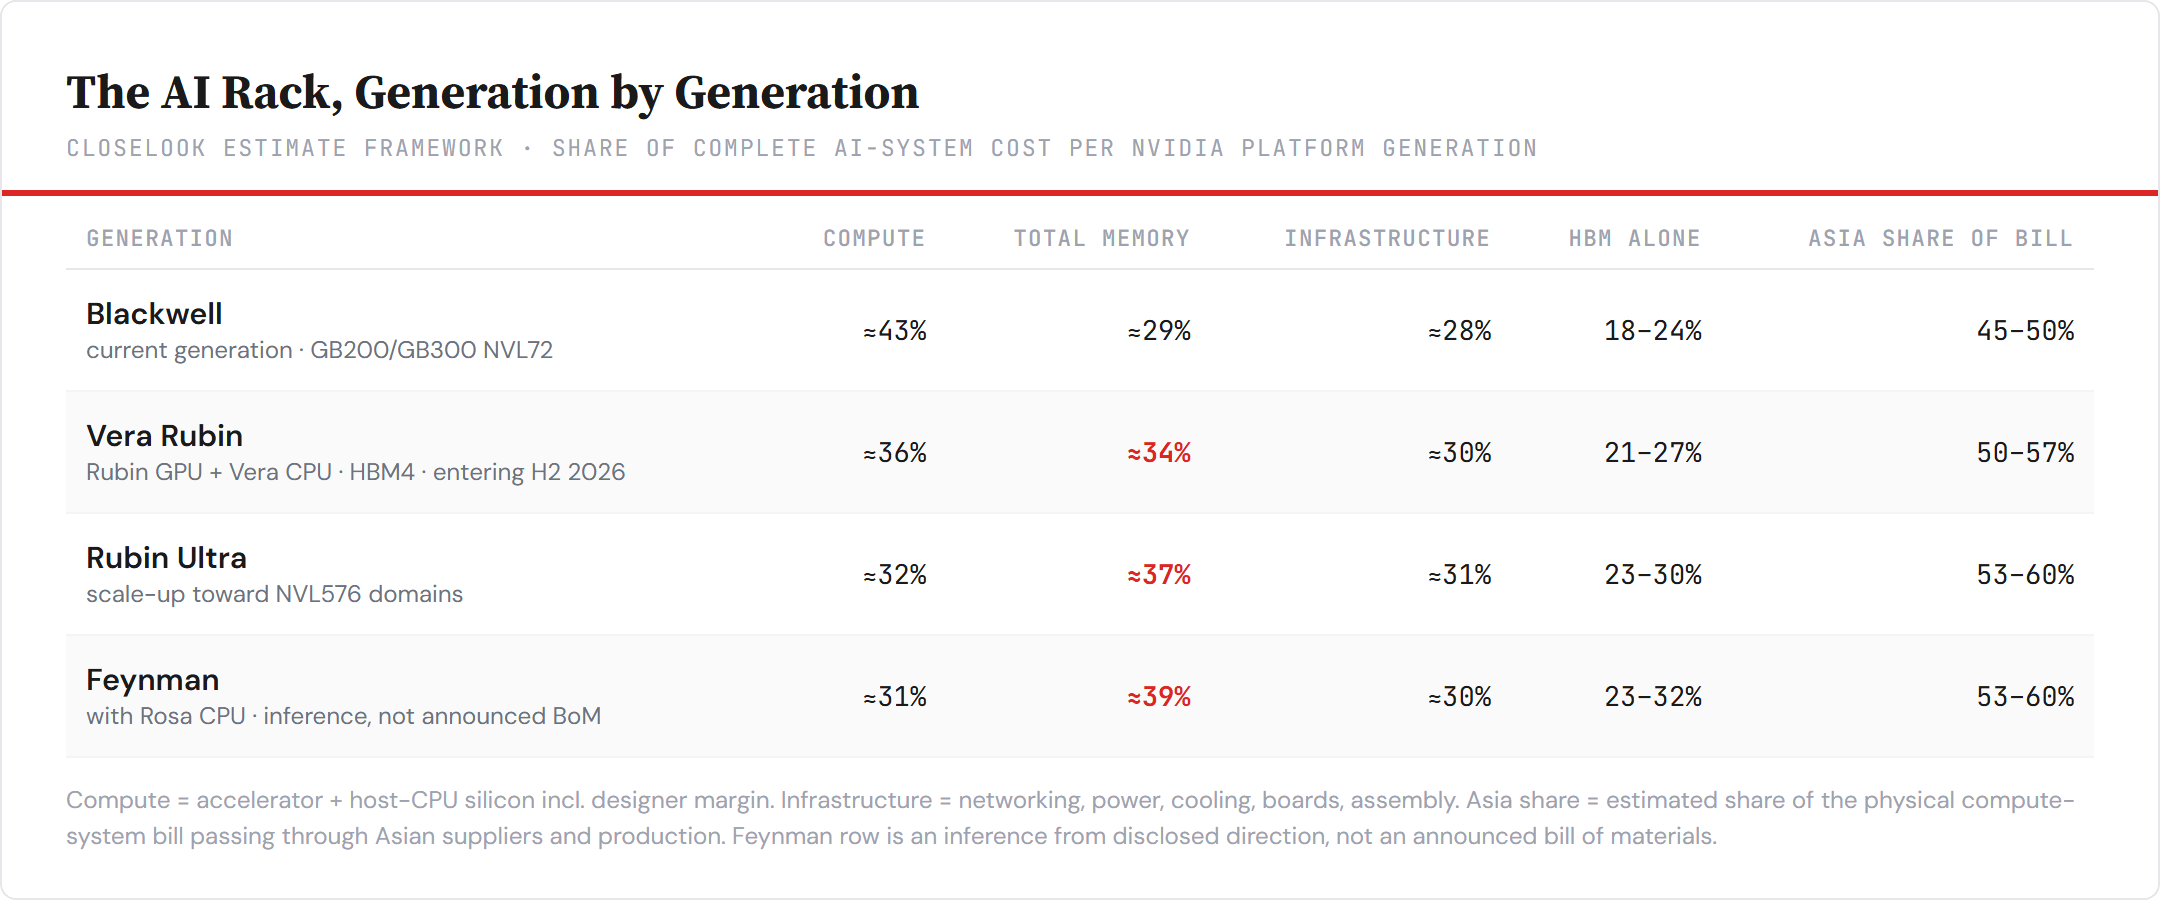
The forward path matters more than the snapshot. Generation by generation — Blackwell today, the Vera Rubin platform entering the market this half, Rubin Ultra scaling toward 576-GPU domains, Feynman behind it — our estimate of the rack dollar shifts the same way the week’s tape did: compute’s share falls from roughly 43% toward ~31%, total memory rises from ~29% toward ~39%, and networking stops being an accessory and becomes part of the processor. The buyers who re-rated storage, etch and packaging on Thursday were, knowingly or not, front-running that table.
3 · The Outlook Free
The four indices — the week in one line each. Rubin Build-Out: −5.6% Tuesday, +3.9% Thursday, −0.1% on the week — a round trip that proved the holder base. The Agentic Ecosystem Index led into Thursday and gave back 3.3% on Friday into the debut, closing the week +1.4%; AW40 added +1.7%; HALO lost −2.6%. Year-to-date the ladder reads Rubin +119%, AEI +47%, HALO +5%, AW40 −21% (equal-weight variants). The barbell swapped sides twice and ended the week near balance — a tug-of-war, not a regime change. Friday’s split inside the pair — the architect +4% while the agentic complex gave back — is the same rotation §2 describes, running in real time.
The road ahead — our working map, and the number that will decide it. Here is the path we are working with, stated plainly enough to be wrong. The tape keeps rising into earnings season — mid-season, perhaps to its end, at the outside until the July-quarter reports land in August. Then the calendar turns hostile: the seasonally weakest stretch of the year meets midterm-election uncertainty, and by then the peak in earnings expectations may already be behind us. Consensus has S&P 500 earnings growing roughly 23–24% this year, and with normal beats the second quarter alone could print near 29% — growth rates the index normally only achieves coming out of a recession. If that is the expectations peak, the autumn setup is a correction — and after the election, the year-end rally.
But the 24% is not what it appears to be. The aggregate is profit-dollar-weighted: a small cohort of AI, energy and capital-markets names growing 25–40% pulls the headline while the median S&P 500 company grows perhaps 7–10% — a respectable expansion, not a boom. The index’s earnings line is growing roughly three times faster than the representative constituent’s. And part of the aggregate is not operating earnings at all: when Amazon books gains on its Anthropic stake — Alphabet likely the same — valuation marks become profits, and inside the AI build-out itself one side of every dollar records 100% as revenue today while the other side spreads its cost across years of depreciation. Earnings booms built on that arithmetic can run for a long time — and they can also unwind through the income statement rather than the multiple.
We will track this through the season with one number: the Earnings Dispersion Ratio — aggregate index earnings growth divided by median constituent growth. Around 3.0 today, by our working estimate. What that ratio does from Tuesday’s bank prints onward tells us which regime this actually is: an earnings boom — or a concentration wearing one as a costume. The paid half of this letter maps the levels, the bellwethers and the book; the EDR gets its own treatment in the coming editions.
The road ahead — our working map, and the number that will decide it. Here is the path we are working with, stated plainly enough to be wrong. The tape keeps rising into earnings season — mid-season, perhaps to its end, at the outside until the July-quarter reports land in August. Then the calendar turns hostile: the seasonally weakest stretch of the year meets midterm-election uncertainty, and by then the peak in earnings expectations may already be behind us. Consensus has S&P 500 earnings growing roughly 23–24% this year, and with normal beats the second quarter alone could print near 29% — growth rates the index normally only achieves coming out of a recession. If that is the expectations peak, the autumn setup is a correction — and after the election, the year-end rally.
But the 24% is not what it appears to be. The aggregate is profit-dollar-weighted: a small cohort of AI, energy and capital-markets names growing 25–40% pulls the headline while the median S&P 500 company grows perhaps 7–10% — a respectable expansion, not a boom. The index’s earnings line is growing roughly three times faster than the representative constituent’s. And part of the aggregate is not operating earnings at all: when Amazon books gains on its Anthropic stake — Alphabet likely the same — valuation marks become profits, and inside the AI build-out itself one side of every dollar records 100% as revenue today while the other side spreads its cost across years of depreciation. Earnings booms built on that arithmetic can run for a long time — and they can also unwind through the income statement rather than the multiple.
We will track this through the season with one number: the Earnings Dispersion Ratio — aggregate index earnings growth divided by median constituent growth. Around 3.0 today, by our working estimate. What that ratio does from Tuesday’s bank prints onward tells us which regime this actually is: an earnings boom — or a concentration wearing one as a costume. The paid half of this letter maps the levels, the bellwethers and the book; the EDR gets its own treatment in the coming editions.
