

Bull Market at Crossroads: Trussonomics 2.0 and the Looming Threat to the Global Equity Rally
Will the US presidential election awaken the stock market bears?

Salve, cari subscripti!
Thank you for reading this week's edition of Closelook@Global Stock Markets, dated November 02, 2024 👋. The next edition will be published on November 09, 2024, at 2.00 p.m. ET.
The next edition of Closelook@US Stock Markets will be published on November 03, 2024, at 2.00 p.m. ET.
The next edition of Closelook@Hypergrowth will be published on November 06, 2024, at 2.00 p.m. ET.
A Closelook At This Edition
This Week's Action: Global Stocks In Corrective Mode
Global Stock Markets: Comprehensive Overview Of 30 Global Stock Markets
Macro Insights: Trussonomics 2.0 Ante Portas?
The ETF Portfolio: Some Bigger Changes
This Week's ETF Spotlight: A New Semiconductor ETF
Knowledge Corner: Yield Curves, Inflation, Real Rates, Trussonomics and the Presidential Candidates
Upcoming Transactions: Waiting Until After the Election
Final Words: Challenging the Bull Narrative

(1) This Week's Action: Global Stocks In Corrective Mode
The week spanning from Monday, October 28 to Friday, November 01, 2024, displayed severe cracks in the global bull market narrative.
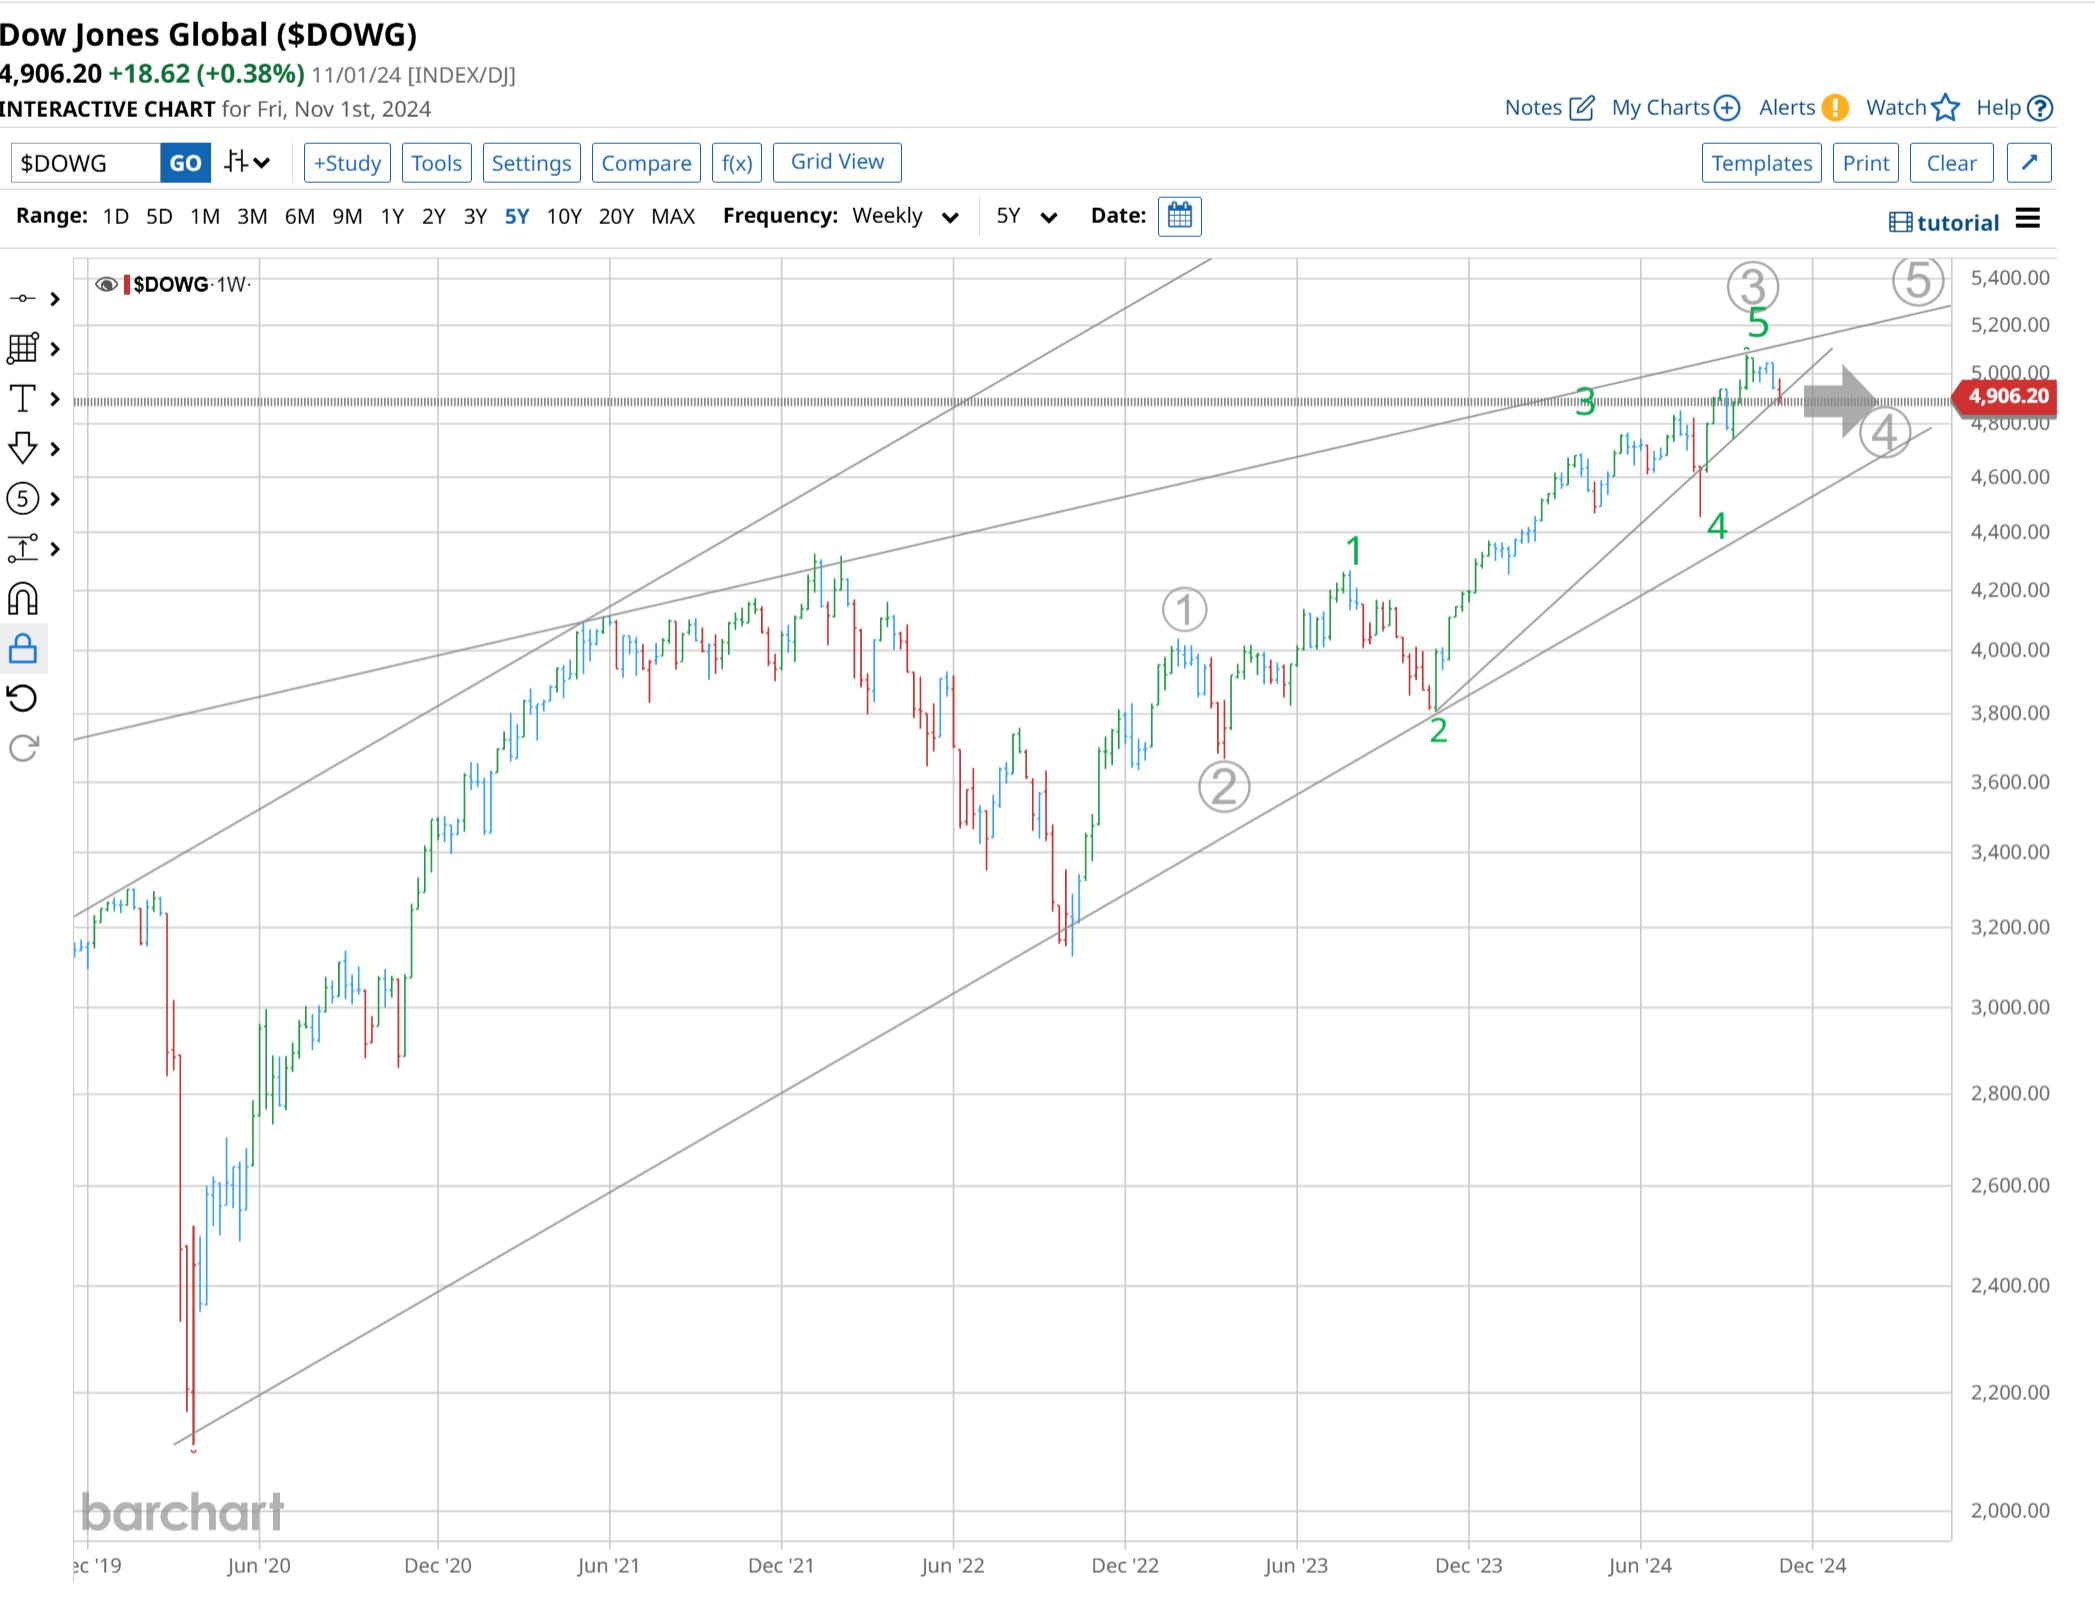
The Dow Jones Global Index moved down to the 4900 level and found support at the upward-sloping lower trend channel line, which has defined the lower boundaries of the bull market channel since autumn 2023. The long-term bull market channel was not violated.
The index looks like it has completed an extended wave 3 and is setting up for a consolidation wave 4.
There is support at the 4800 level (between 4850 and 4770) and between 4600 and 4500.
Taking a very long-term view, the bull is stretched. It has touched the decade-long upward-sloping upper trend line.
The index may be about to form a long-term bearish wedge. Right now, the wedge appears incomplete, suggesting that there is more upside to the bull narrative after a period of consolidation.
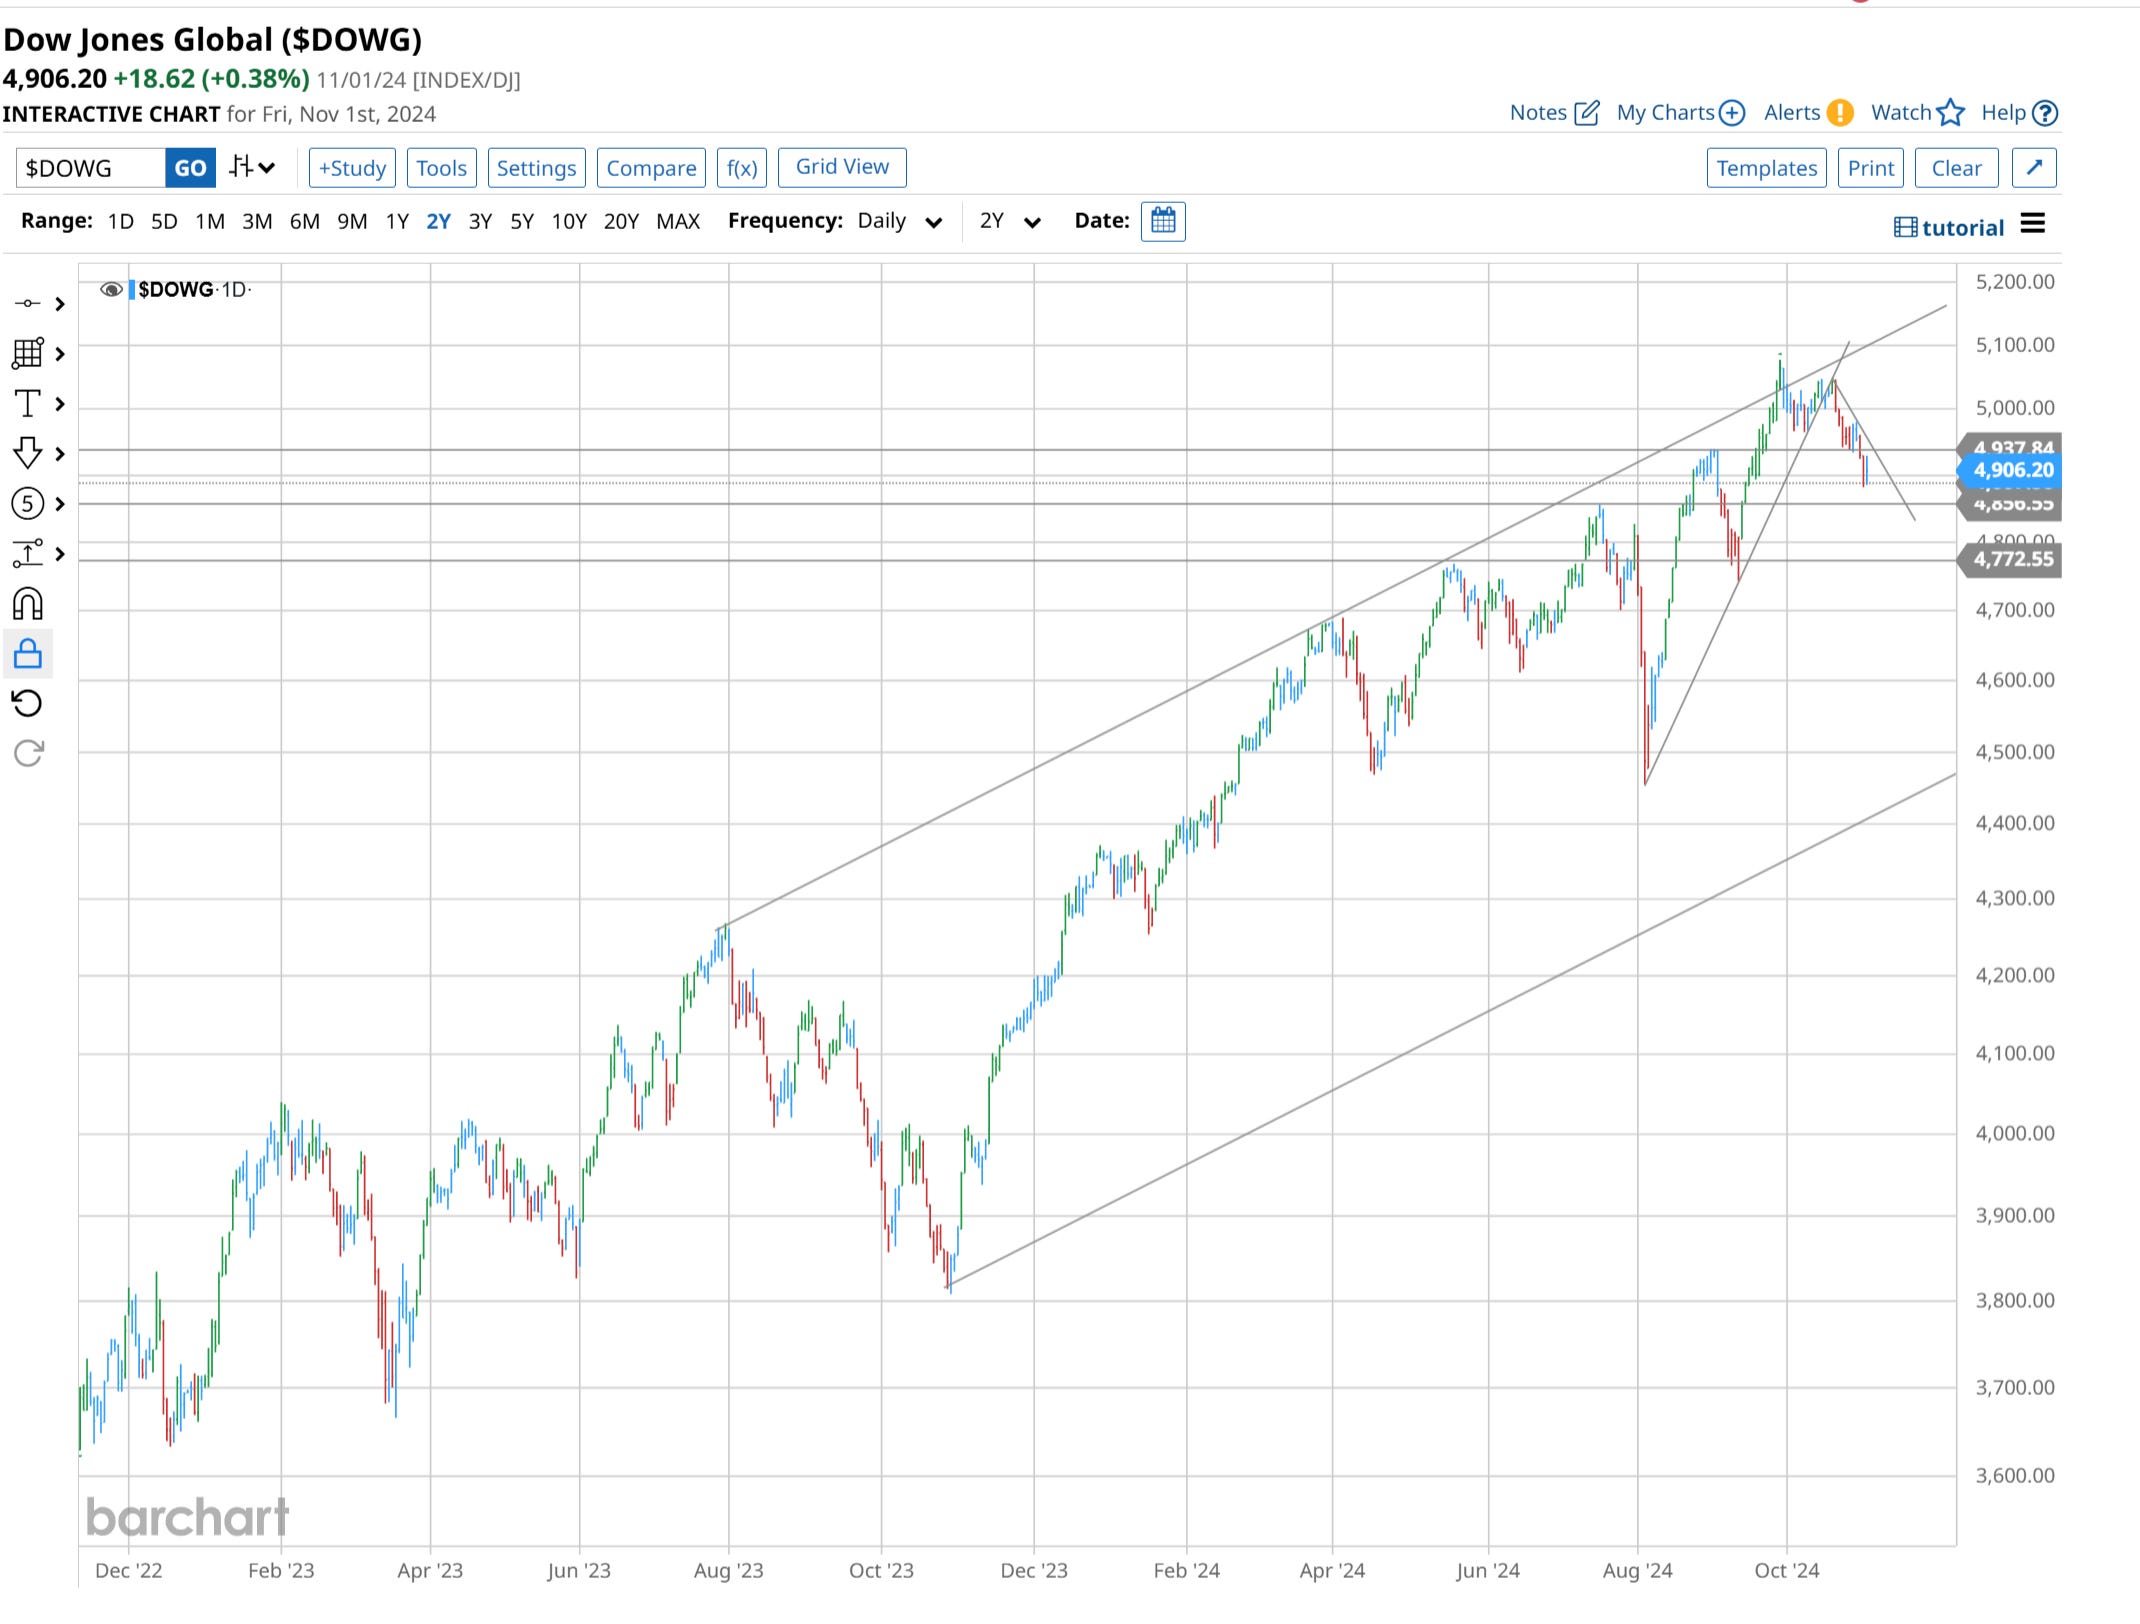
A short-term downward channel has formed, which may provide resistance to any move north in the coming week(s).
(2) Global Stock Markets: Comprehensive Overview Of 30 Global Stock Markets
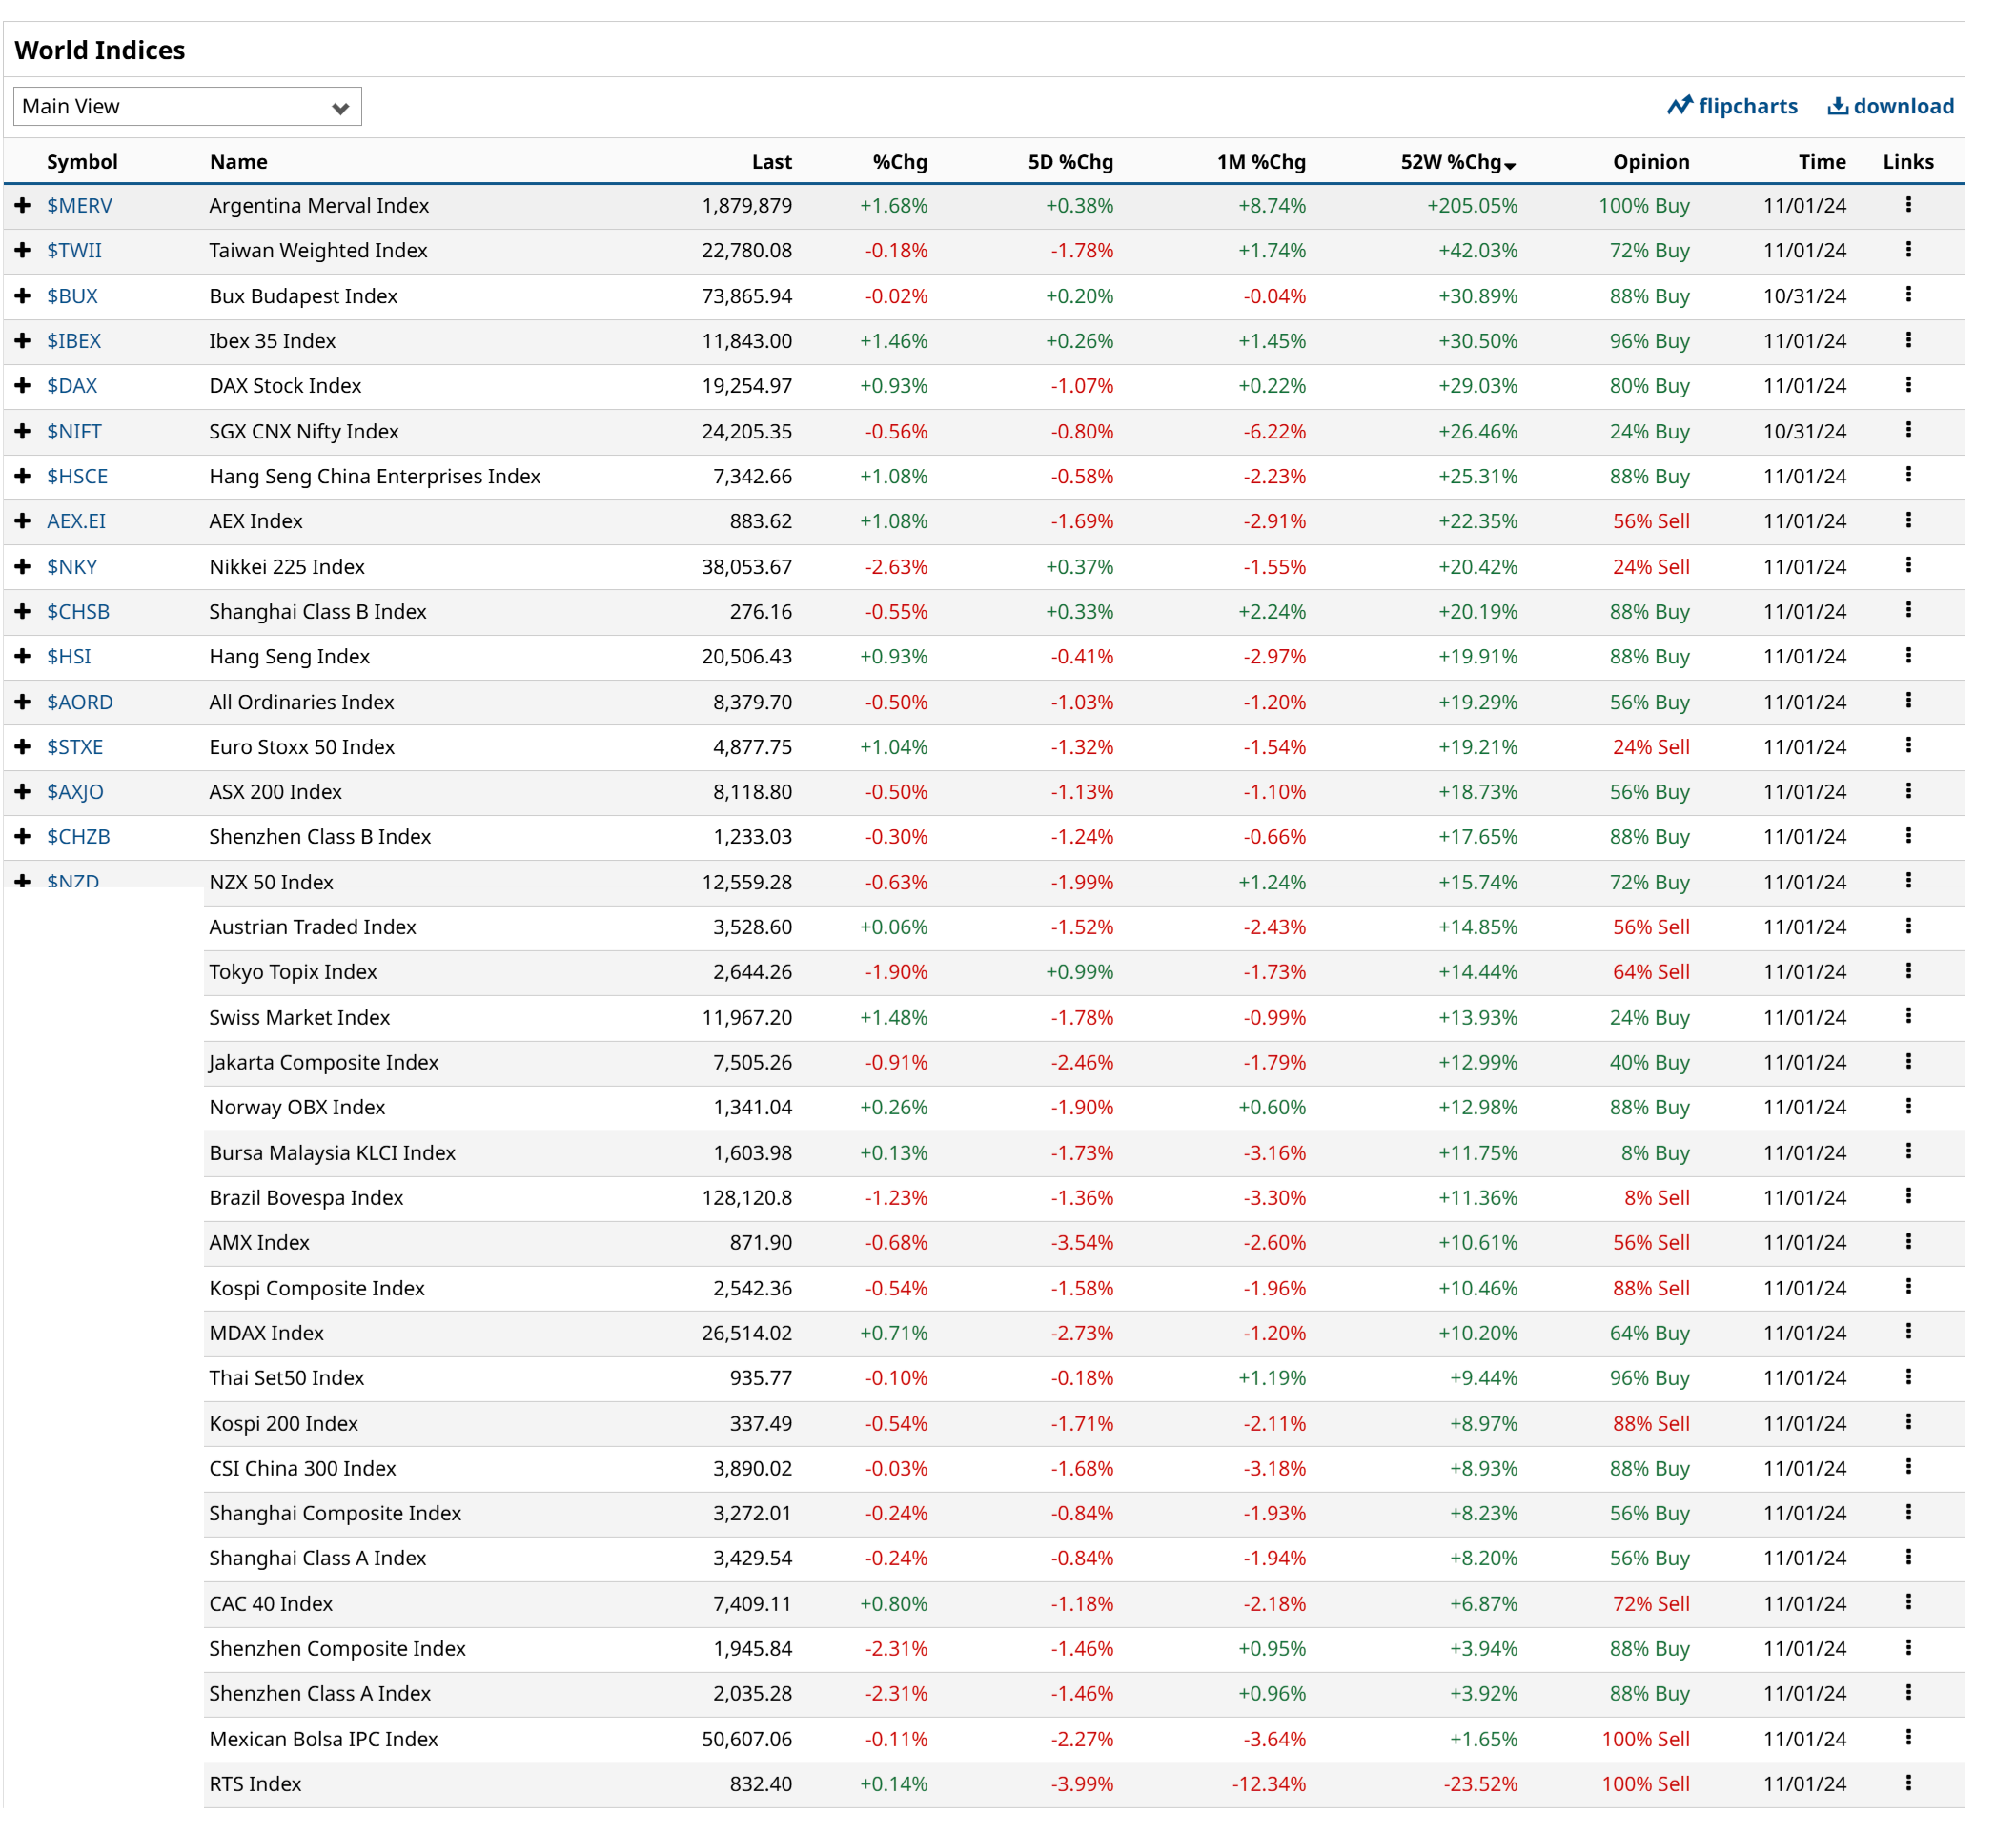
Argentina, Taiwan, Hungary, Spain, and Germany (DAX) continue to be the five best-performing global stock markets outside the US, taking a one-year perspective.
The table below displays 36 global stock markets. Laggards are France, China, and Mexico.
The only index in the red, the worst-performing index globally, taking a 1-year perspective, has been the Russian RTS Index.
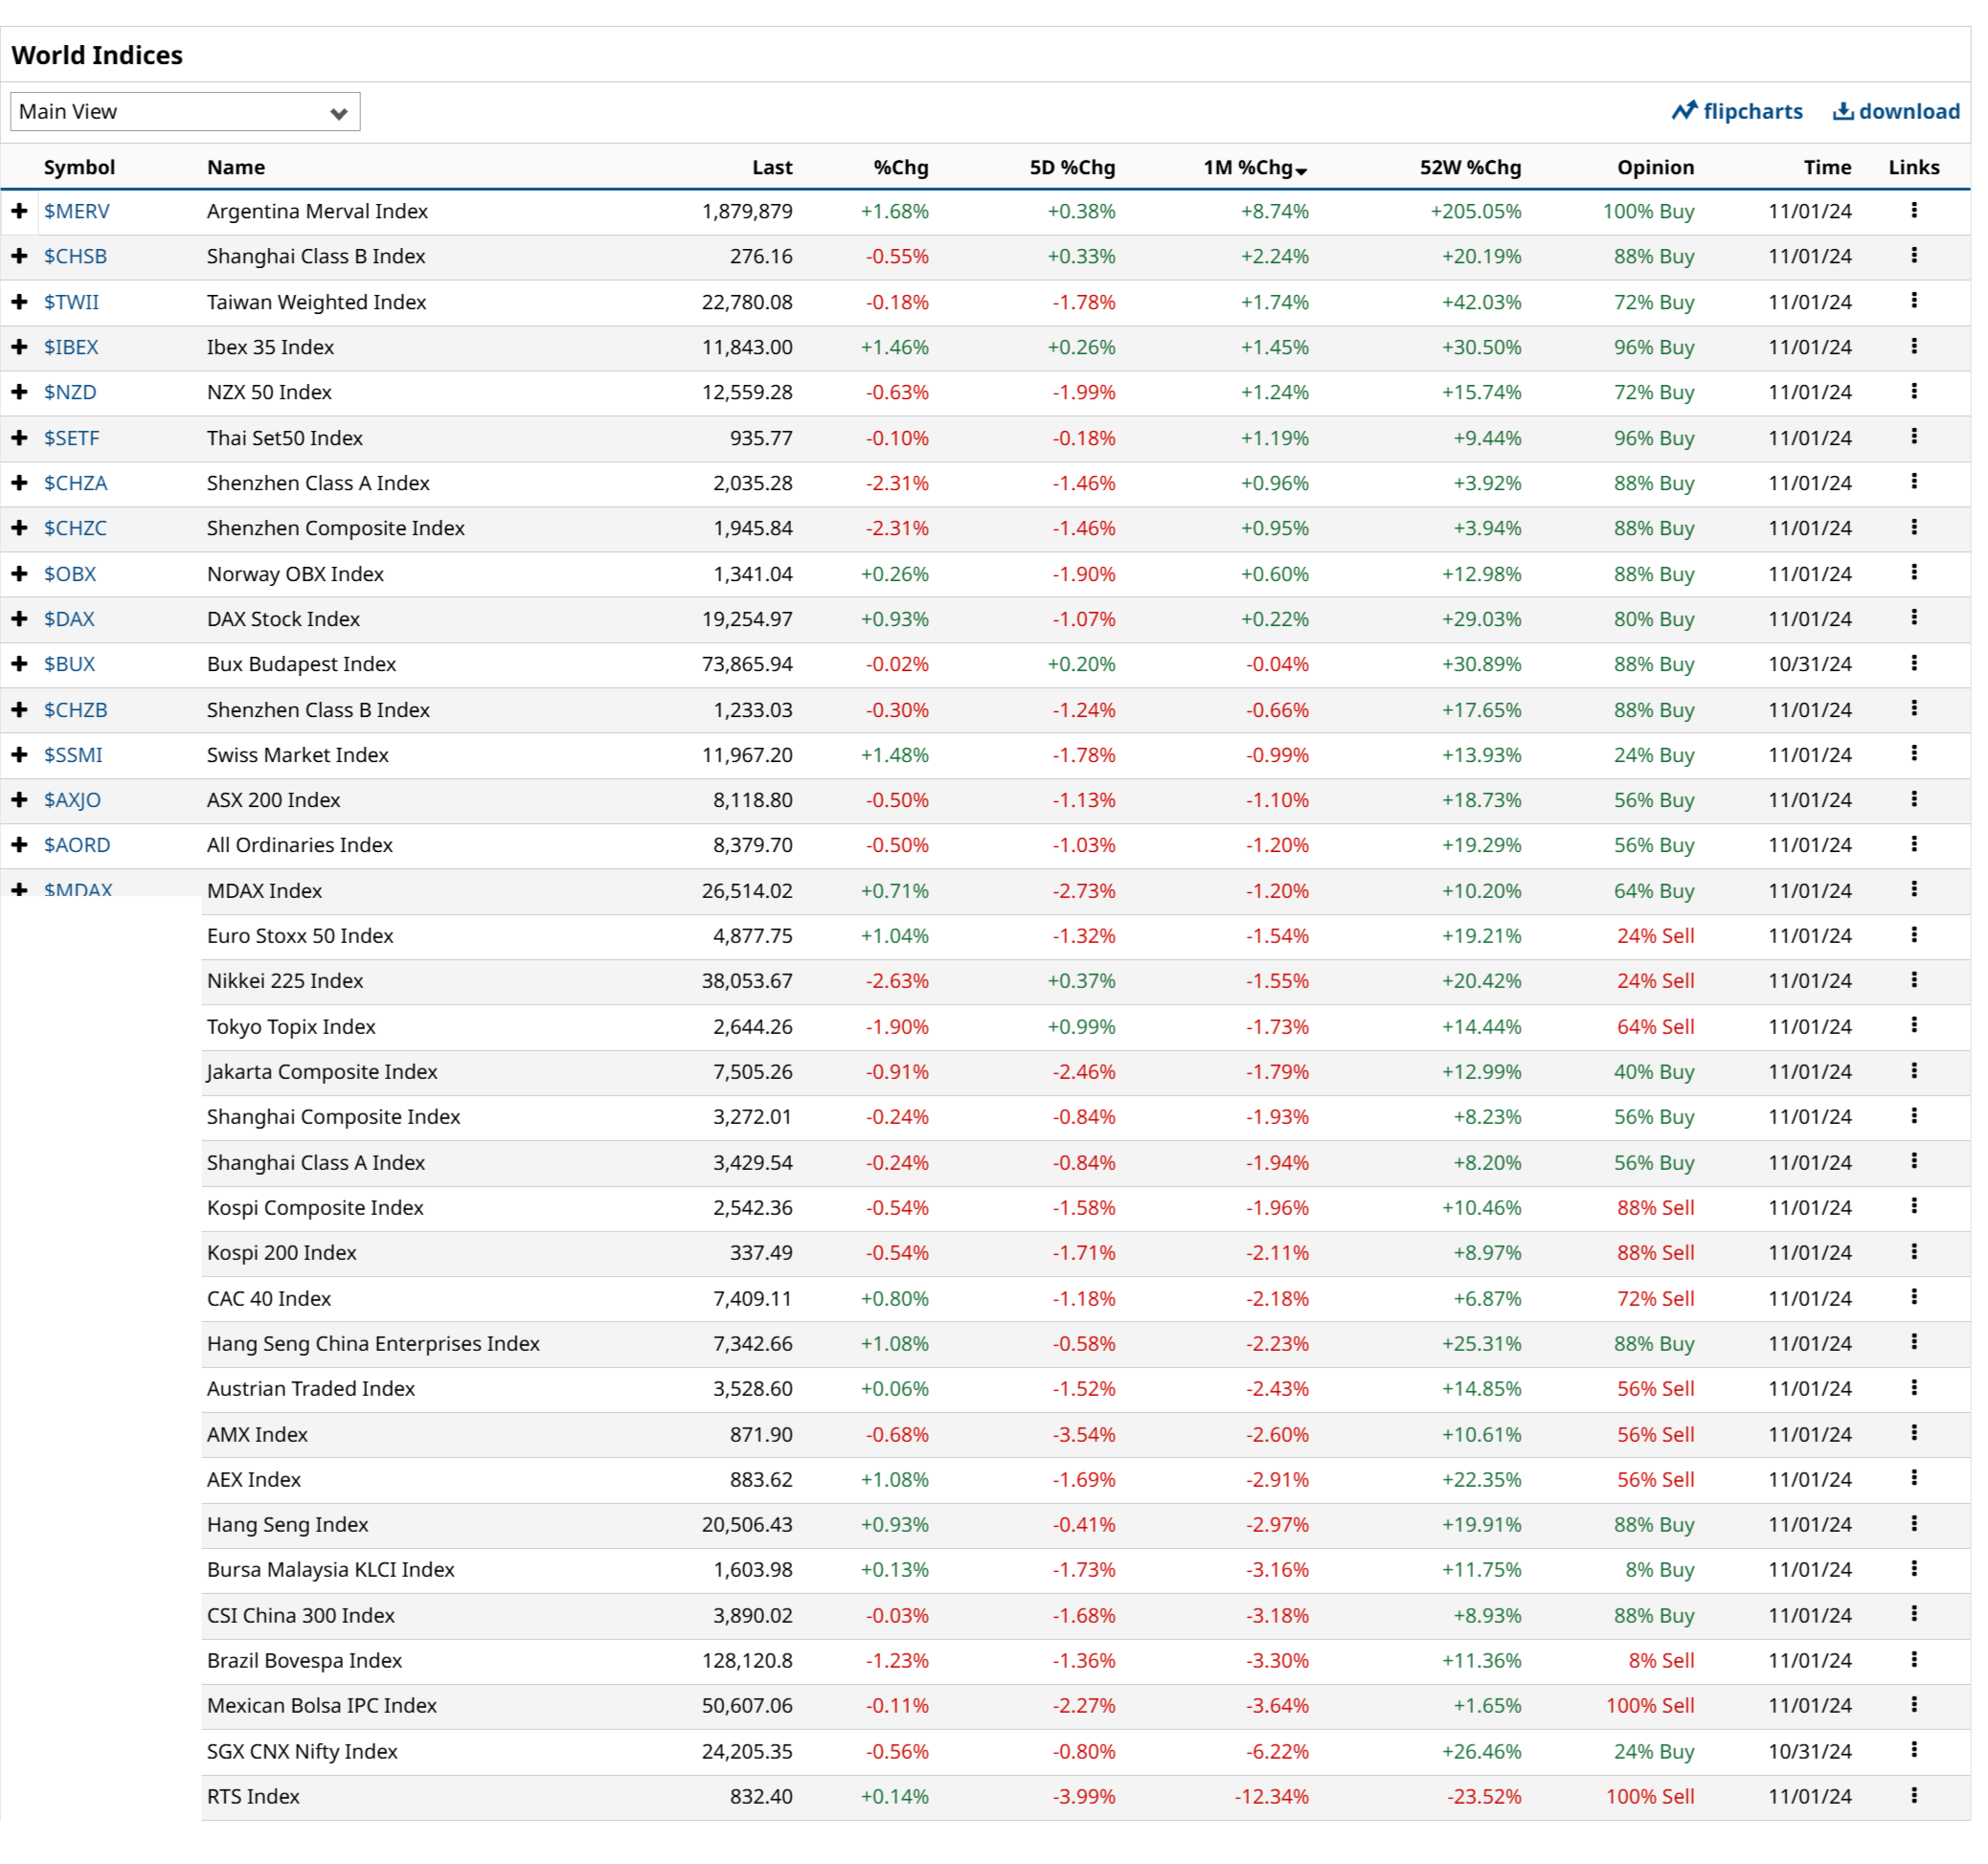
Taking a 30-day view, laggards have become top performers, with the mainland Chinese and Hong Kong markets leading.
Argentina is the best-performing country, followed by the Shanghai Calls B Index, the Taiwan Weighted Index, Ibex 35, and NZZ 50. Only ten indices moved up, and 26 indices moved down.
Russia was the worst performer. However, India, Mexico, and Brazil performed badly too.
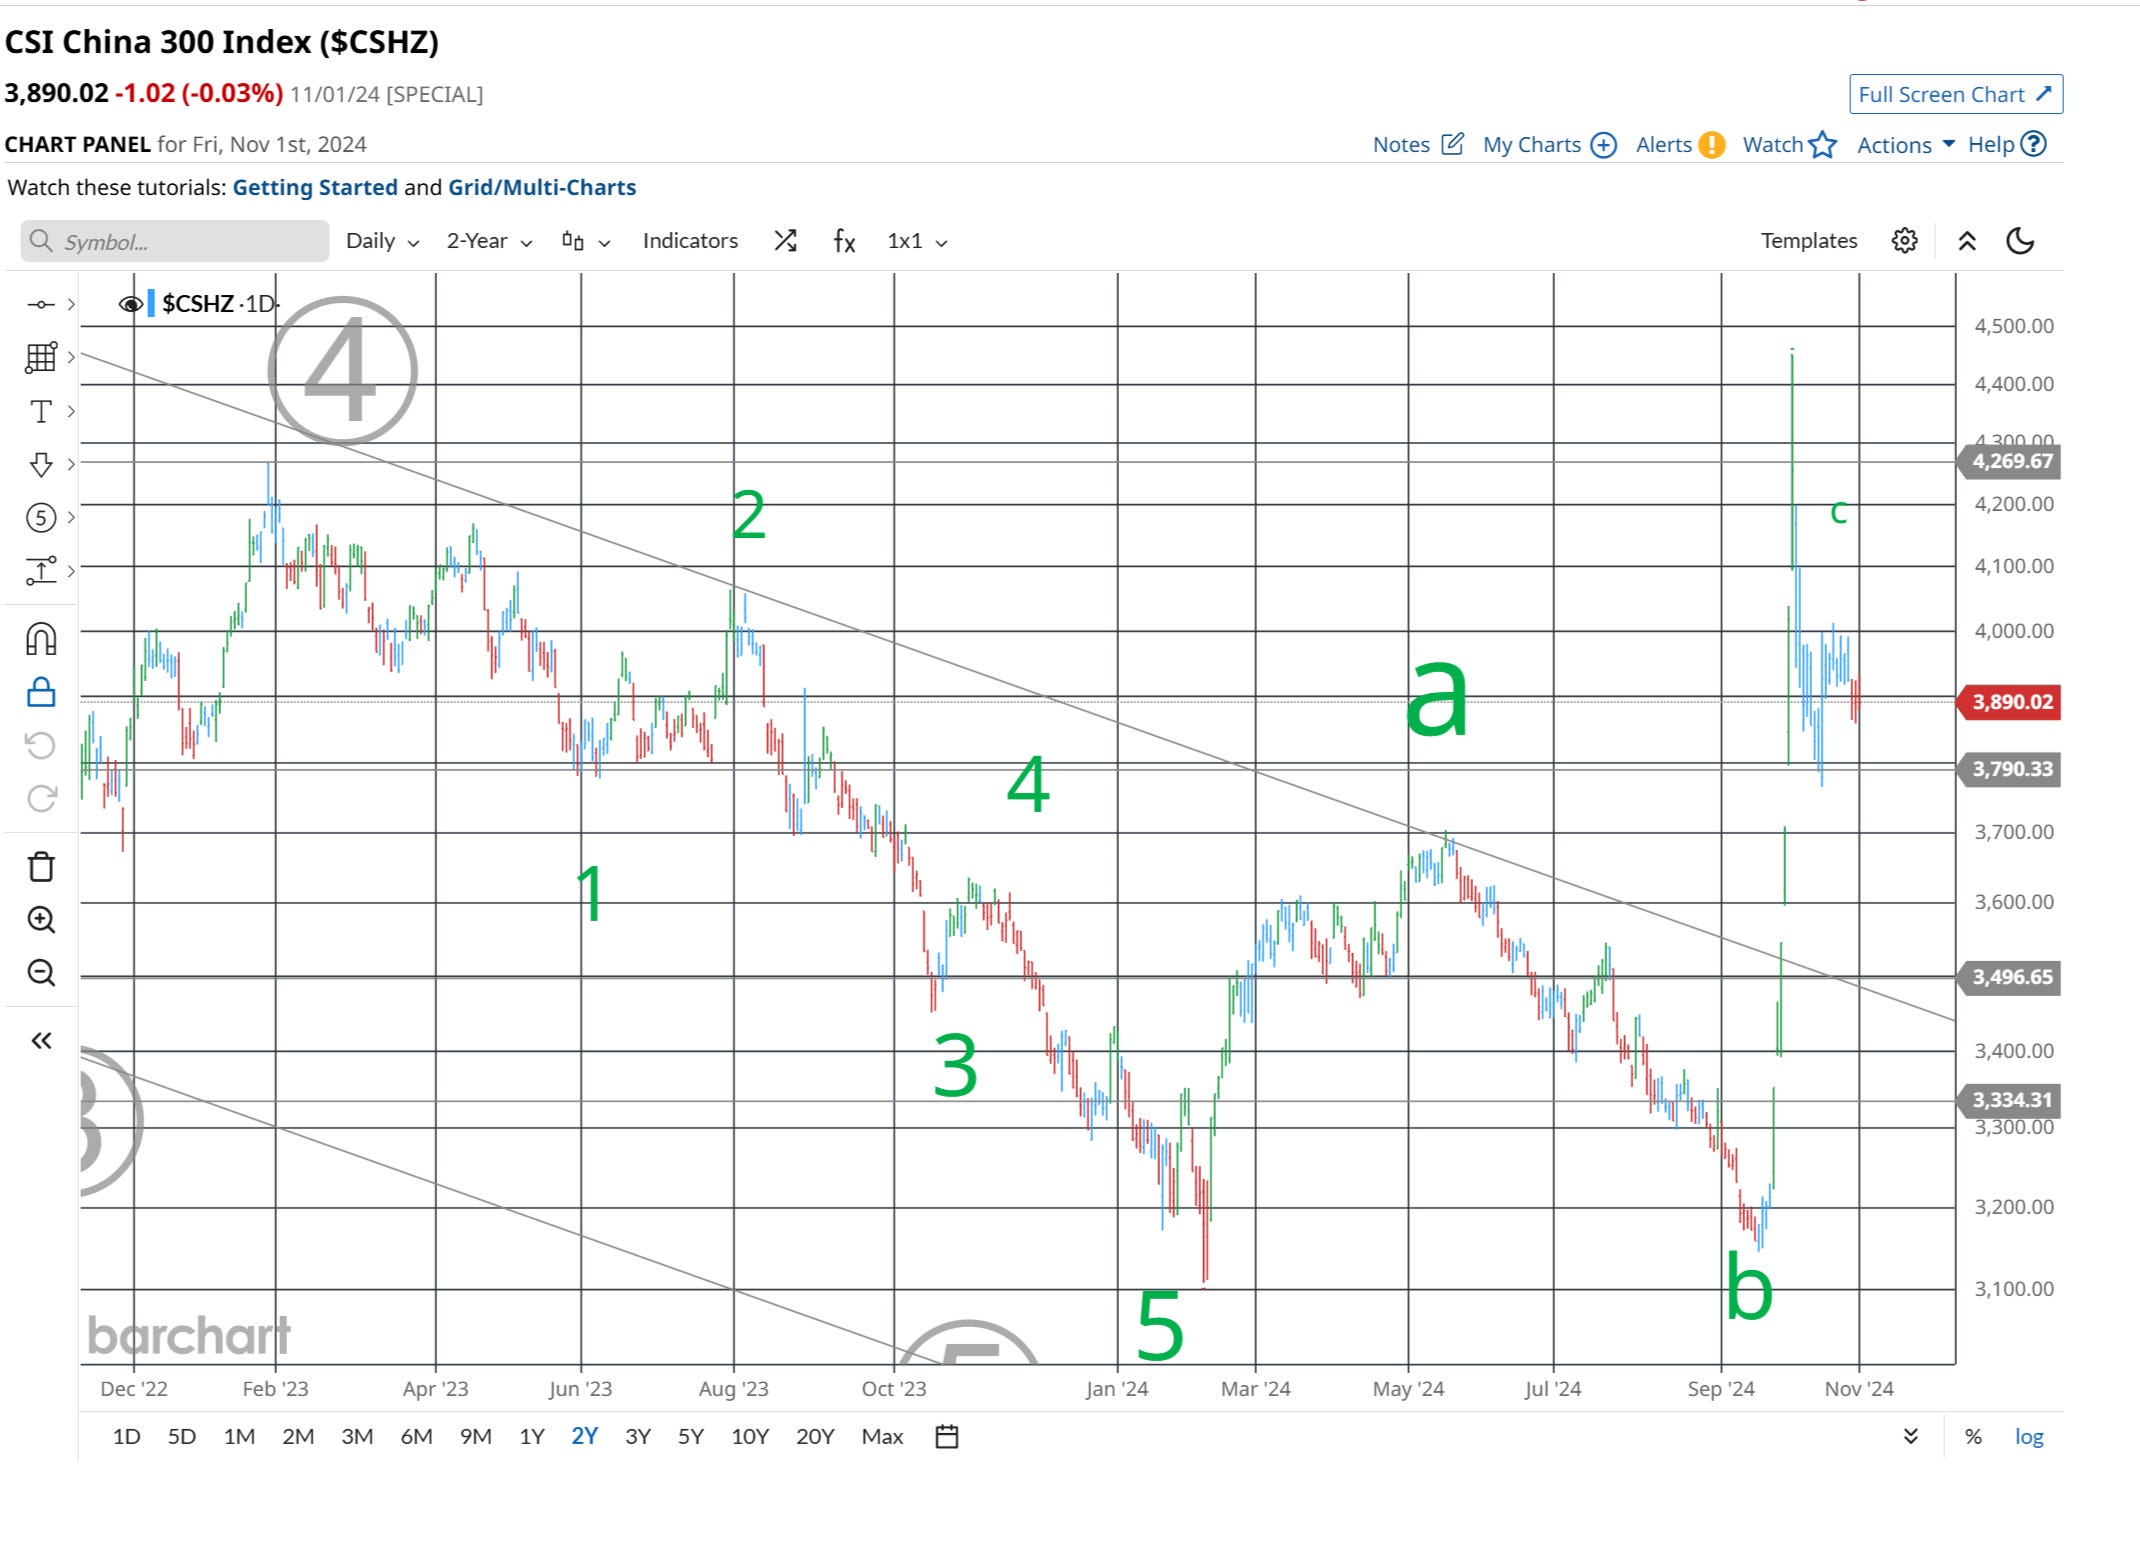
I expect another bull market leg to occur in China soon. I will cut China's exposure and trim positions on the anticipated rise.
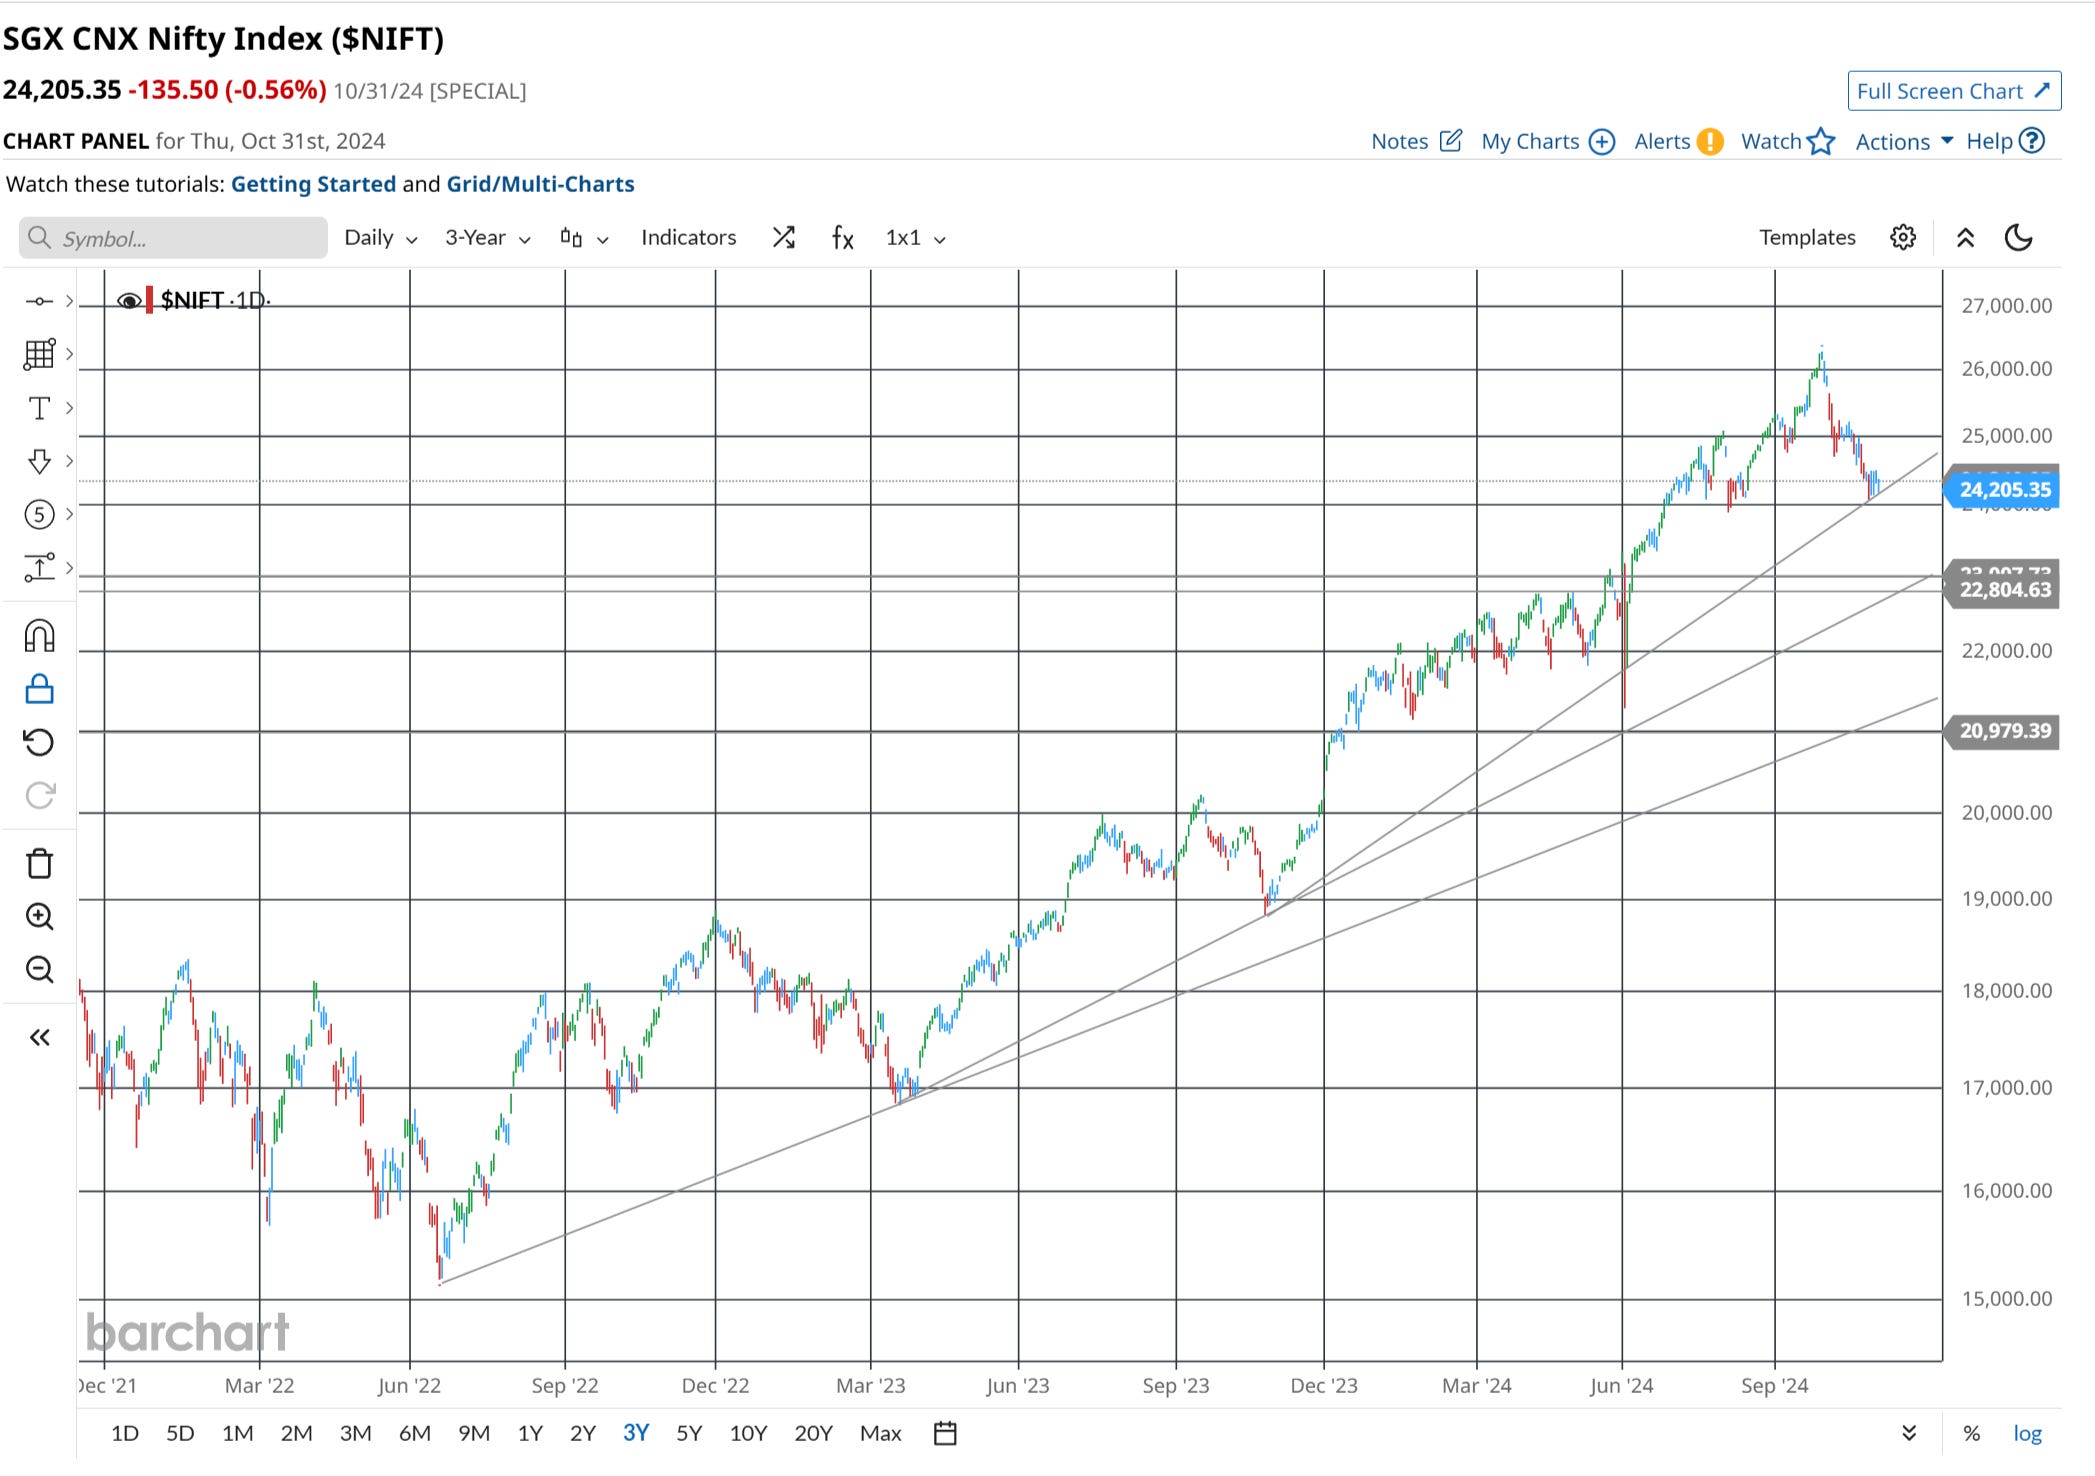
I will be adding to the existing India positions. I expected a whole leg down in the Indian market first two weeks ago. This seems to be unfolding.
I will be adding to the current positions on any meaningful dip. The first level to buy is at 24000 on the Nifty-Fifty index, and the second and third are at 22800 and 22000.
The Euro Stoxx 50 Index moved lower during the past week. It found support at the critical 2-year trend line.
A heavy resistance zone, spanning from 5000 to the spring 2024 tops, has formed.
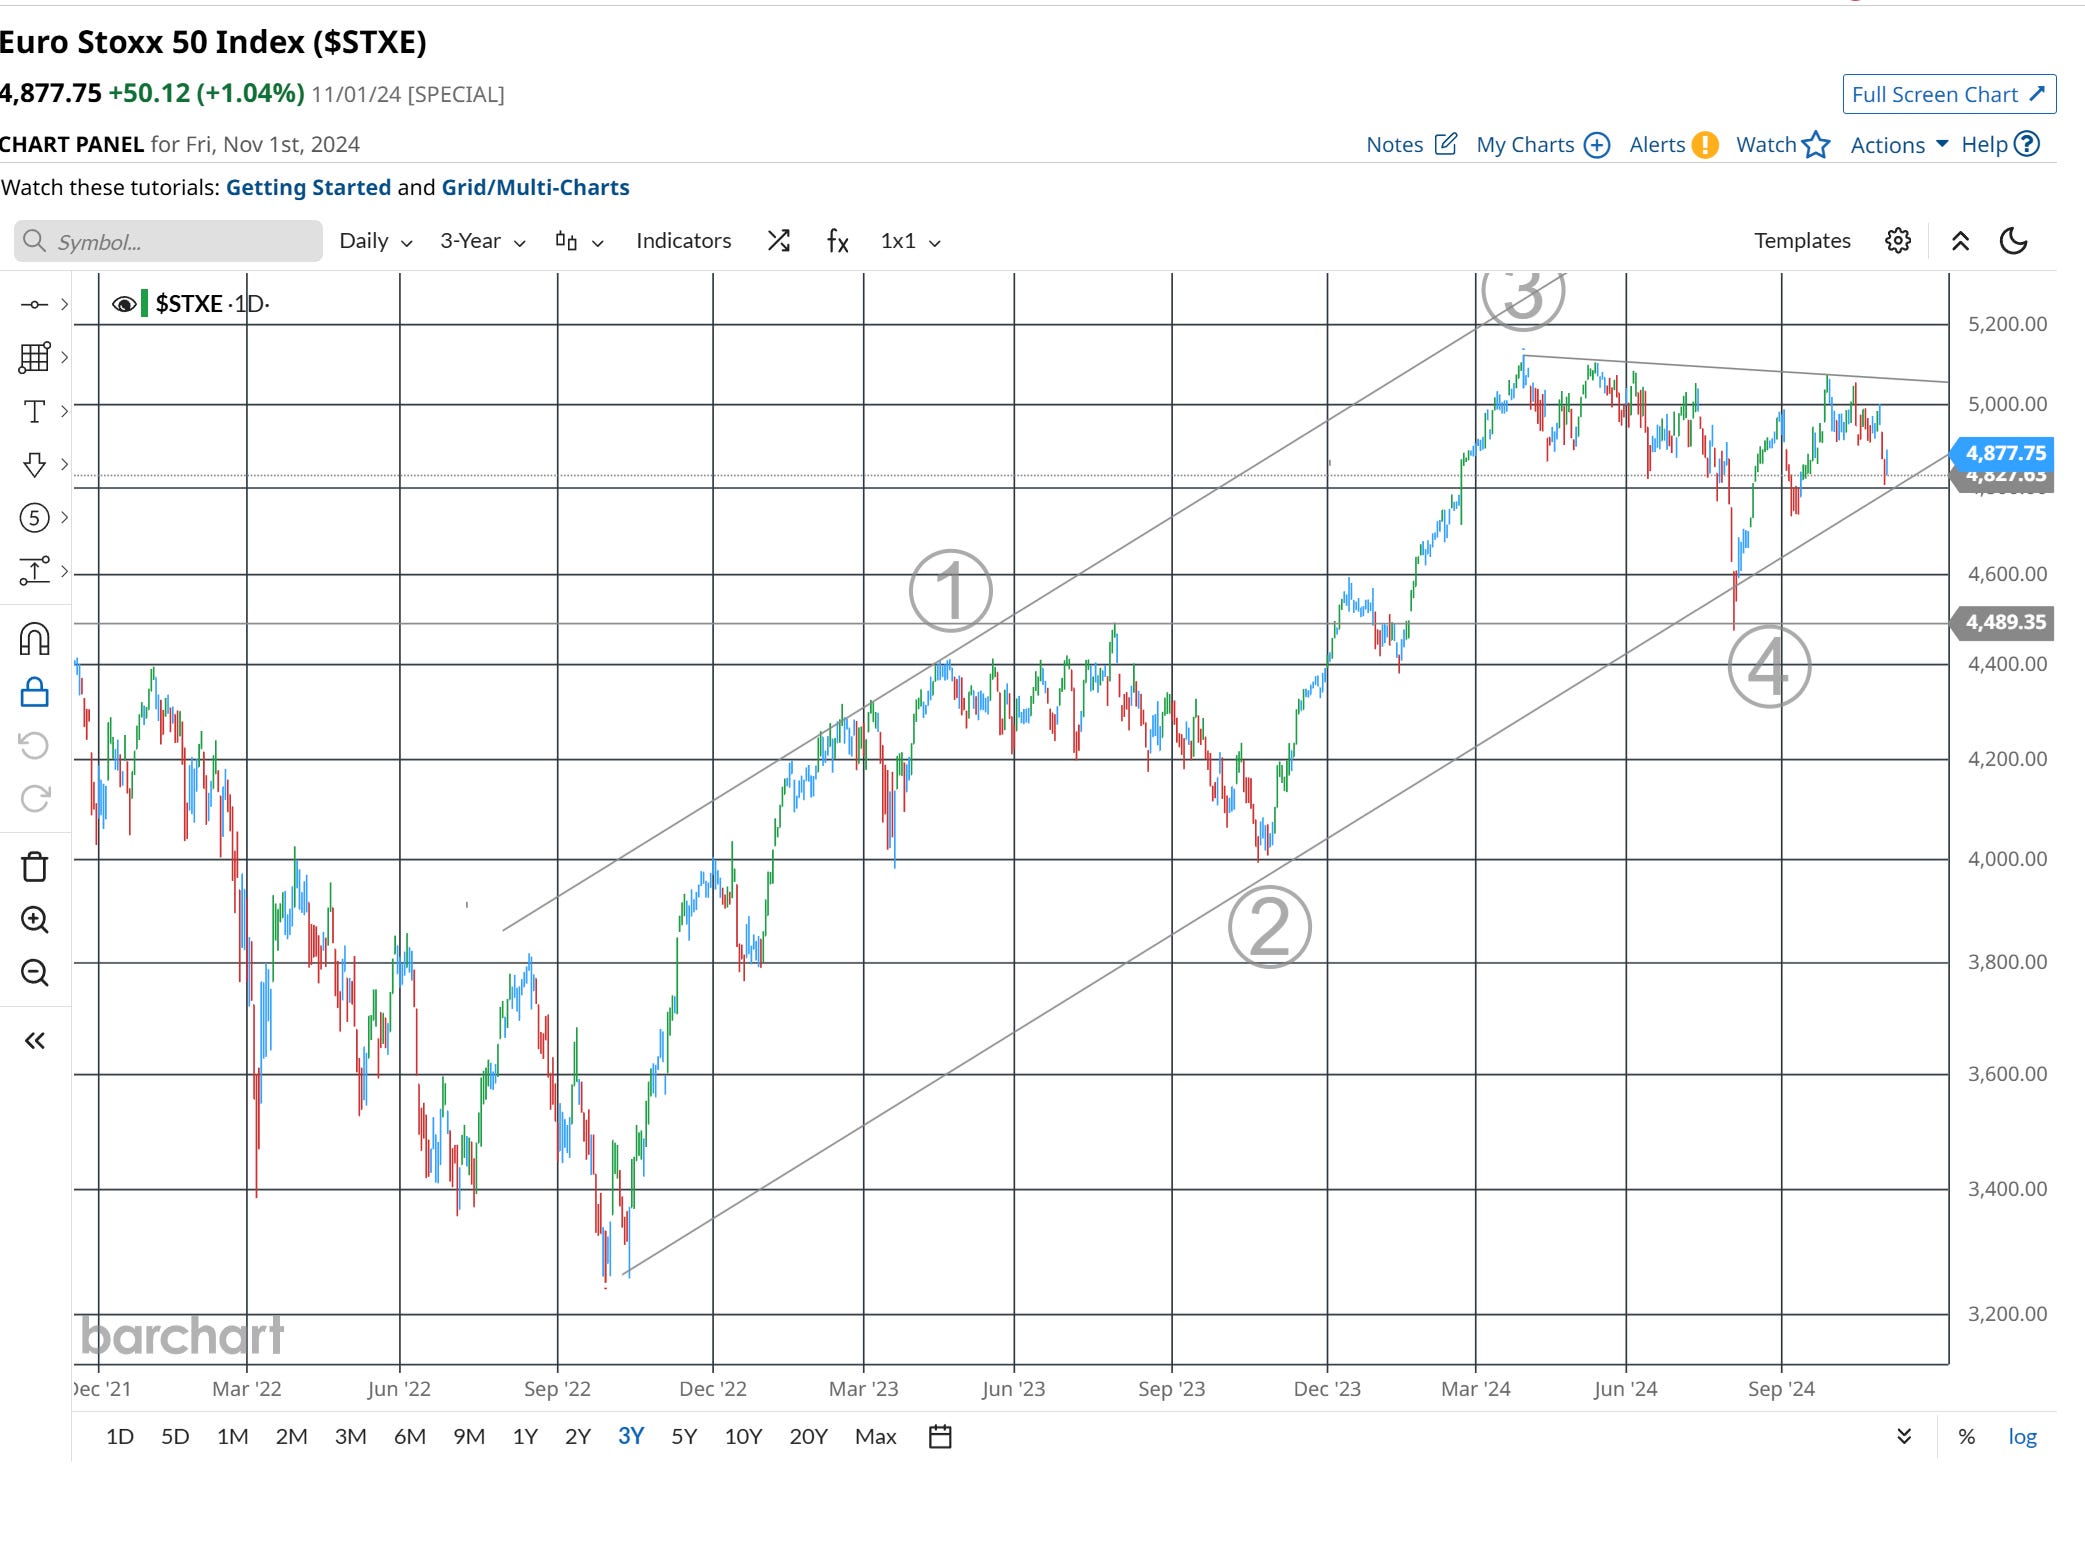
The index may see a new 52-week high, but the move looks like the final move up (for quite some time).
(3) Macro Insights: Trussonomcs 2.0 Ante Portas
The bond market has started to vote early, sending a clear message ahead of the November 5 US presidential and congressional elections. Since the Federal Reserve's September 17-18 meeting, the 10-year US Treasury bond yield has surged by 77 basis points to 4.39%.
This significant increase reflects the Bond Vigilantes' concerns about Fed Chair Jerome Powell's dovish monetary policy and the potential for economic overheating.
Market Reaction and Analysis
On Monday, October 28, 2024, the Treasury announced its marketable borrowing estimates. The projected financing is $546 billion in Q4-2024 and $823 billion during Q1-2025.
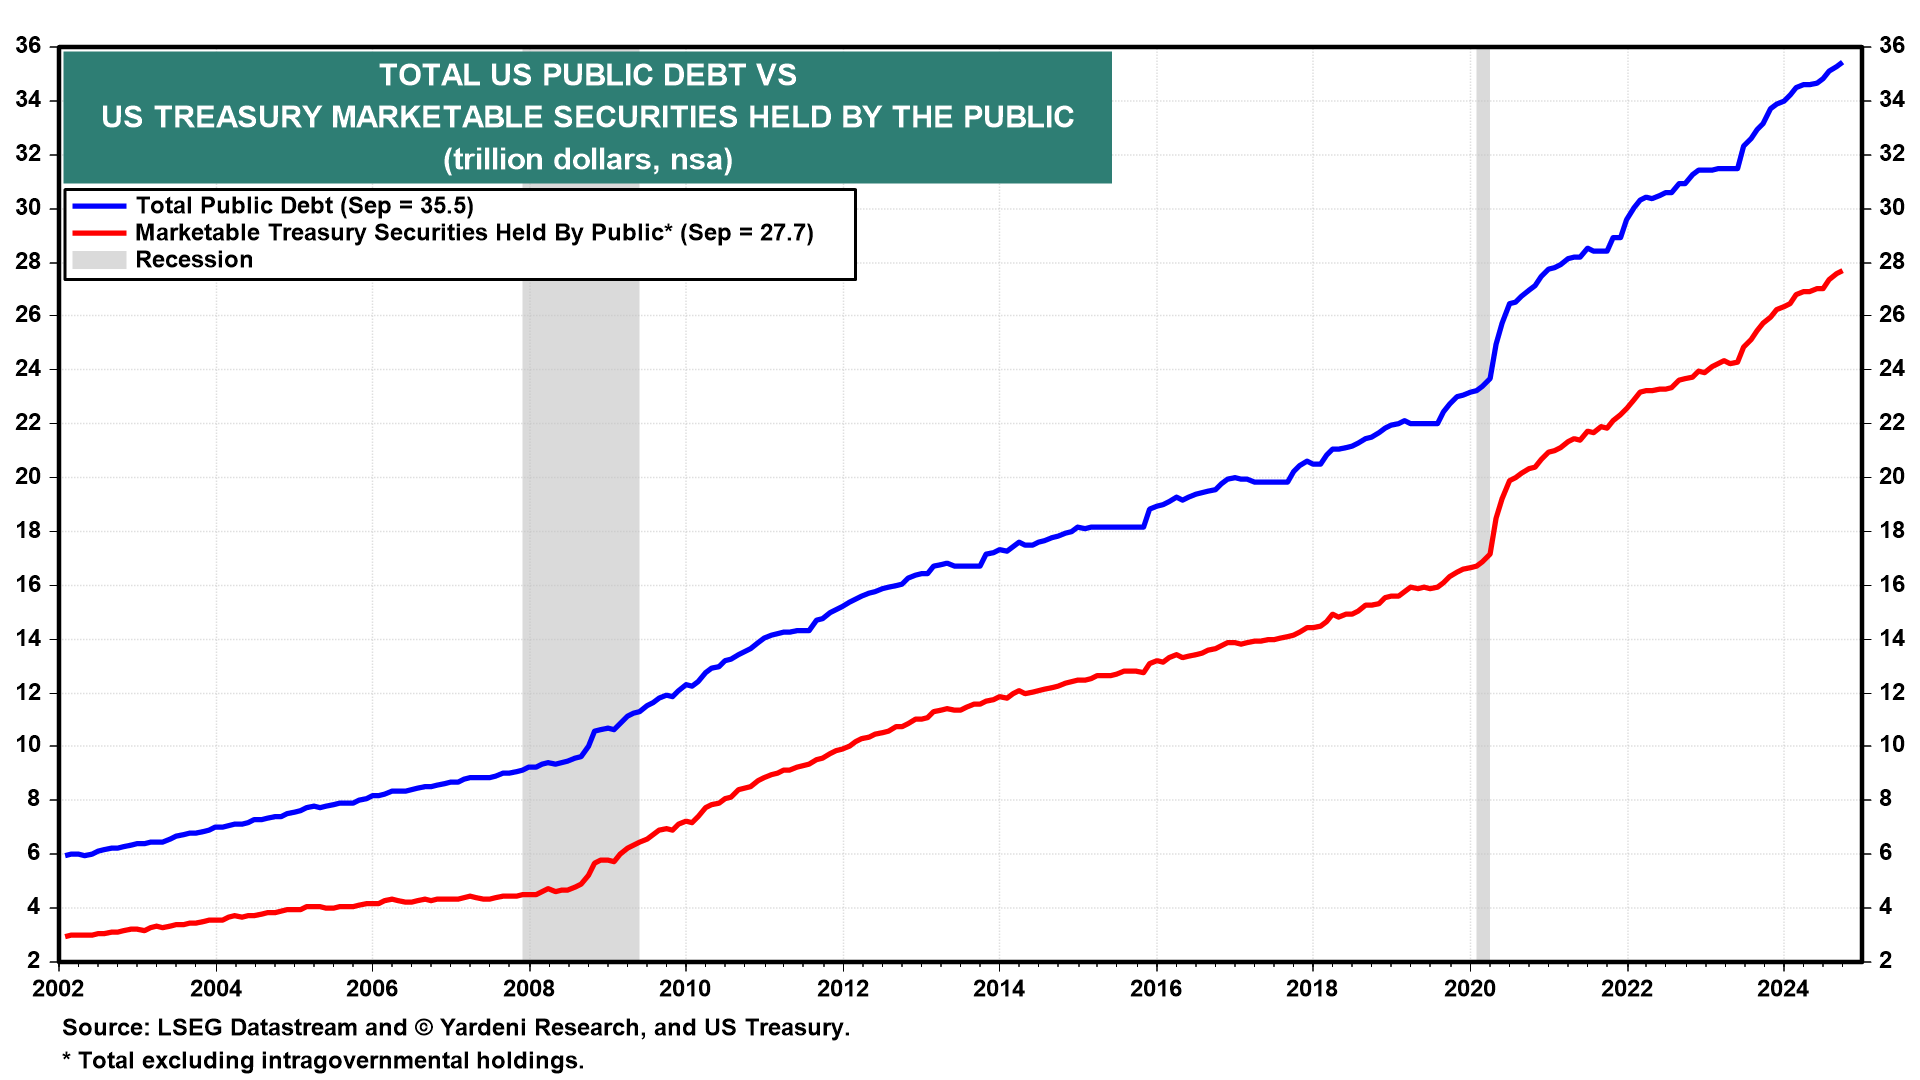
This announcement comes against a staggering national debt, currently at $35.5 trillion. This includes $27.7 trillion of US Treasury marketable debt and $7.2 trillion of intragovernmental holdings.
The latter represents the government's IOUs to itself, primarily resulting from borrowing from public trust funds like Social Security and Medicare.
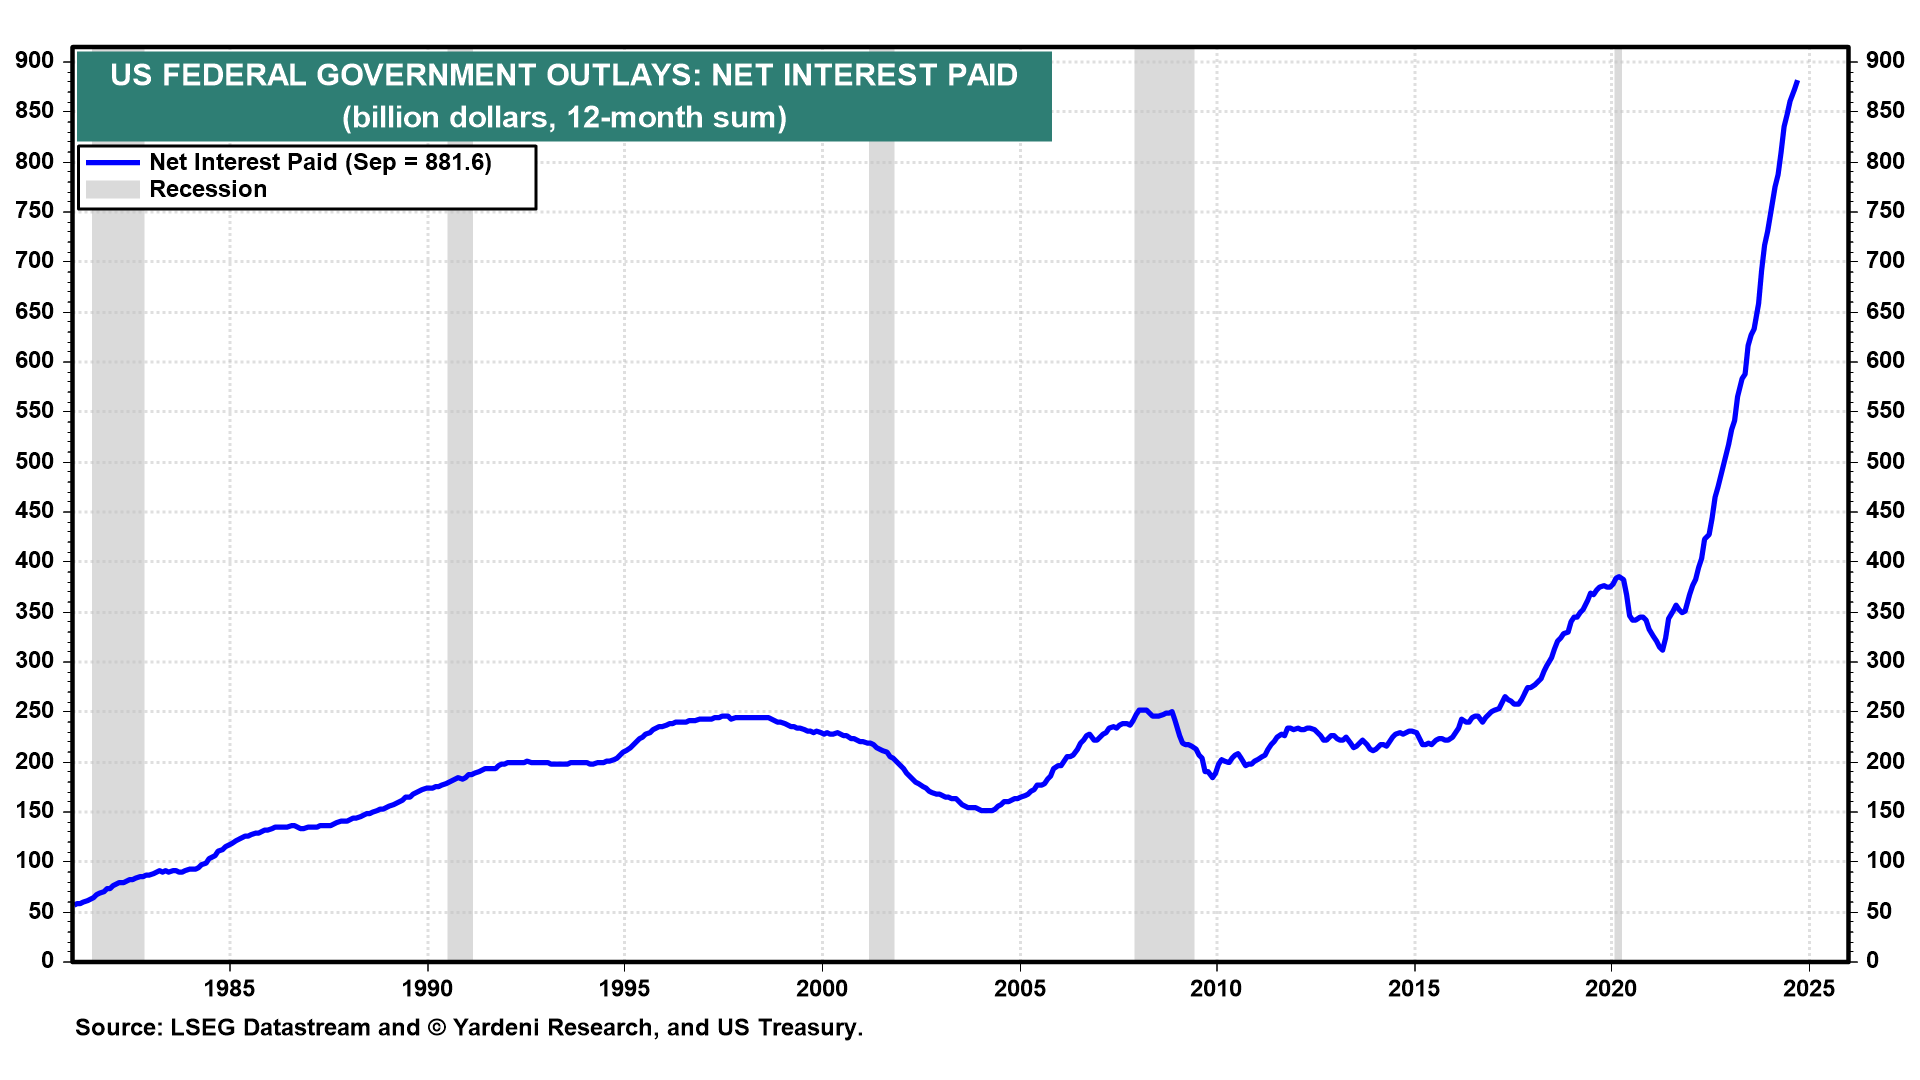
Alarmingly, this debt is projected to expand at an annual rate of over $1.0 trillion solely to cover the net interest outlays of the Treasury.
The Bond Vigilantes appear to be voting against the Fed's recent actions, particularly the 50 basis point rate cut on September 18. Their concern stems from the perception that the economy is already running hot and further easing could lead to overheating.
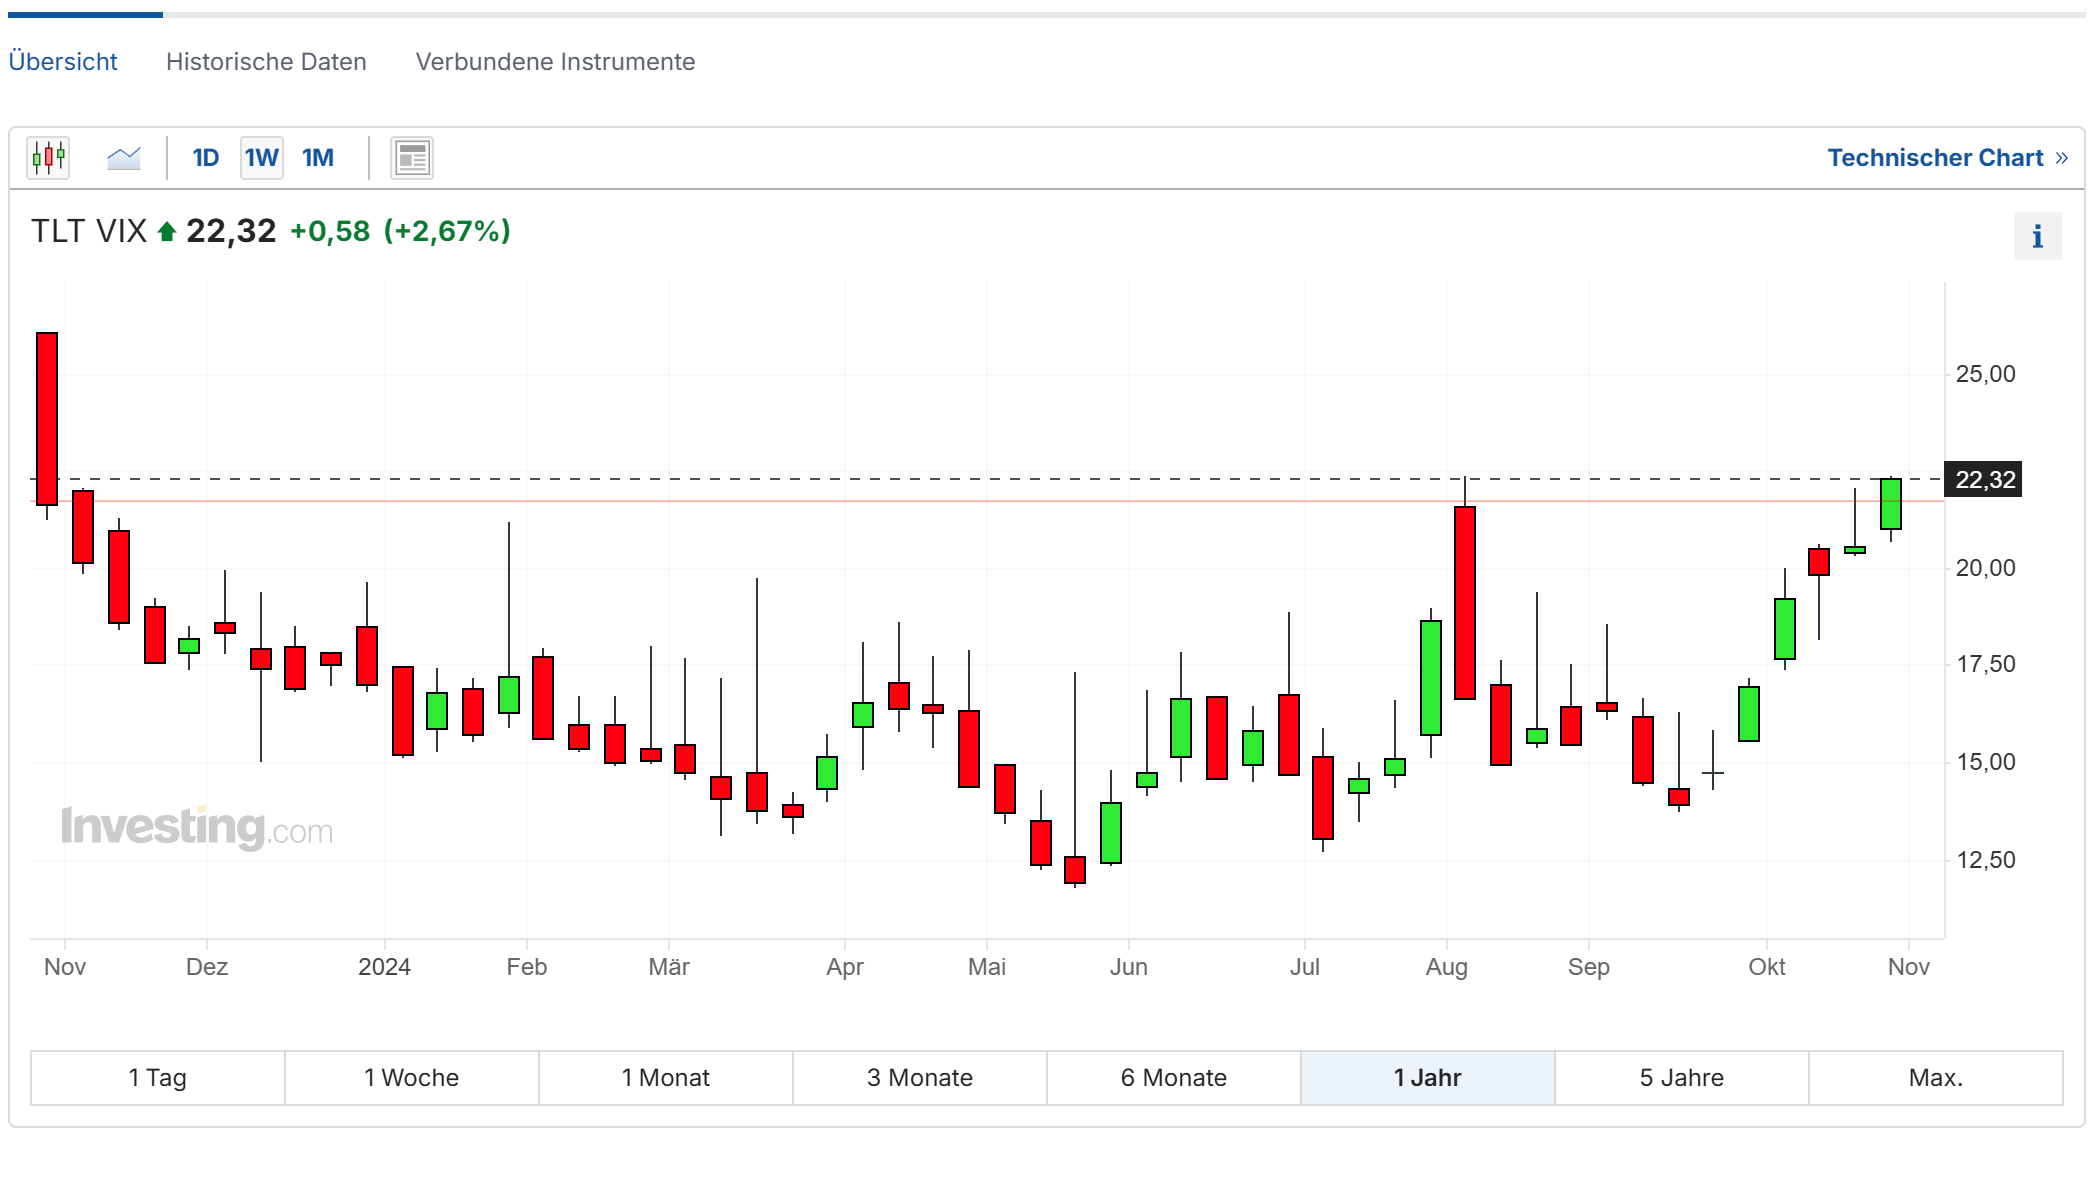
Volatility in the bond markets has risen sharply and reached new highs this week, surpassing the volatility spike seen in early August 2024.
Fiscal Policy Concerns and Challenges
The Bond Vigilantes' reaction may also reflect apprehension about future fiscal policies, regardless of which party wins the upcoming elections. Some are concerned that continued expansionary fiscal policies could further inflate the substantial federal budget deficit and fuel inflation.
The next administration will face significant fiscal challenges, particularly regarding debt servicing:
The next administration will face net interest outlays of over $1 trillion on the ballooning federal debt.
This underscores the growing burden of interest payments on the federal debt, likely influencing future fiscal and monetary policy decisions.
(4) The ETF Portfolio: Some Bigger Changes
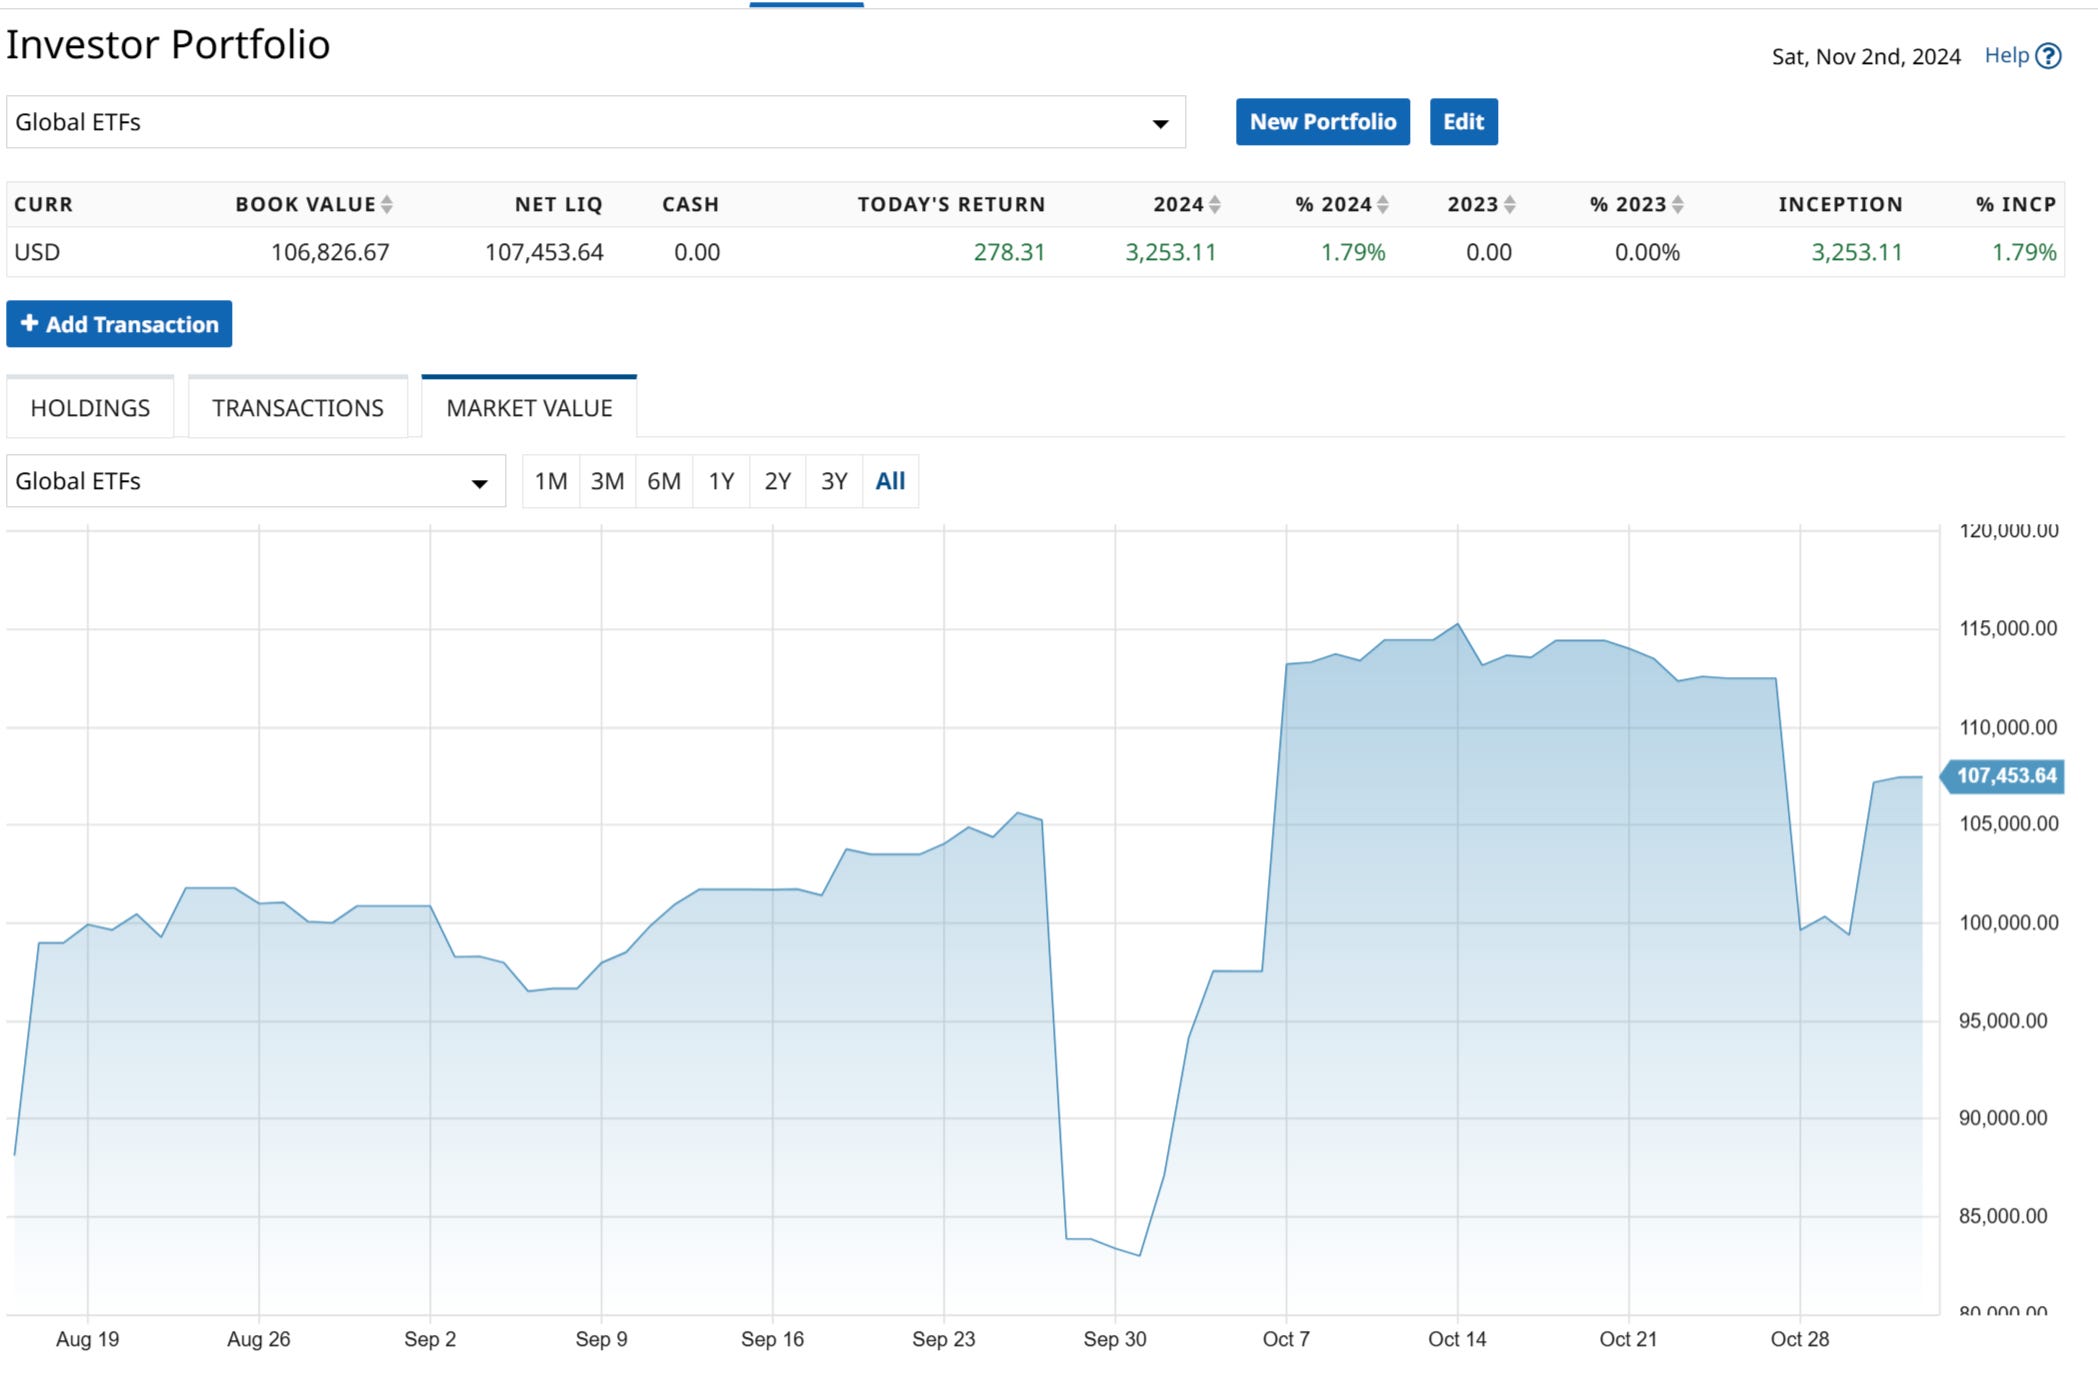
The ETF portfolio has moved lower during the week after reaching an all-time in mid-October. It has still been up since starting on 1 August 2024.
The two Indian ETFs and the China Kranes CSI Internet ETF trade lower from where
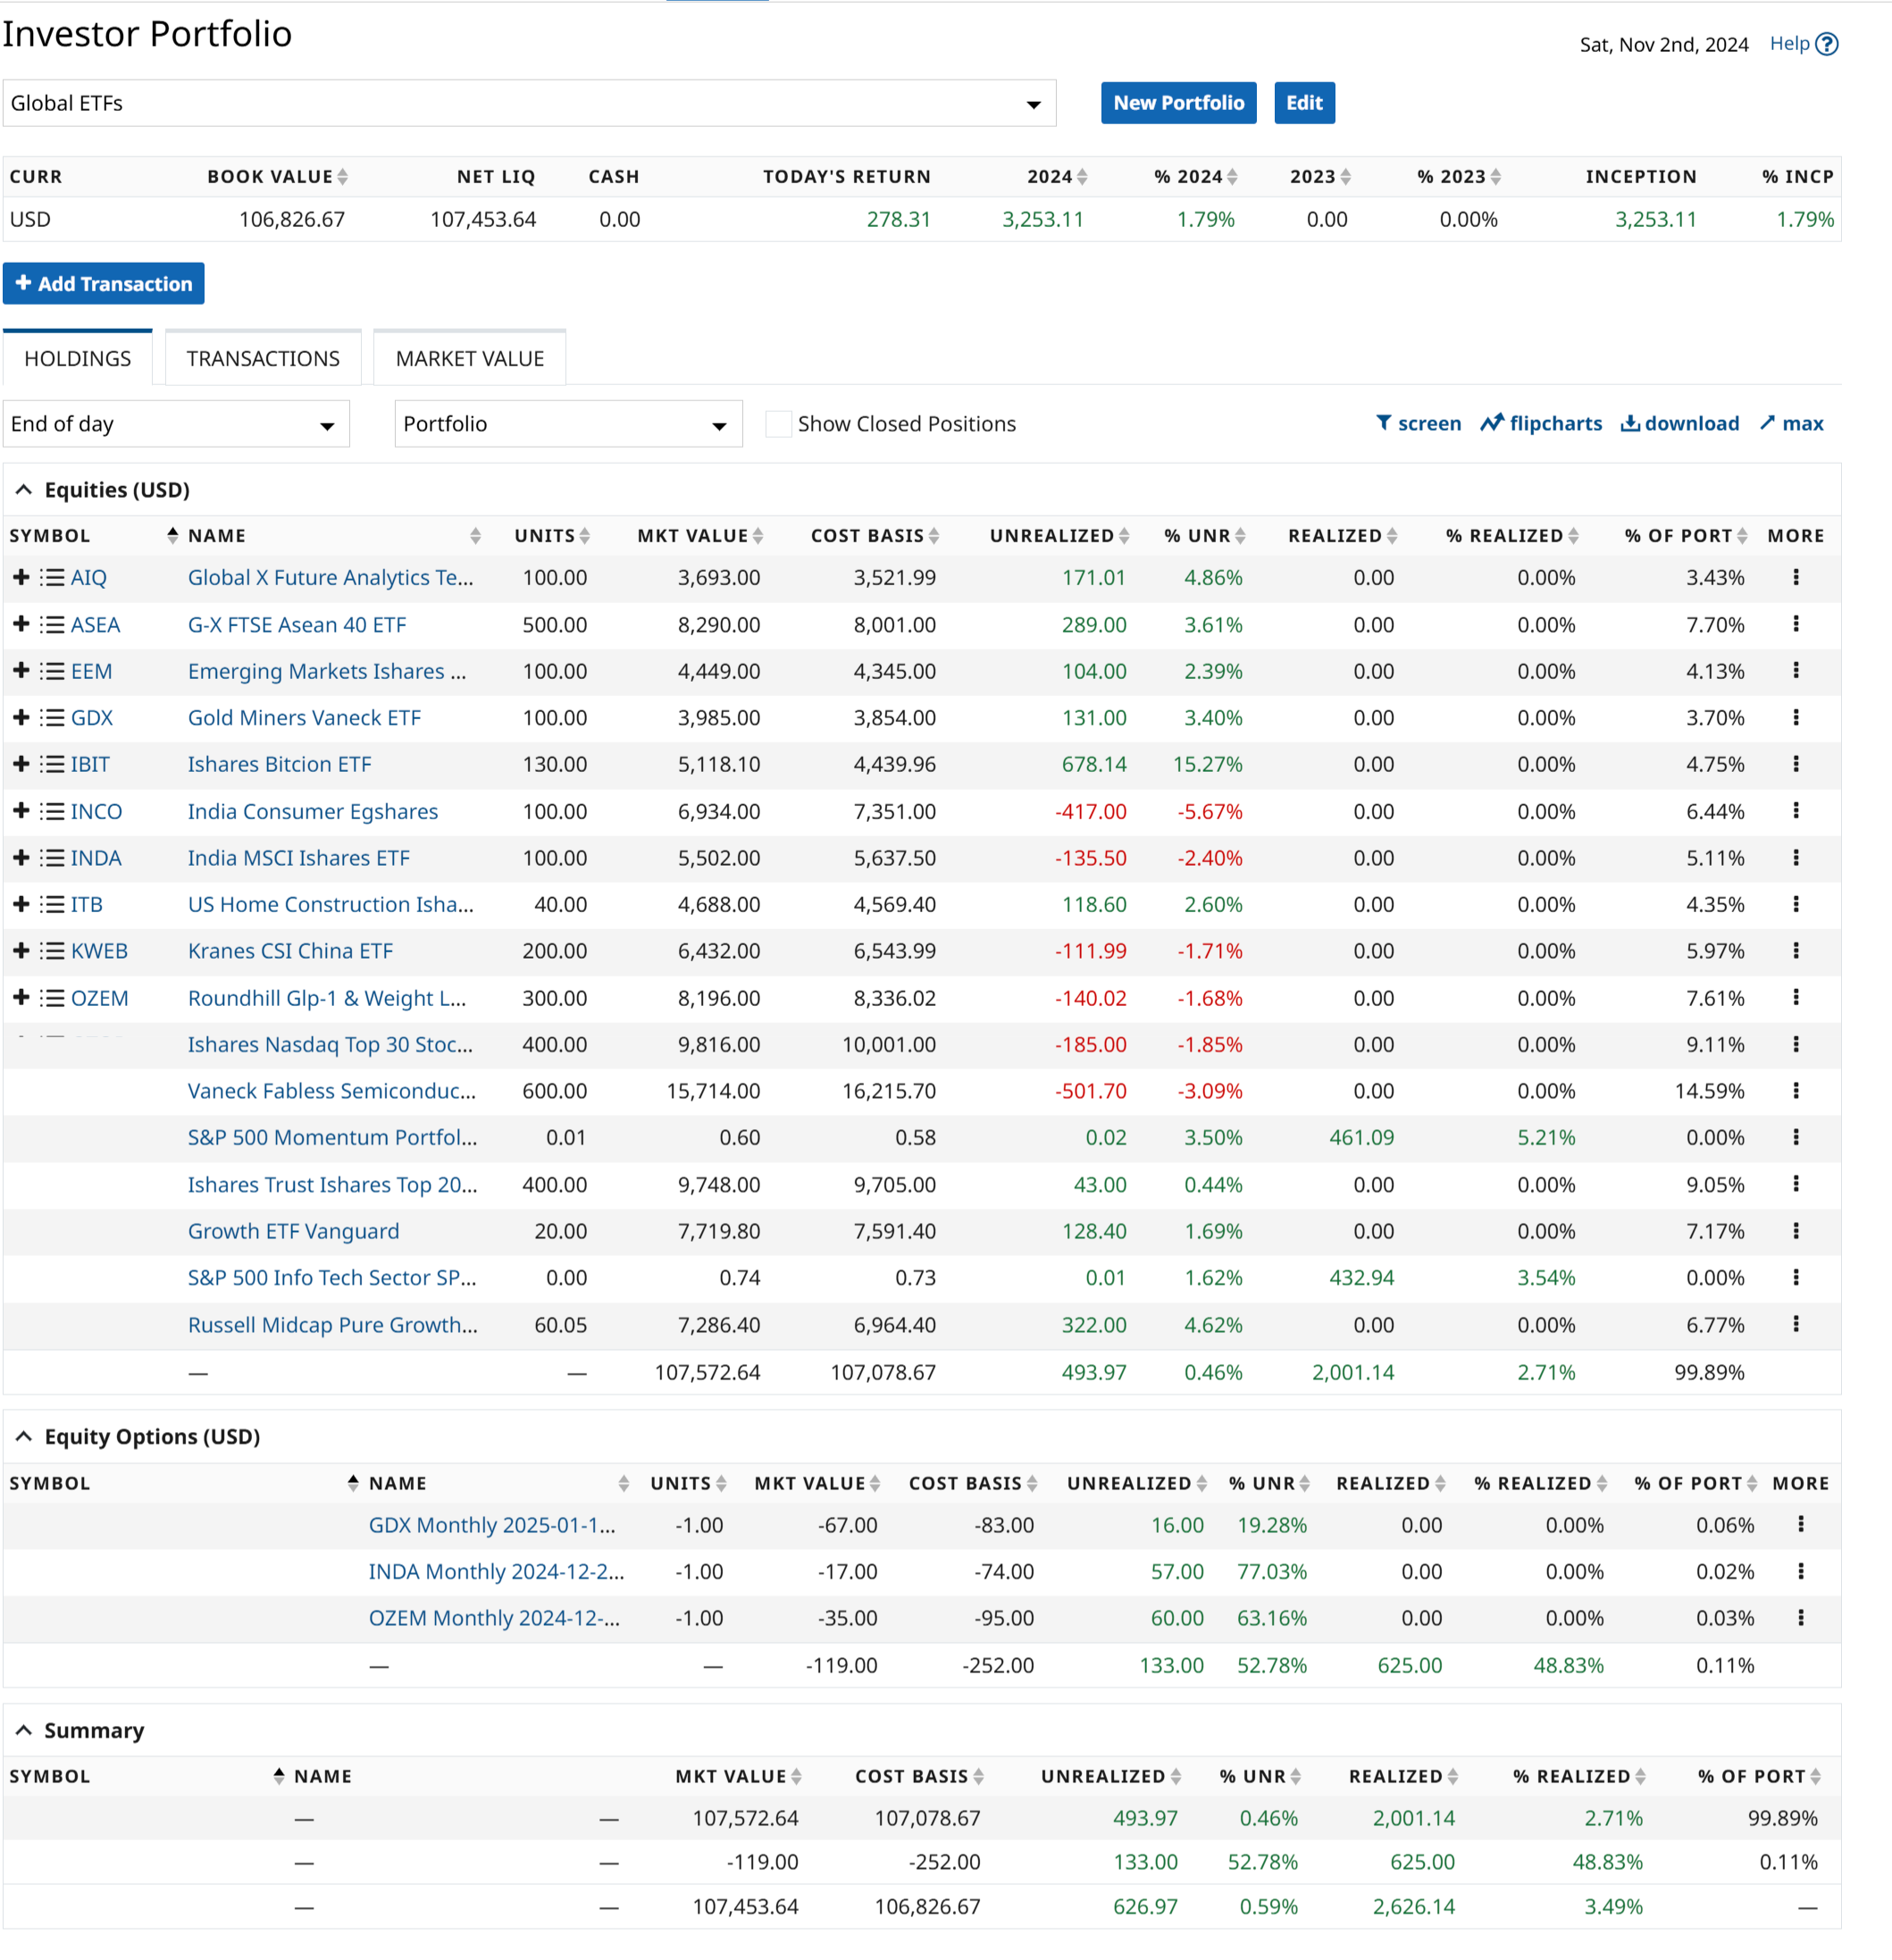
I bought and recommended them. I replaced the traditional VanEck Semi ETF with the new Fabless Semi ETF.
I also added the new Blackrock ETFs focusing on the largest 30 Nasdaq 100 stocks and 20 SP 500 stocks to the portfolio and sold the two US-based tech ETFs I initially bought. I have described the three ETFs in the following section.
(5) This Week's ETF Spotlight: A New Semiconductor ETF
Blackrock has just launched two exchange-traded funds that I have added to the ETF portfolio. VanEck launched a sector ETF, which I have added.
(1) iShares Nasdaq Top 30 Stocks ETF
The iShares Nasdaq Top 30 Stocks ETF (QTOP.O) lets investors hold the 30 biggest non-financial stocks, including mega-cap tech. It has secured backing from the University of California's investing arm.
iShares Nasdaq Top 30 Stocks ETF (QTOP)
Fund Objective: Invests in the 30 largest companies by market capitalization within the Nasdaq 100 index.
Number of Holdings: 30.
Top Three Holdings: Apple (AAPL), Nvidia (NVDA), and Microsoft (MSFT).
Expense Fee: 0.20%.
The expense ratio is 0.20%.
(2) iShares Top 20 U.S. Stocks ETF
The iShares Top 20 U.S. Stocks ETF offers access to the 20 largest U.S. companies.
iShares Top 20 U.S. Stocks ETF (TOPT)
Fund Objective: Invests in the 20 largest U.S. companies by market capitalization within the S&P 500 index.
Number of Holdings: 20.
Top Three Holdings: Apple (AAPL), Nvidia (NVDA), and Microsoft (MSFT).
Expense Fee: 0.20%.
The top 20 companies in the S&P 500 have contributed to more than two-thirds of the index's returns over the past three years.
The iShares Top 20 U.S. Stocks ETF (TOPT) and iShares Nasdaq Top 30 Stocks ETF (QTOP) are rebalanced quarterly.
This schedule allows the funds to adjust their holdings according to the top U.S. and Nasdaq-listed companies' current market values and rankings in their respective portfolios, ensuring alignment with their indices. These quarterly adjustments help the ETFs maintain their target exposure to the largest companies within their focus areas.
(3) VanEck Fabless Semiconductor ETF
The VanEck Fabless Semiconductor ETF (SMHX) is a new offering focusing exclusively on fabless semiconductor companies. These firms design, develop, and market chips while outsourcing manufacturing to third-party foundries like Taiwan Semiconductor.
This business model, which emerged in the 1980s, allows companies to concentrate on innovation and design without the massive capital expenditure required for manufacturing facilities. SMHX tracks the MarketVector US Listed Fabless Semiconductor Index, offering a more targeted approach than its broader counterpart, SMH.
To be included, companies must generate at least 50% of their revenue from fabless semiconductor operations. The ETF employs a modified market-cap-weighted methodology and rebalances quarterly. Key features of SMHX include:
Concentrated portfolio: Top 10 holdings represent 73.92% of total assets.
Top holdings: Nvidia (21.87%), Broadcom (14.78%), and Astera Labs (6.67%).
Expense ratio: 0.35%, matching SMH.
Current AUM: $9.43 million.
Average daily trading volume: Around 27,000.
There are no dividend distributions at present.
SMHX has shown promising momentum, up close to 10% since early October 2024. While it shares some holdings with SMH, SMHX's portfolio includes pure-play design companies that are absent from its broader counterpart.
The ETF's launch and early success reflect growing investor recognition of the fabless model's advantages. However, investors should note that both SMHX and SMH have a significant Nvidia-heavy skew. Those looking to mitigate single-stock risk in the semiconductor space might consider an equal-weighted fund as an alternative.

The ETF maintains a concentrated portfolio structure, similar to its older sibling, with its top 10 holdings representing 73.92% of total assets. While both funds feature Nvidia as their top holding, SMHX has a 21.87% allocation.
The remaining holdings reflect SMHX's fabless focus, with Broadcom (AVGO) at 14.78% and Astera Labs (ALAB) at 6.67%. Other vital positions entail Advanced Micro Devices (AMD) (4.66%), Synopsys (SNPS) (4.68%), Qualcomm (QCOM) (4.59%), Marvell Technology (MRVL) (4.49%), Arm Holdings (ARM) (4.12%), Monolithic Power Systems (MPWR) (4.10%), and Cadence Design Systems (CDNS) (3.90%).
SMHX's portfolio includes pure-play design companies that are absent from its broader counterpart.
