The editor’s charts put global and US stocks next on the line. The Nasdaq 100 fund rose 3.6 percent to 679.89 and sits on support at 662, about 6 percent above the rising line that has carried it since the 2022 low; the S&P 500 and the two world funds are in no such danger, inside the channels they have held since that low. The chips bounced 9.4 percent and sit in what the editor’s count reads as a fourth-wave consolidation; Nvidia fell 12.8 percent to a one-year low as its chief executive resigned. A hot inflation report took the ten-year back to 5.15 percent. Eight print windows closed, and five paid.
1 · This Week’s Action
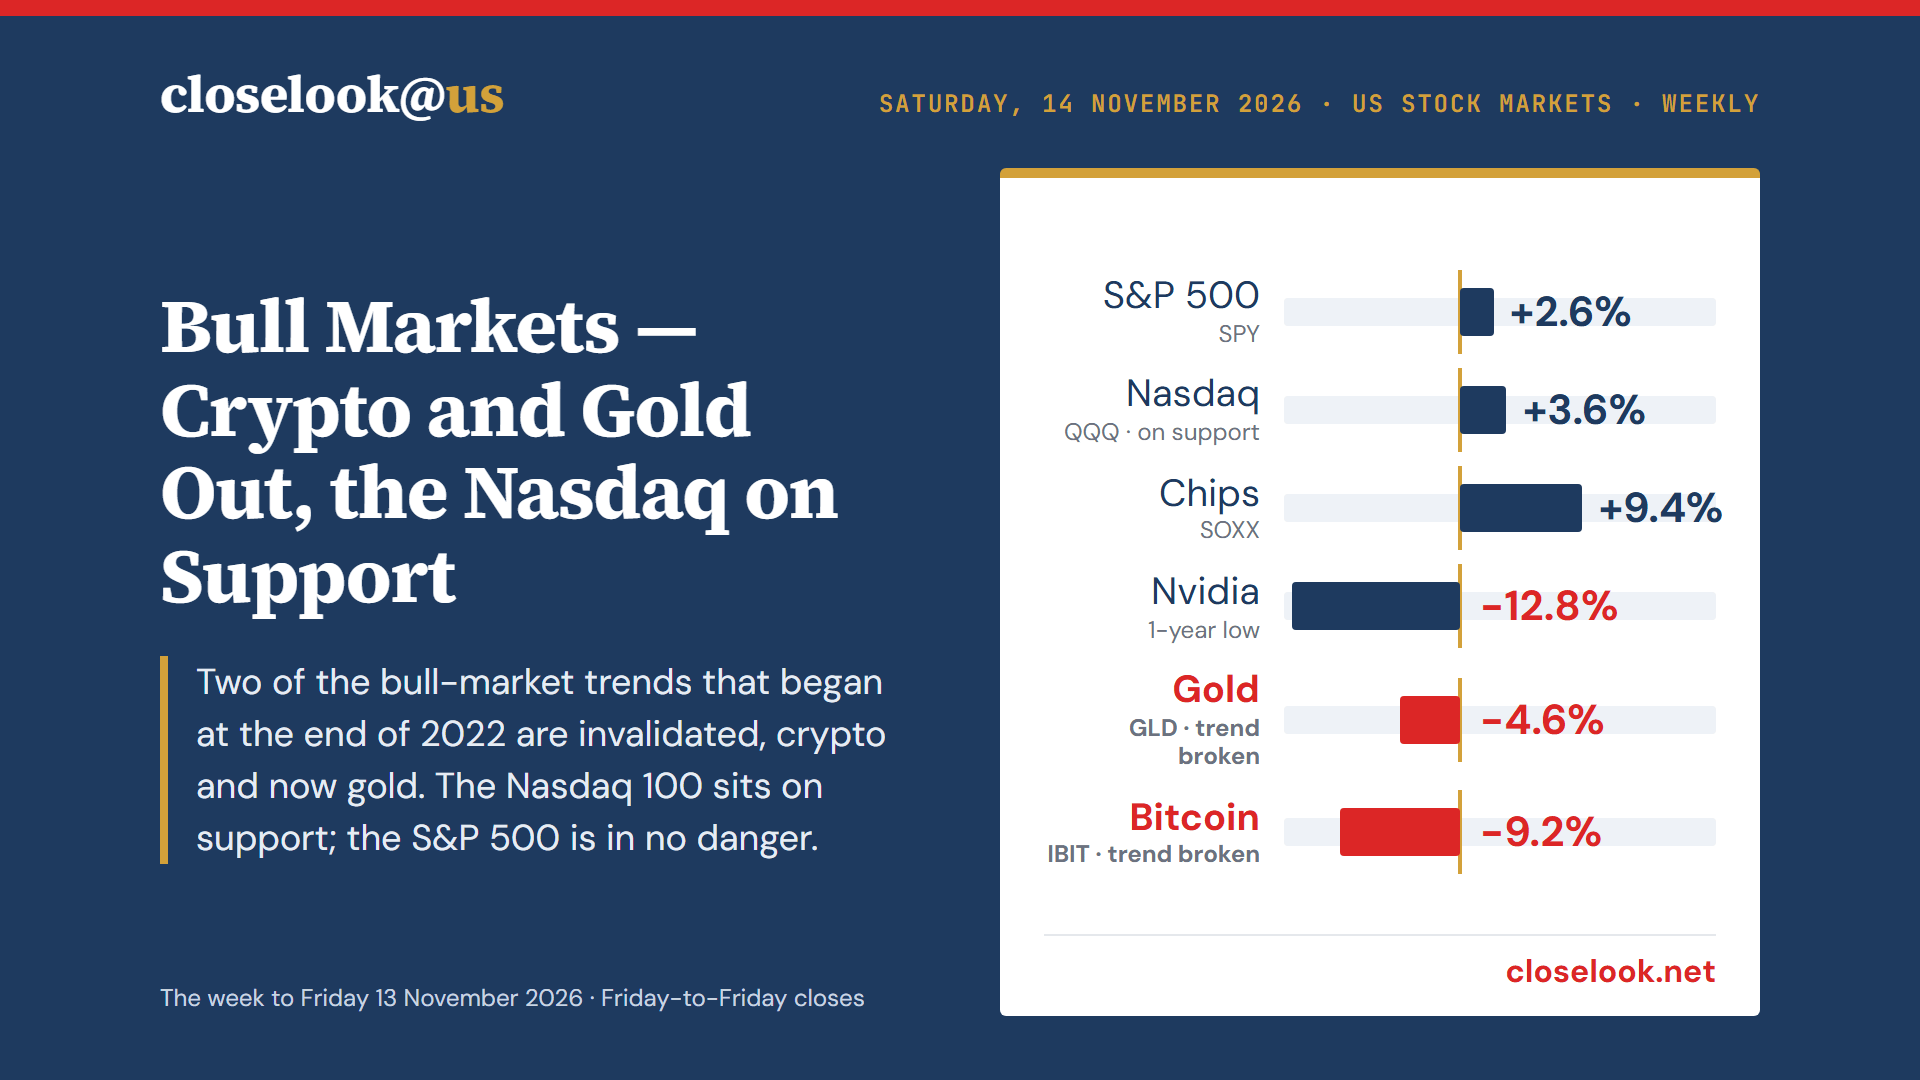
Two of the bull markets that began at the end of 2022 have lost their trends; the stock market’s has not. Crypto lost its rising line earlier in the year and has fallen in a channel since. This week gold followed: the fund fell 4.58% to 355.45, after 354.89 on Thursday, its lowest close in a year, and out of the channel that carried it from the 2022 low. The editor’s charts put global and US stocks next on the line. The Nasdaq 100 fund rose 3.63% to 679.89 and sits on support; the S&P 500 is in no such danger. §3 has the charts. First, the tape.
The index. The Nasdaq 100 rose 3.53% to 27,944 — back above the July low close of 27,192, still under the September low close of 28,938 and 10.5% under its October 6 record. The fund closed at 679.89, 5.3% under its 50-day average and 0.3% under its 200-day — on the long line, not above it. The S&P 500 rose 2.51% to 7,562, 3.3% under its record of 7,819; the fund closed at 754.37, 1.3% under its 50-day and 3.1% above its 200-day.
Monday and Wednesday did the work. The Nasdaq 100 fund walked +3.5%, −0.7%, +2.3%, −0.3%, −1.2%; the S&P fund +2.4%, −0.4%, +1.3%, −0.4%, −0.4%; the chip fund +7.5%, −0.1%, +6.0%, −0.3%, −3.7%. Monday was the S&P’s best day since April. Thursday and Friday both closed lower. §2 has the order.
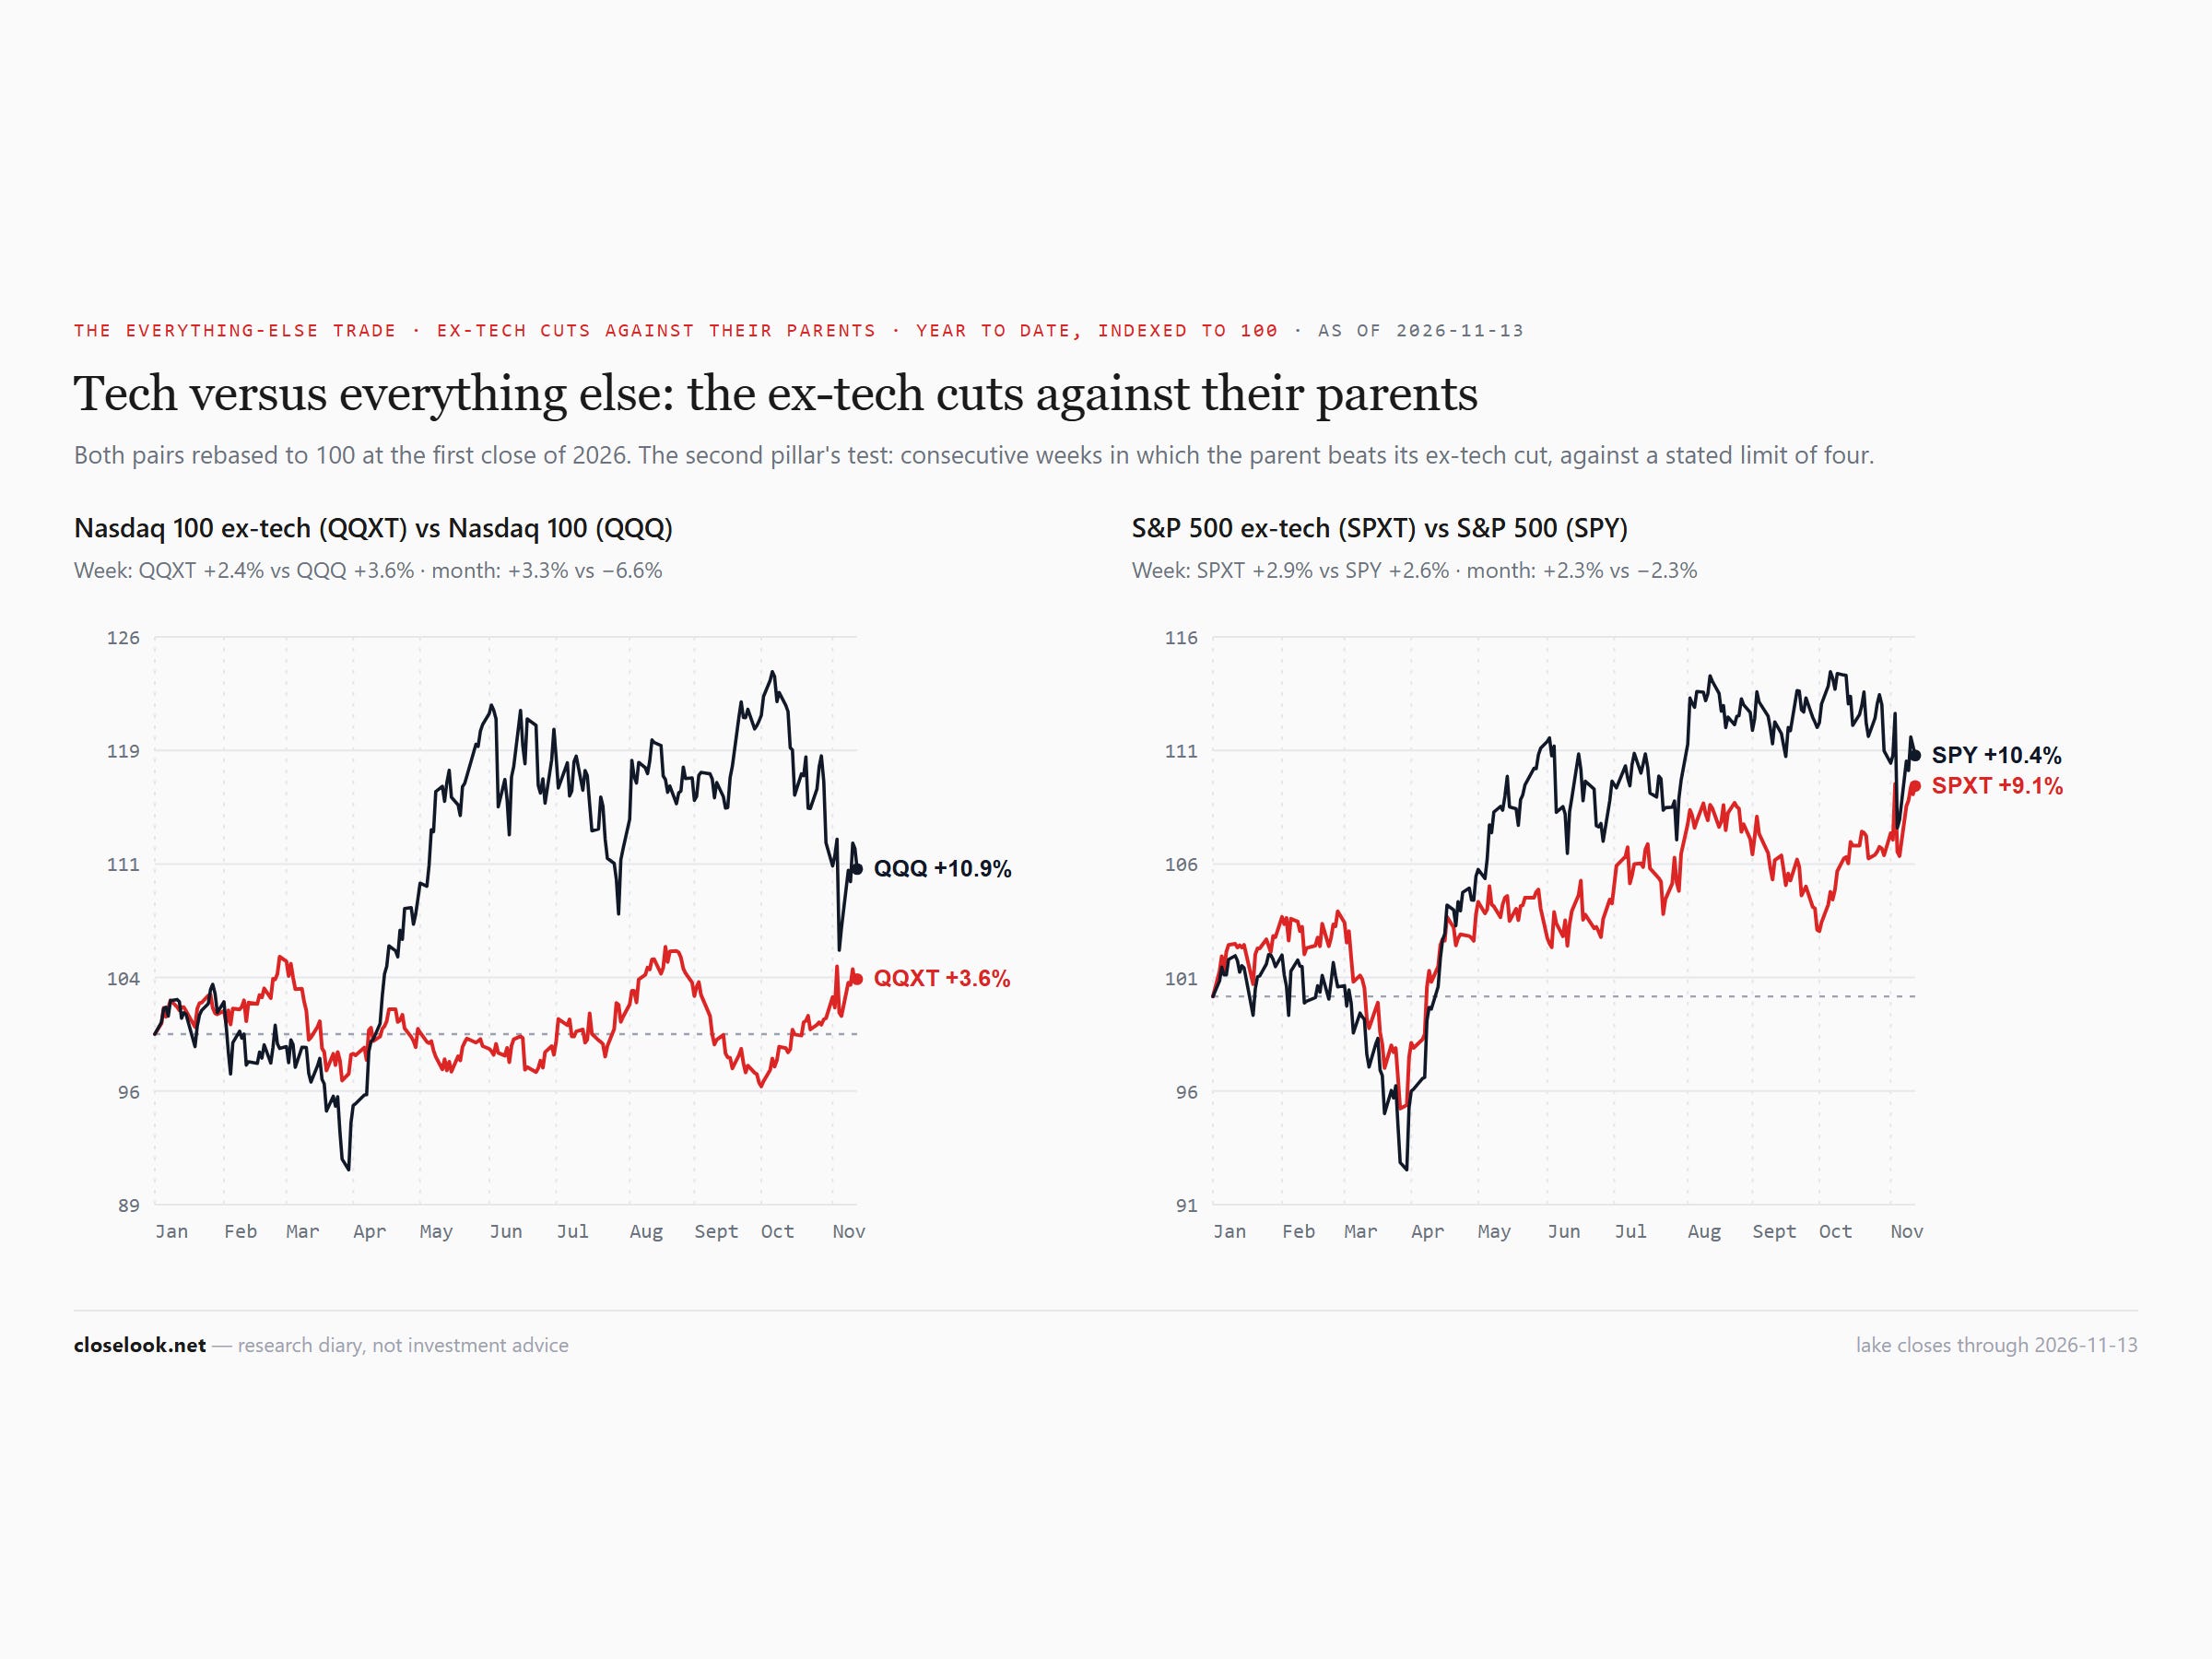
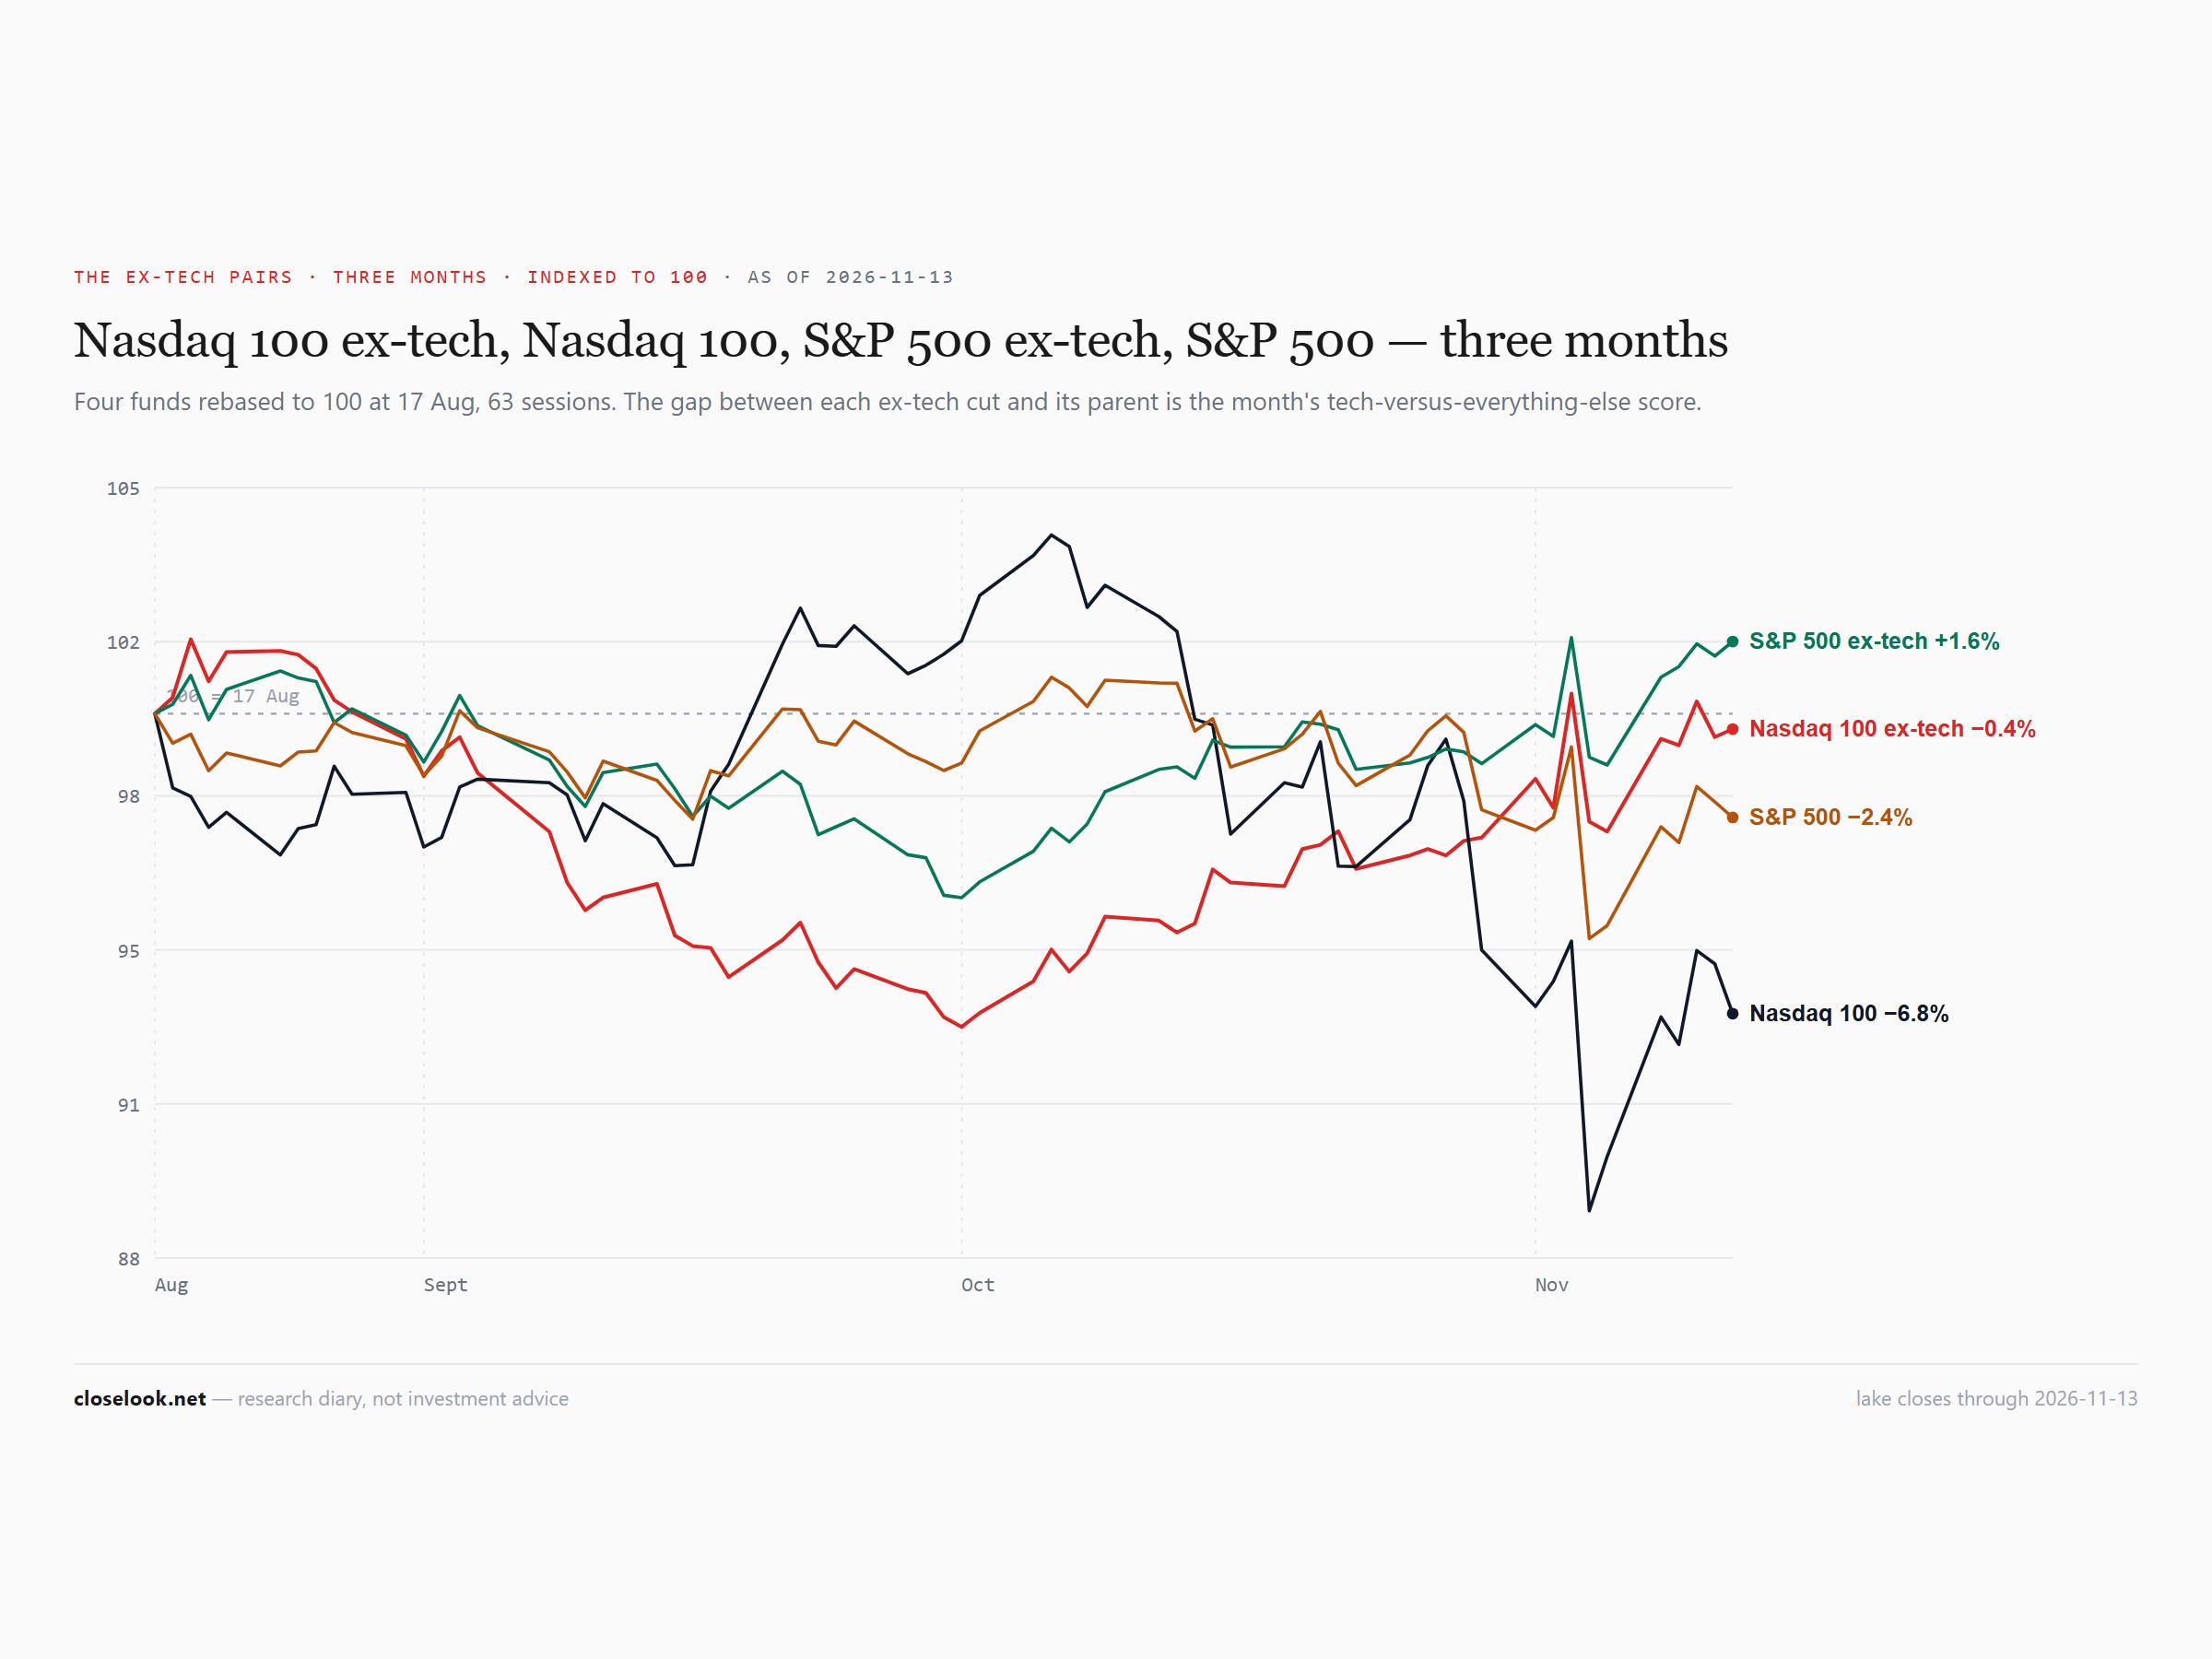
The average stock kept its lead. The equal-weight S&P rose 2.37% to 221.16, 2.9% above its 50-day and 5.9% above its 200-day, and is +15.5% on the year against +10.6% for the S&P fund. It sits 1.0% under its high close of the past year, 223.33 on 4 November. Small caps rose 1.41%, still just under both averages. The S&P without tech rose 2.85%; the Nasdaq 100 without tech 2.40%. The Magnificent Seven fund rose 1.67% to 68.66, less than the S&P: Tesla +8.9%, Meta +5.2%, Apple +4.1%, Alphabet +3.9%, Amazon +2.8%; Microsoft −1.3%; Nvidia −12.8%. The S&P without the Seven rose 3.99%.
Health care and staples against tech
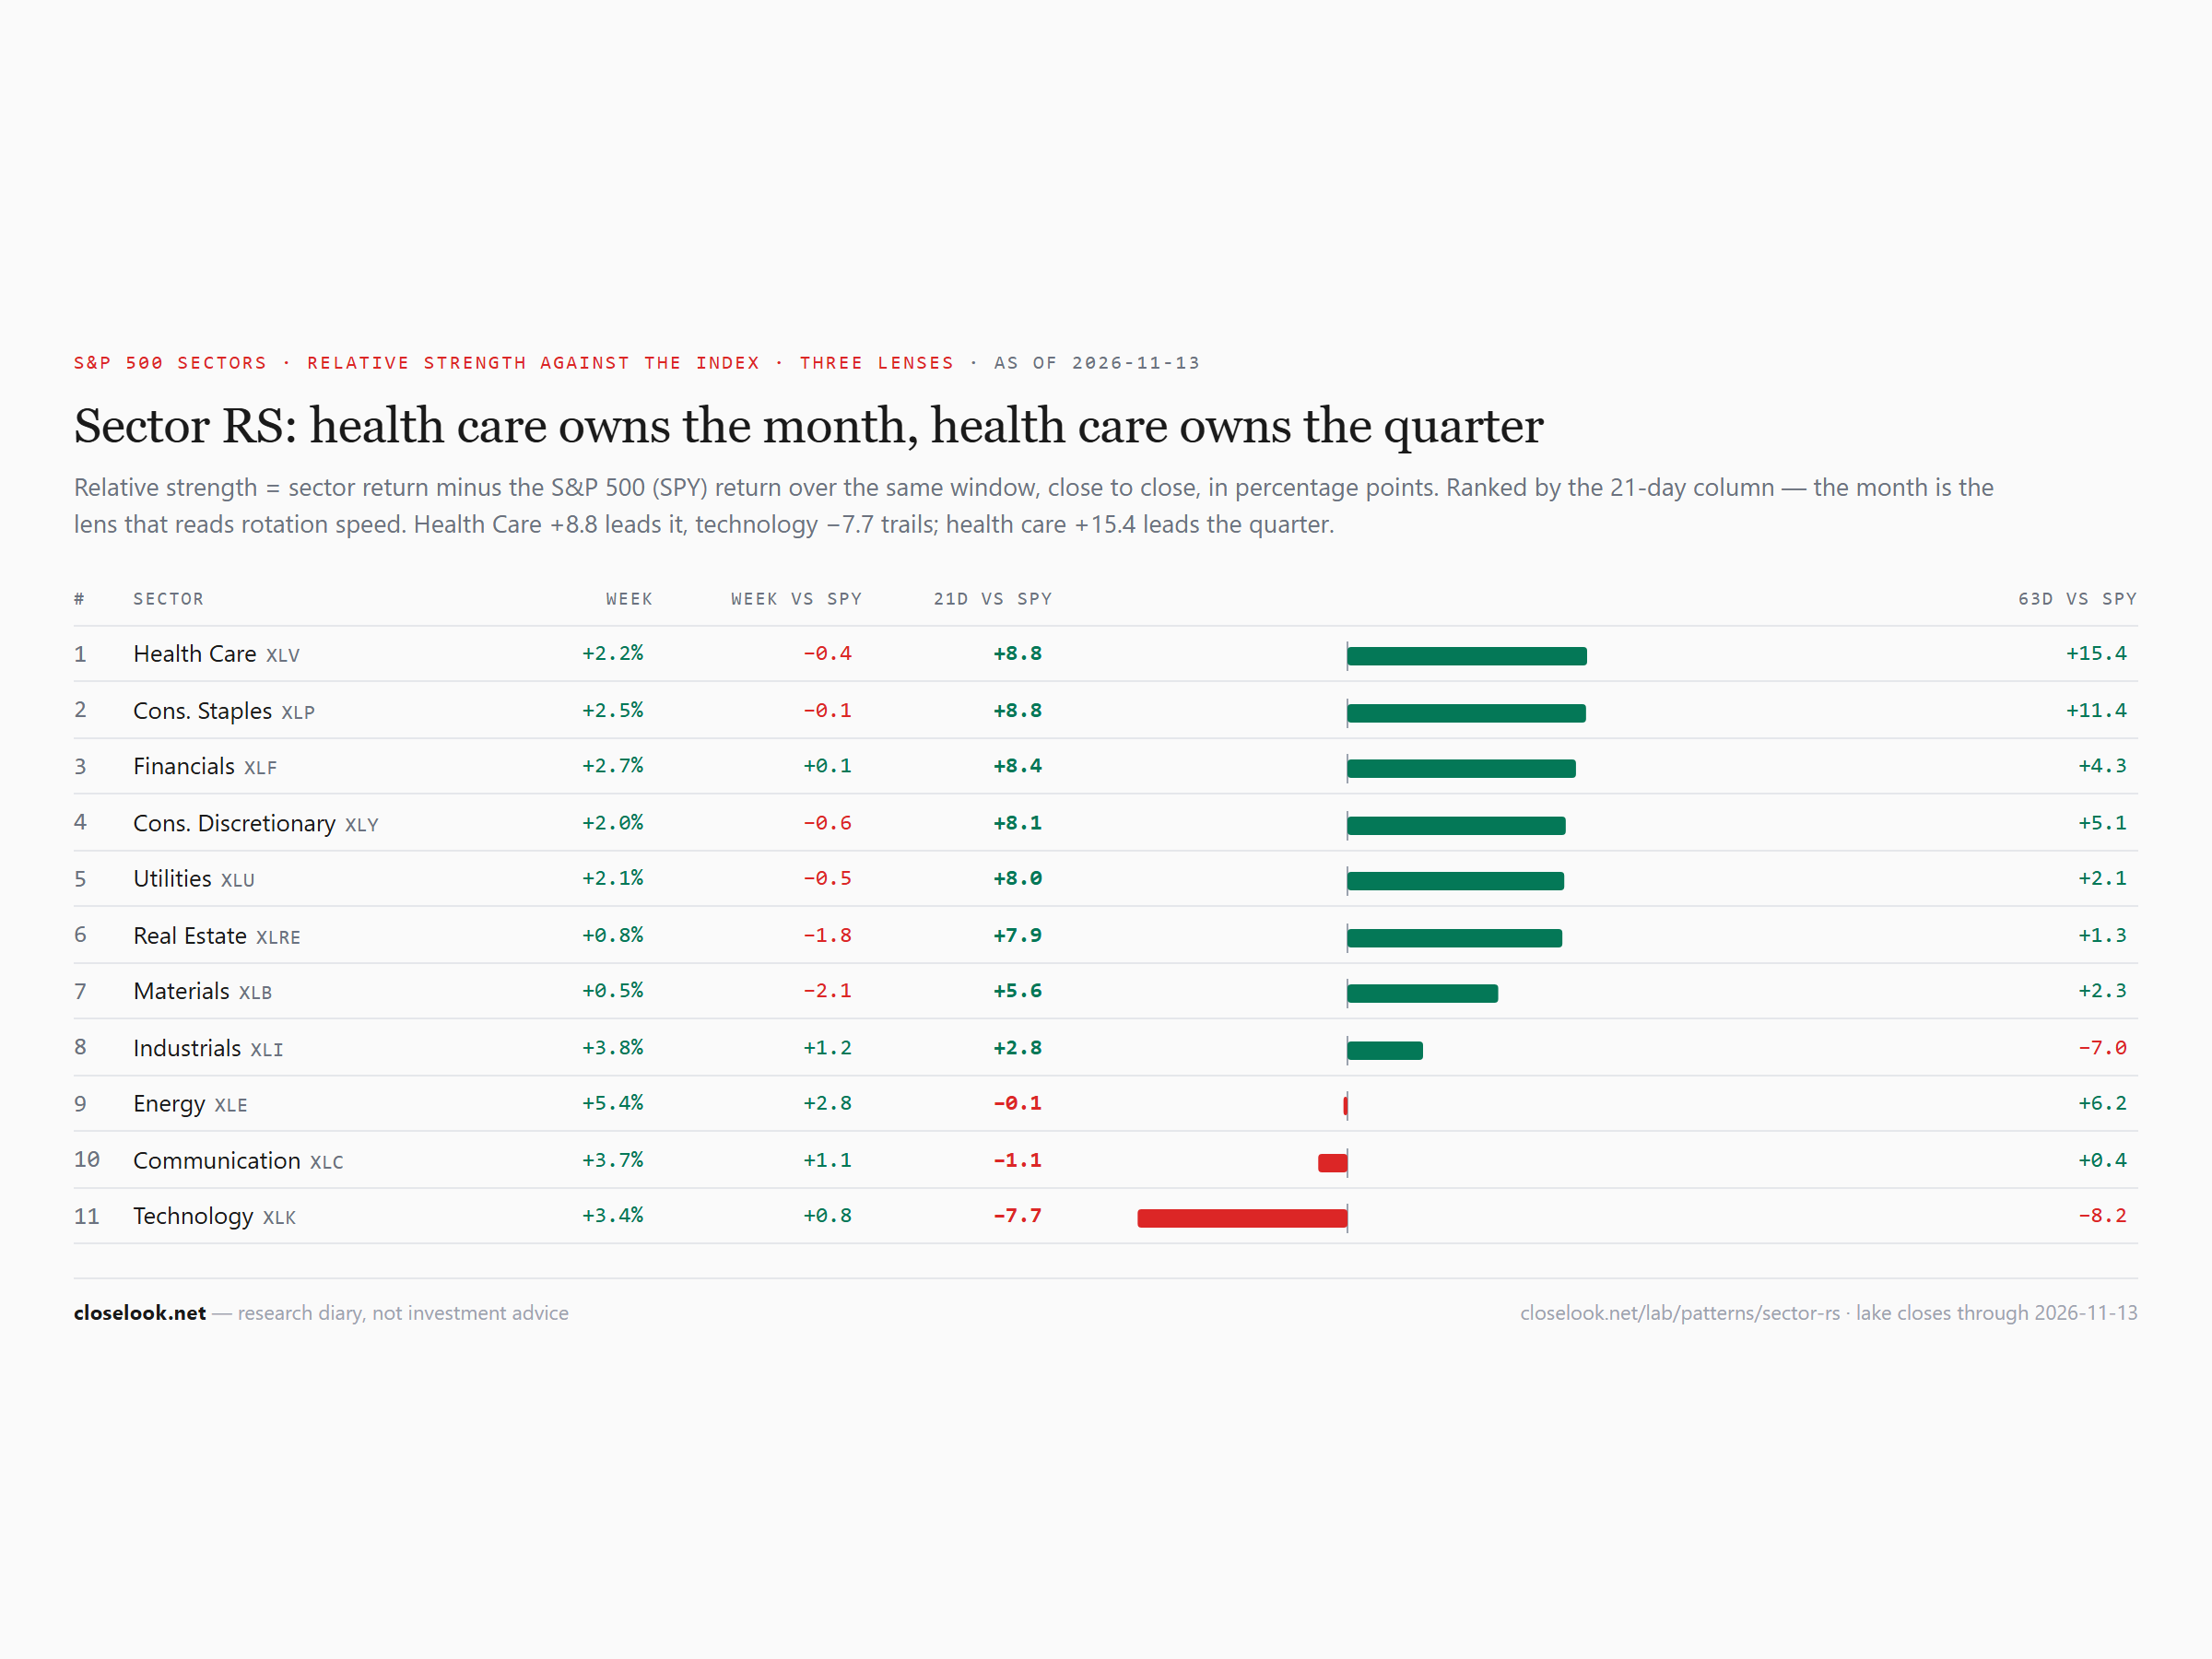
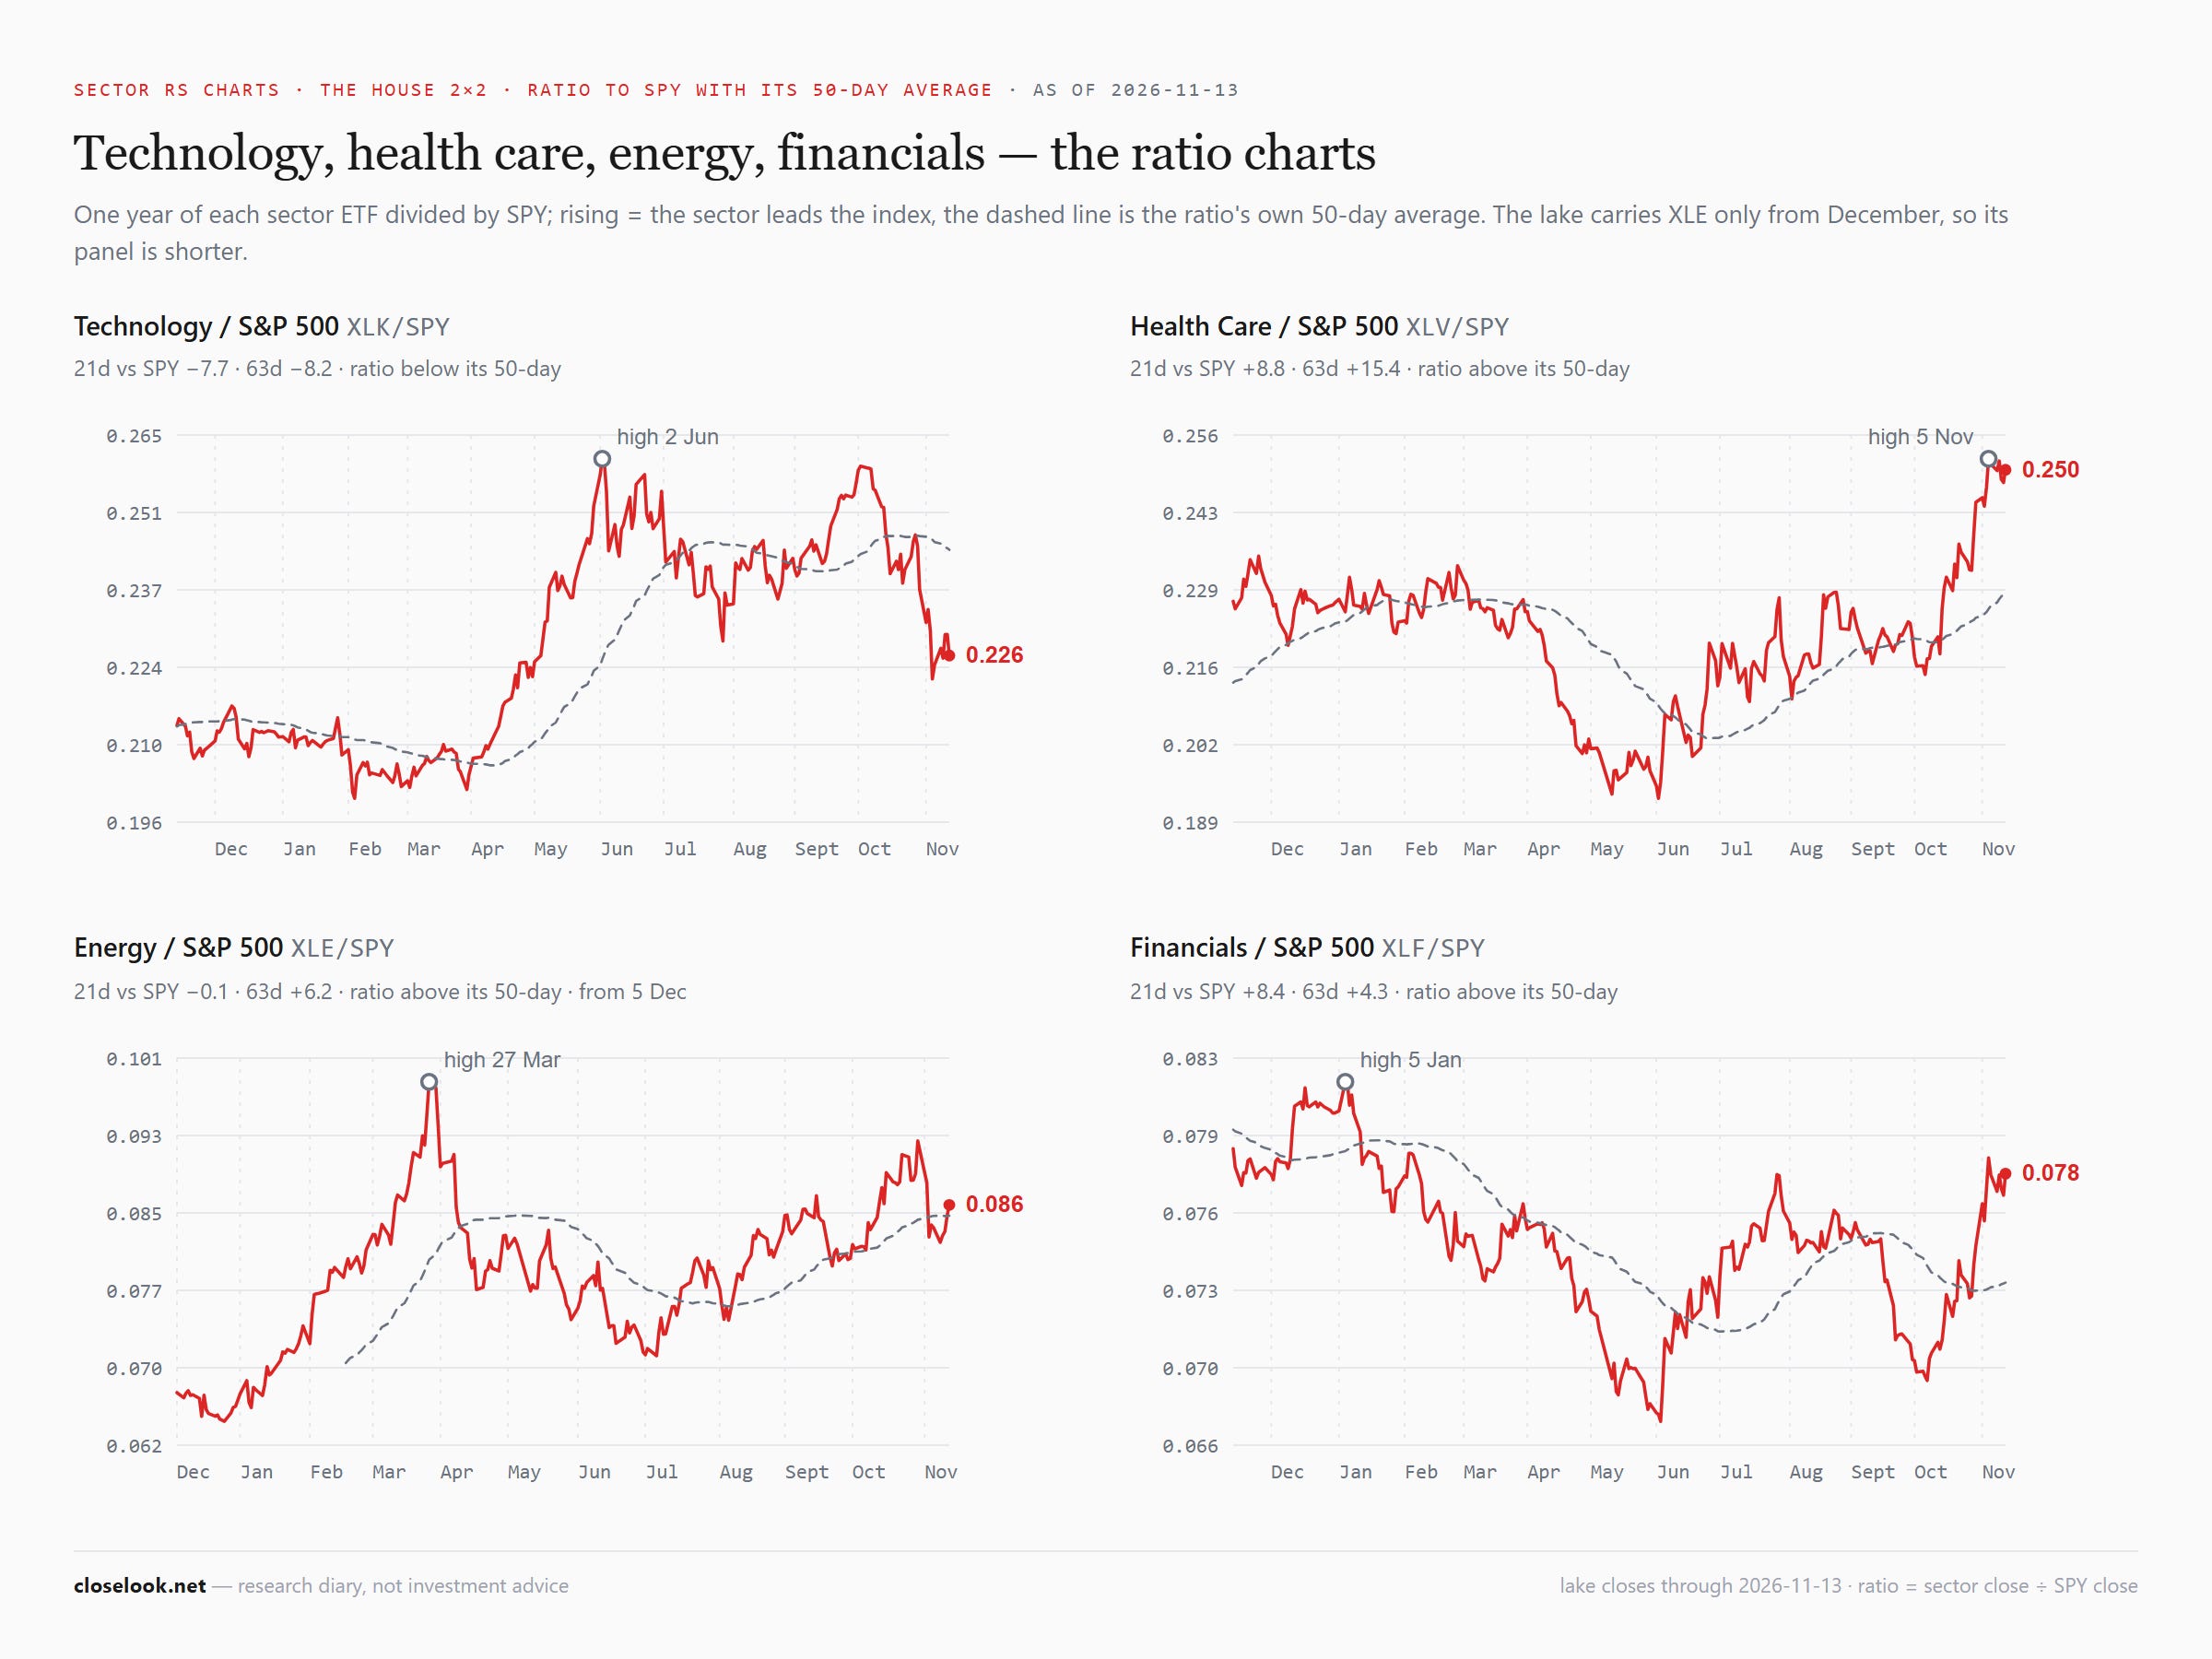
Tech won the week, health care and staples kept the month. Tech rose 3.36% to 170.28, health care 2.19% to 188.85, staples 2.52% to 92.35. Over one month: health care +11.3%, staples +9.7%, tech −13.3%. The tech fund is 15.7% under its October 6 record close of 202.00.
Against the S&P, the month barely moved. Over 21 sessions health care and staples are each 8.8 points ahead of the index; tech is 7.7 behind. Over 63 sessions: health care +15.4, staples +11.4, tech −8.2. A week ago health care led by 14.9 points over 21 sessions; one week of tech leadership took six points off that, not the lead.
The eleven S&P 500 sectors
All eleven up, energy the most. Energy +5.42% to 64.96, industrials +3.76%, communication +3.72%, technology +3.36%, financials +2.66%, staples +2.52%, health care +2.19%, utilities +2.11%, discretionary +2.04%, real estate +0.84%, materials +0.54%. A week ago energy fell 12% with oil; this week it rose while the oil fund fell 1.9%.
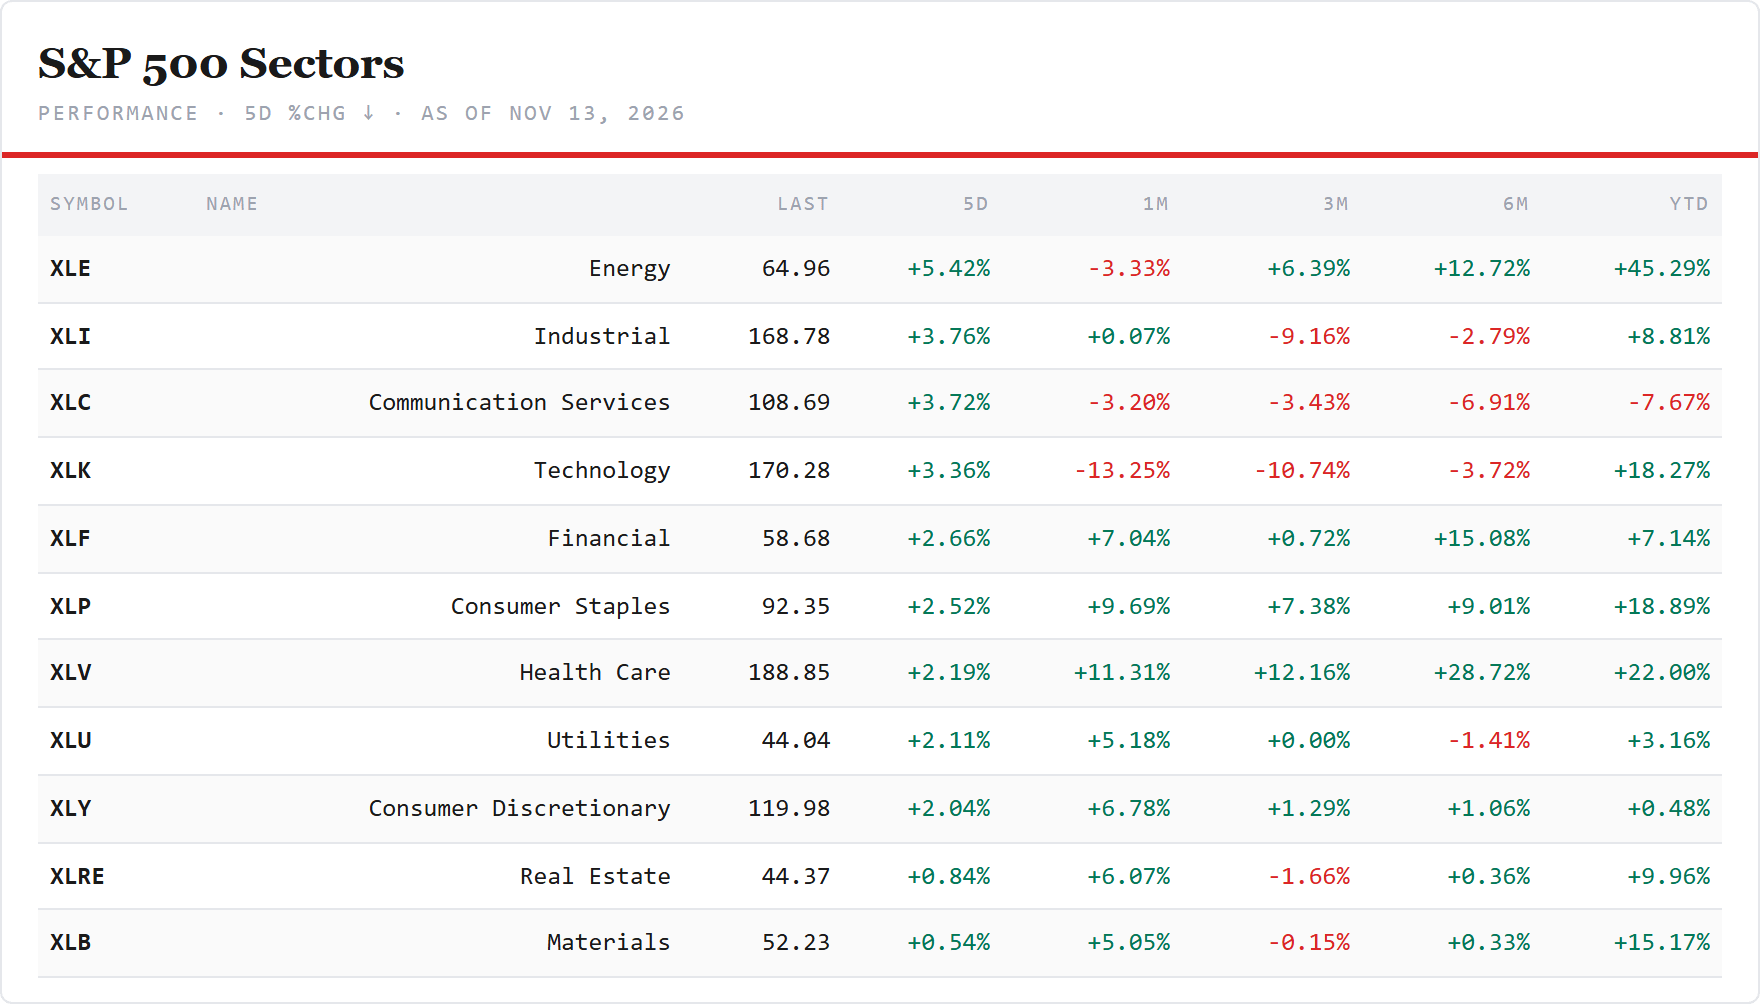
Against the S&P. On the week: energy +2.8 points, industrials +1.2, communication +1.1, tech +0.8; materials −2.1, real estate −1.8. Over 21 sessions: health care and staples +8.8, financials +8.4, discretionary +8.1, utilities +8.0, real estate +7.9, materials +5.6, industrials +2.8; energy −0.1, communication −1.1, tech −7.7. Eight sectors are five points or more ahead of the index over a month; tech is the one well behind.
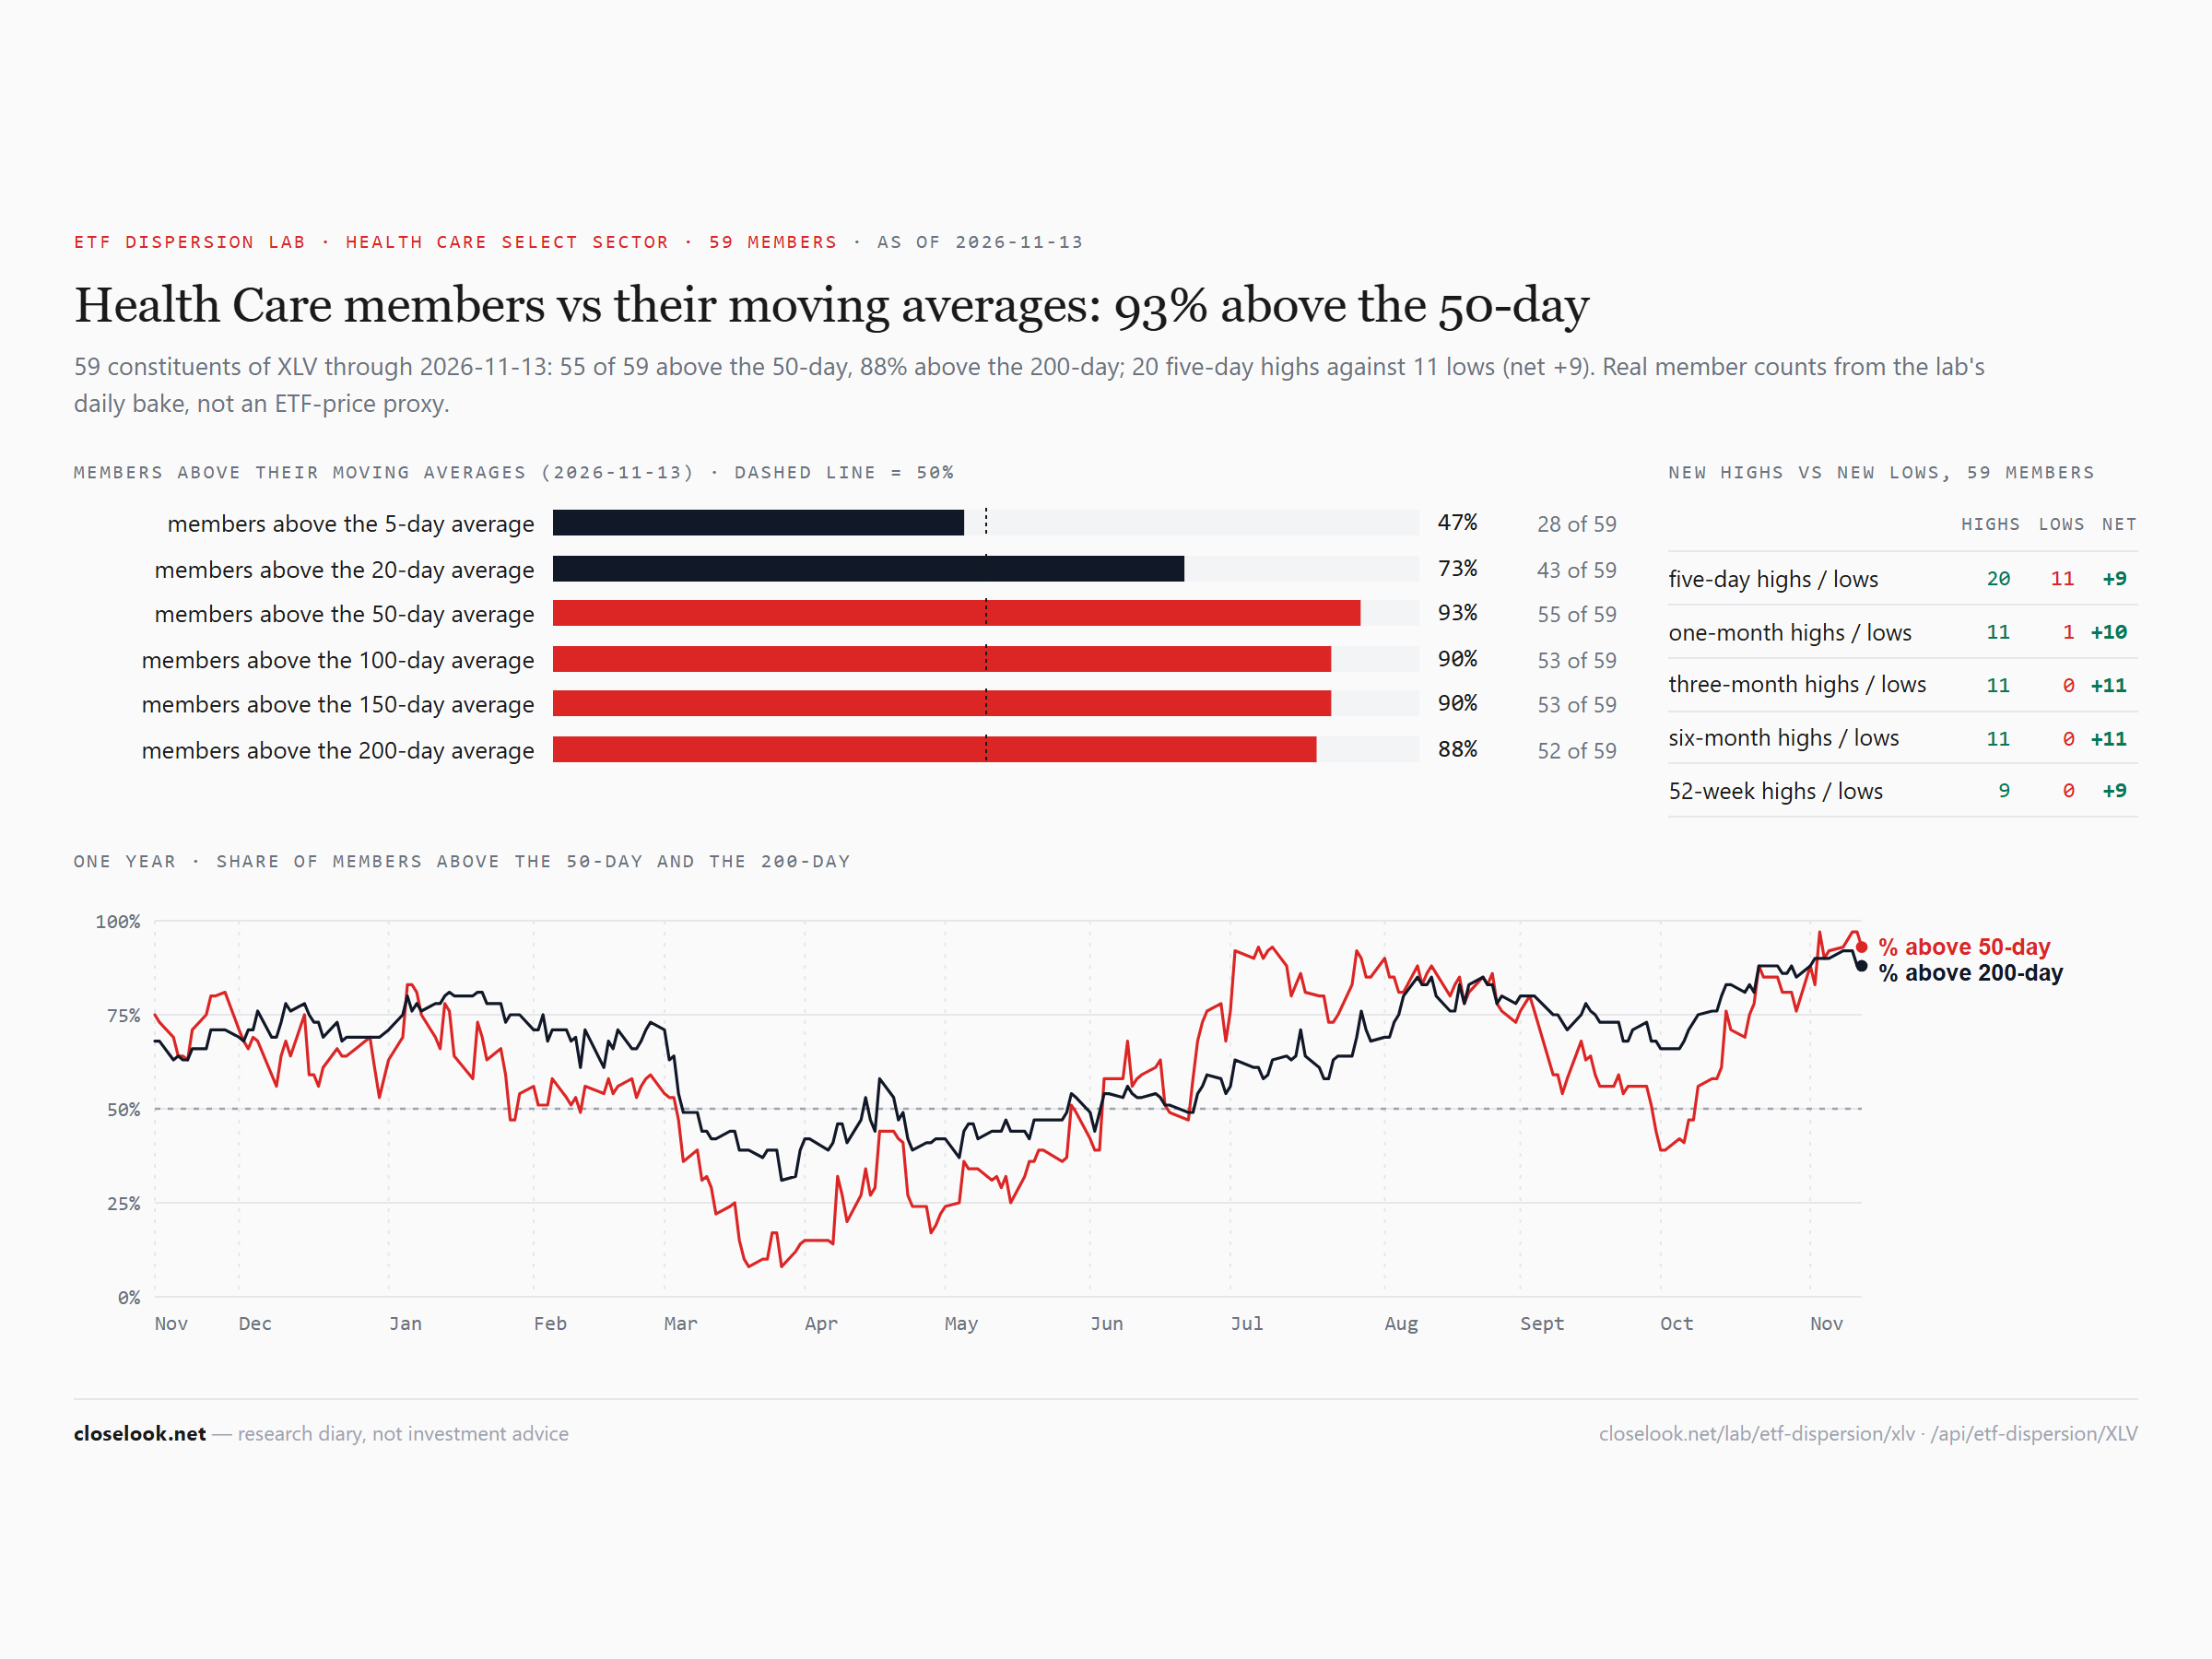
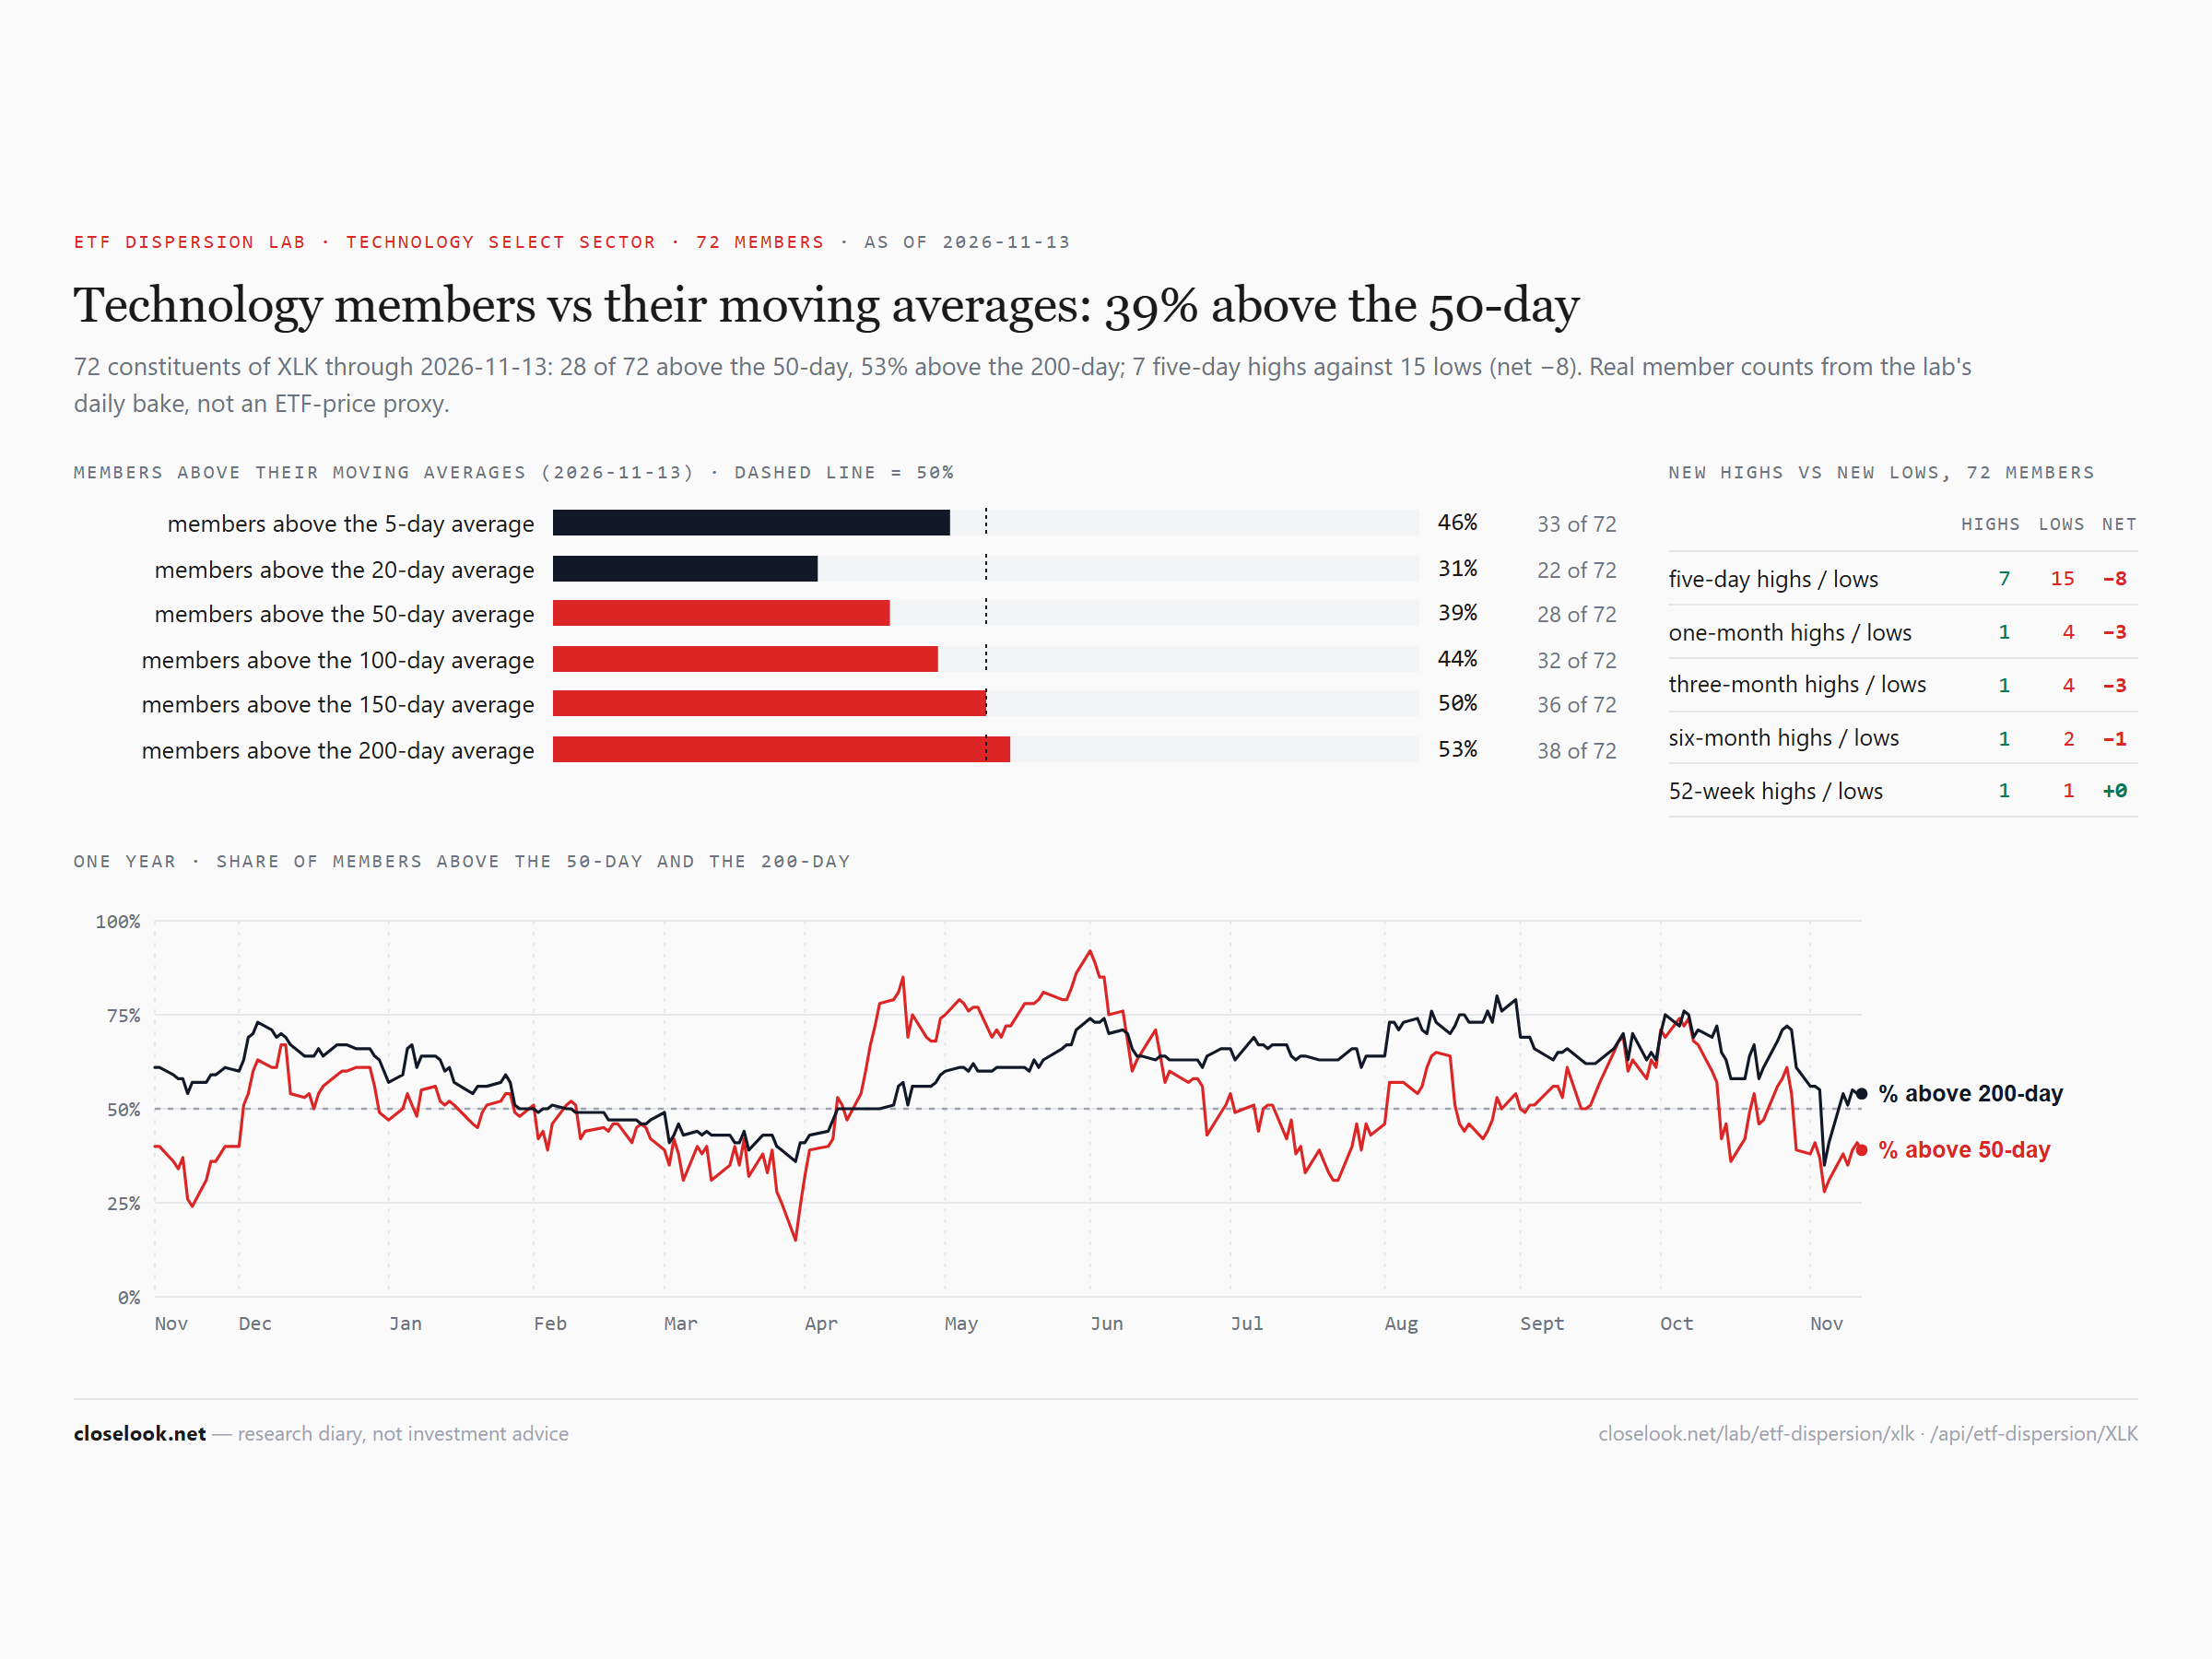
Breadth — health care broad, financials broader, tech still thin. In health care 55 of 59 members closed above their 50-day average. In financials 60 of 76 are above the 50-day and 69 above the 20-day; 38 made a five-day high. In tech 28 of 72 are above the 50-day and 22 above the 20-day; 15 made a five-day low against 7 highs. In energy all 21 members are above their 5-day line and 19 made a five-day high — but only 9 are above the 50-day.
The Nasdaq 100, cut six ways
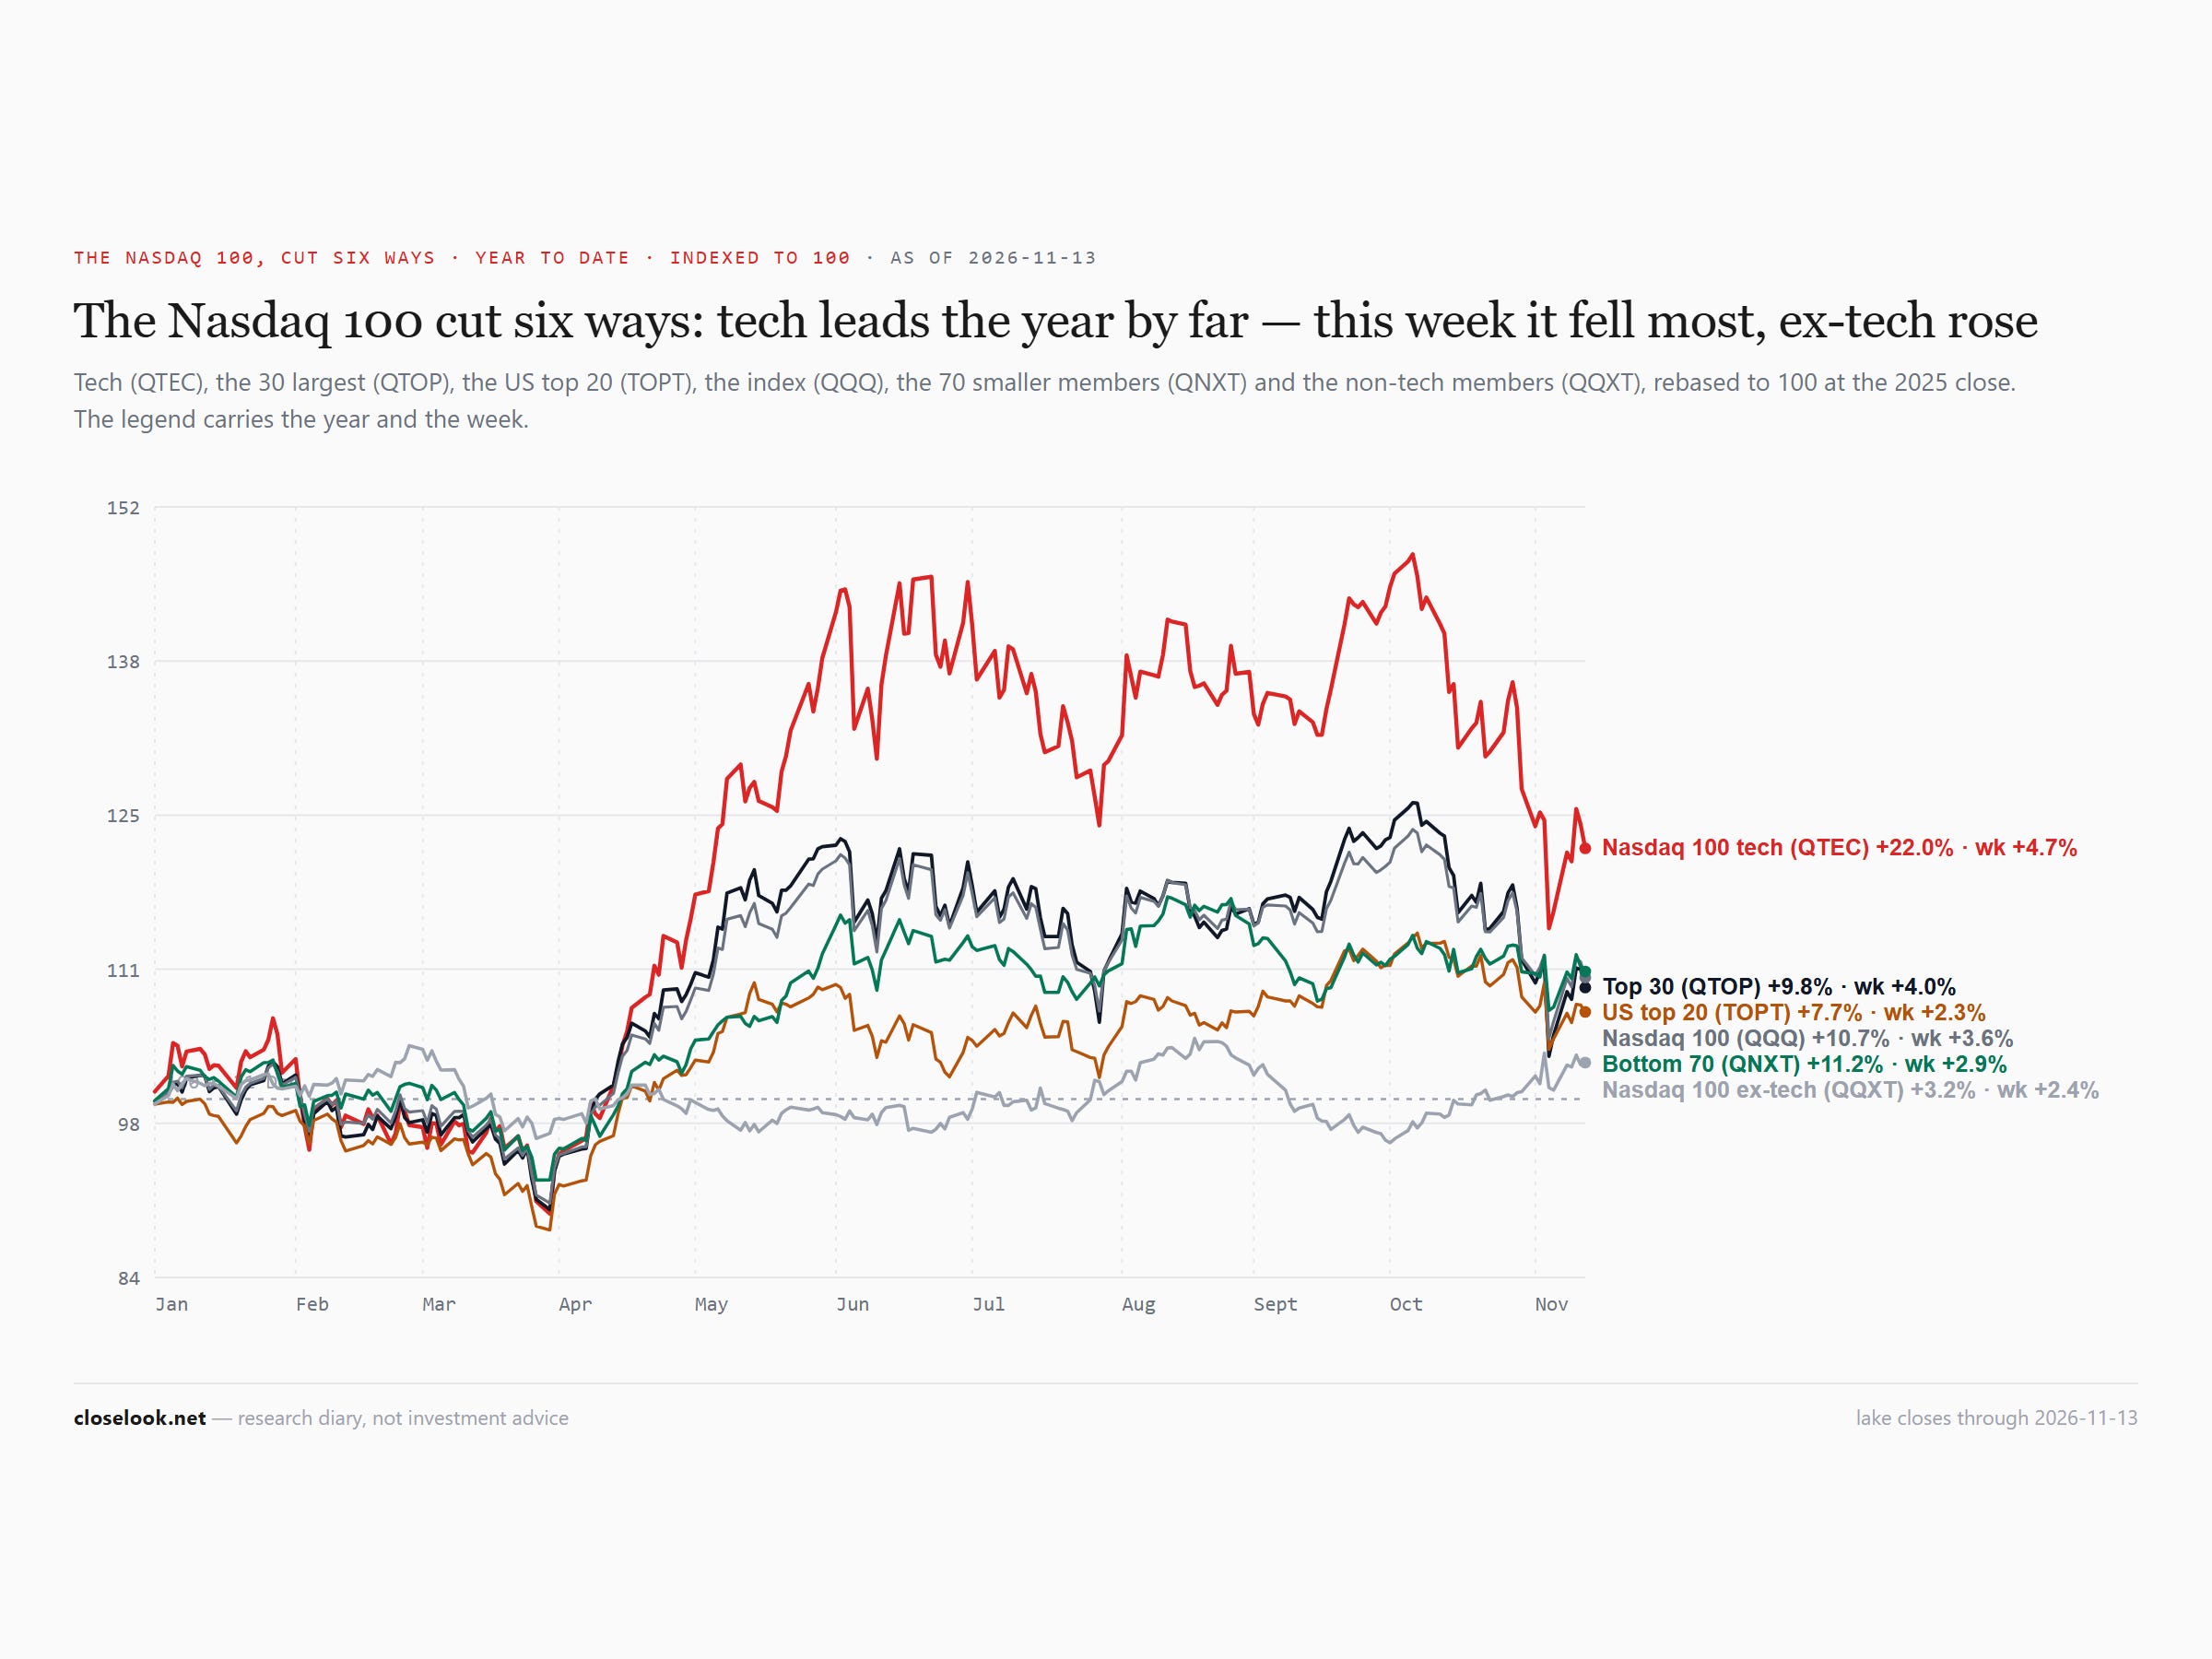
The week: Nasdaq tech +4.74%, its 30 largest +3.97%, the Nasdaq 100 fund +3.63%, the equal-weight Nasdaq 100 +3.42%, the Nasdaq 100 without tech +2.40%, the US top-20 fund +2.25%. On the year: tech +22.0%, equal weight +13.2%, the index +10.7%, the 30 largest +9.8%, the top 20 +7.7%, ex-tech +3.2%. A week ago Nasdaq tech was up 16.5% for 2026; it won back about a third of what the week before took.
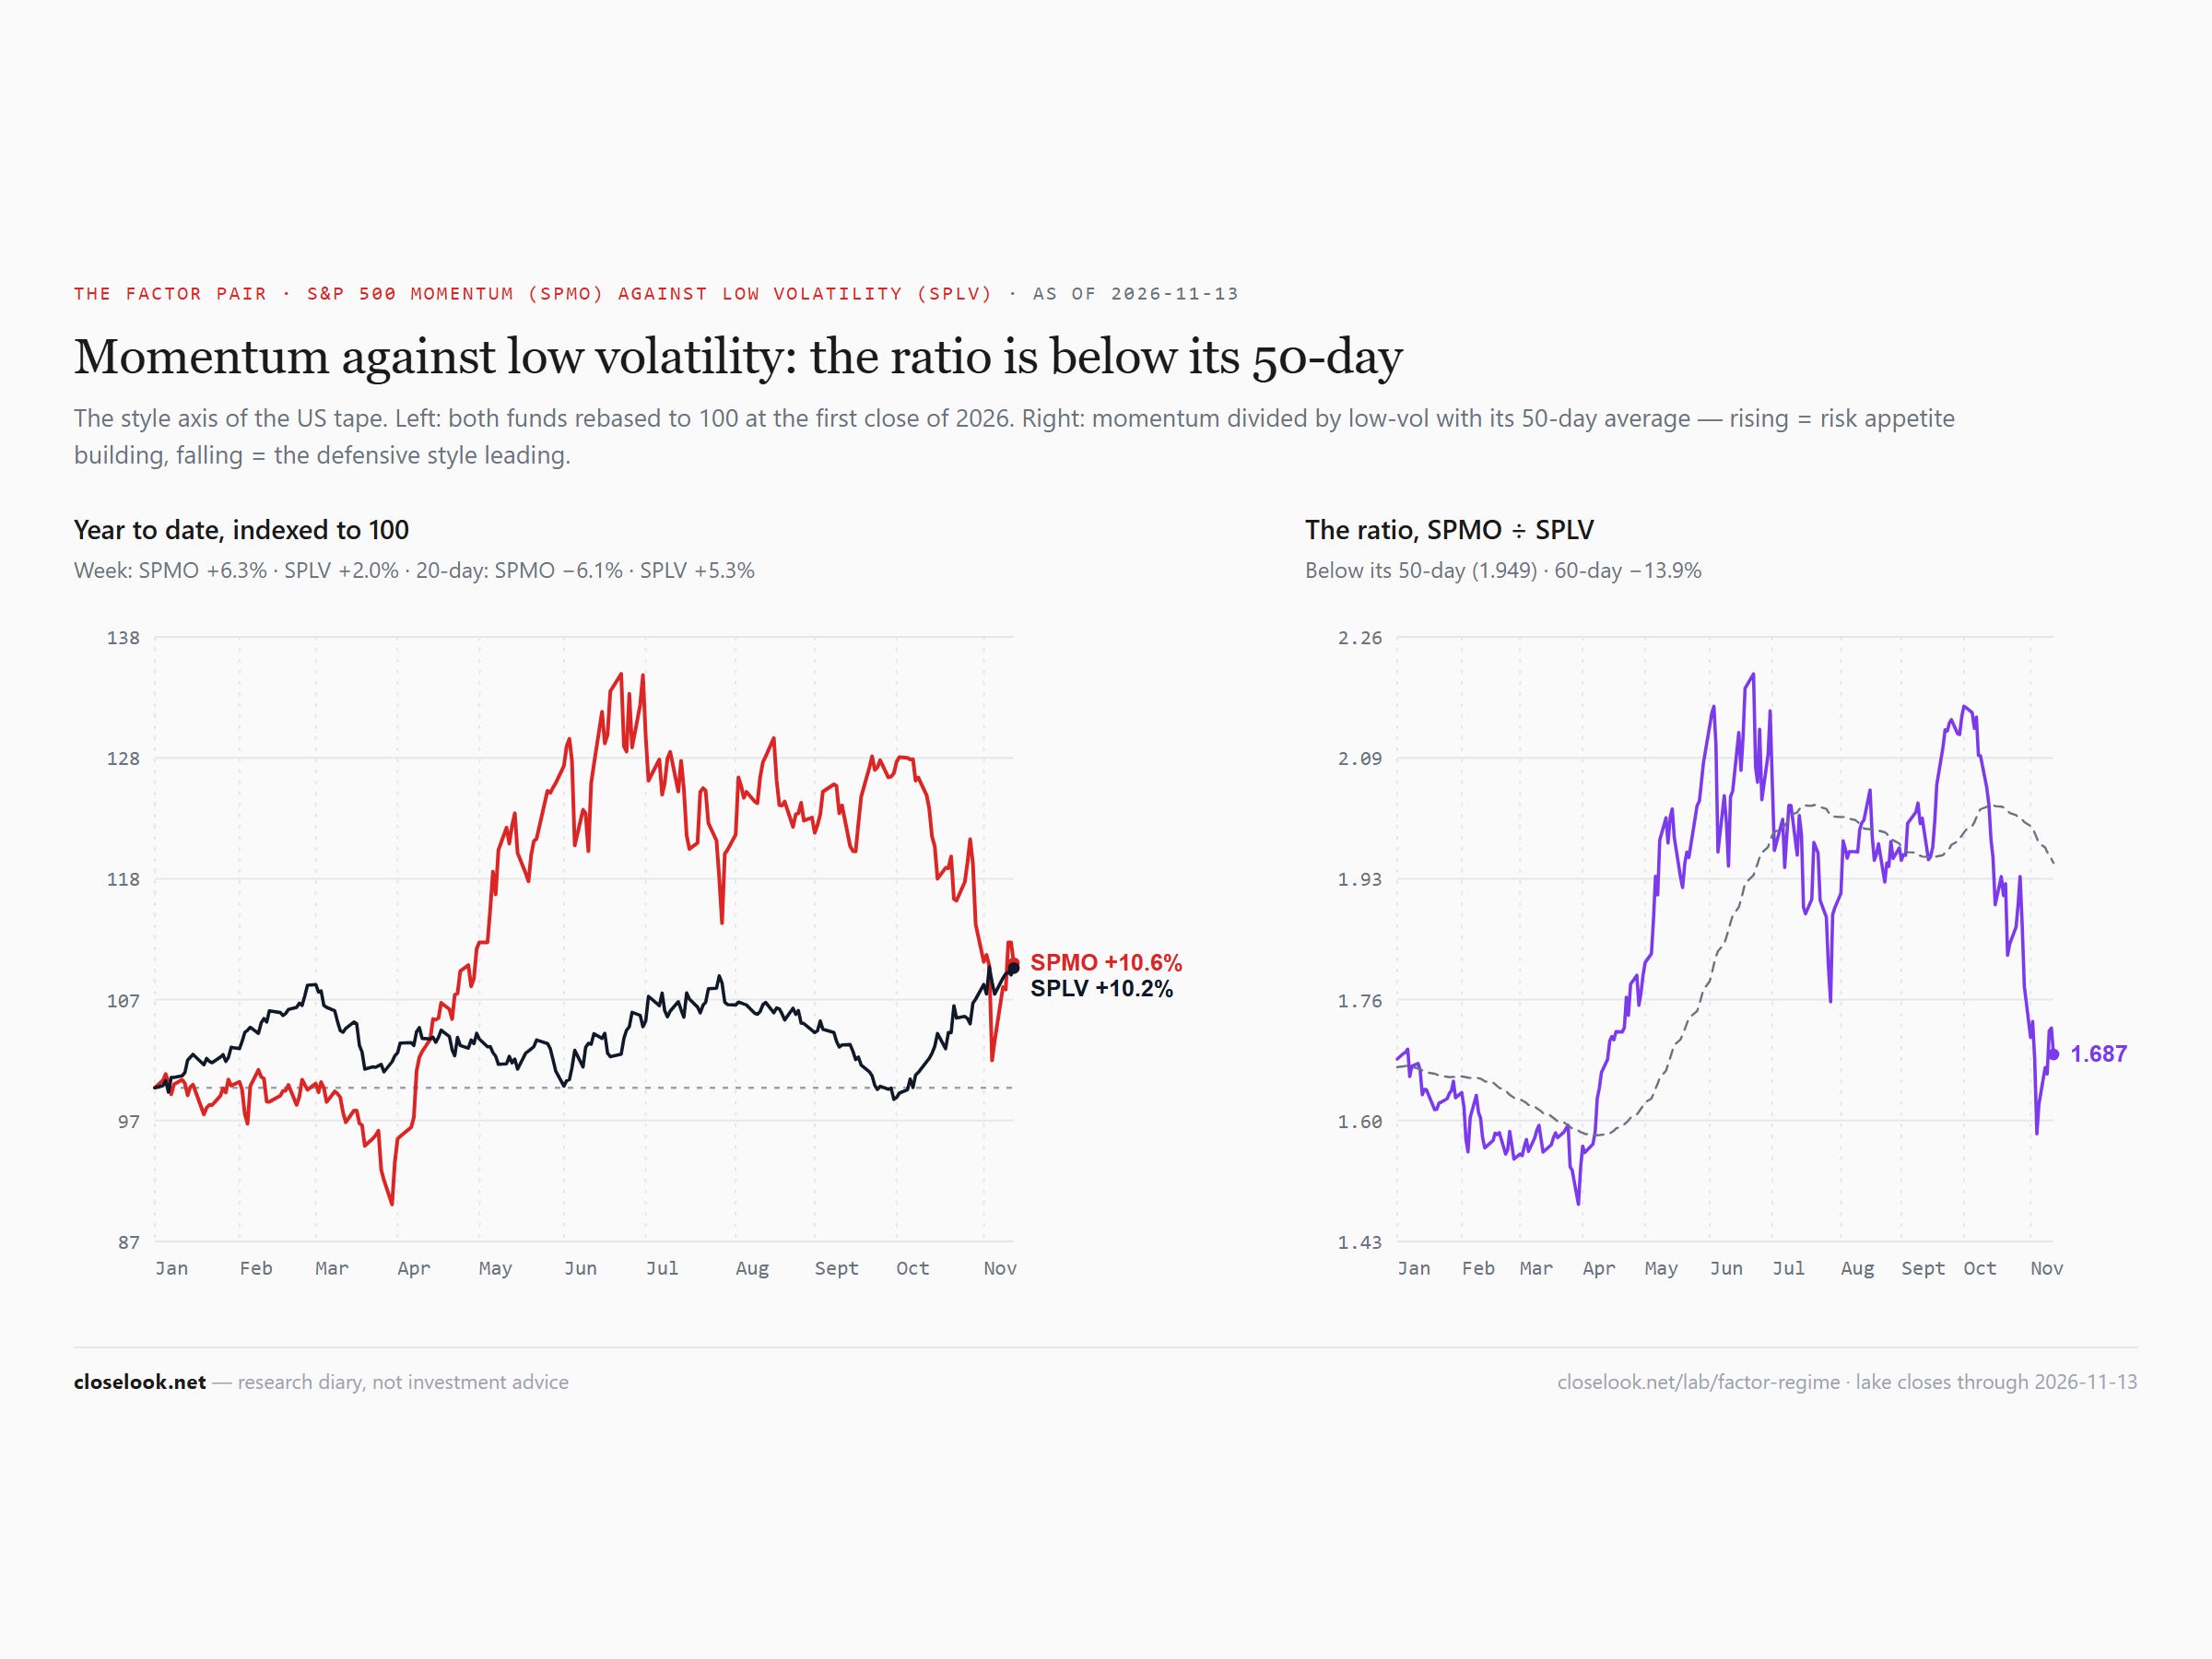
Momentum against low volatility — a fifth week under trend. Momentum rose 6.35%, low volatility 2.04%. The ratio rose from 128.5 to 134.0 indexed, still under its trend line at 154.8, and the factor board still reads below trend — a defensive rotation, low volatility leading.
The tech ETFs we carry
Sixteen of twenty-one green, the chips on top. The WisdomTree AI fund +6.57%, XSD +6.13%, quantum +5.46%, the fabless fund +5.27%, SMH +4.91%, cybersecurity +4.39%. The red was small: lithium and batteries −3.53%, ARK innovation −0.62%, fintech −0.46%.
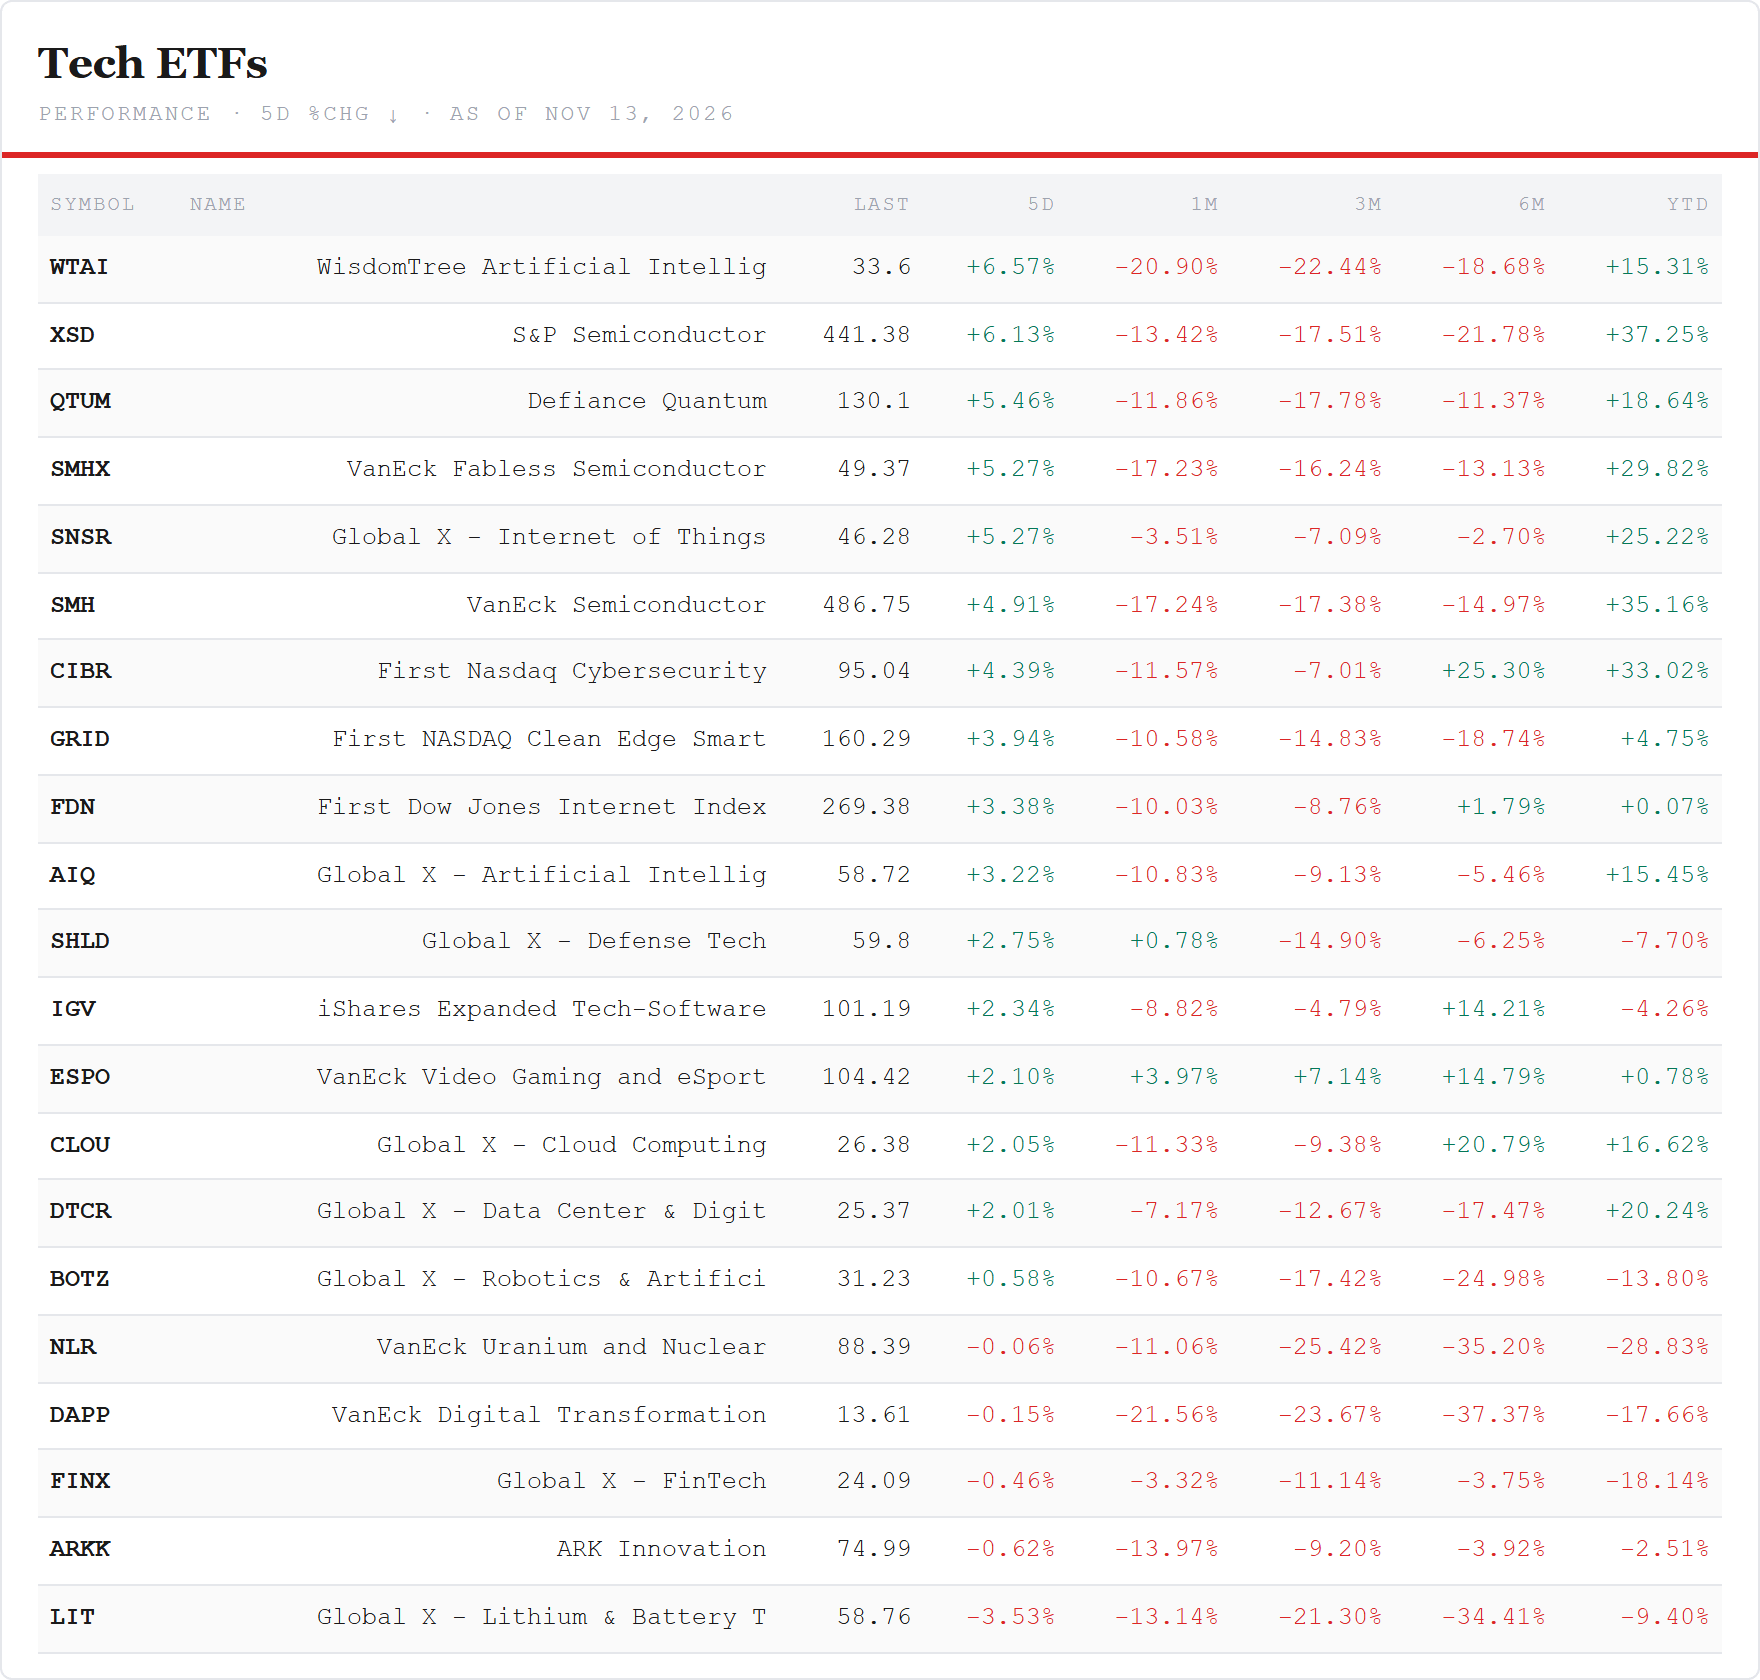
Software — back above 100, behind the chips. IGV closed at 101.19, up 2.34%, back above the round 100, 4.6% under its 50-day of 106.12 and 7.4% above its 200-day. The software-to-chips ratio fell 2.5% to 0.2079, still 59% above its June low: this week the chips beat the code. The cloud fund closed at 26.38, 13.9% under its October 26 high; cybersecurity at 95.04, 6.0% under its 50-day. In the names: Okta +8.4%, MongoDB +6.8%, Snowflake +5.5%, CrowdStrike +4.5%, Datadog +2.9%, Palo Alto +2.7%; Zscaler −2.6%, Atlassian −2.4% — and Microsoft −1.3%, a second day lower on Wednesday after Anthropic launched a spreadsheet tool.
The names in one line each. Up: AMD +18.9% to 534.06, Broadcom +18.2% to 347.01, Astera Labs +16.3%, Rocket Lab +15.9%, CoreWeave +14.5%, Cloudflare +13.8% to 305.81, Coherent +13.1%, Micron +12.8% to 778.31, Lam Research +12.7%, Applied Materials +11.4%. Down: IREN −16.0%, Nvidia −12.8% to 162.85, Nebius −10.5%, SanDisk −7.0%, Tempus AI −5.9%, Stryker −5.0%, United Airlines −3.0%.
The four indices
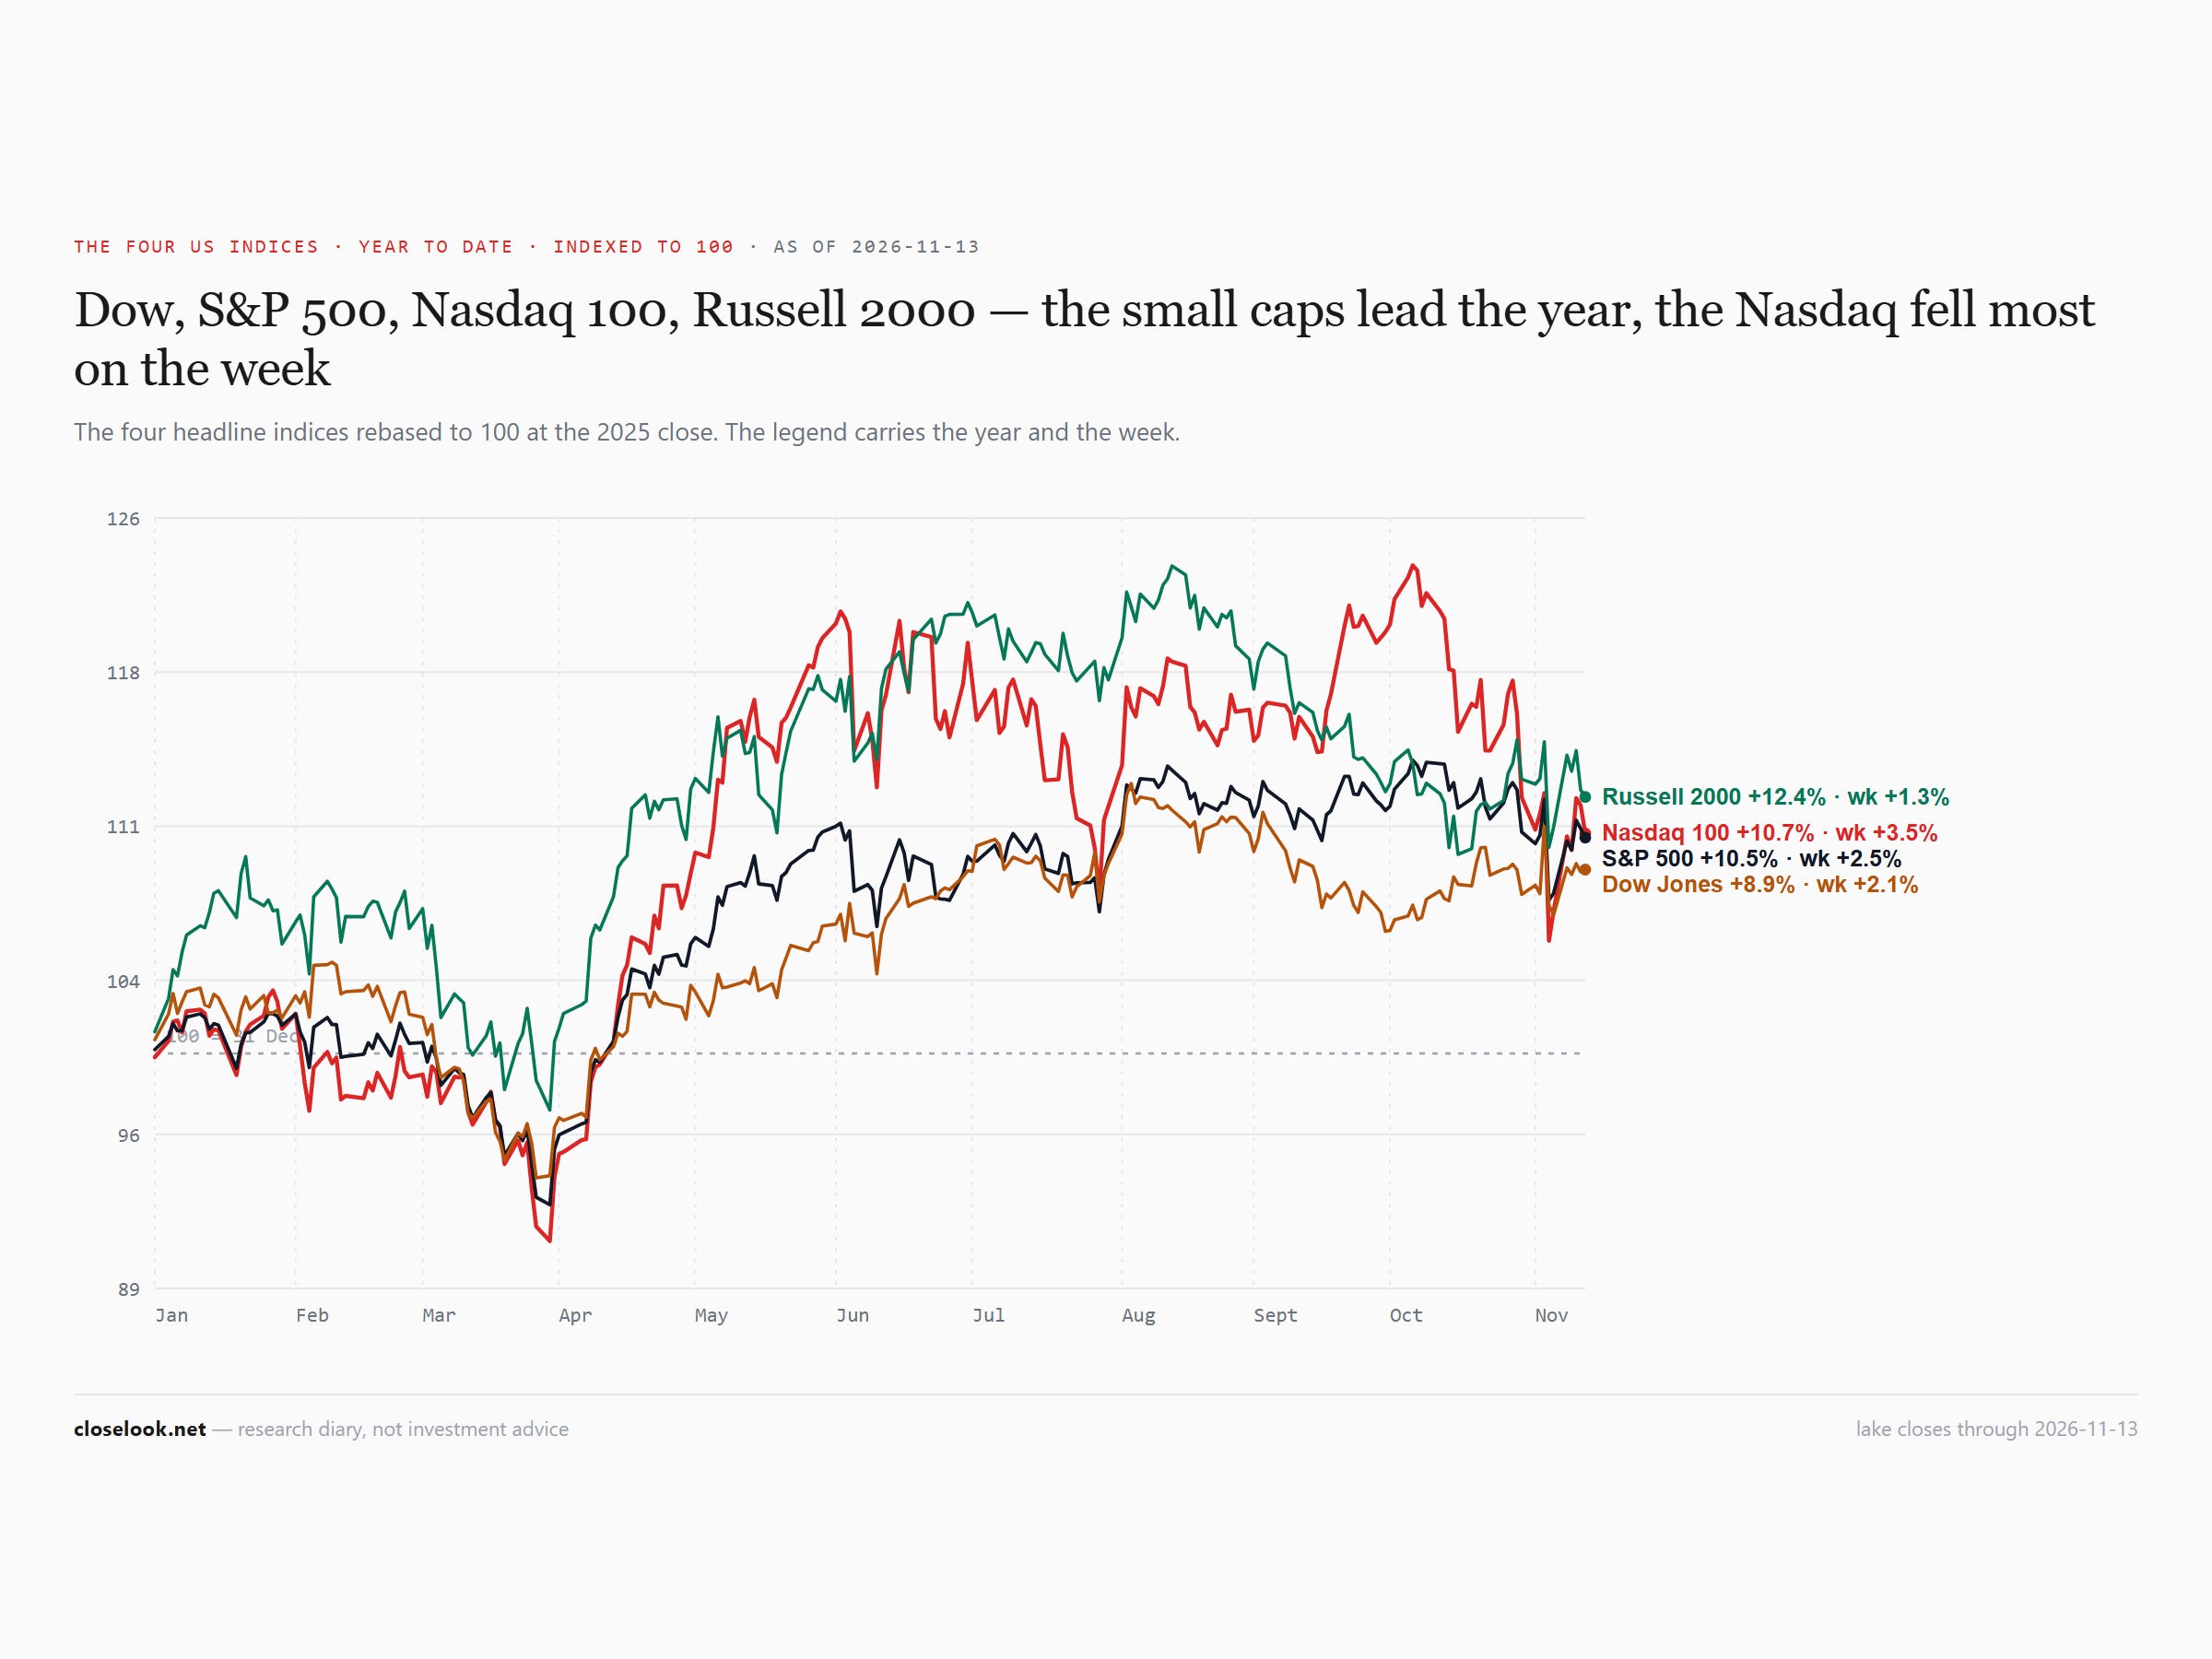
The S&P 500 +2.51% to 7,562, the Russell 2000 +1.32% to 2,790, the Nasdaq 100 +3.53% to 27,944. On the year, by the funds: small caps +12.8%, the Nasdaq 100 +10.7%, the S&P +10.6%. A week ago the Nasdaq 100 trailed the S&P for 2026; it is level with it again.
The Treasury curve
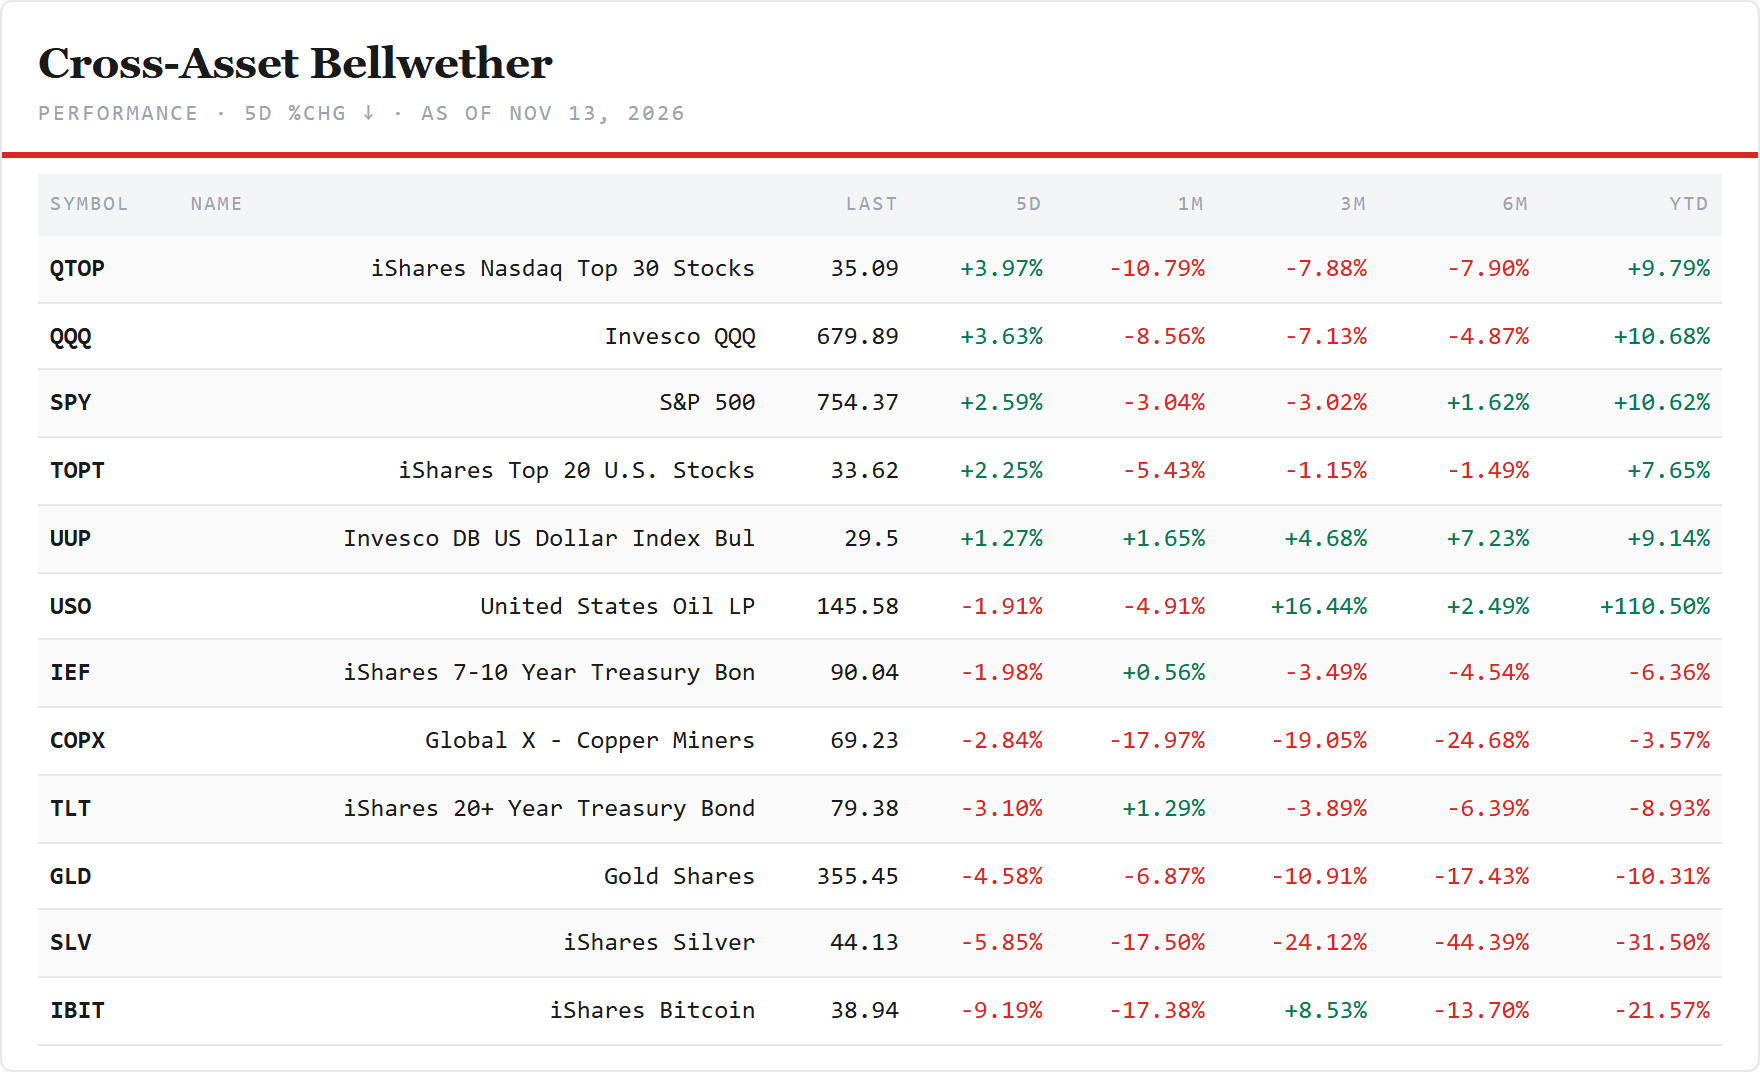
The ten-year closed at 5.15% on the house sovereign board, from 4.87% — back above 5%. The thirty-year closed at 5.47%, from 5.27%; the two-year at 4.86%, from 4.52% — up 34 basis points, the most on the curve. The long bond fell 3.10% to 79.38 and lost its 81.2 line on Tuesday; the 7–10-year fund fell 1.98% to 90.04.
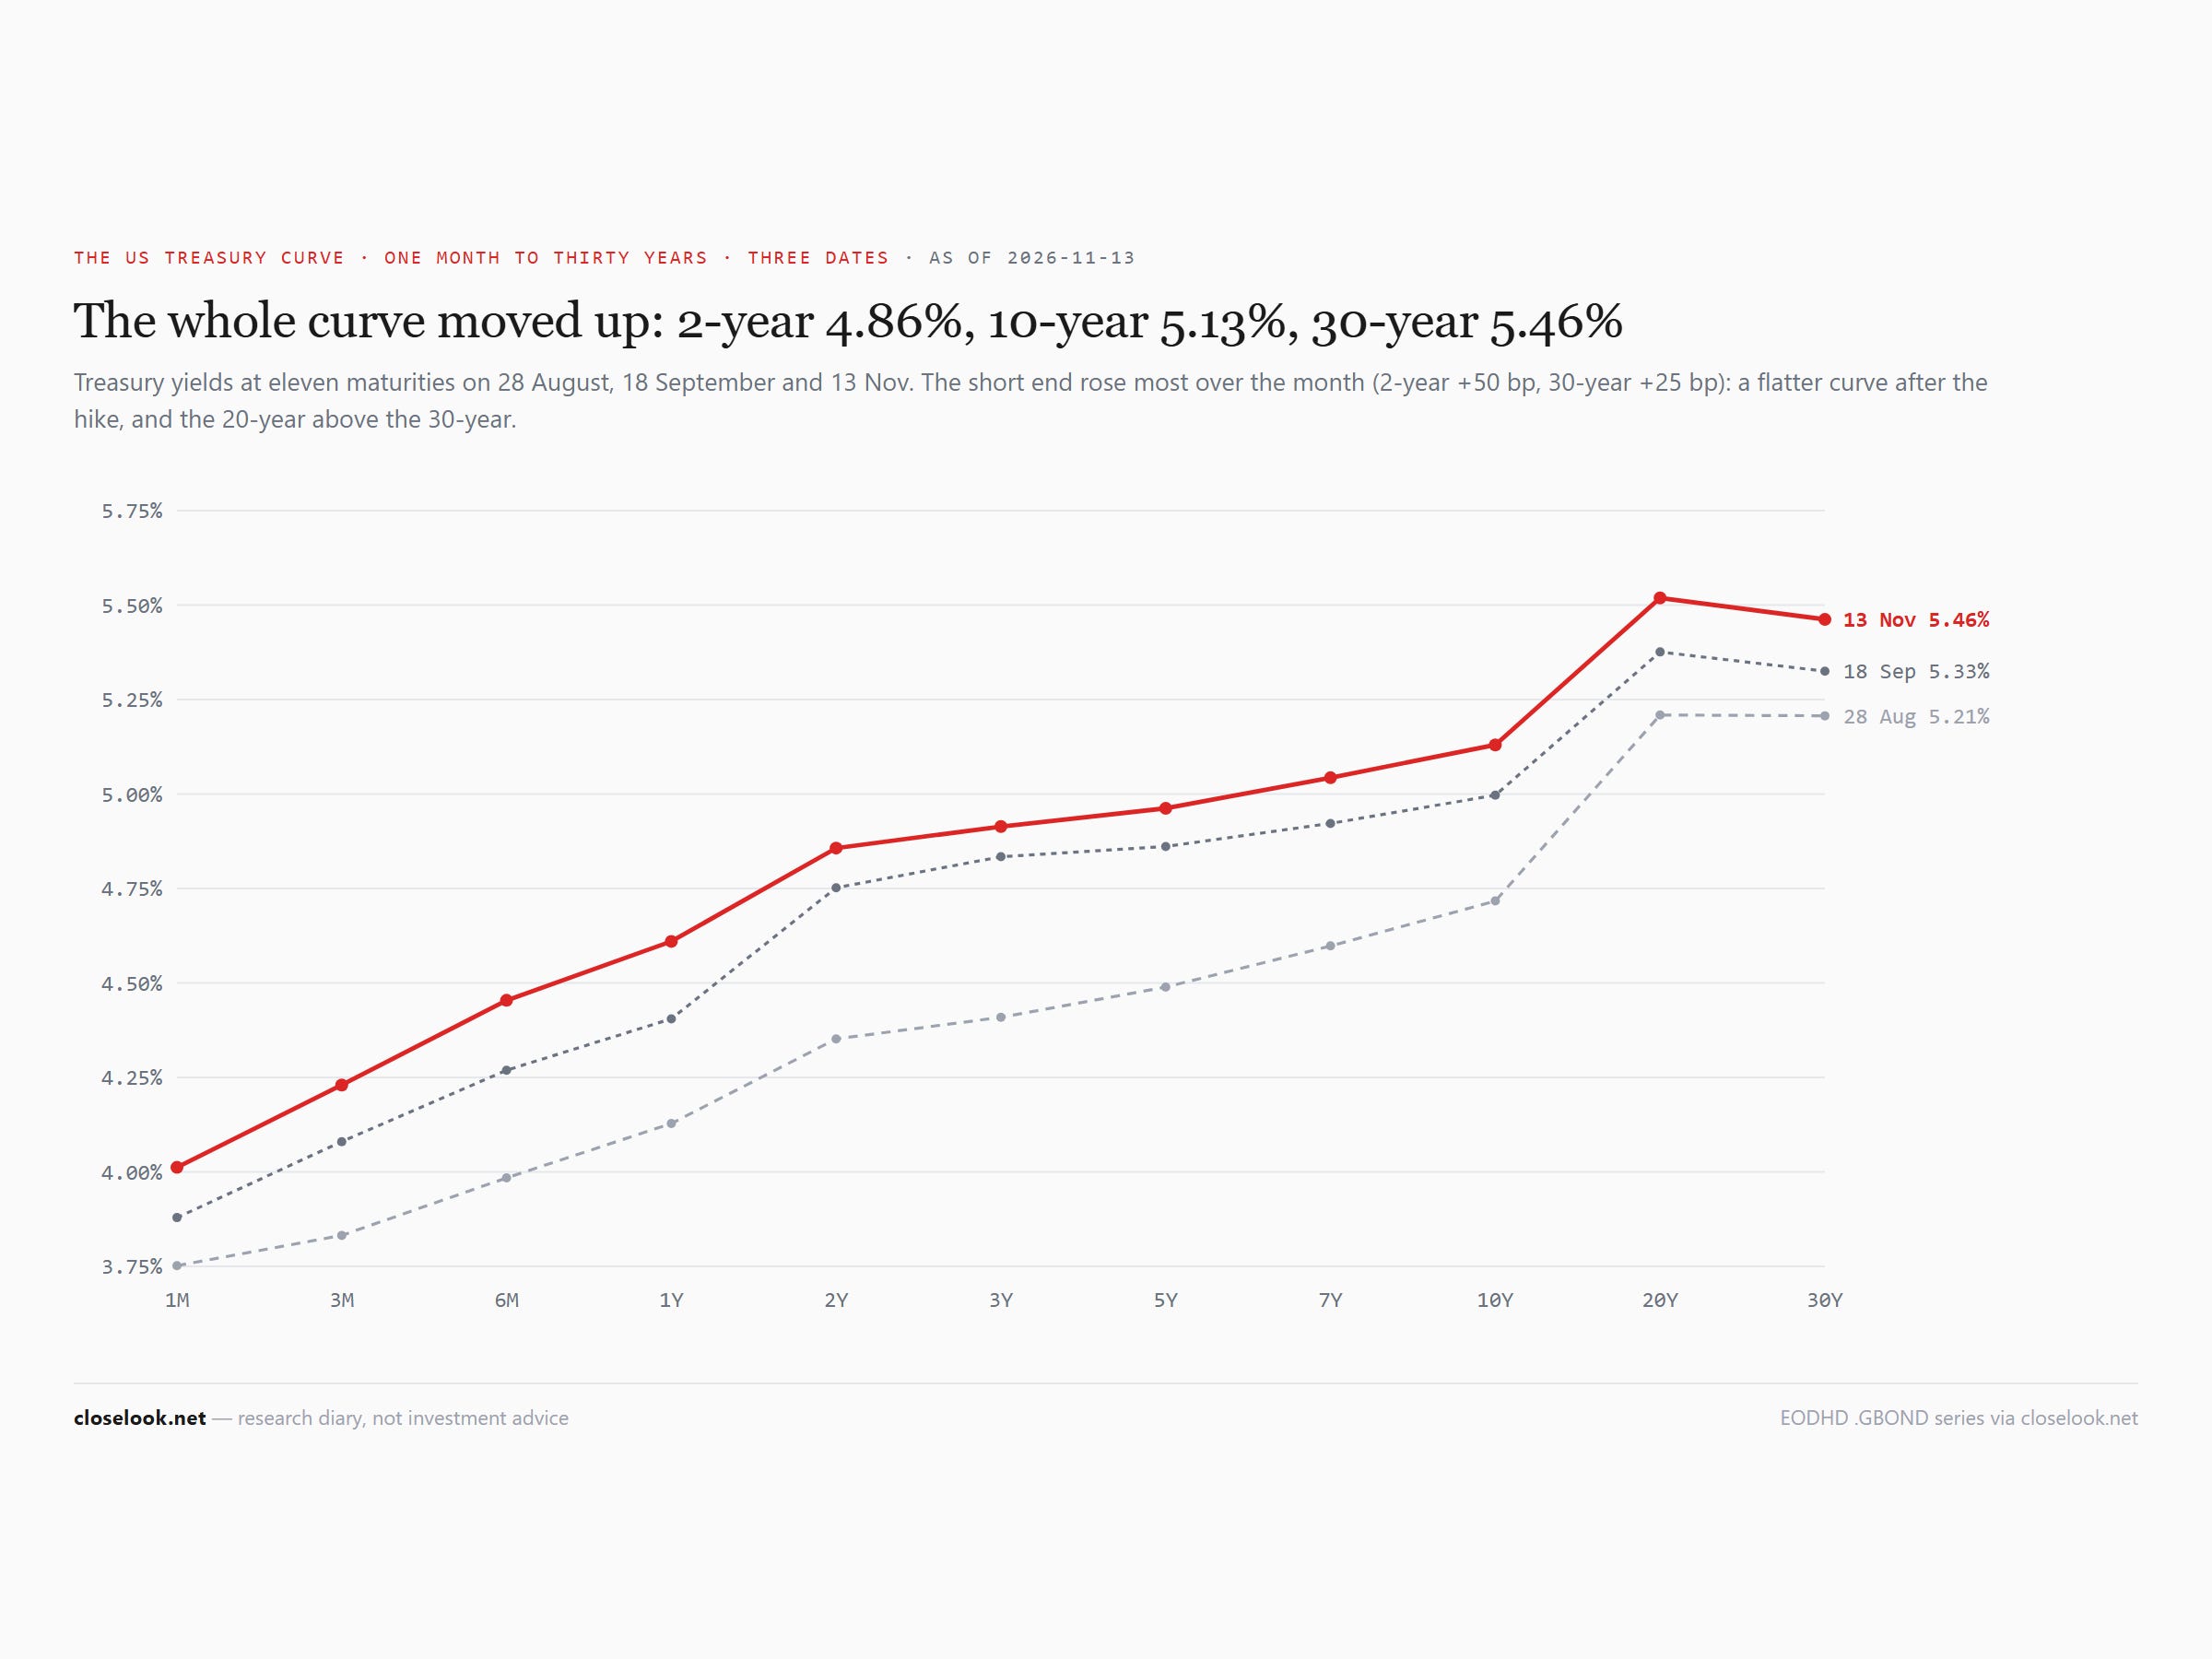
Hot prices, and a hike priced as certain. October consumer prices rose 0.4% on the month and 0.3% without food and energy, each a tenth above forecasts; on Friday producer prices rose 0.3% on the month, less than expected, but 6.5% on the year, the most since 2022. The Fed, under Chair Kevin Warsh, holds its range at 3.75–4.00% after a hike in September, and decides next on 9 December, with new projections. After Tuesday’s report the futures price a quarter-point hike in December as all but certain, and a half-point move at about one chance in eight. The two-year moved most because the two-year is where a Fed hike lands first.
The dollar
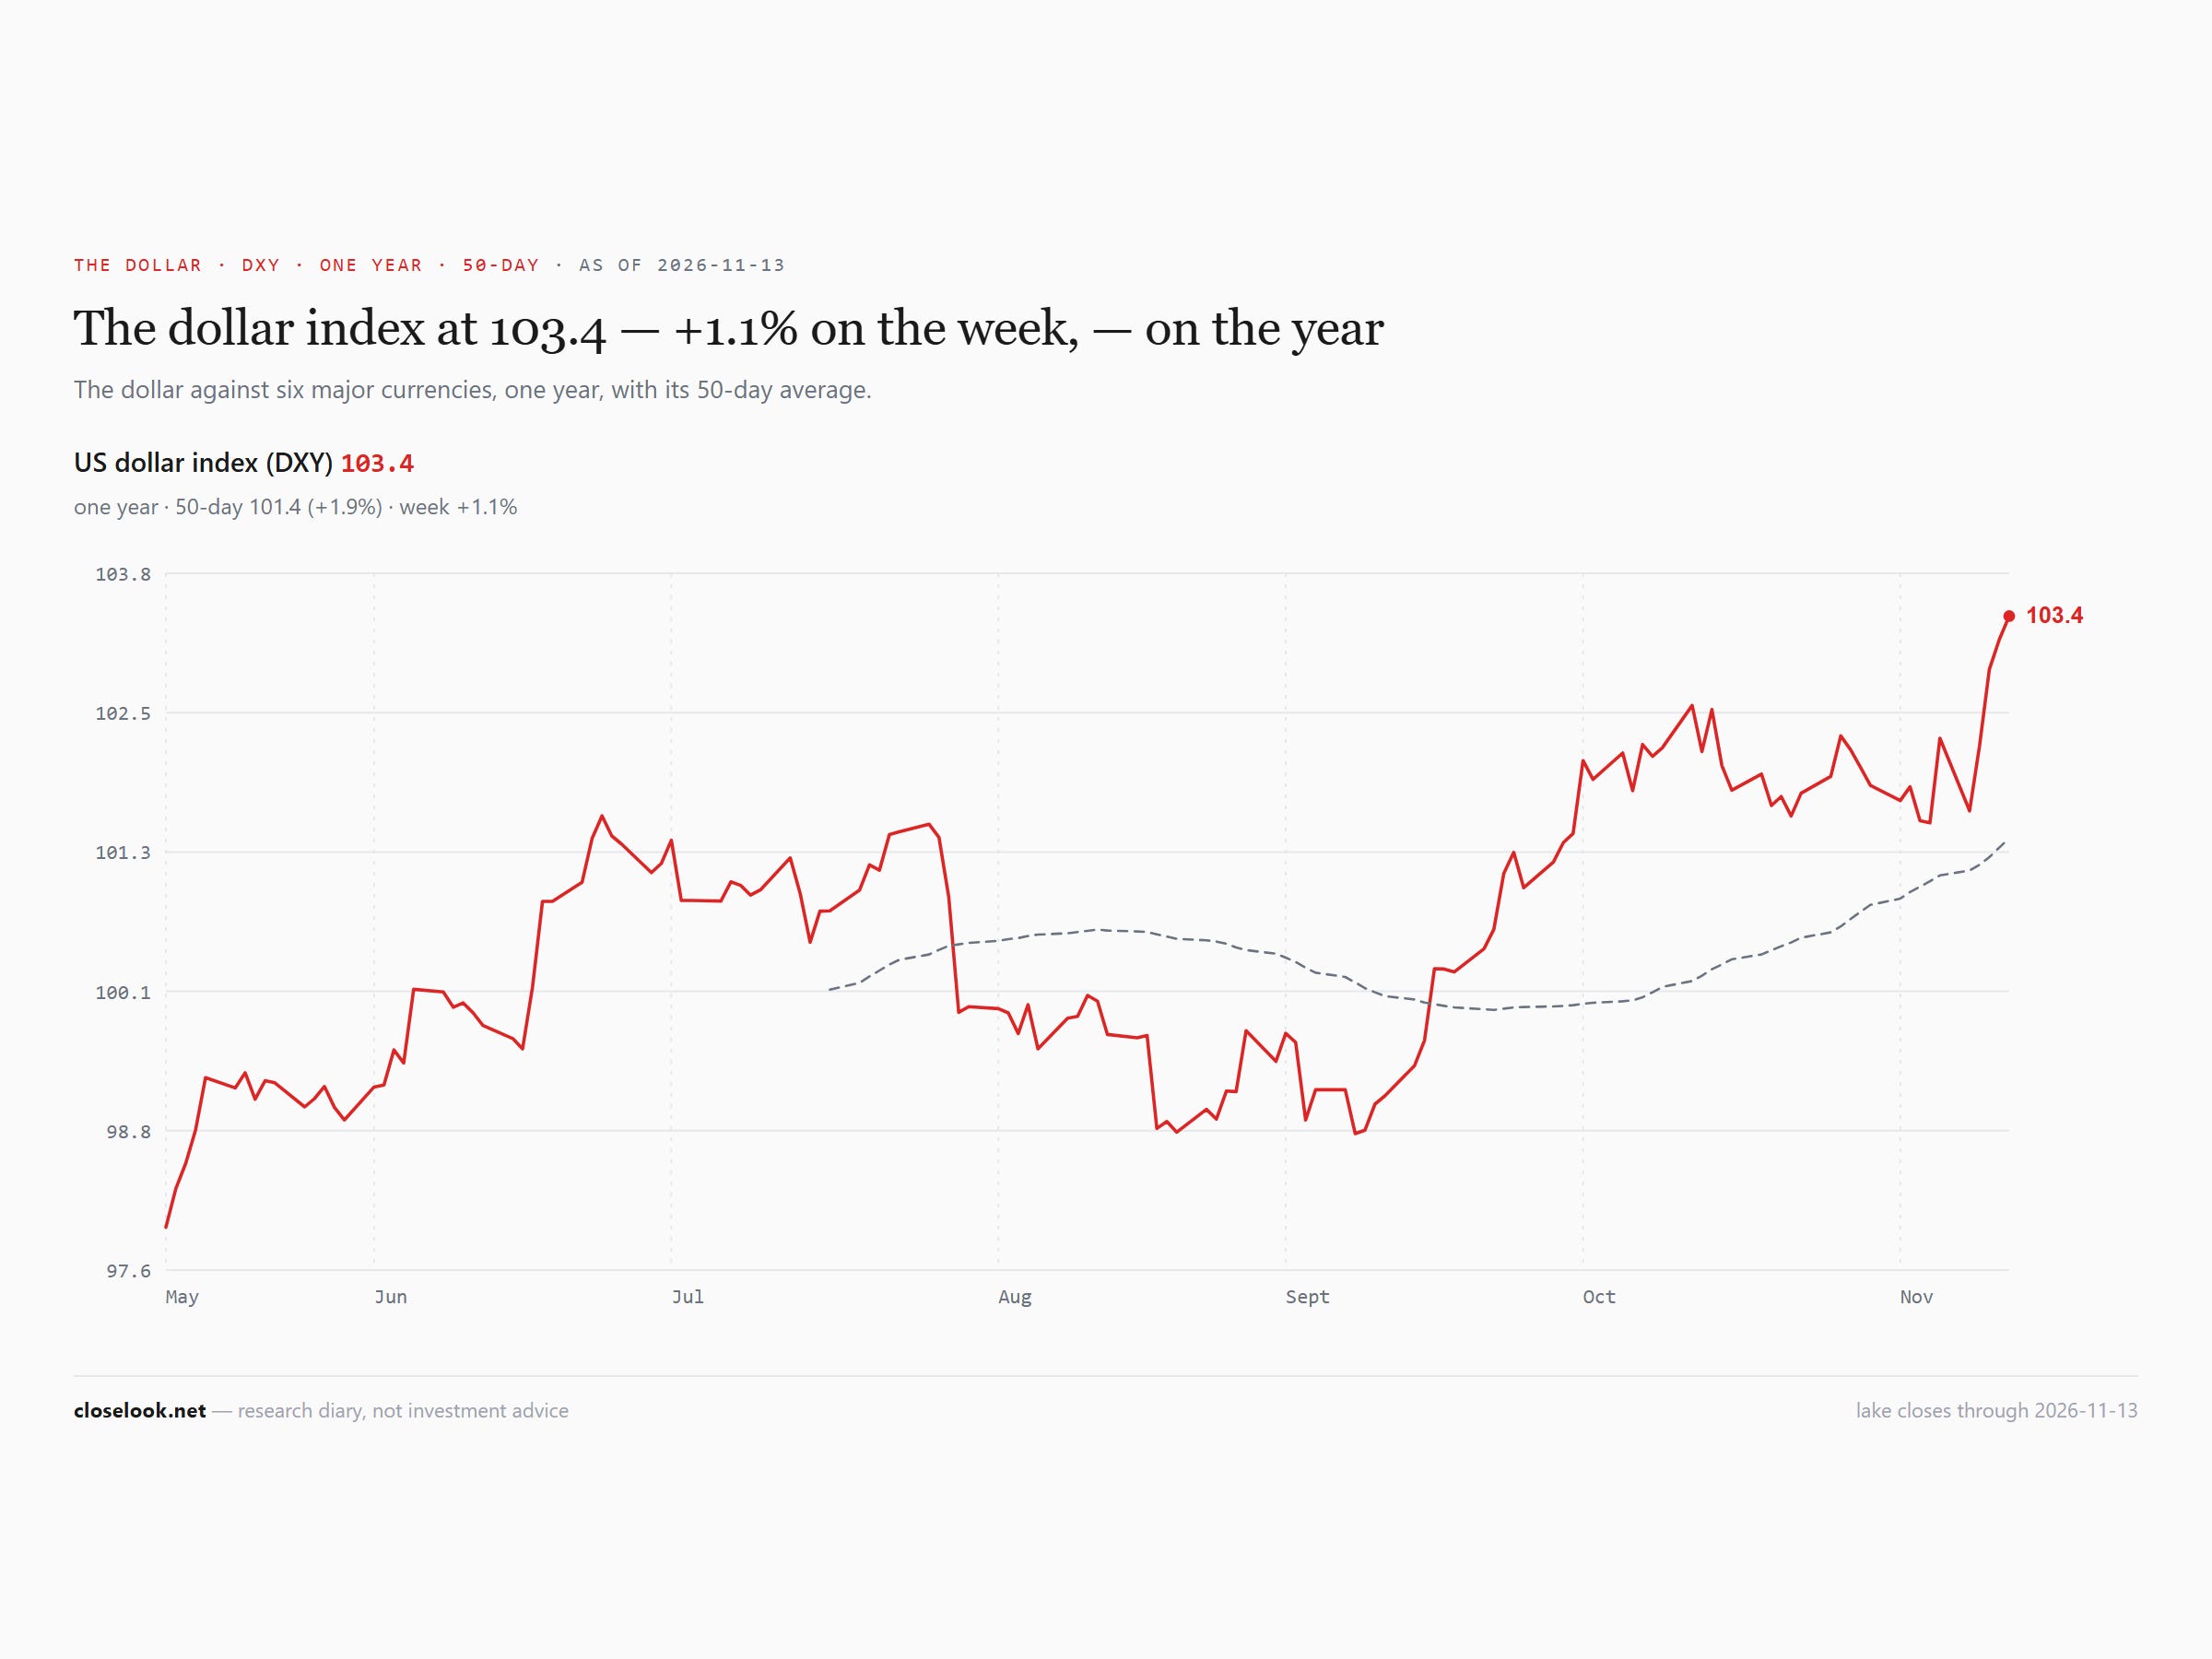
The dollar index closed at 103.38, +1.06% — its highest close of the past year; the dollar fund at 29.50, also a one-year high. The yen weakened from 158.48 to 159.72 per dollar, after 159.86 on Thursday.
Gold — back under the line
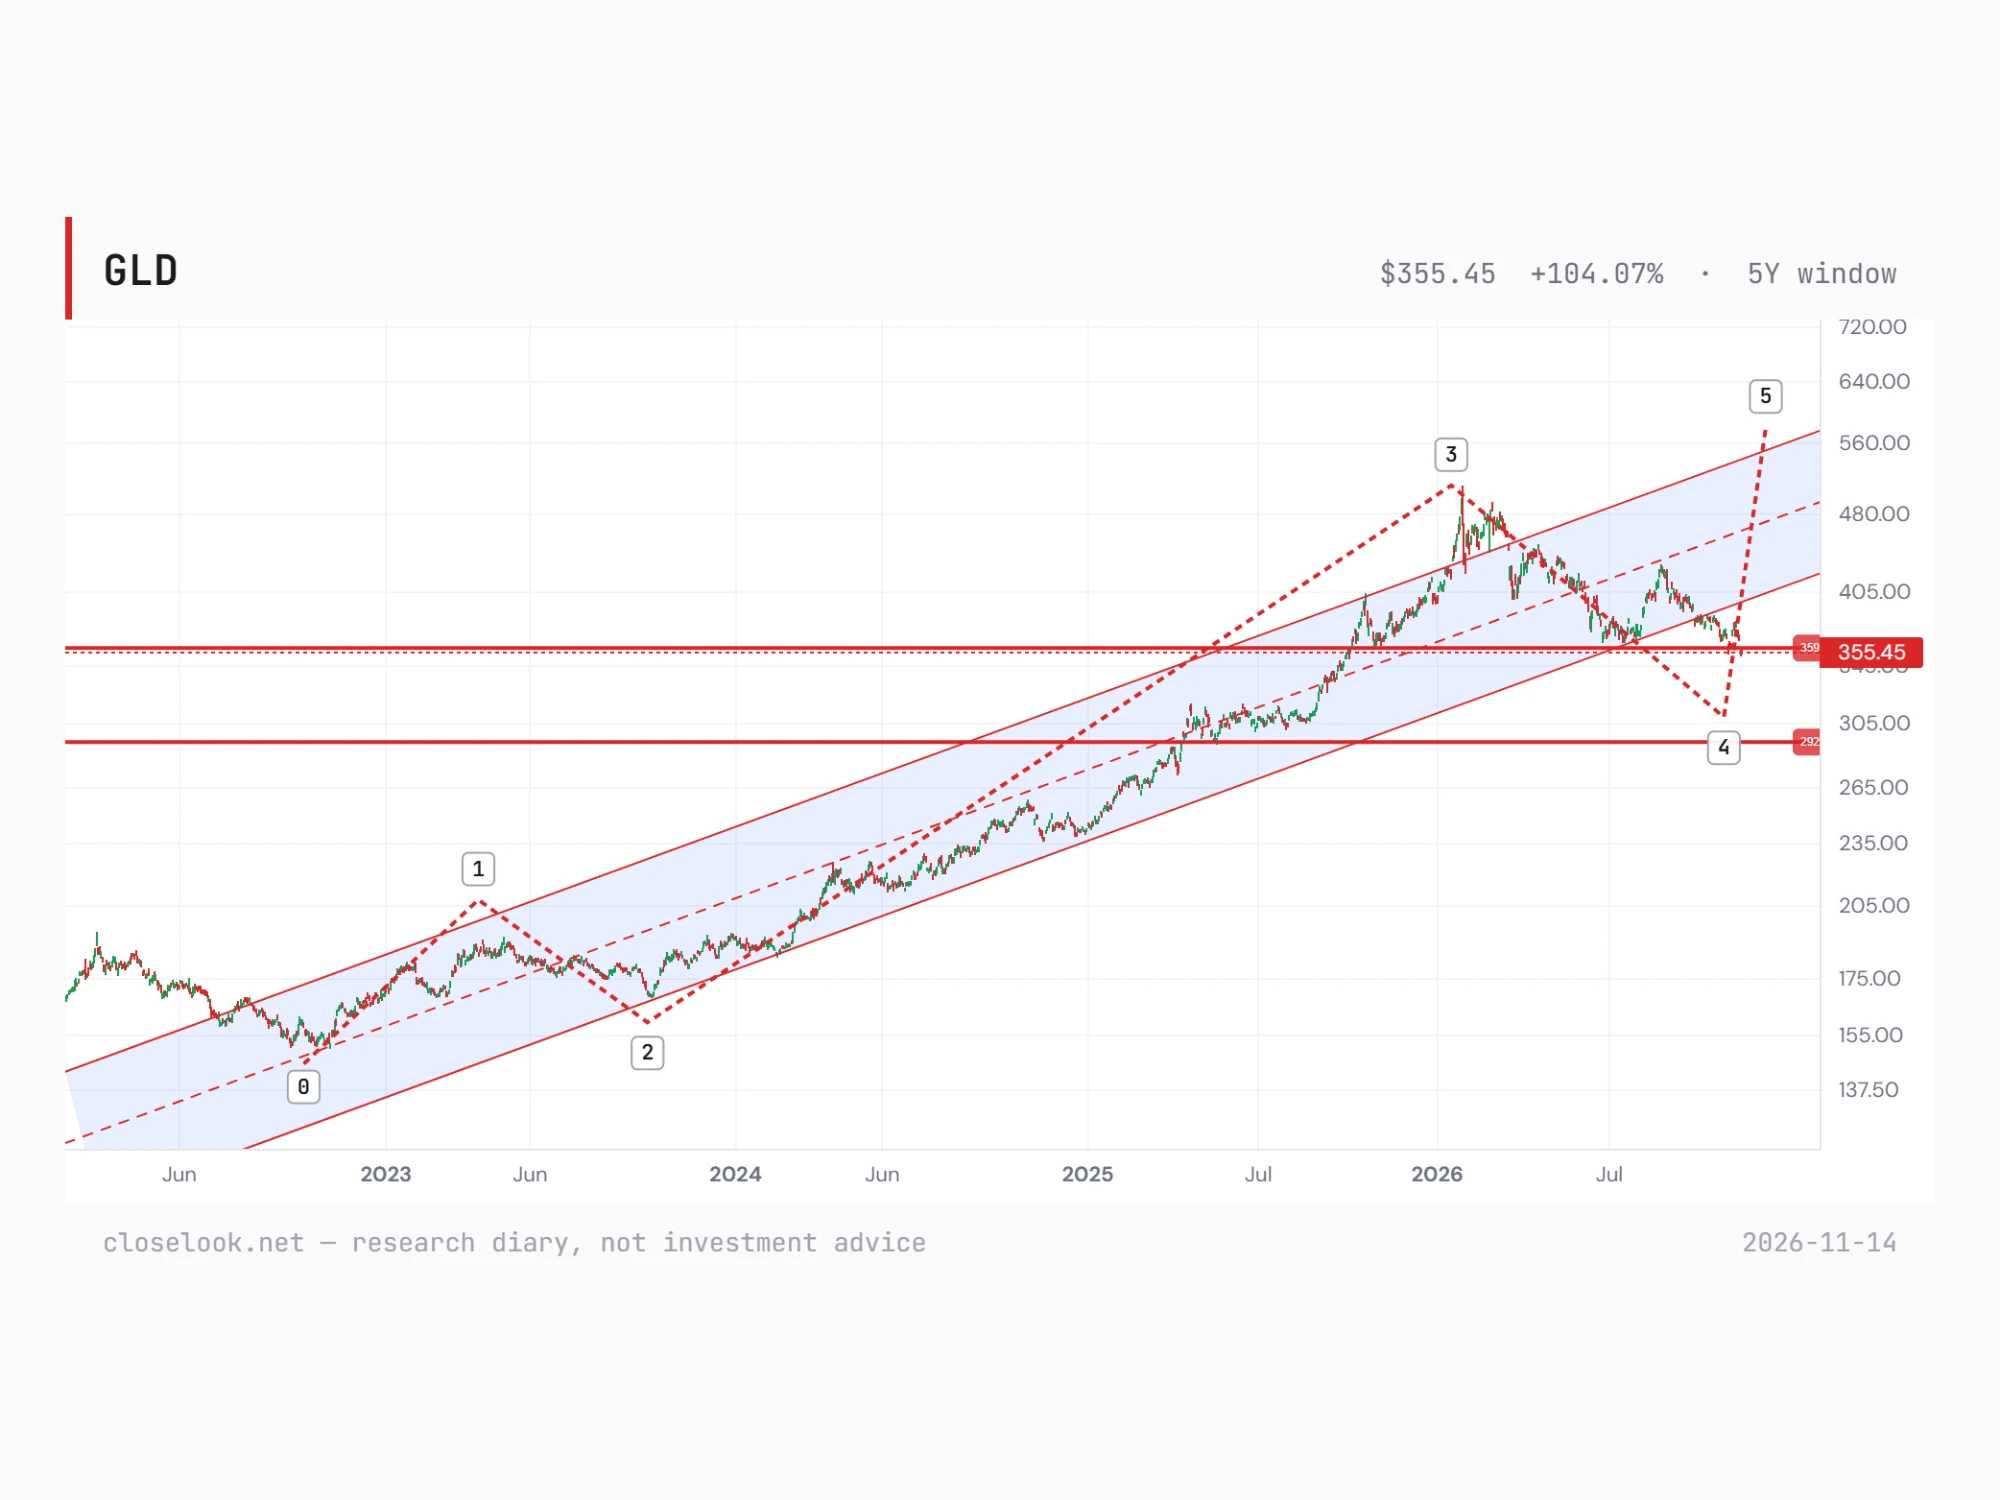
Gold fell 4.58% to 355.45 — back under the 364 support it regained a week ago. Last week this letter wrote that gold rose while the stocks fell and yields fell. This week yields rose, the dollar rose, and gold fell to its lowest close in a year on Thursday, 354.89. Silver fell 5.85% to its own one-year low. On the editor’s chart the fall did more than lose a level; §3 reads it.
2 · The State
The week, in order. Monday: Jensen Huang had told Nvidia staff on Sunday of an affair with a woman who, the New York Times reported, US intelligence had concluded was a Chinese spy; the board opened an investigation. The chip fund rose 7.5%, the S&P 2.4% — its best day since April — and AMD 13%; Nvidia fell 4.3%. Oil fell on hopes for US–Iran talks. Tuesday: the hot consumer-price report; the ten-year touched 5%; the S&P closed 0.4% lower; SoftBank’s $3.7 billion loss on power equipment took GE Vernova down 7%. Wednesday: CoreWeave beat its forecasts, raised its outlook and rose 24%; the chip index rose 5.7%; the S&P closed back above its level from before the sell-off of the week before. Bonds were closed for Veterans Day. Thursday: a report that Nvidia’s board was preparing to remove Huang, then his resignation; finance chief Colette Kress became interim chief executive. Nvidia cut a 14% fall to about 4% by the close; AMD and Broadcom rose 6%; Nebius fell 15% after moving its year forecast to the low end of its range. Friday: Cisco and Applied Materials both reported above their own forecasts on Thursday evening, and both fell; producer prices rose 6.5% on the year; AMD fell 8.8% and the chip fund 3.7%.
The mechanism, named: the suppliers bounced, the largest one did not. AMD rose 18.9% on the week, Broadcom 18.2%, Micron 12.8%, Lam Research 12.7%, Applied Materials 11.4% — and Nvidia fell 12.8% to its lowest close of the past year. The market bought the chip makers back after the week before, and sold the one whose leadership was in question. Under the bounce ran the rates: a hot inflation report, a two-year up 34 basis points, a ten-year back above 5%. The best day came before the report; of the four closes from the report day on, three were lower.
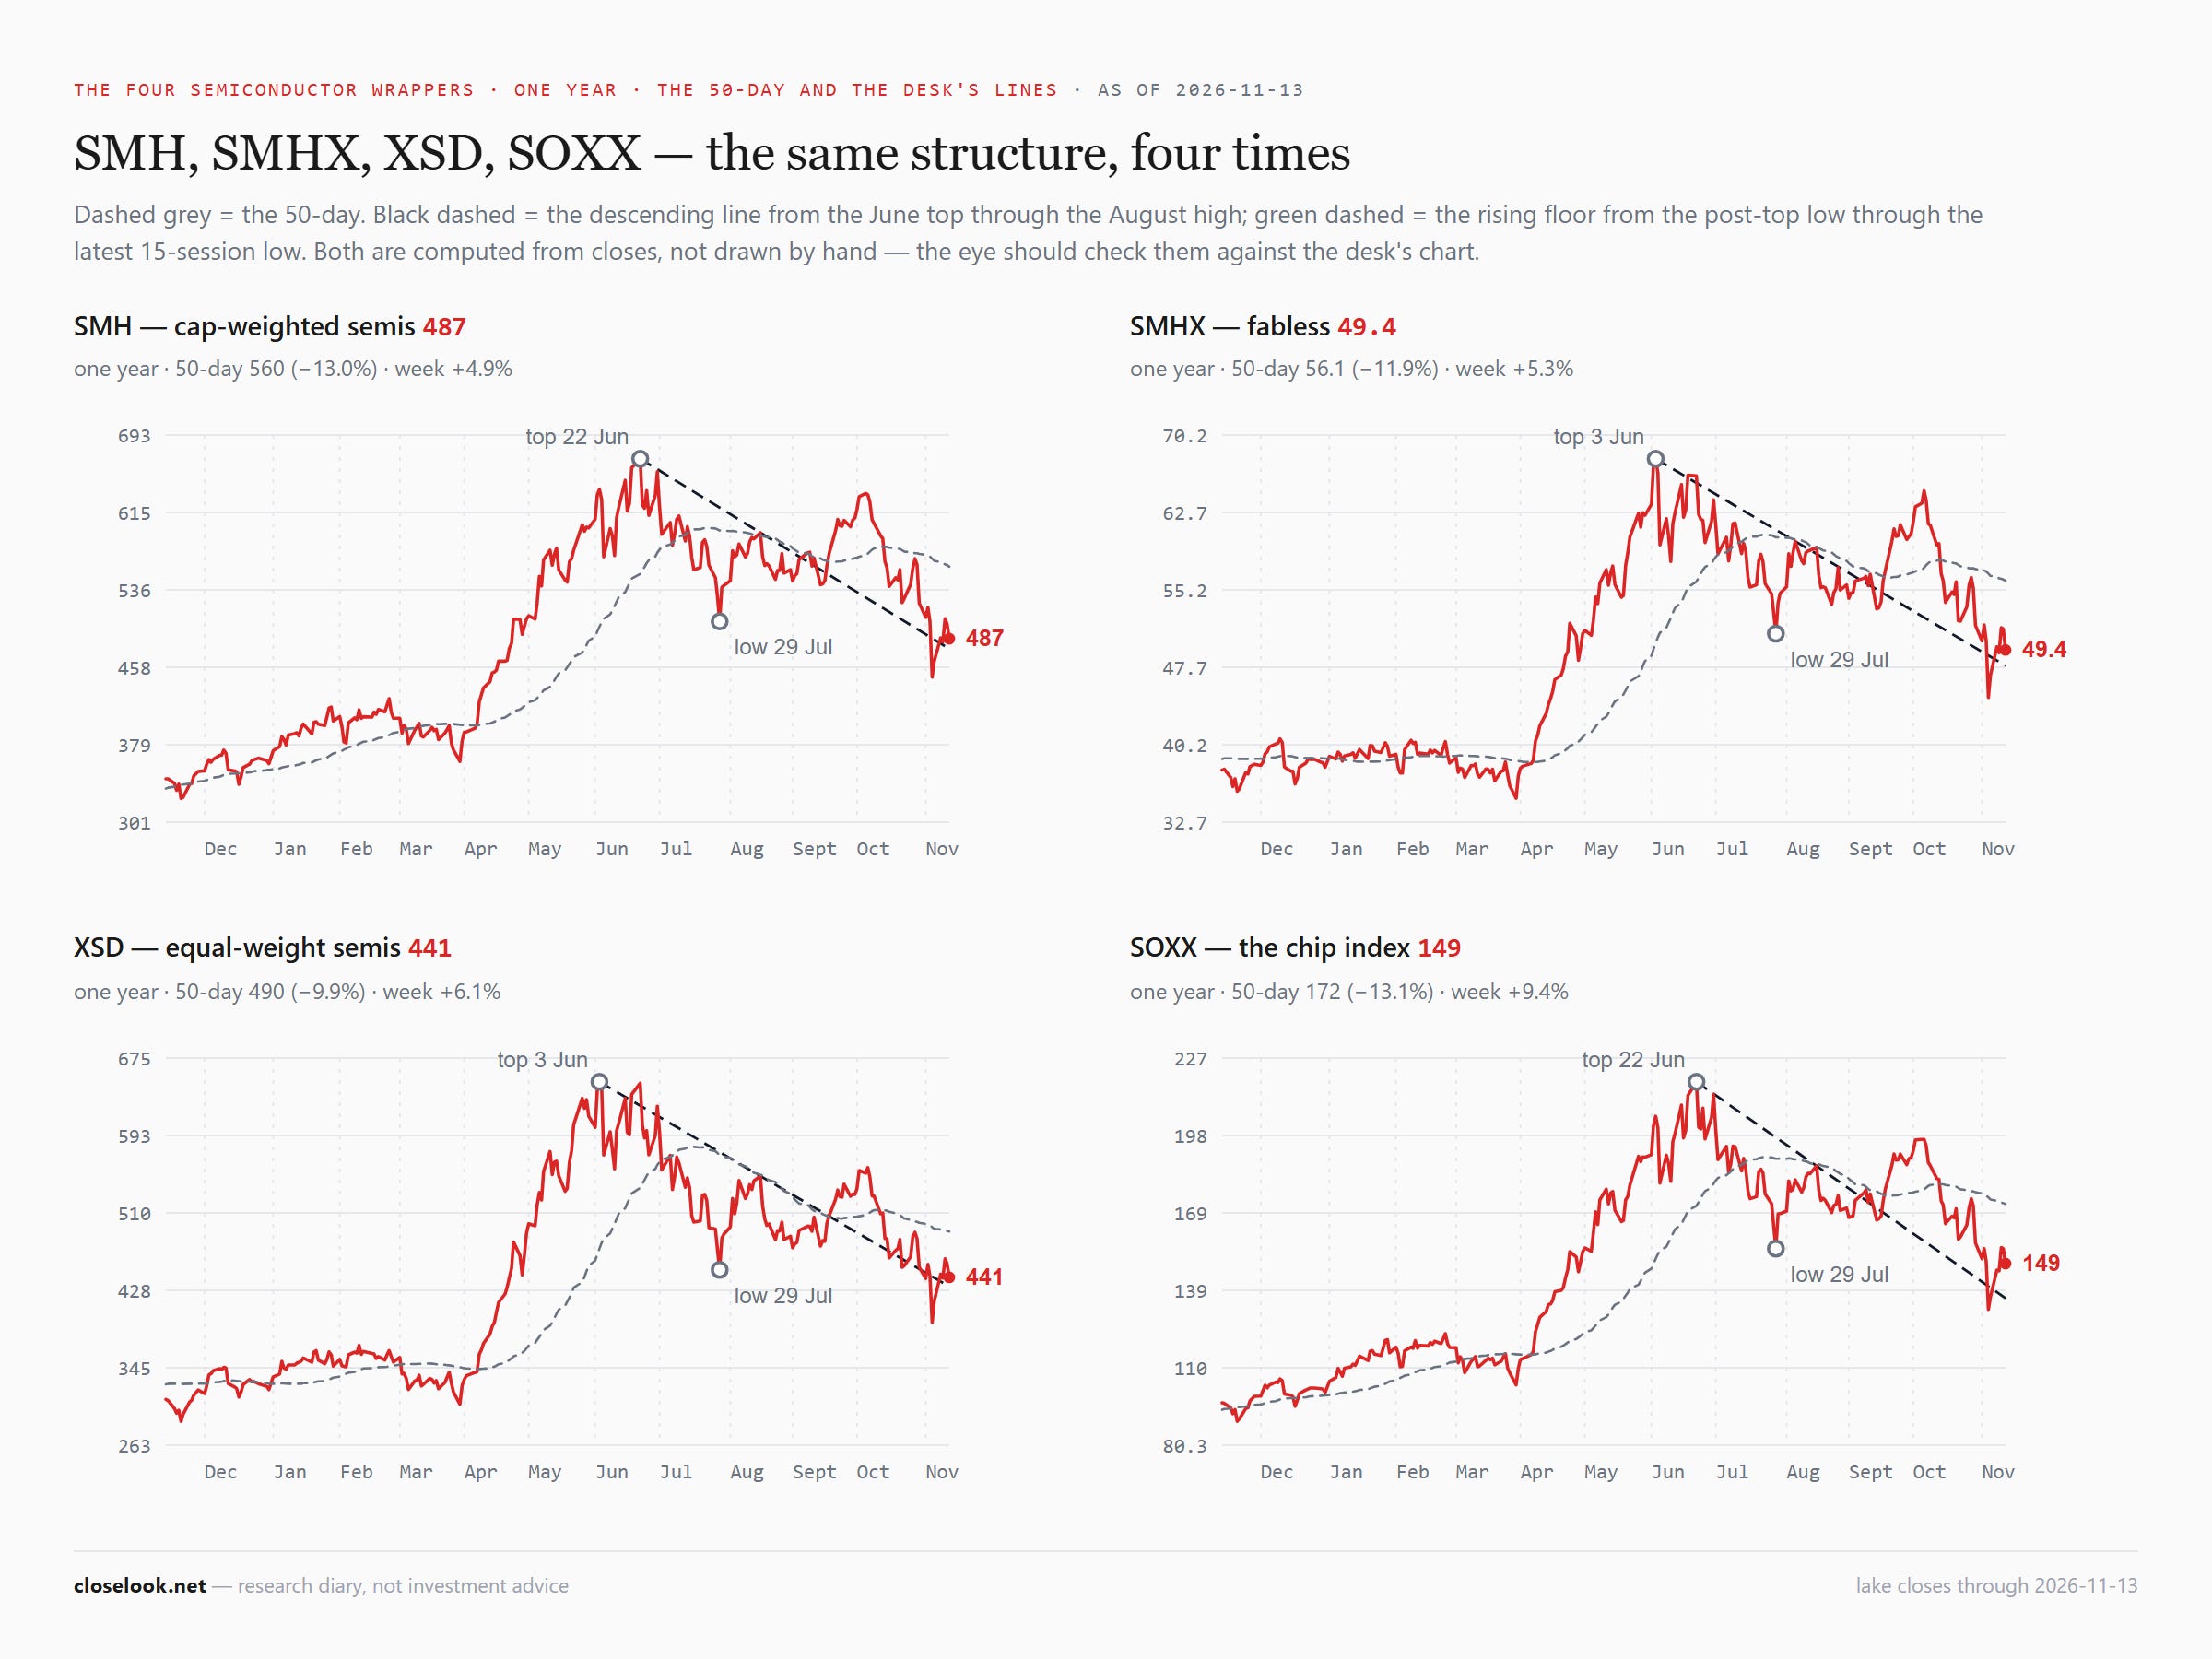
The chips — back inside the range, under the averages. SOXX closed at 149.30, up 9.35%, back above the 131.90 close of 5 November, the low since June. It is 31.6% under its June 22 high, 13.1% under its 50-day and 6.9% under its 200-day. SMH 486.75, 27.2% under its June high; XSD 441.38, 32.1% under its June 3 high; the fabless fund 49.37, 27.2% under.
The small chip names rose more. XSD rose 6.1%, SMH 4.9%, and XSD/SMH rose from 0.896 to 0.907 — a second week in the same direction. The equal-weight chip fund is gaining on the cap-weight one; the largest weight in the cap-weight fund is the one name that fell.
Software — up, behind, still no leader. IGV 101.19, back above 100; CLOU 26.38; CIBR 95.04. Software rose about half as much as the chips. Inside tech the chips led for a week; outside it, health care and staples kept their month, and the equal-weight index kept its year.
3 · The Outlook
Read the week on seven charts. The bull markets of the past three years began at the same place: the lows of late 2022. This week the editor’s charts sort them into three groups — two whose trends are invalidated, one sitting on support, three with their trends intact — and the chips in between. The lines are the editor’s, read off his charts; the closes are the data sheet’s.
Crypto — the trend broke first
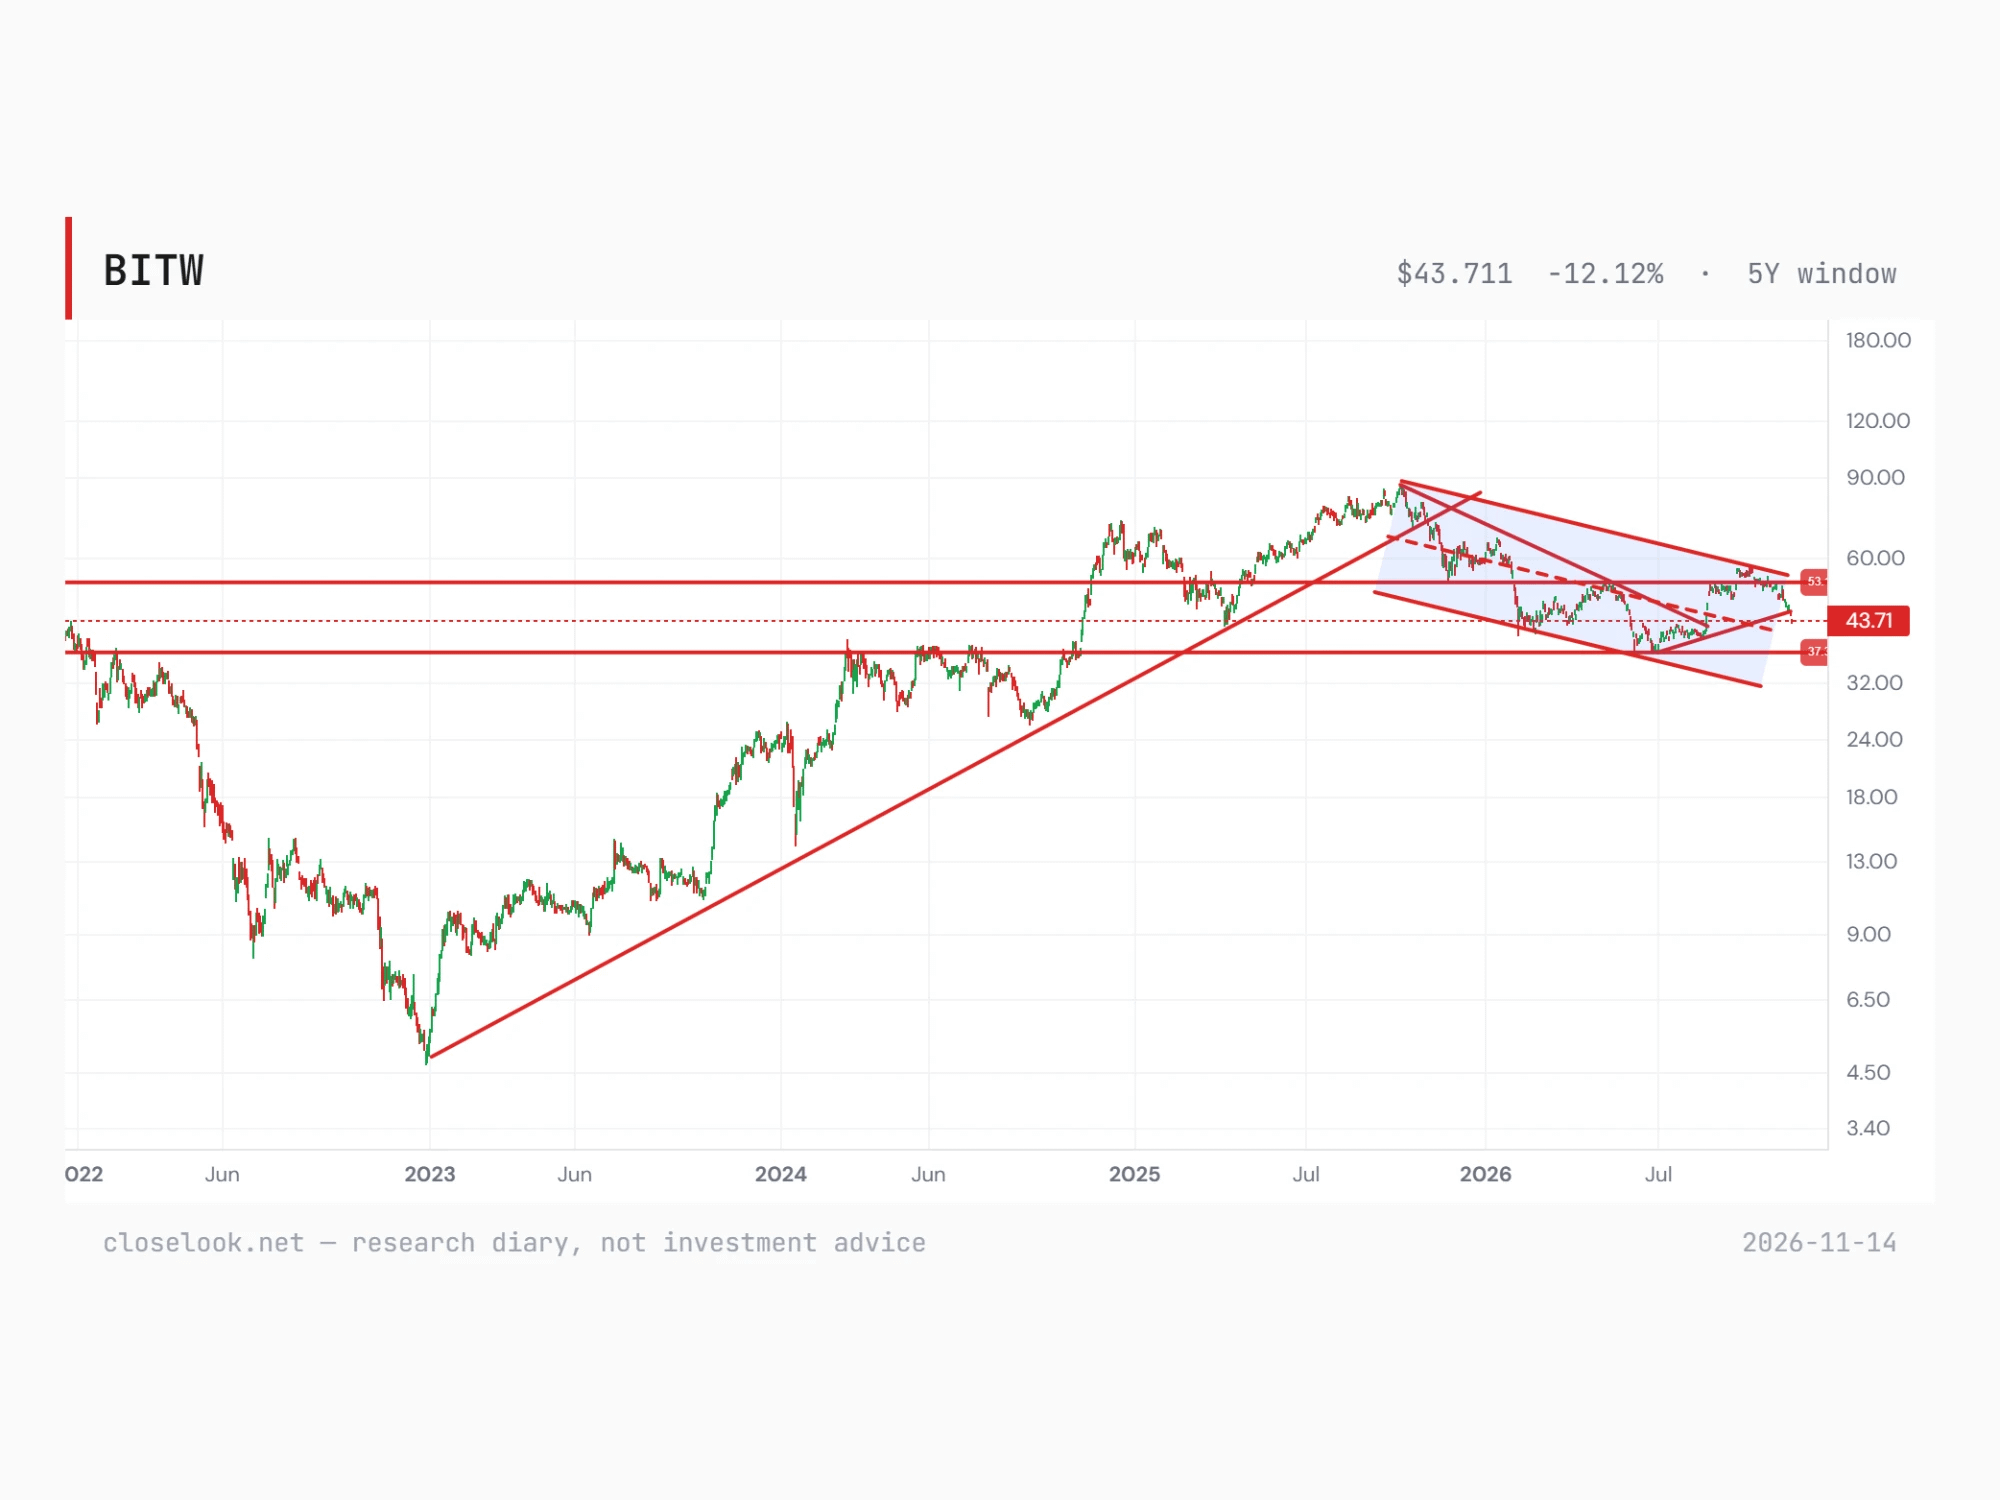
The crypto index fund’s rising line from its late-2022 low broke earlier in the year, and the fund has fallen inside a descending channel since its late-2025 high. The Bitwise 10 Crypto Index fund closed the week at 43.71, between the editor’s lines near 53 above and near 37 below. The bitcoin fund fell 9.19% to 38.94 on the week, and bitcoin closed Friday at 69,556, 30.2% under its close of a year ago to the day, 99,697. A trend line from a major low is the simplest test of a bull market: higher lows along a rising line. Crypto failed it first.
Gold — the trend broke this week
Gold’s channel from the 2022 low held through three years and a 2026 record. This week the fund closed under it. On the editor’s chart the fund rose from its late-2022 low in a rising channel to the January 29 record close of 495.90, which his count marks as the top of the third wave. Friday’s 355.45 sits under the channel’s lower line and under his 359 line; the next line below is 292. The fund is 28.3% under its record and still about double where it stood five years ago. The bull-market trend that began in 2022 is invalidated on this chart. What follows is a correction of the whole rise; the chart marks where the next support sits, not how long it takes.
Next on the line — the Nasdaq 100 sits on support
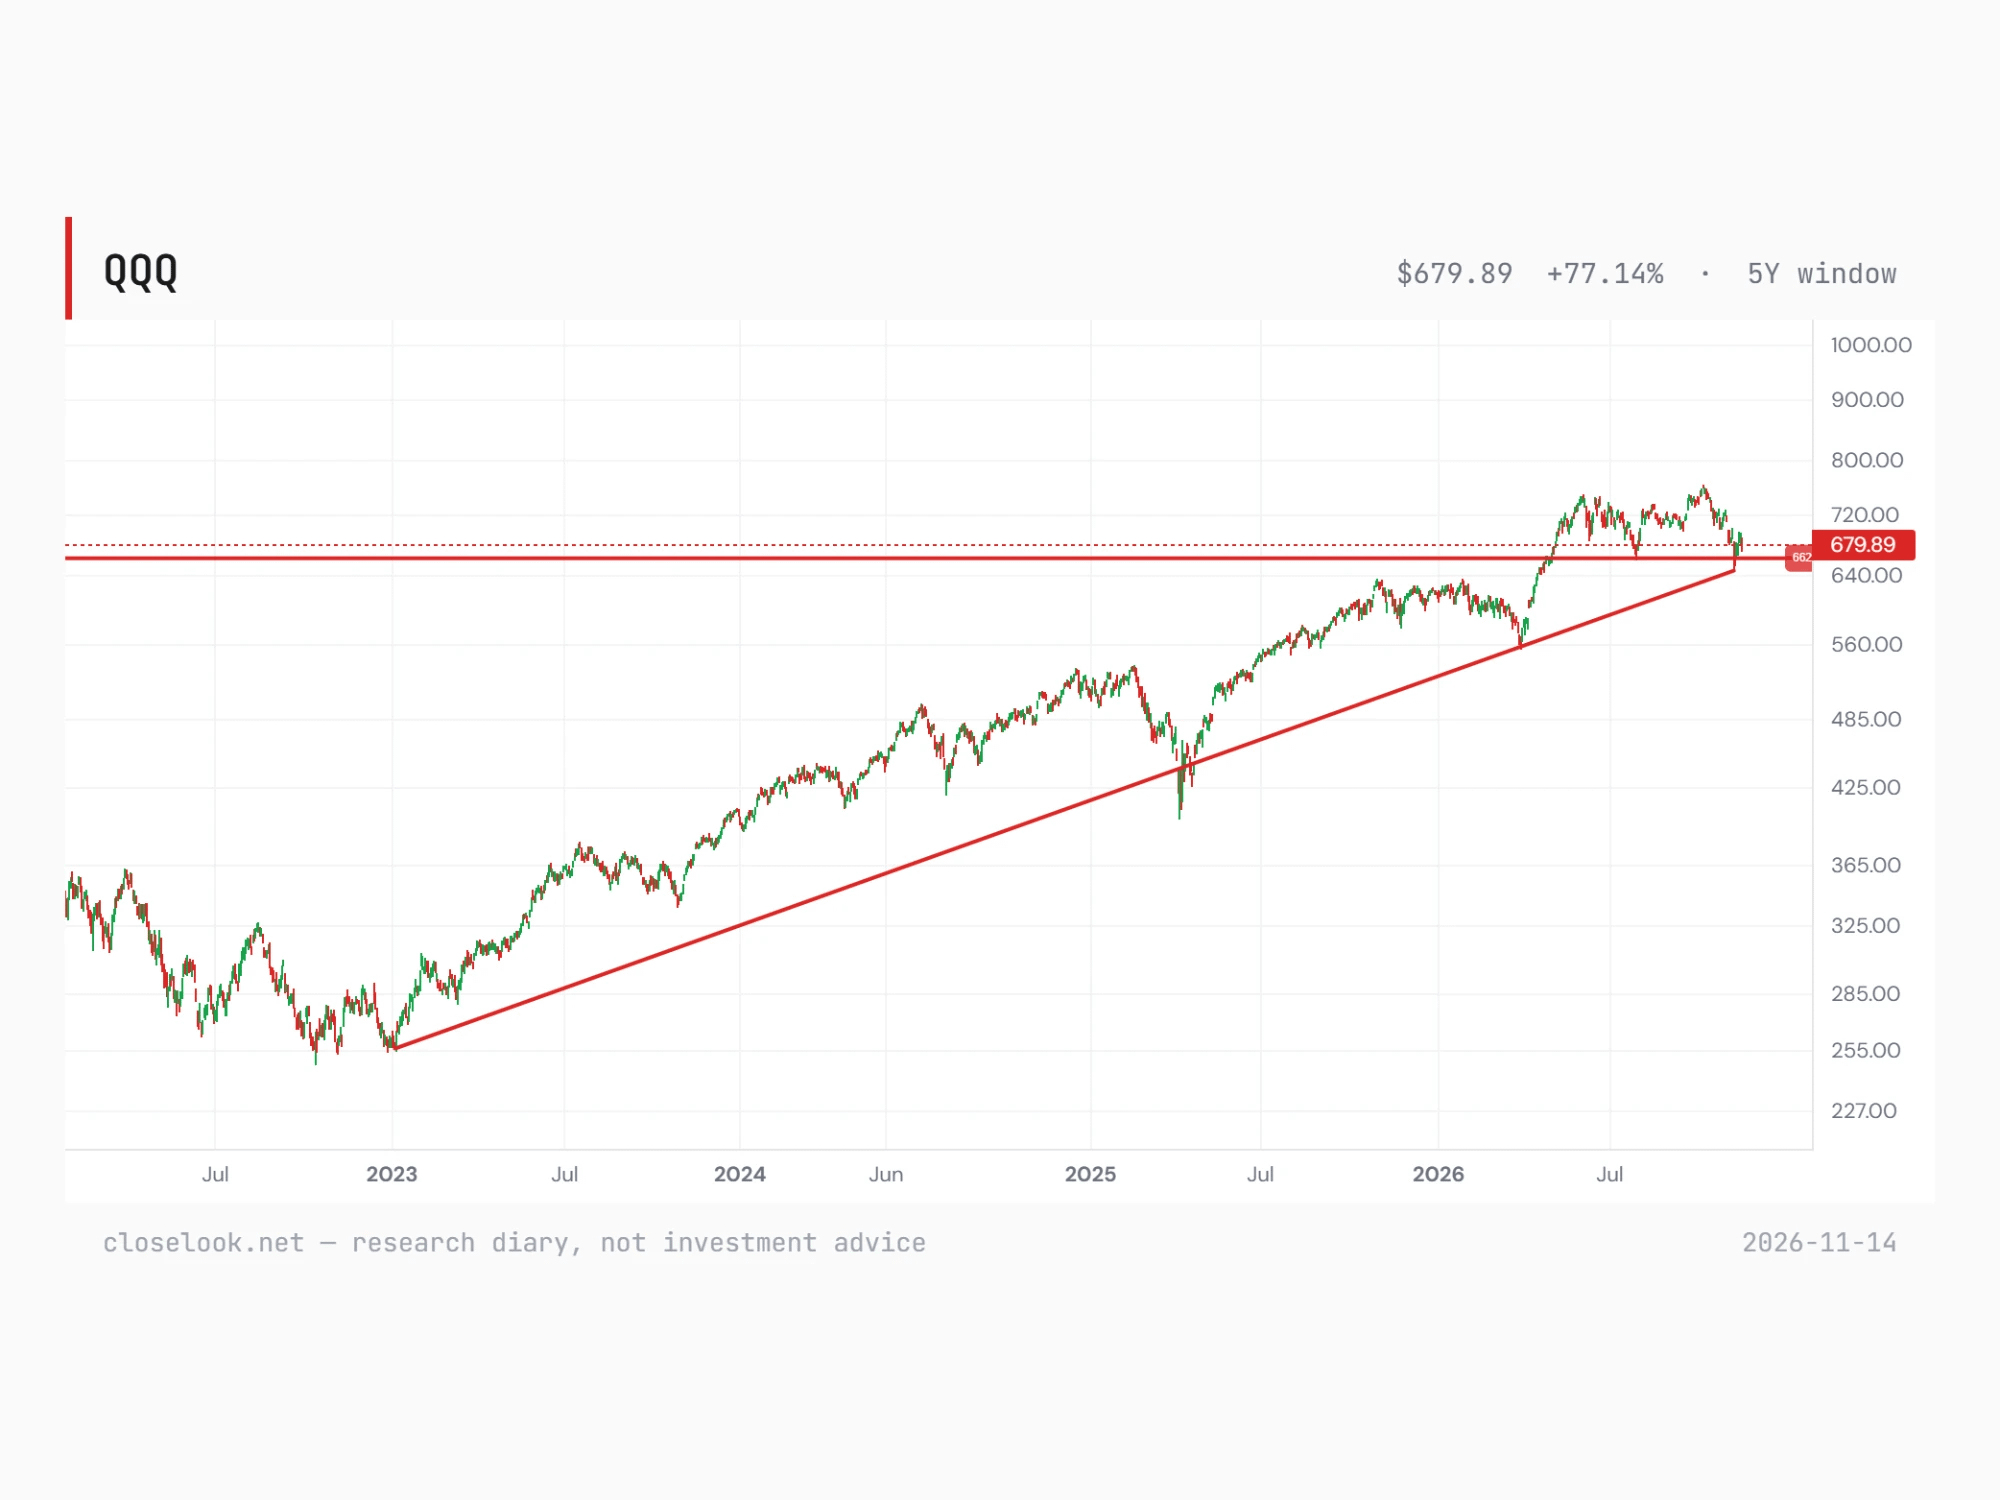
Global and US stocks began their advance from the same late-2022 lows. The world ex-US index closed the week back above its summer-low support, as Saturday’s Global letter reads. The Nasdaq 100 fund sits on support. On the editor’s chart a horizontal line at 662 carried this week’s low — the fund’s lowest price of the week was 662.02 — and under it runs the rising line from the late-2022 low of 260.10 through the April 2025 low and the March 2026 low of 558.28, which the fund came within a few points of a week ago. Friday’s 679.89 sits 2.7% above 662.
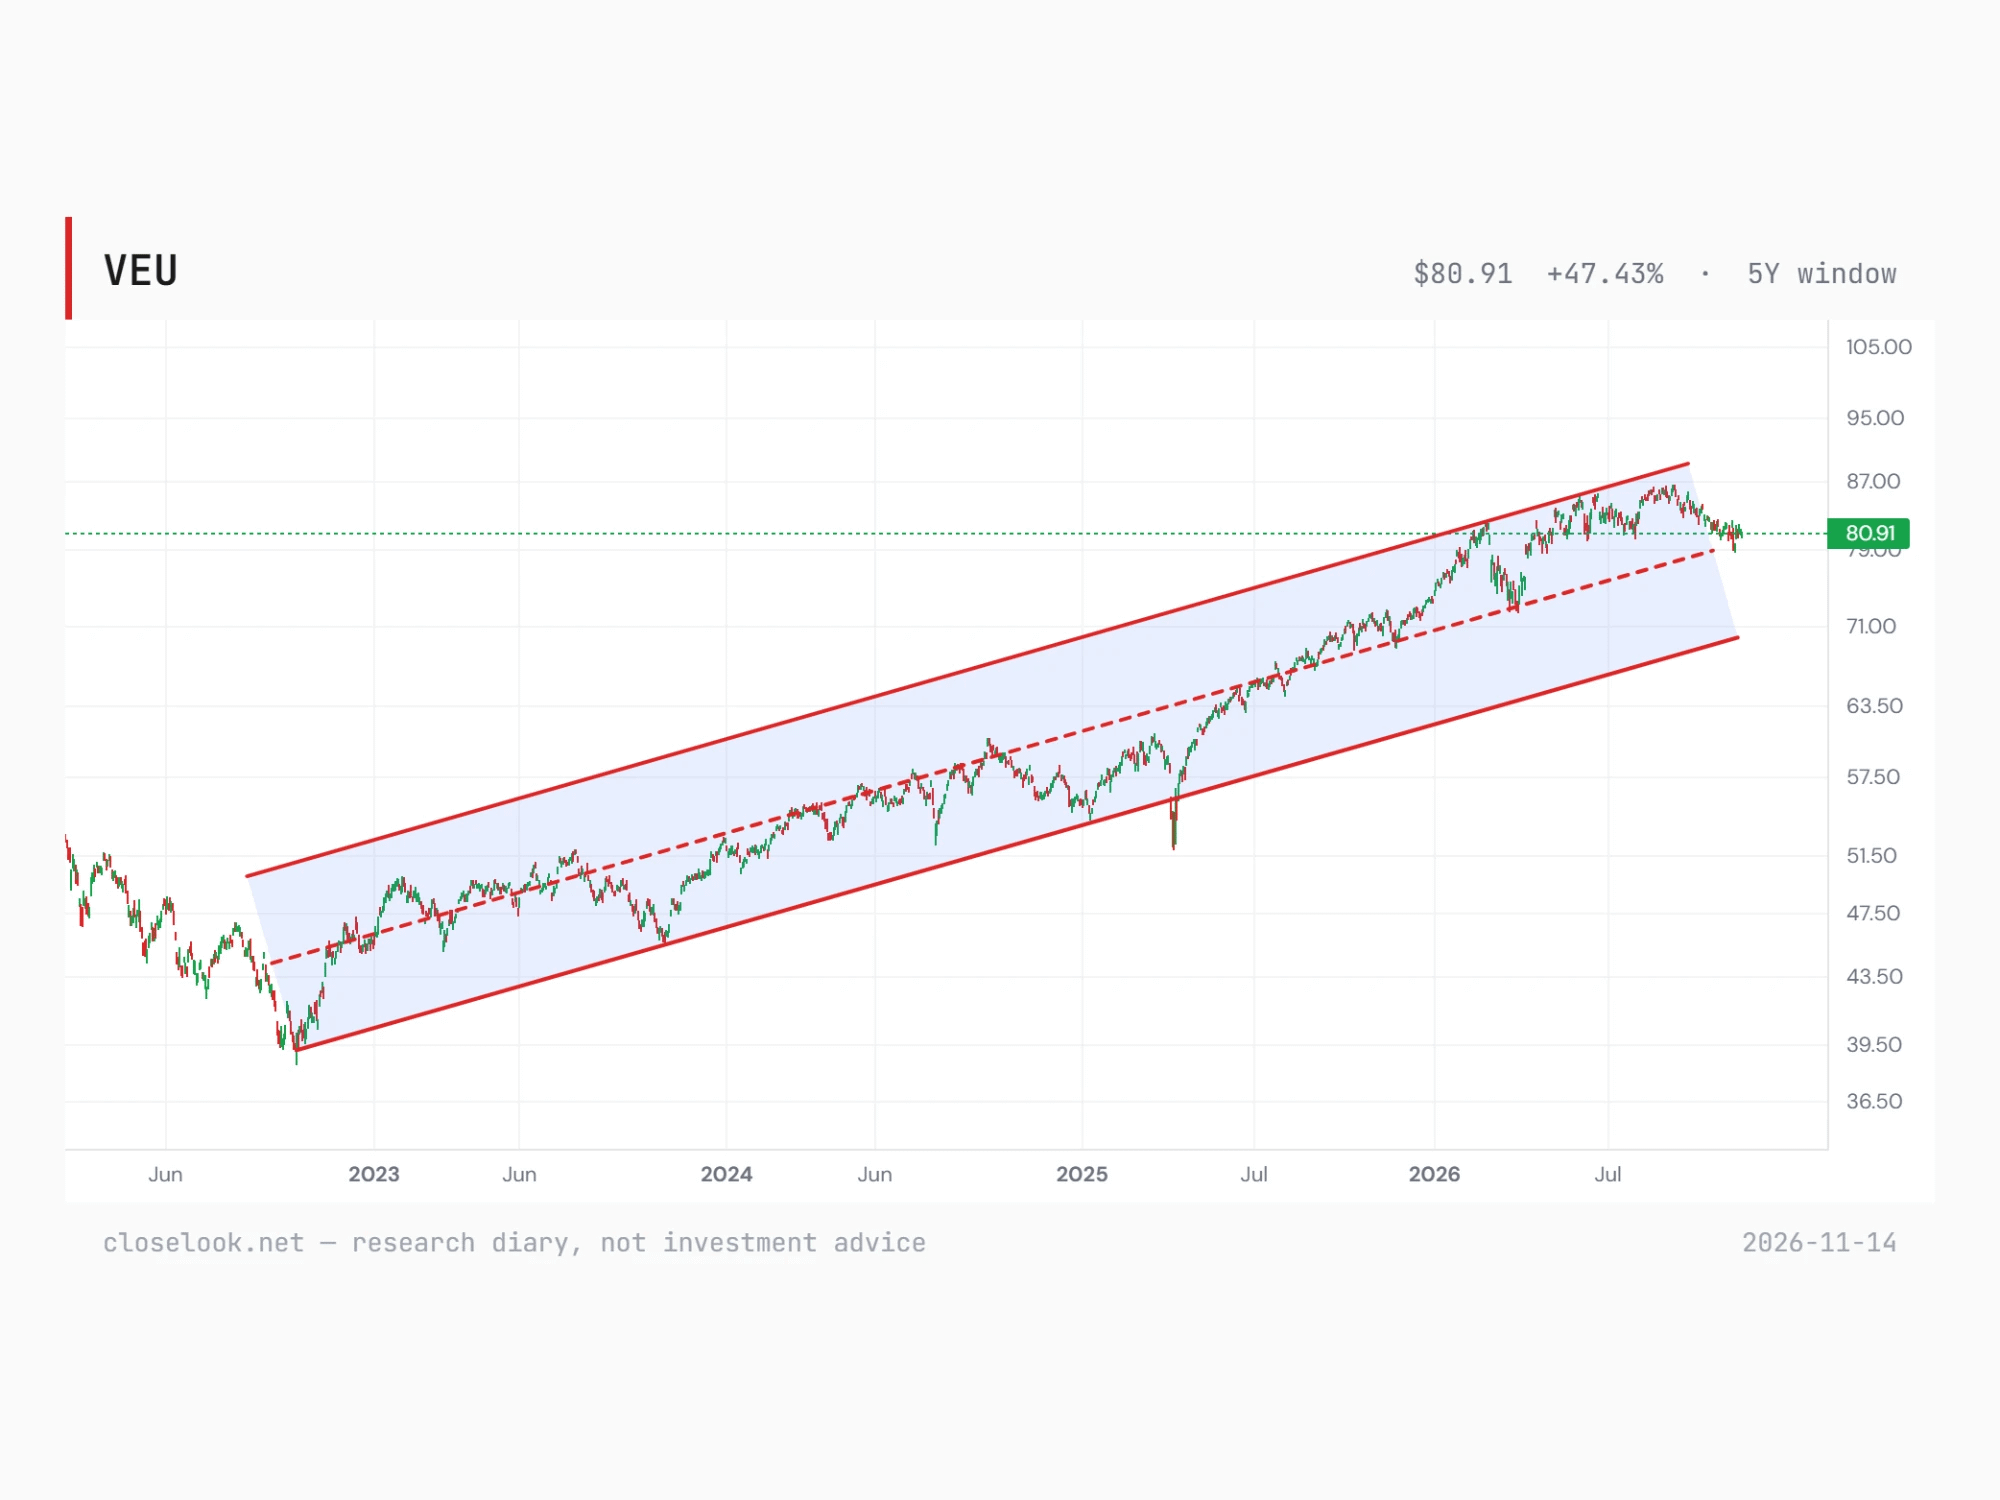
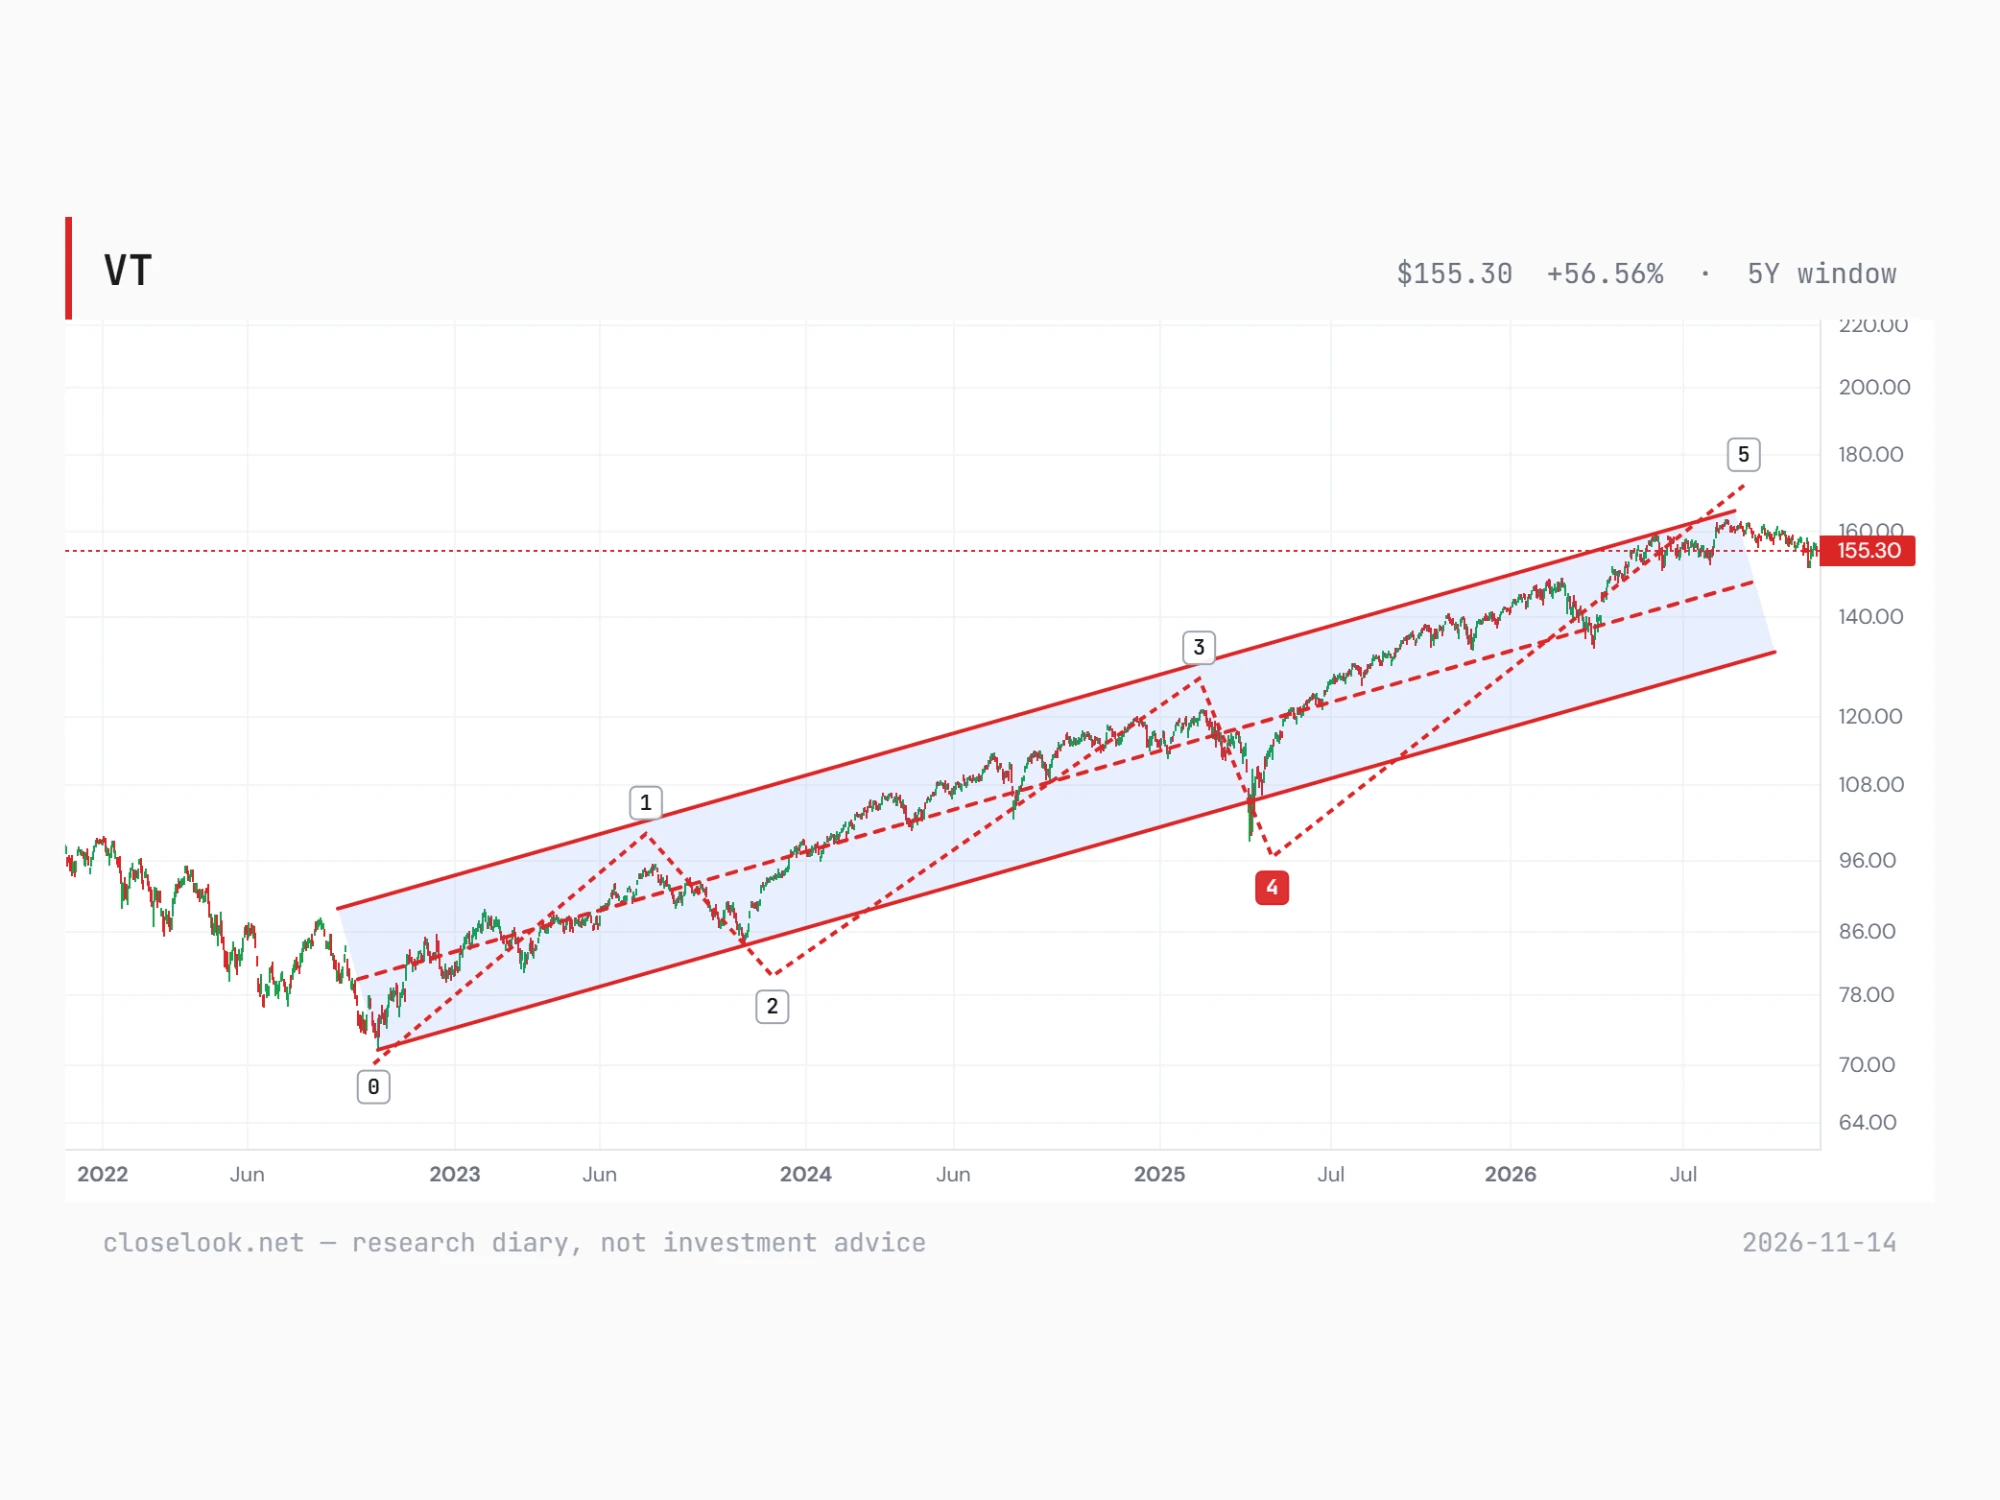
The world funds — trends intact. On the editor’s charts both world funds still trade inside the channels they have held since the late-2022 low. The world ex-US fund closed at 80.91, just above its channel’s midline, with the lower line far below; the all-world fund at 155.30, in the upper half of its channel — and his count reads the all-world advance from the April 2025 low as a fifth wave. Global stocks are on the line, not off it.
Why this one decides. Crypto and gold show what a lost trend looks like: the line breaks, the next rally fails under it, the lows keep falling. A weekly close under 662 and then under the 2022 line would put the Nasdaq 100 on the same list. A hold there keeps the 2026 falls in the chips and the software inside a trend that is three years old.
The S&P 500 — no such danger
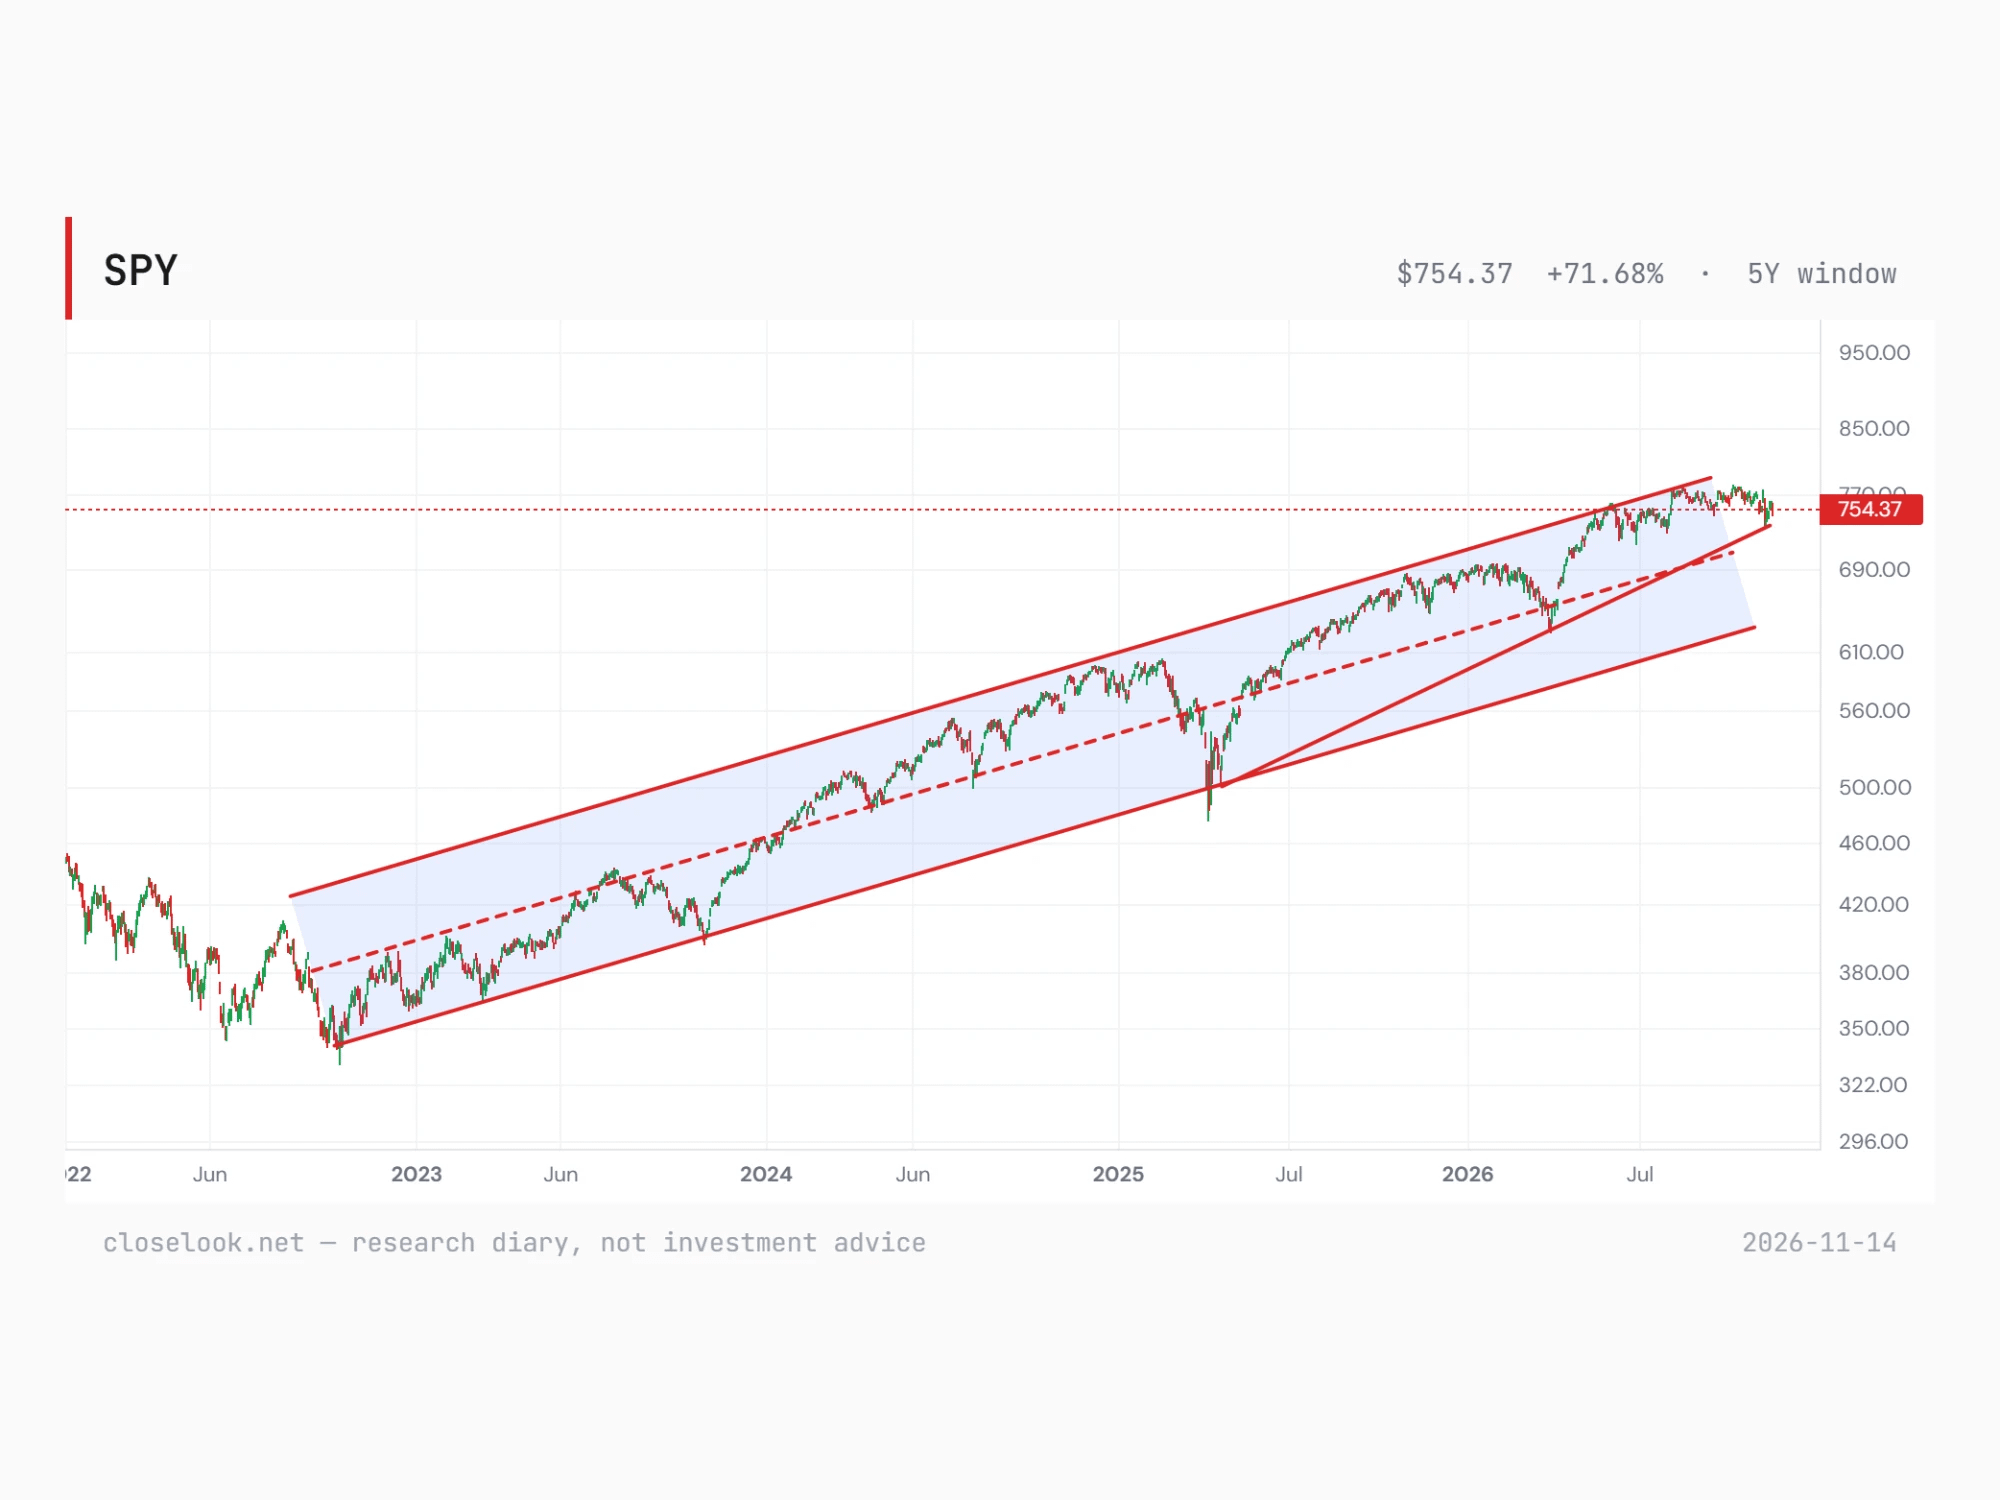
The S&P 500 fund is nowhere near its line. On the editor’s chart it has risen inside a channel from the October 2022 low, with a steeper line from the April 2025 low under the price. Friday’s 754.37 sits on that steeper line, in the upper half of the channel, 3.2% under the October 6 record close of 779.09 — and the channel’s lower line lies far below. The index the market owns most broadly is the one in no danger; the equal-weight S&P, +15.5% on the year, says the same.
The chips — fourth-wave territory
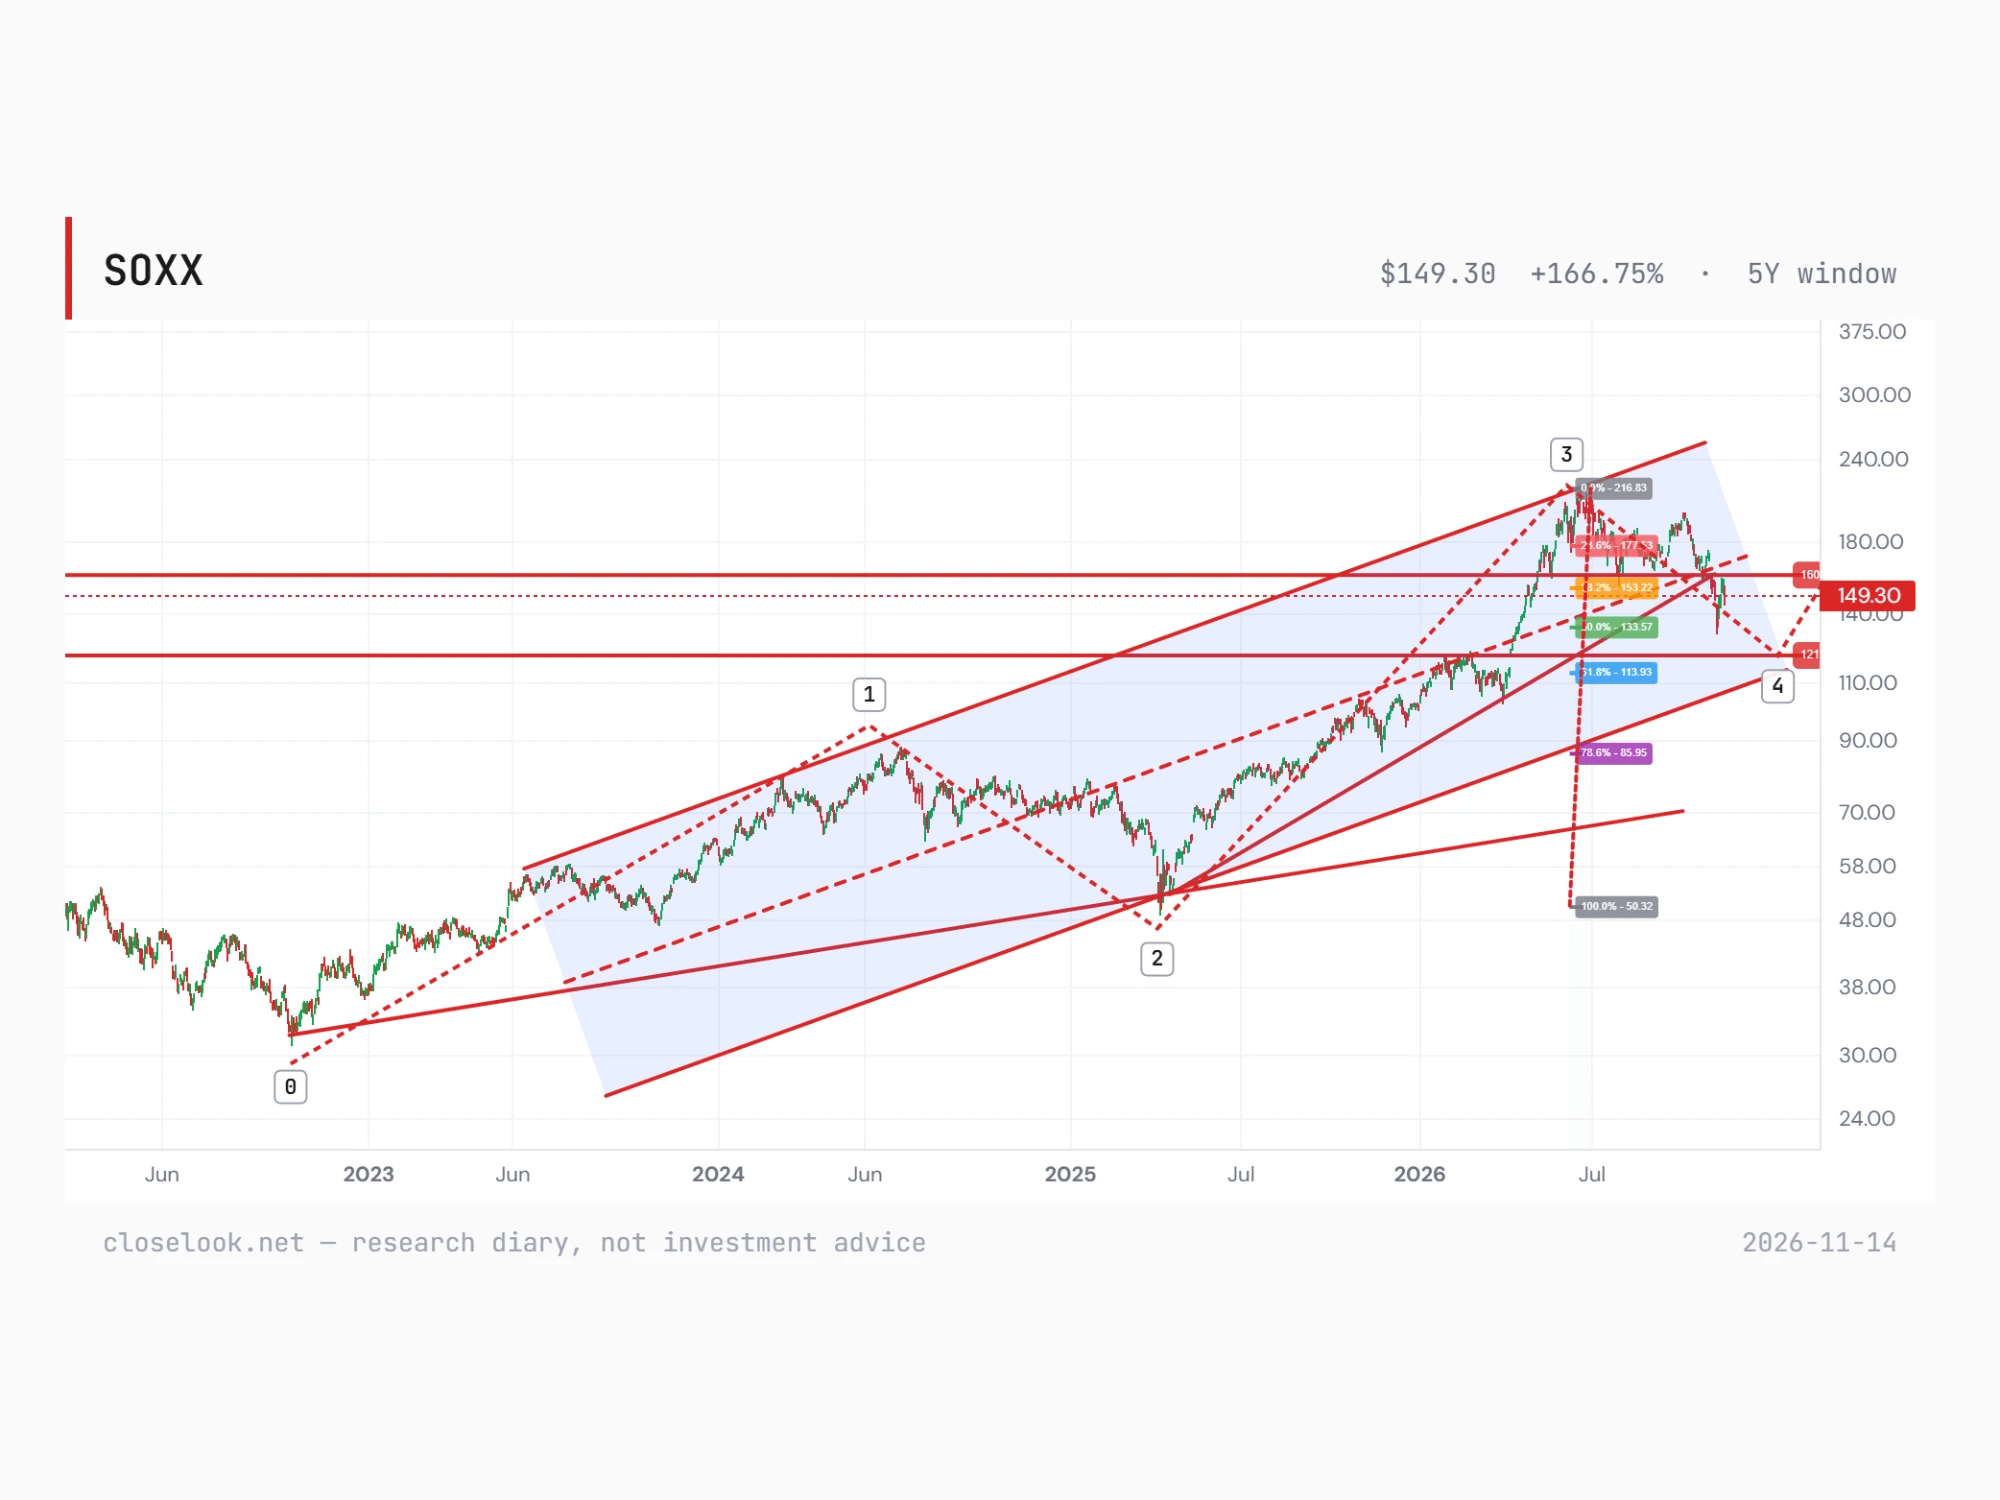
The editor counts the chip fund’s rise from its late-2022 low in waves: a first wave to the mid-2024 high, a second to the April 2025 low, a third to the June 2026 high, and now a fourth — a consolidation of the whole third-wave rise. He measures it against that rise, from the 2025 low to the June high: the 38.2% retracement sits at 153.22, the 50% at 133.57 and the 61.8% at 113.93, with his horizontal lines at 160 and 121. Friday’s 149.30 sits between the 38.2% and the 50% lines; the November 5 close of 131.90 dipped just under the 50% line. On this count the chip bull market is not over: a fourth wave consolidates, a fifth follows. His chart draws the fourth wave ending near the 121 line; a fall well through the deeper retracements would call the count into question. Until then the chips are in a correction inside their trend, not out of it.
The AI indices, against the editor’s lines
The builders back above the 61.8% line. Rubin Build-Out closed at 1,607.60, +8.20% — back above 1,559.55, the 61.8% retracement of its 2026 rally that it broke a week ago. Last week’s Knowledge Corner said a quick weekly close back above it would make the break a false one. That is this close. The zone of 1,704 to 1,735 that broke is now above the price; the spring highs near 1,400 stay the support under it.
The users at their record zone, the applications on their first line. AI Users closed at 1,015.51, +0.35% — on the 1,010 support, 1.9% under its record of 4 November, with the editor’s resistance near 1,035. Agentic Winners closed at 916.18, flat, 1.2% above the 905 support; 890 is the next. The Agentic Ecosystem rose 4.10% to 1,435.64, 7.1% above its 1,340 floor.
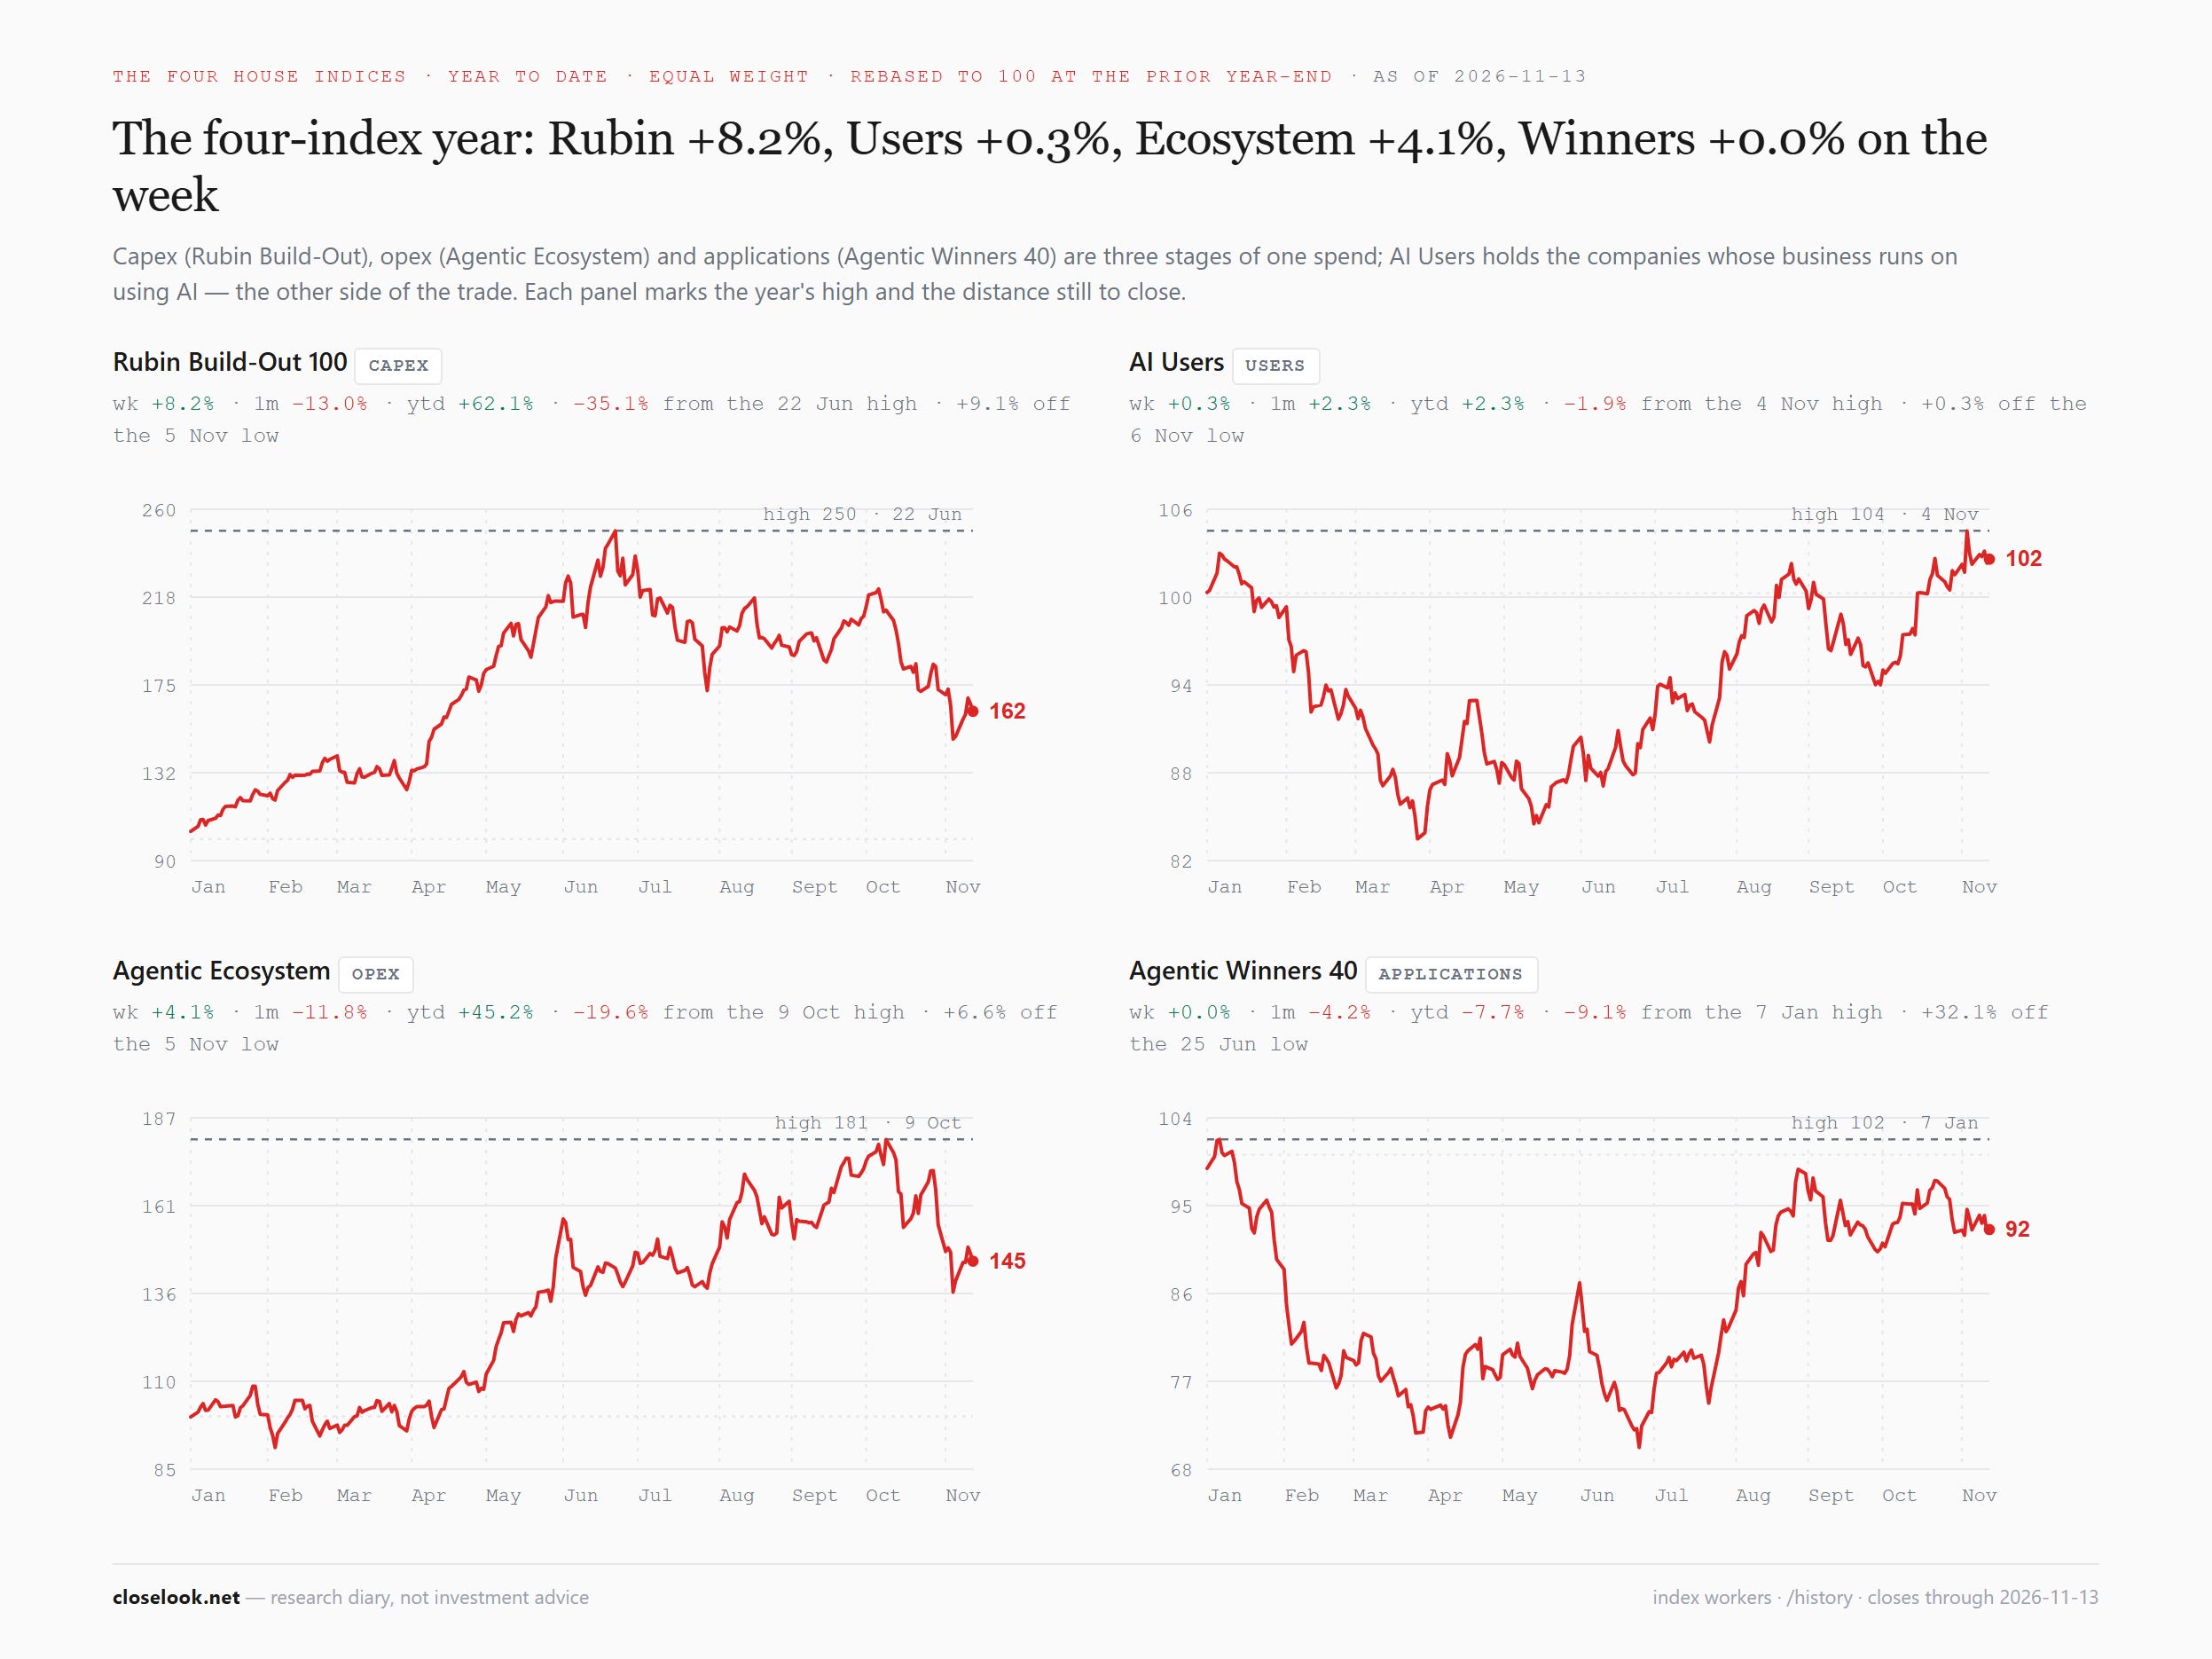
Between the groups. On the month the order is clear: the builders −13.0%, the runners −11.9%, the applications −4.2%, the users +2.3%. On the week the builders led. This diary’s books have started to move toward the users — the adoption side — from Monday; §5 has the plan.
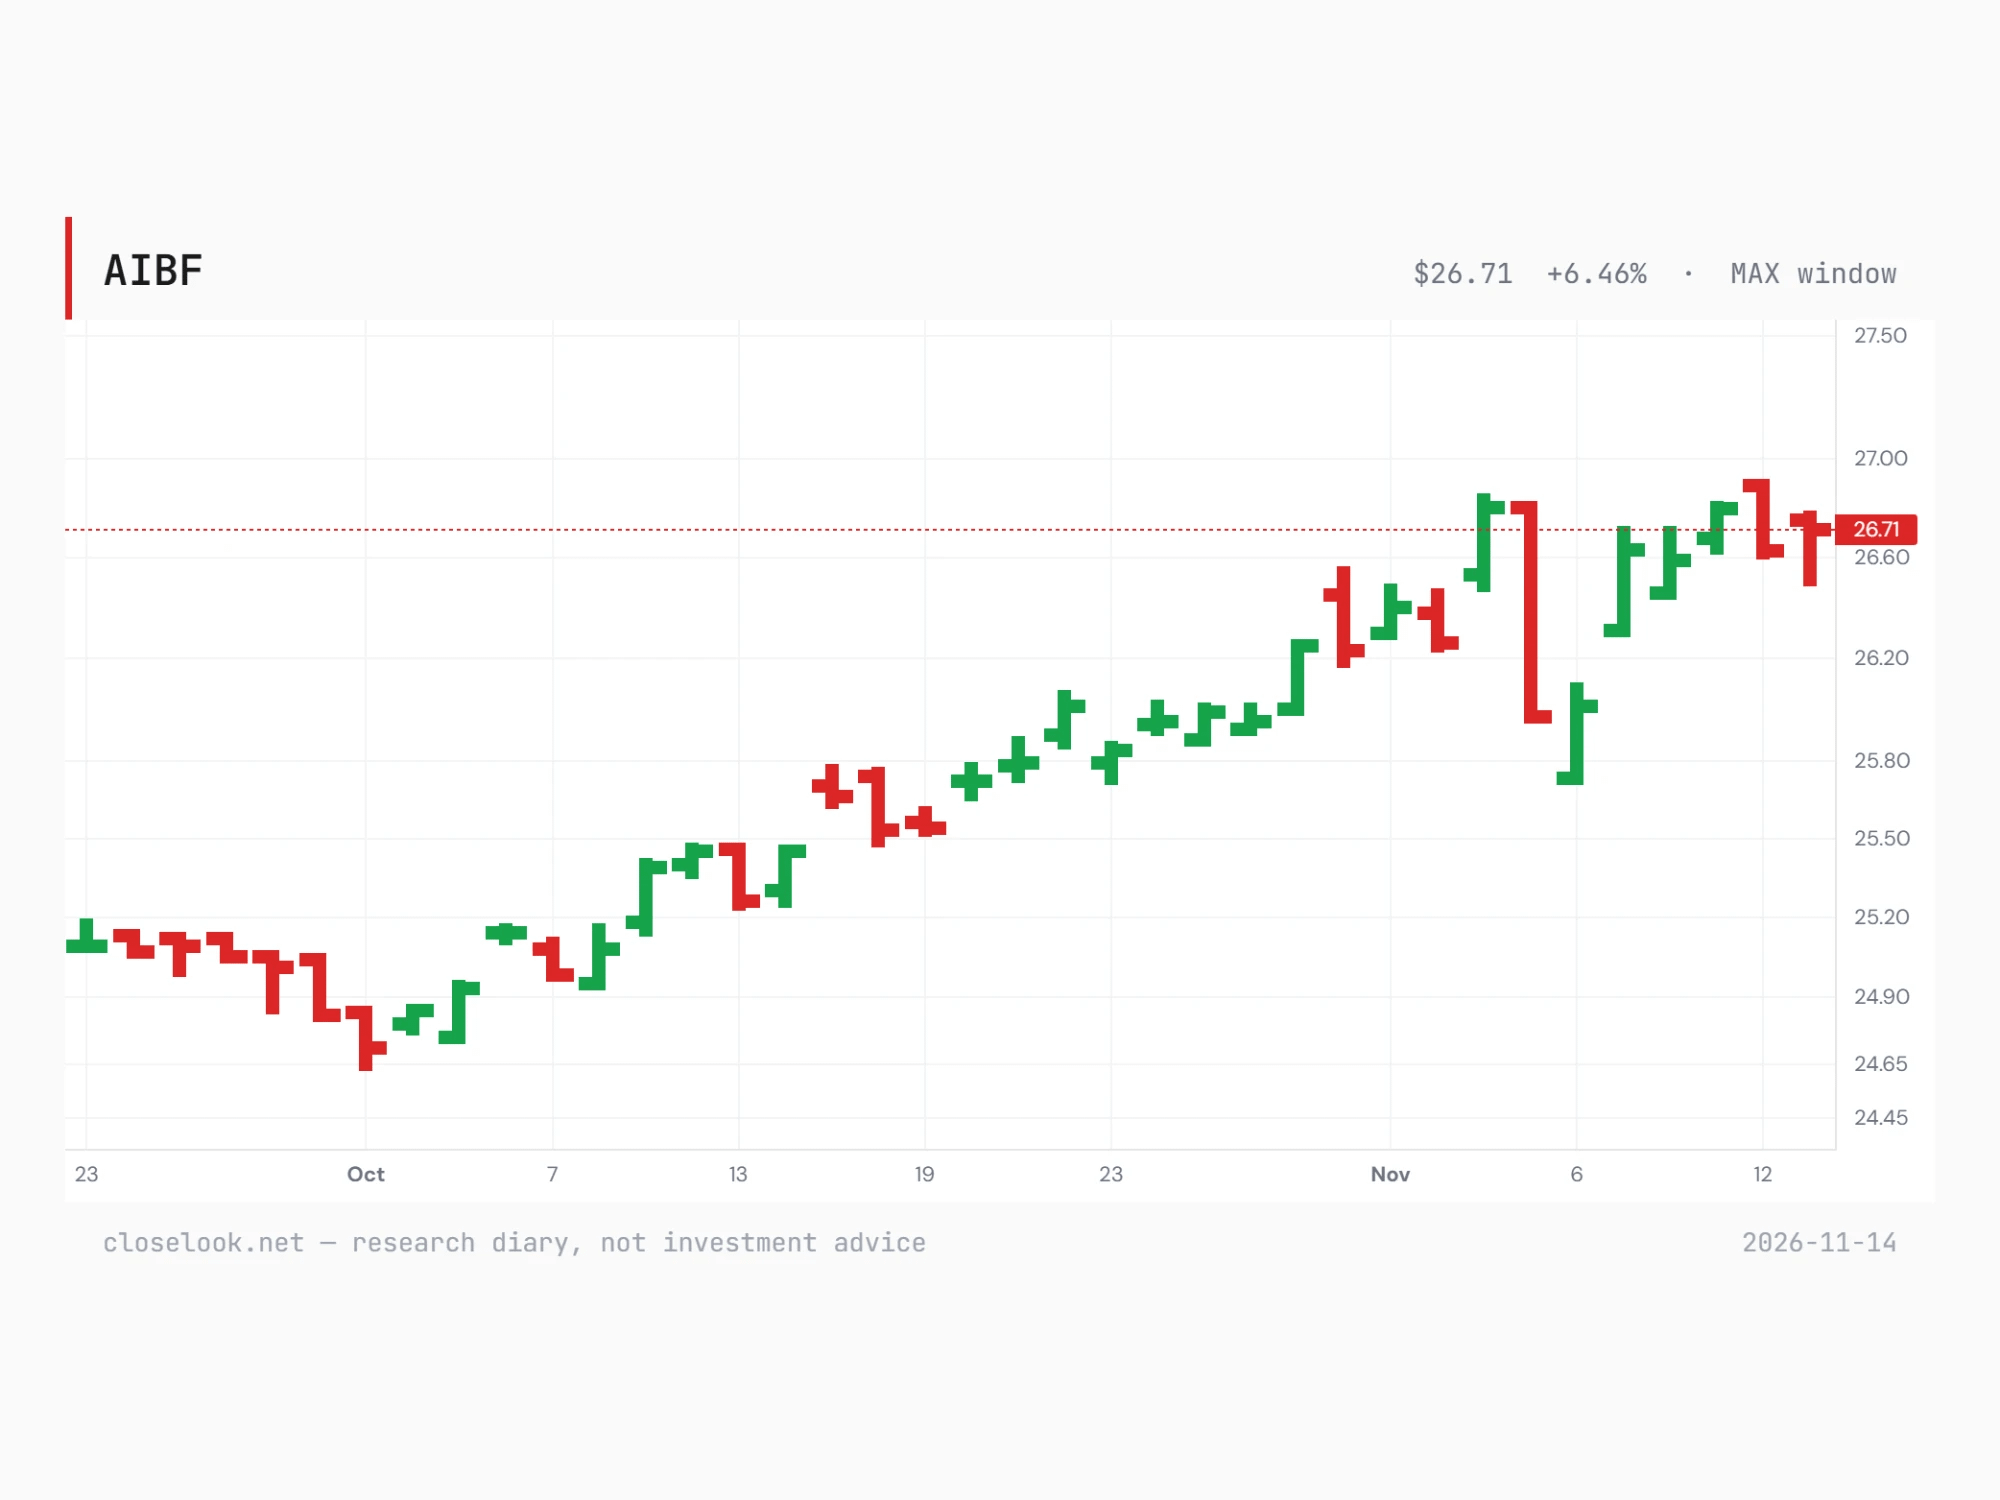
The fund this diary follows for the lead. From here this diary watches one new fund as the lead for the AI trade: the iShares Future AI Beneficiaries fund (AIBF), built around companies expected to gain from using AI rather than from building it. Since its first trading day on 23 September it is up 6.5%, to 26.71, along a line of higher lows; on the month it rose 5.7% while the chip majors fund fell 17.2%. If the users are taking over the lead, this is where it should show first.