


Copper, silver, and gold led every asset on the board. What selling remained had an address: last cycle’s crowded flagships.
Closelooknet is a reader-supported publication — to receive new posts and support the work, become a free or paid subscriber.

This week’s edition of Closelook@Global Stock Markets, dated August 8, 2026.
Last Saturday this letter ended on a deliberate fork: if the supply chain was still offered with no deadline in sight, the crash story was distribution in disguise — if it firmed, July’s damage would be filed as positioning, absorbed. The week answered, and then it kept answering.
Roughly three-quarters of the world’s stock indices closed the week green. The total-world index finished at an all-time high. Every layer of the AI trade — the builders, the operators, the applications — rose seven percent or more in the same five sessions, something that has not happened since this letter began scoring them separately.
And the leadership of the whole board was not a stock market at all: copper miners gained eleven percent, silver ten, gold seven. Only two things on the cross-asset board fell — the dollar, slightly, and oil, by almost nine percent.
A week in which bonds are steady, metals are flying, oil is collapsing, and the world’s equity index prints a record is not a story about earnings, although the earnings were extraordinary. It is a story about the price of money: on Friday the US reported the first negative payroll print of the cycle, and the market concluded — provisionally, loudly — that the rate rise it has feared all summer is not coming. This letter is about what the world’s money did with that conclusion.
1 · This Week’s Action
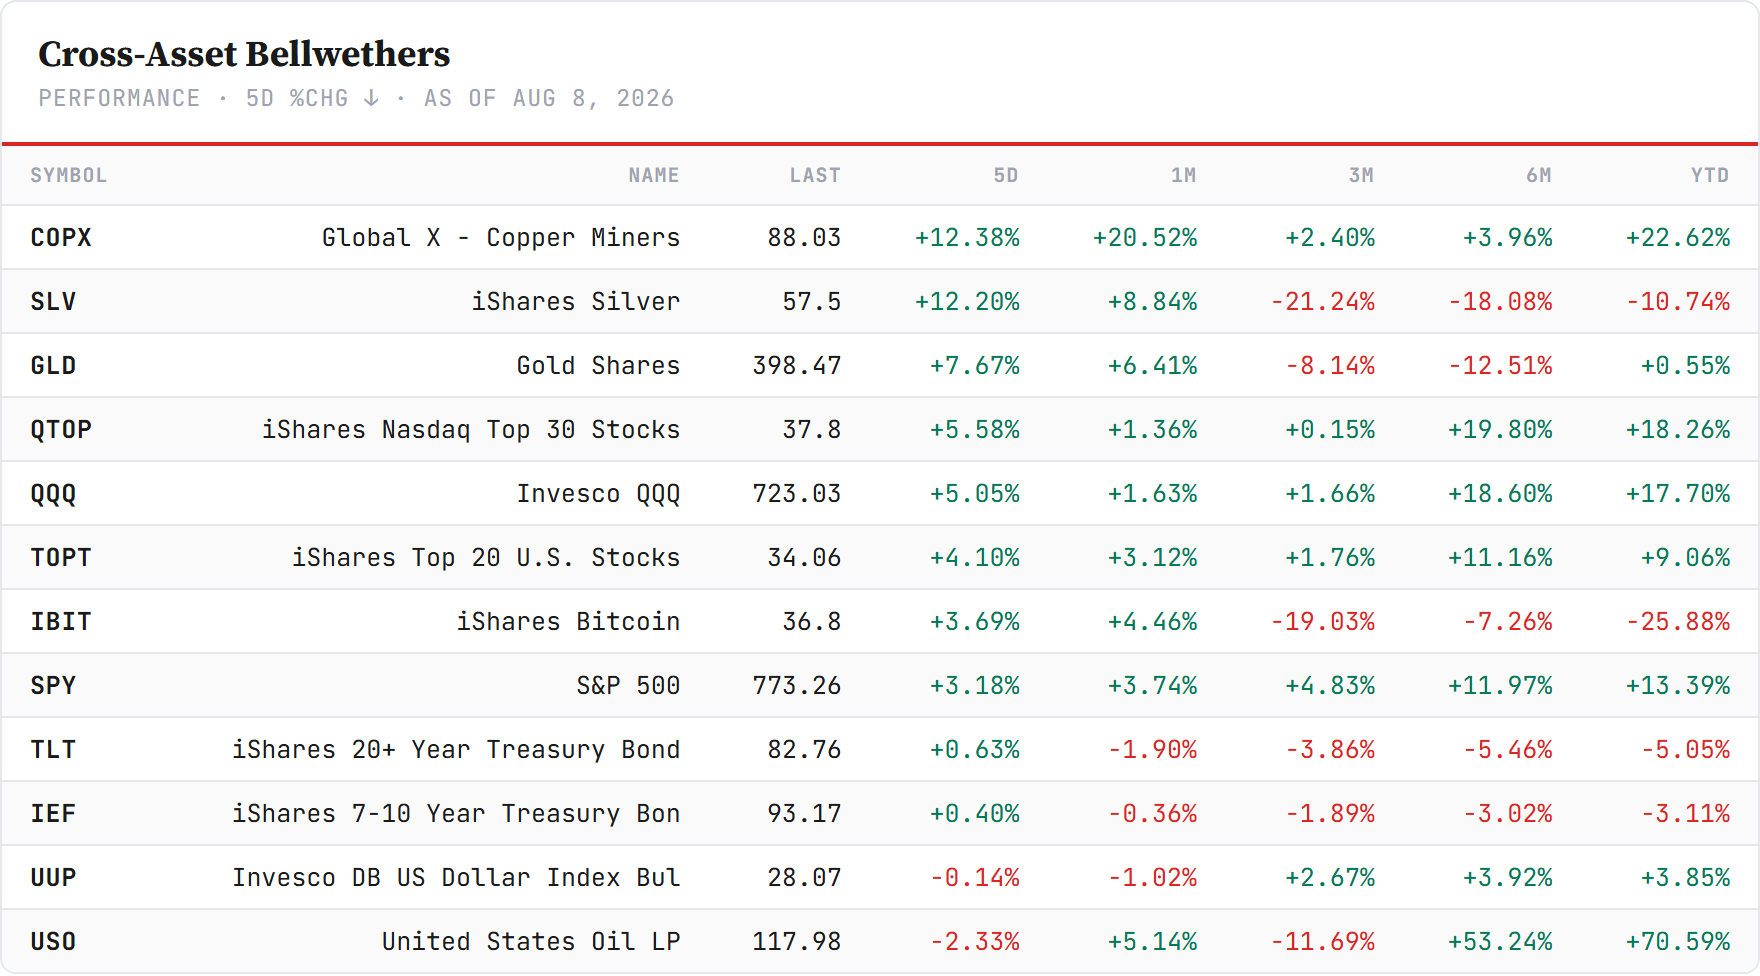
The cross-asset backdrop. Read the board top-down this week, because the top is the message: copper miners +11.6%, silver +9.8%, gold +7.3% — the metals complex led every equity index on the board, and it did so in a week when the dollar fell only a third of a percent and long bonds barely moved (TLT +0.6%, IEF +0.2%). That combination — metals up hard, bonds steady, dollar flat — is not an inflation scare and it is not a flight to safety. It is the market pricing an easier path for money, with leverage.
Below the metals, the equity stack in order: the Nasdaq’s top tier +5.5%, the Nasdaq 100 +5.1%, the S&P +3.5%, bitcoin +3.3%. And at the bottom, alone with the dollar: oil, −8.7% on the week — the year’s +87% organizing fact meeting the possibility that its war premium is finally expiring. One board, one sentence: everything was bought except the barrel.
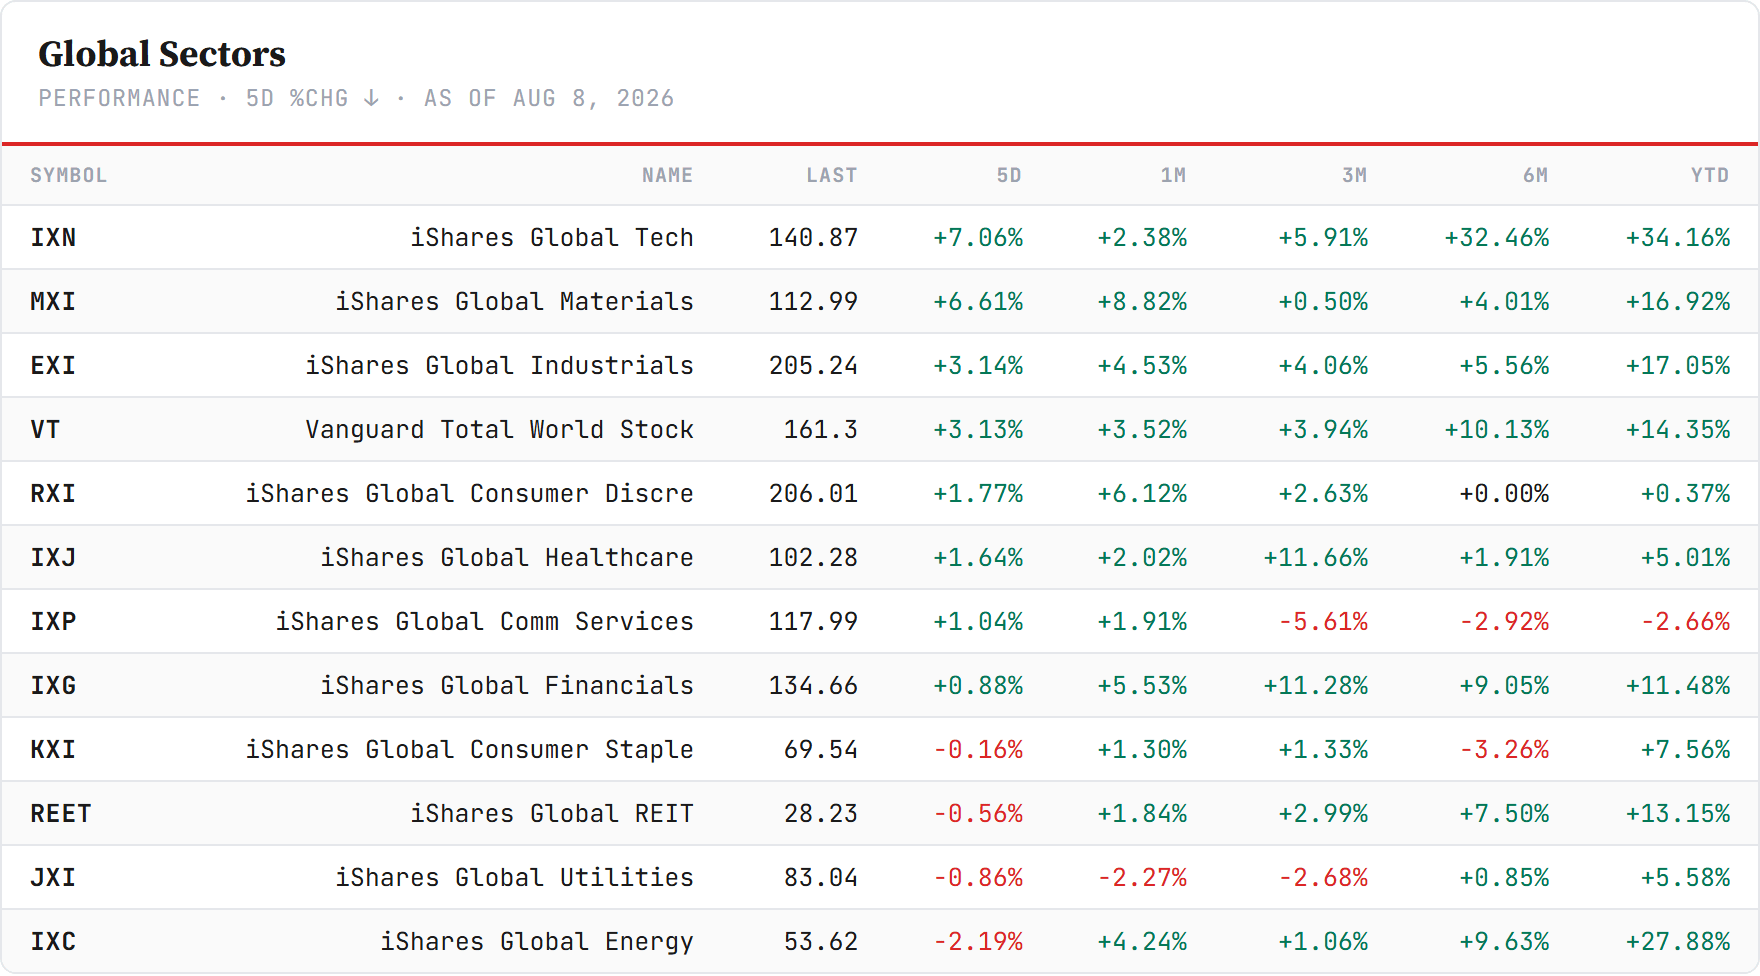
The global sectors. Nine of twelve rows green, and the two ends of the board tell one story between them. On top, global materials +6.9% — the metals bid wearing a sector costume, with the gold miners’ +21% week buried inside it — followed by global tech +6.2%, the AI complex’s broad reflation.
At the bottom, a coherent red block: energy −3.8% following the barrel down, utilities −0.8% and REITs −0.5% — the yield-proxy defensives serving as the funding source in a week when everything offensive was bid. Between them, a long green middle: industrials +3.5%, consumer discretionary +2.9%, telecom +2.6%, healthcare +2.0%. When the only losers on a twelve-row board are the barrel’s sector and the two bond-proxies, the board is telling you which way the discount-rate wind blew.
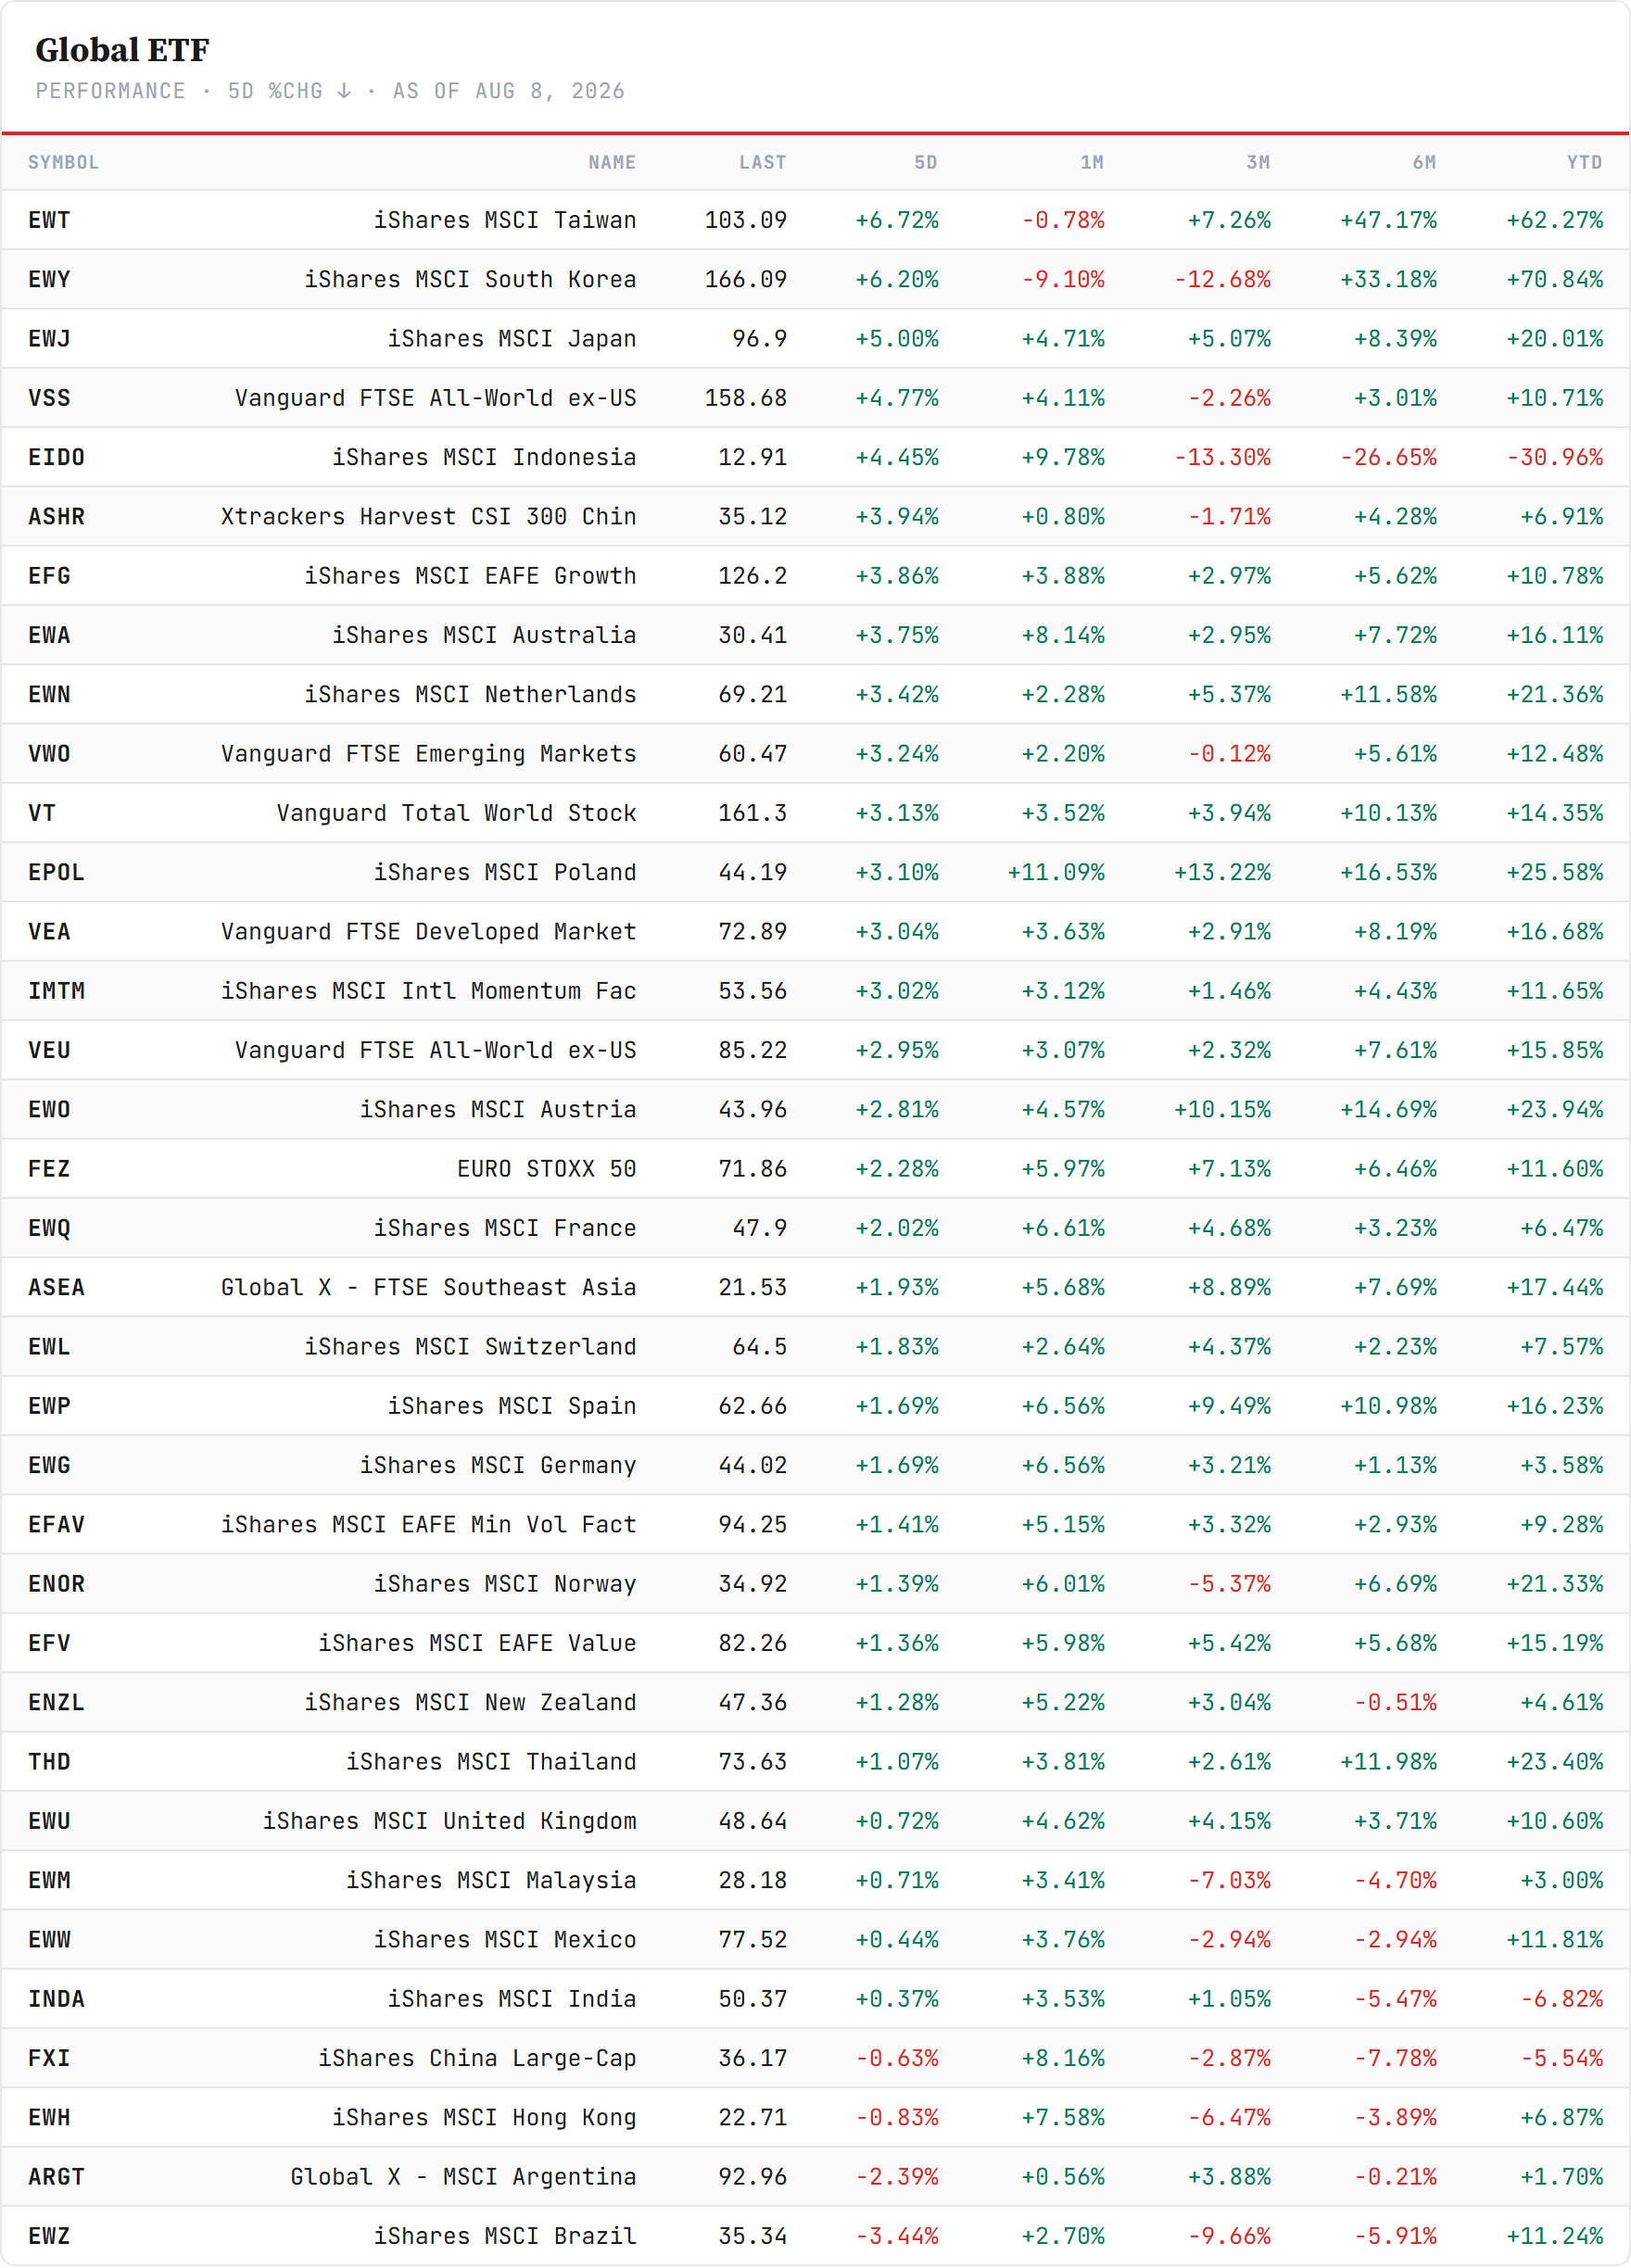
The regions. Twenty-six of twenty-nine regional funds closed the week green — the broadest weekly participation this board has printed since the spring. The leaders are the AI supply chain, re-bought: Taiwan +6.8%, Korea +5.7%, world small-caps +5.4%, Japan +4.9%, Indonesia +4.4% — and growth beat value across the developed world (EAFE growth +3.9% against EAFE value +1.7%). The red column is short and specific: Brazil −3.6%, Argentina −2.3%, Hong Kong −1.6%.
One caveat this letter will now carry permanently under this board: these are US-listed funds priced in dollars at the New York close, and for Asian markets that clock can differ sharply from the local one in a violent week — see the Korea paragraph below, where the local index and the dollar wrapper disagree by ten percentage points about the same five days.
Korea and China, the two markets arguing with themselves. Read in local terms, the week’s worst headline index on earth was the KOSPI, −5.1% — digestion after the limit-up reopening, concentrated in the very large-cap memory names that led the year. But underneath it, Korea’s broader board went the other way: the KOSDAQ gained 11.0% — small and mid caps sprinting while the flagship index fell.
China printed the same split along a different axis: onshore A-share tech +5.5% (with the broad A-share market +3.8%) against Hong Kong-listed China in the red — the Hang Seng −0.8%, the large-cap H-shares and the internet platforms flat to down.
Two countries, one pattern, and it is the week’s global signature: the domestic, broader, less-crowded board was bought; the internationally owned flagship names were sold. Keep that signature — it reappears at every scale on this letter’s map, and the US letter will show you the same anatomy inside the semiconductor complex tomorrow.
The Global Compass
The same four relative-strength questions, answered the same way, every Saturday.
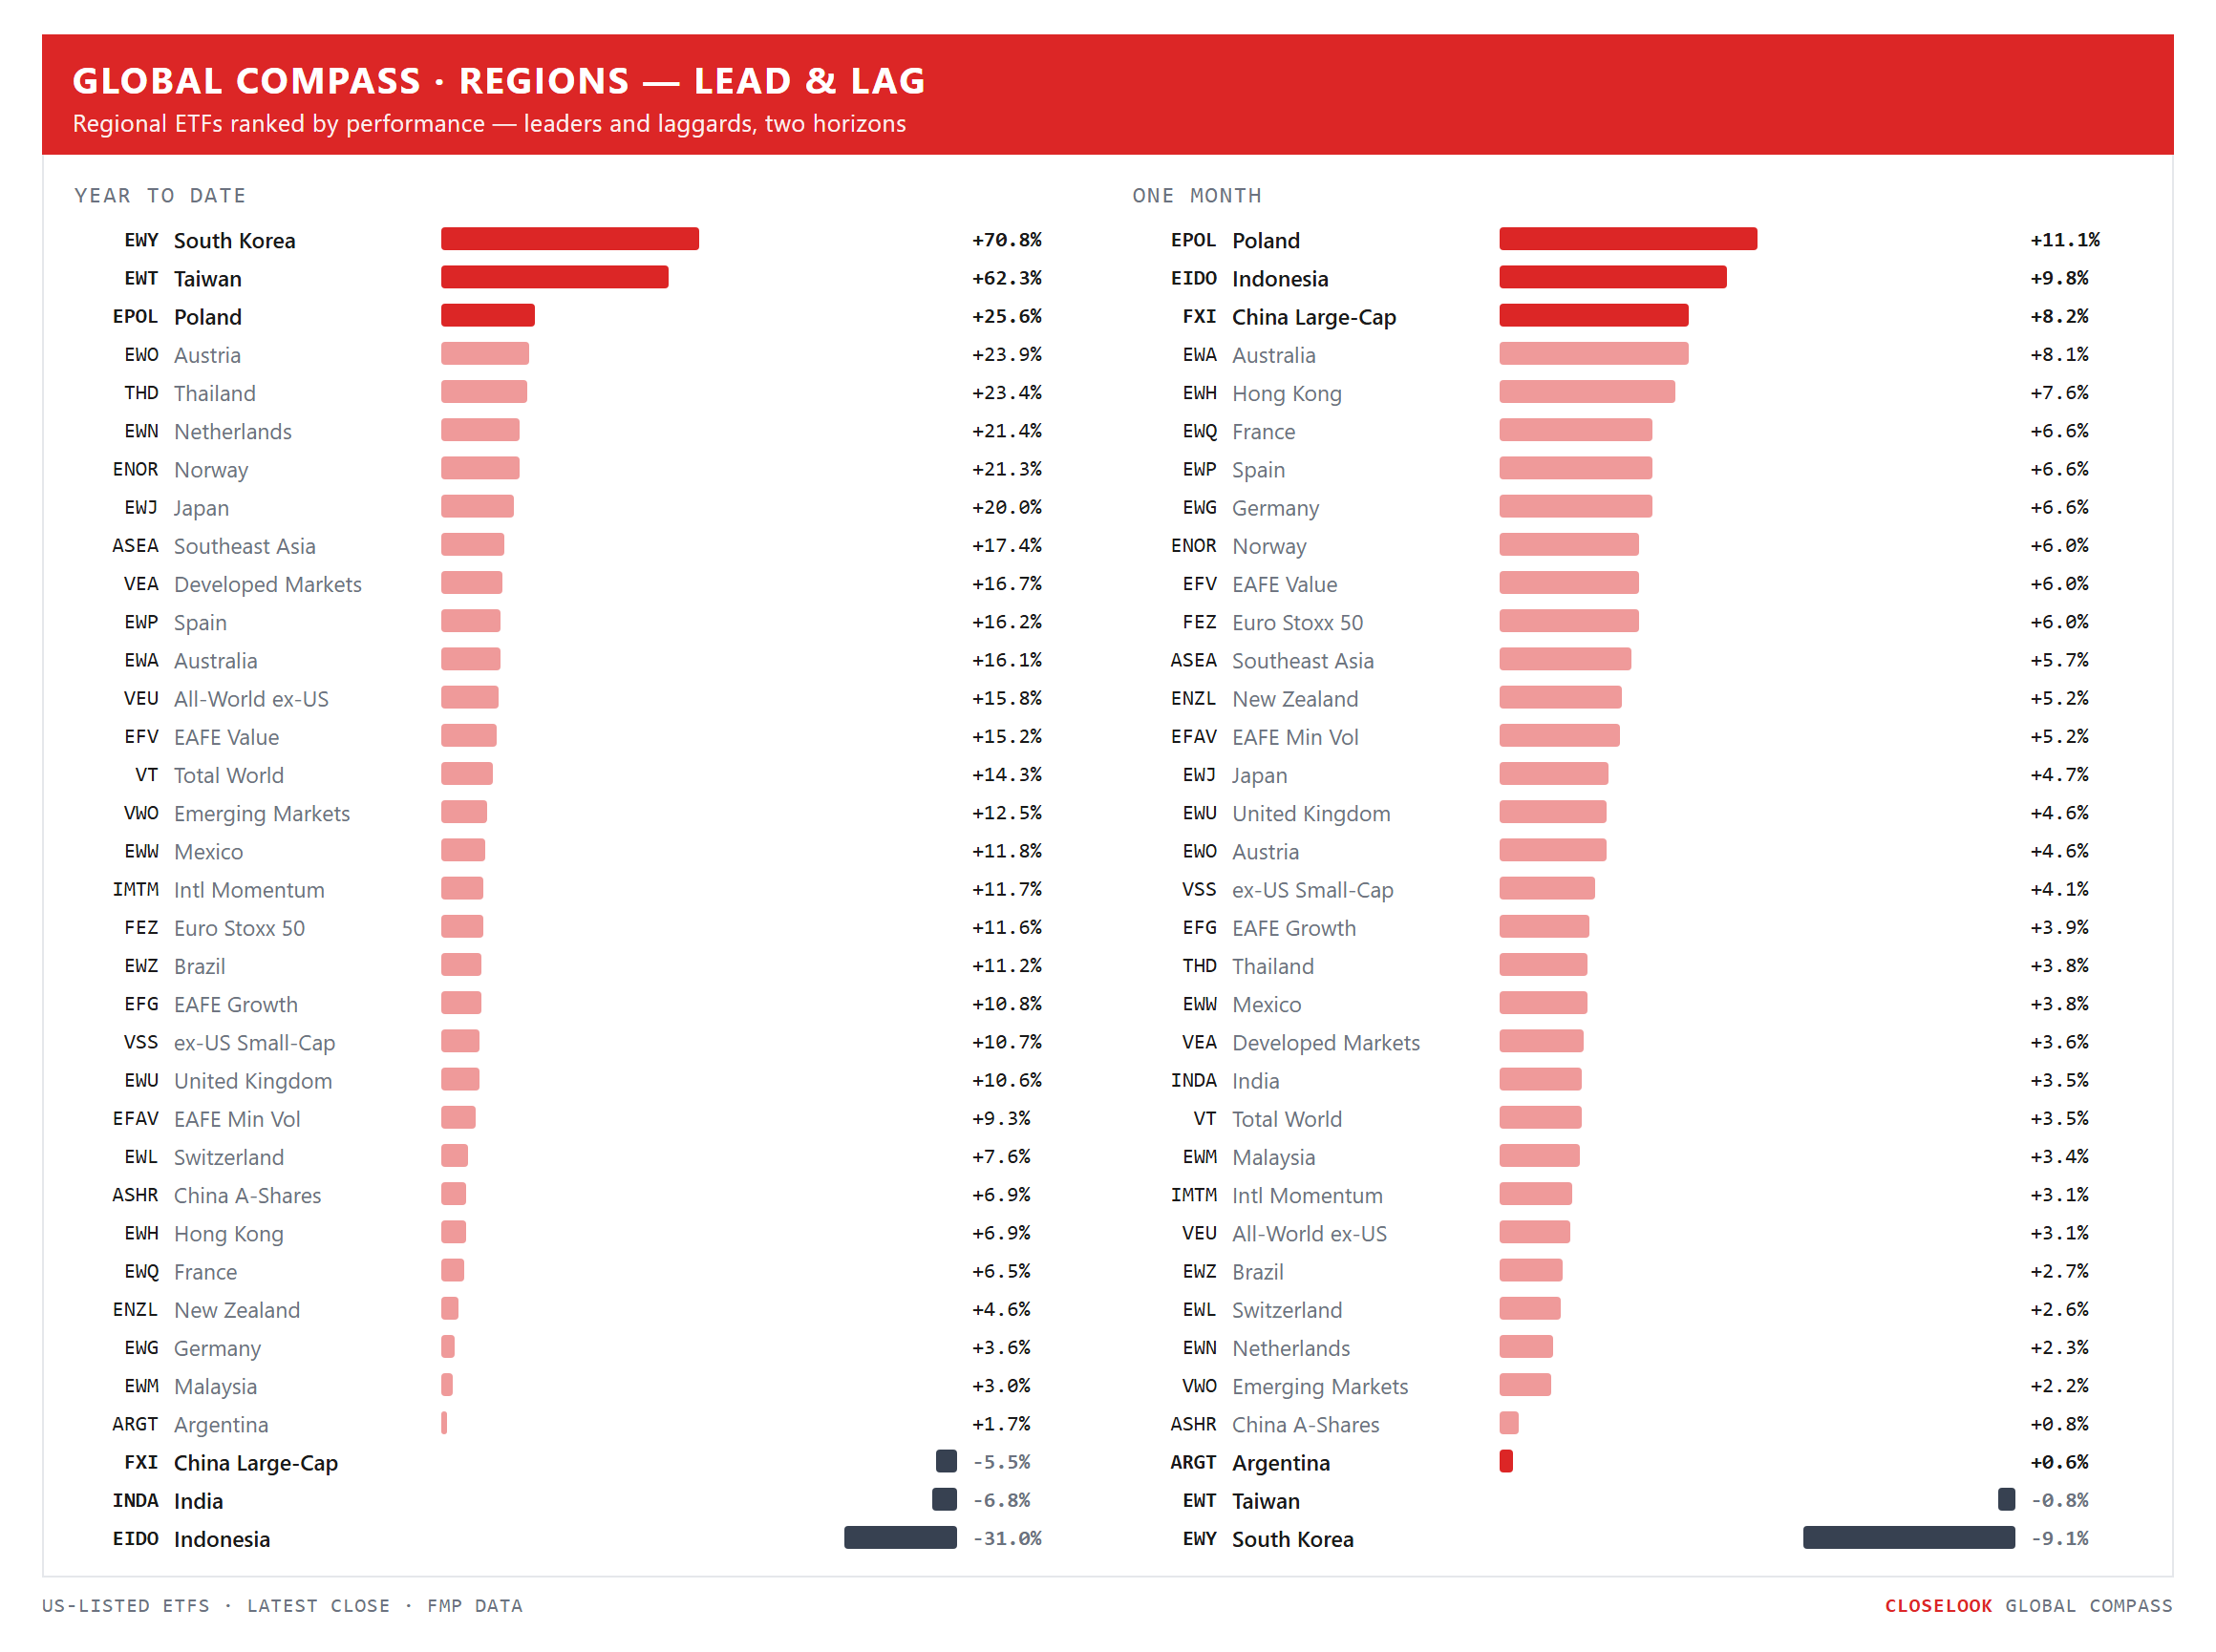
Regions: the year’s leaders rejoined the month’s. For three weeks this board showed an inversion — the year belonging to the supply chain (Korea, Taiwan), the month to everyone else. This week the inversion began to close from both ends: Taiwan and Korea’s dollar wrappers led the week again while the periphery — Poland, Indonesia, the small-cap world — kept its month-scale gains. A market where last month’s laggards and this year’s leaders rise together is what “broad” actually looks like on a ranking board.
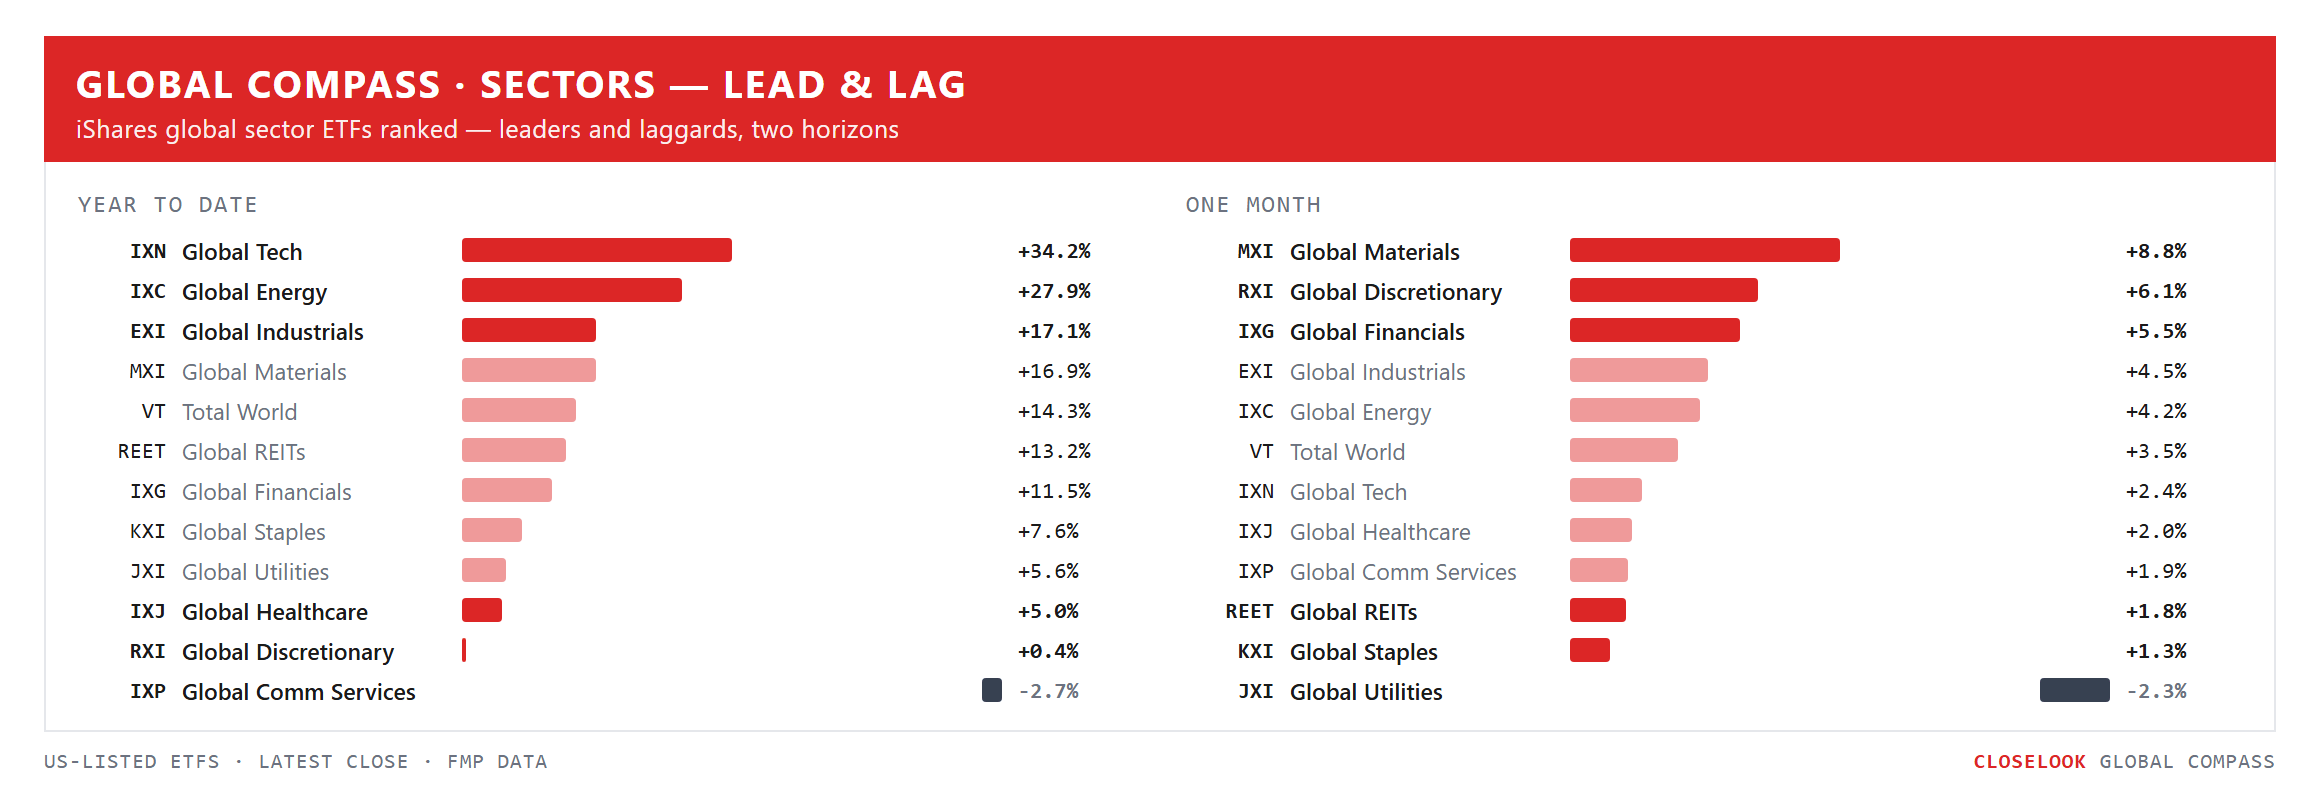
Sectors: energy lost the year’s crown in one week. Energy entered the week owning both clocks — first on the year, first on the month. Five sessions later it owns neither: global tech has retaken the year’s lead (+34% YTD against energy’s +28%), and materials seized the month outright (+8.8%) with the metals bid inside it. A ten-point relative swing between the year’s two leading sectors in one week is the rotation ledger this board kept all July — out of tech, into energy — running in reverse, at speed. Tech is no longer even red on the month.
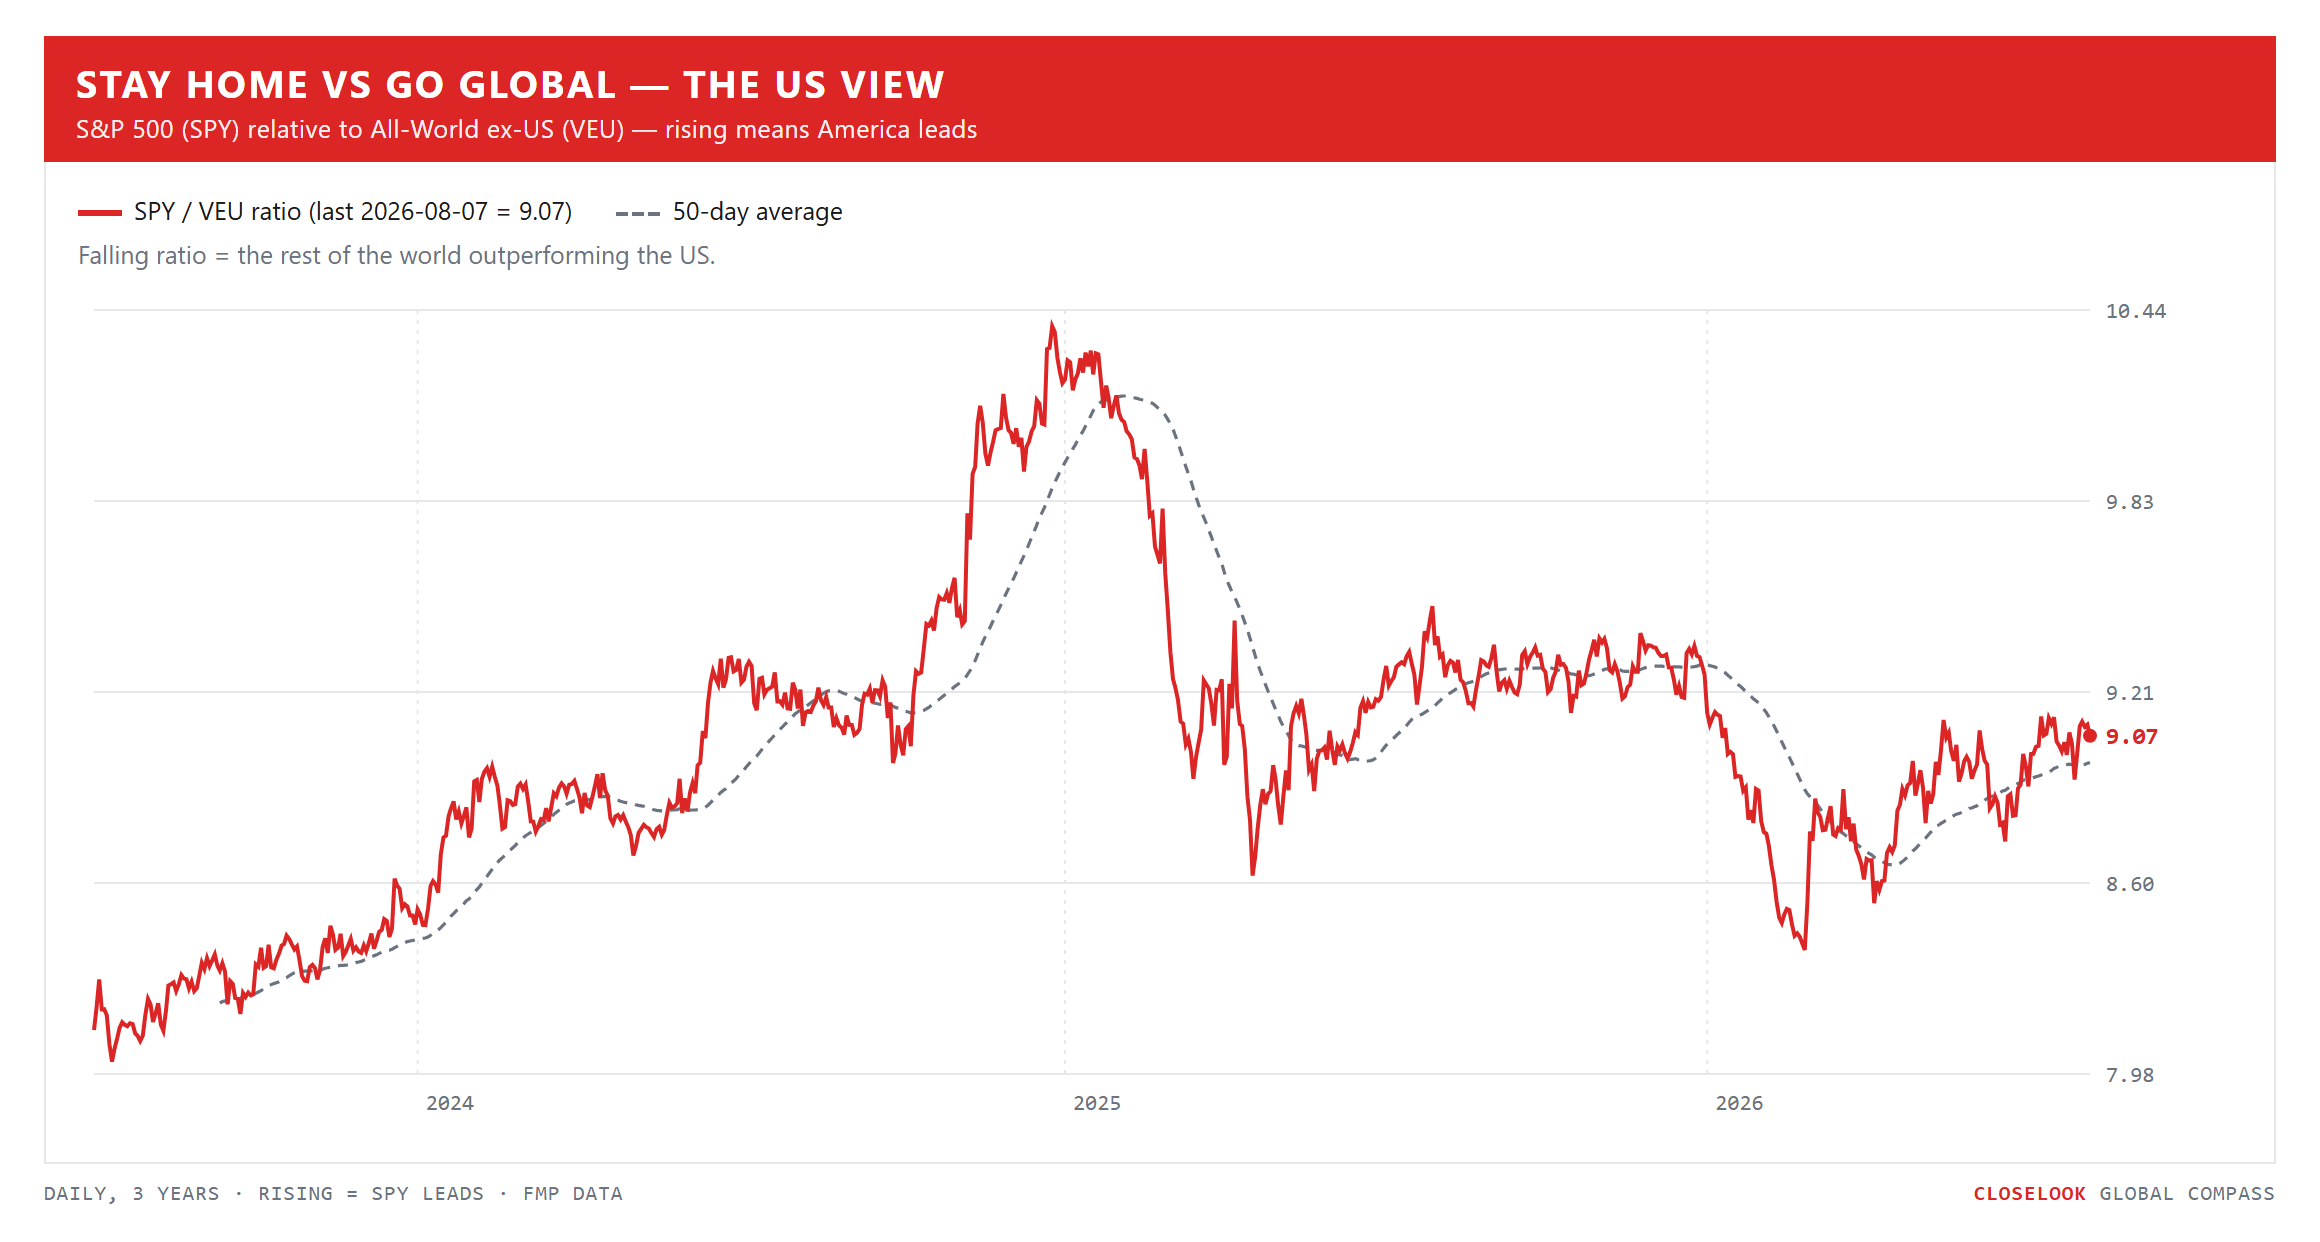
Stay home vs go global — the US view. After four consecutive weekly ticks against America, the ratio ticked back: the S&P’s +3.5% edged the ex-US benchmark’s +2.9%. One week does not end a streak’s meaning — the ex-US case this year was never “America falls behind every week,” it was “the gap stops widening.” Both sides of that statement held: the US led the week, and the world index still closed at a record with the ratio far below its old shelf.
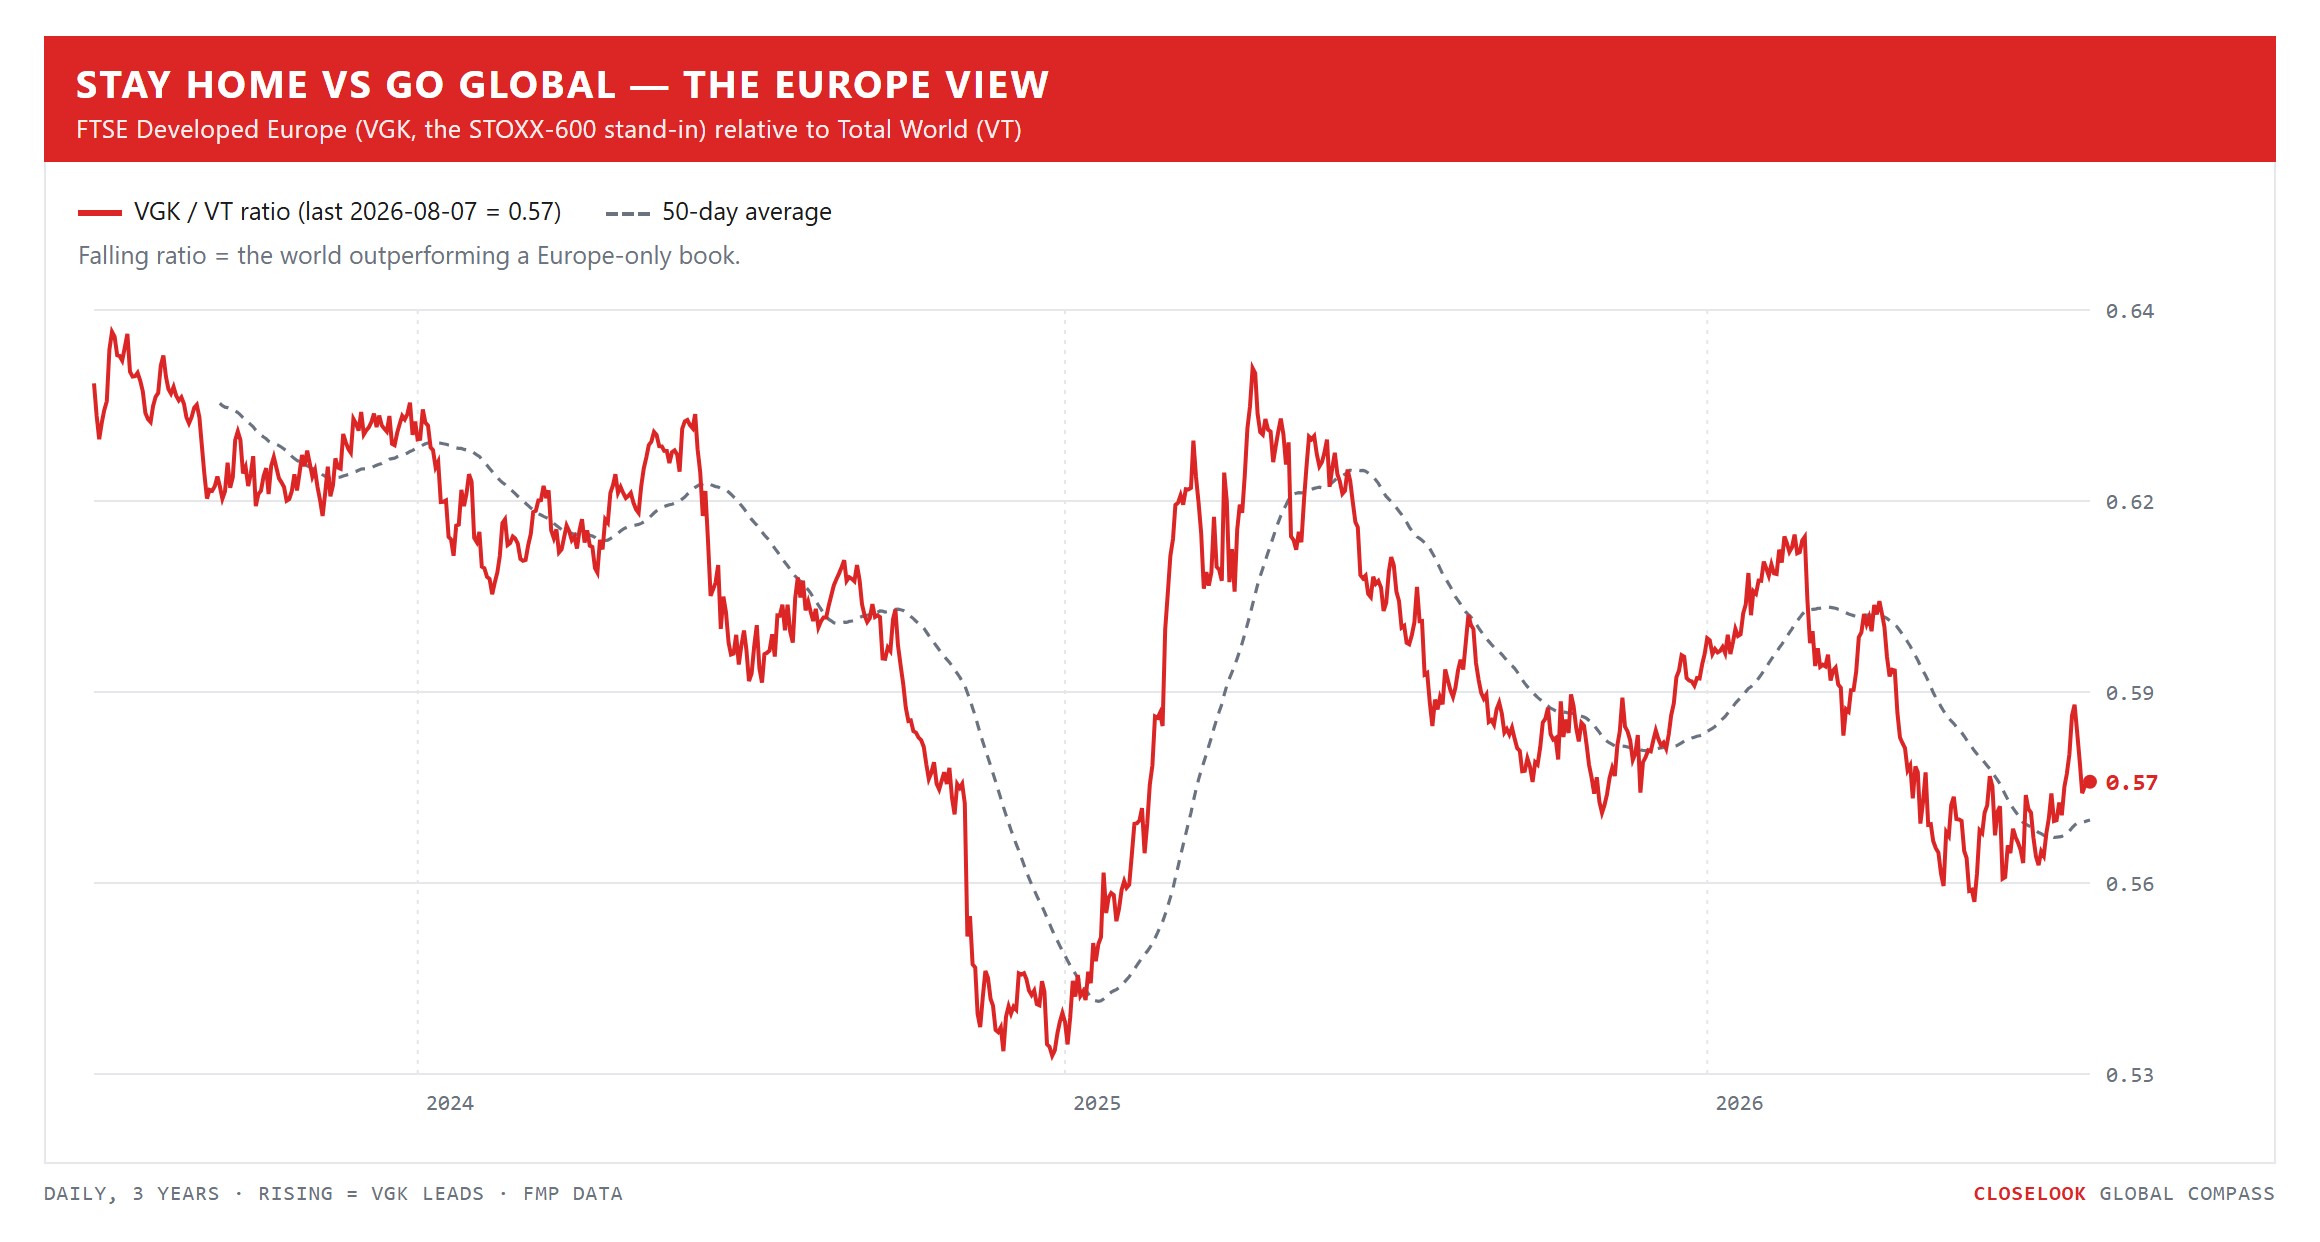
Stay home vs go global — the Europe view. Unchanged verdict: the three-year downtrend in Europe-relative-to-world is intact, and a solid European week (France +2.9%, Germany +2.7%, the euro-zone large caps +3.0%) still lagged the world index by half a point. Europe participates; it does not lead. This letter keeps owning it through the world index rather than instead of it.
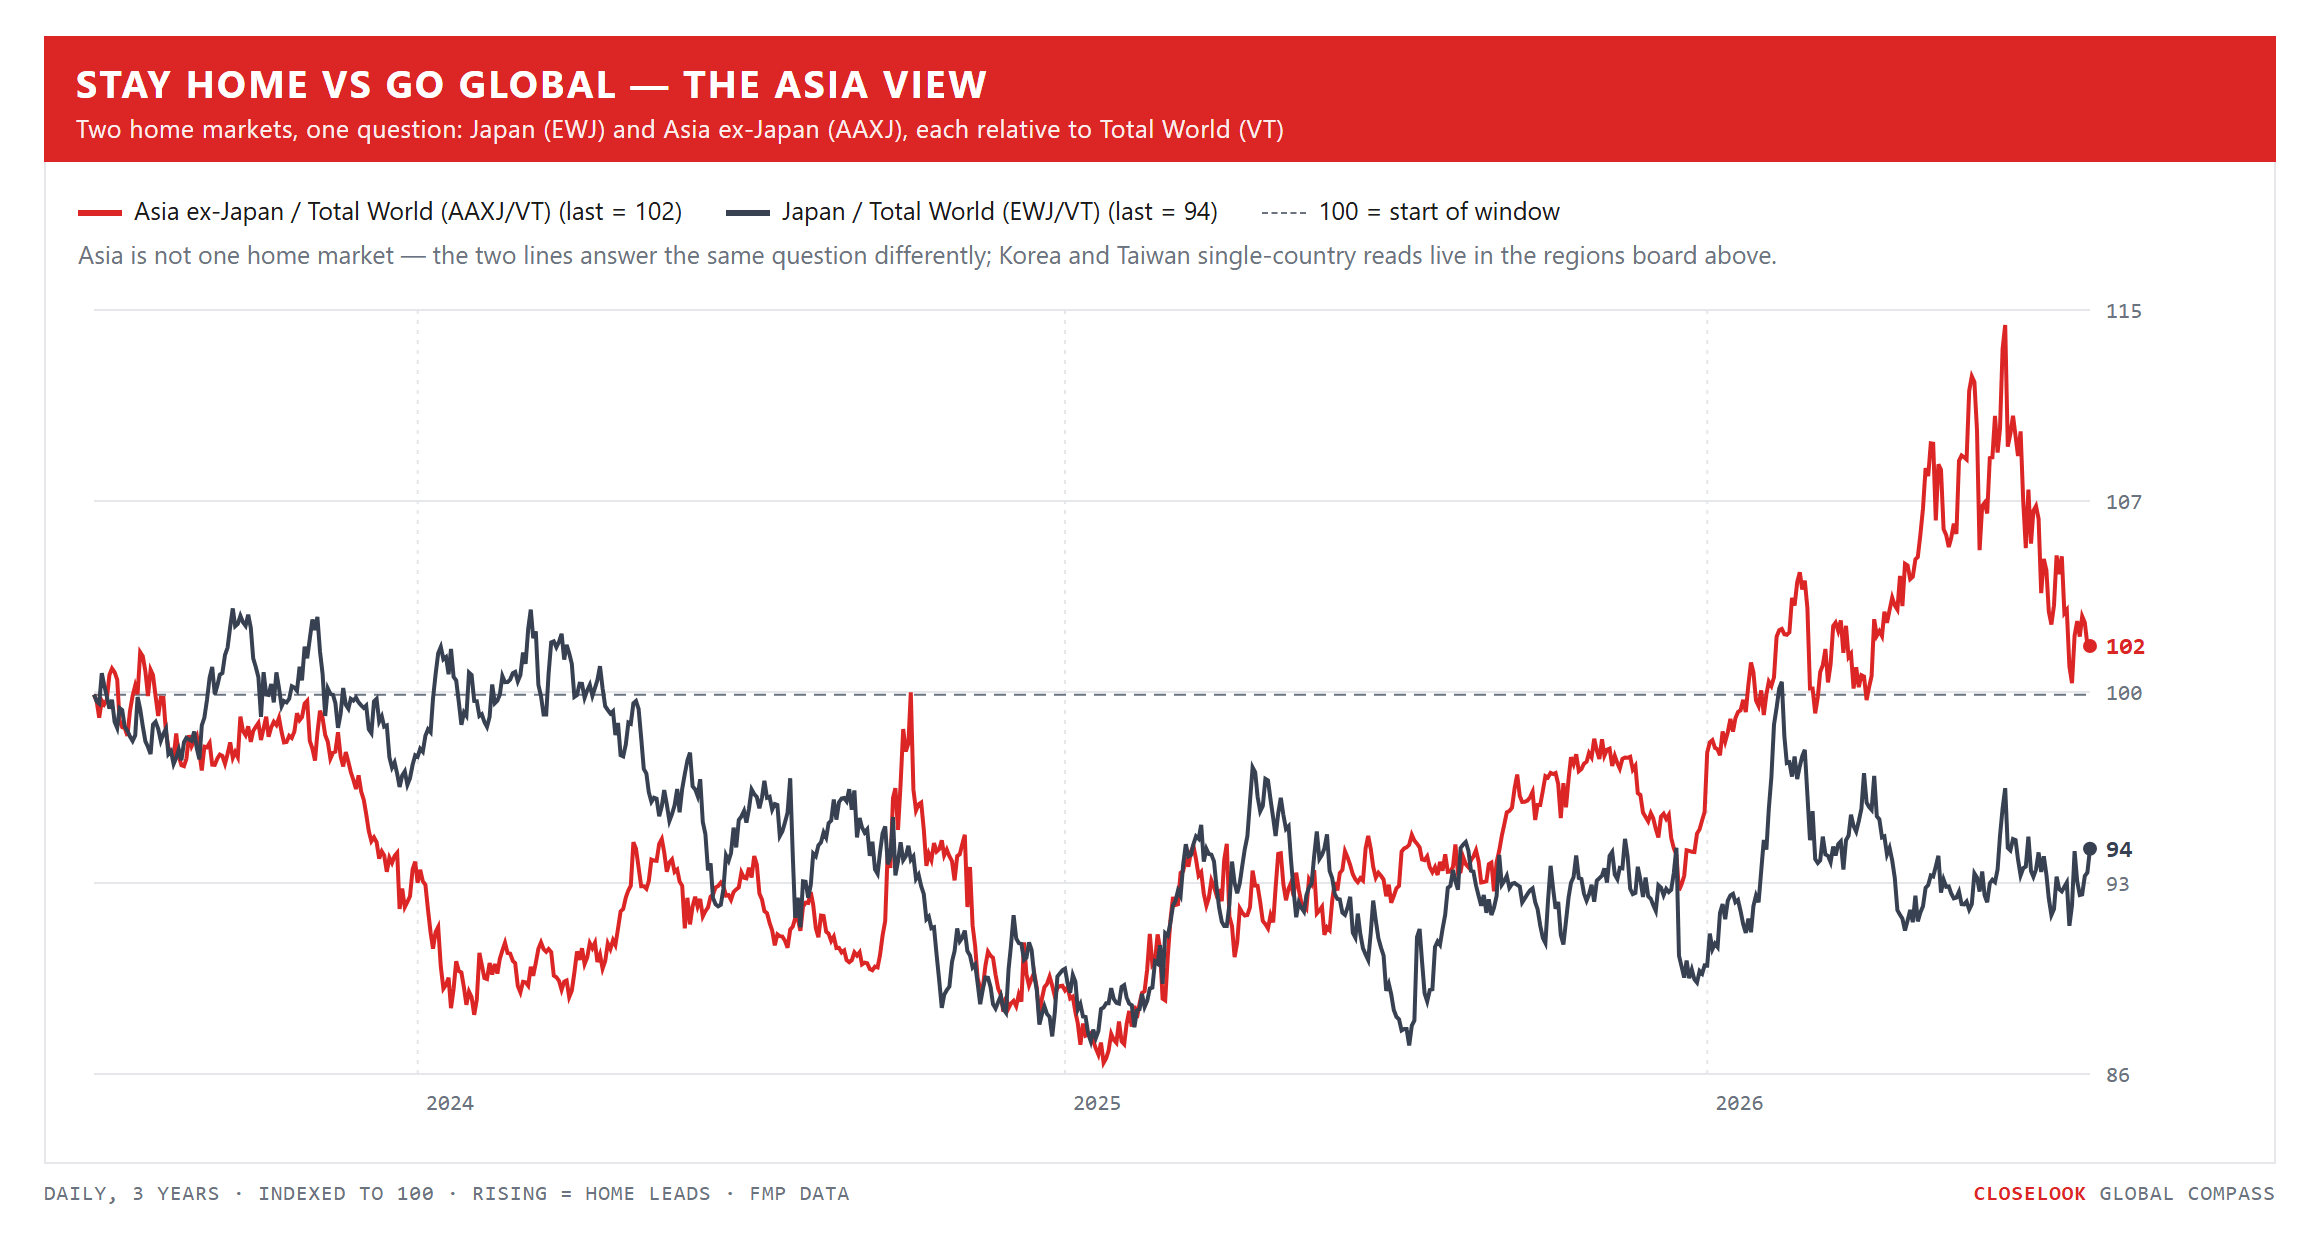
Stay home vs go global — the Asia view. The red line — Asia ex-Japan relative to world — put in its first up-week since the July give-back began: the supply-chain re-rating leg is attempting to resume after its round trip from 100 to 114 to 103. Japan’s dark line did what it has done for three years: nothing at the ratio level, +4.9% in absolute terms. The Asia view’s whole purpose this month is one question: was July the end of the regional re-rating, or its first rest? This week voted rest. It gets to keep voting.
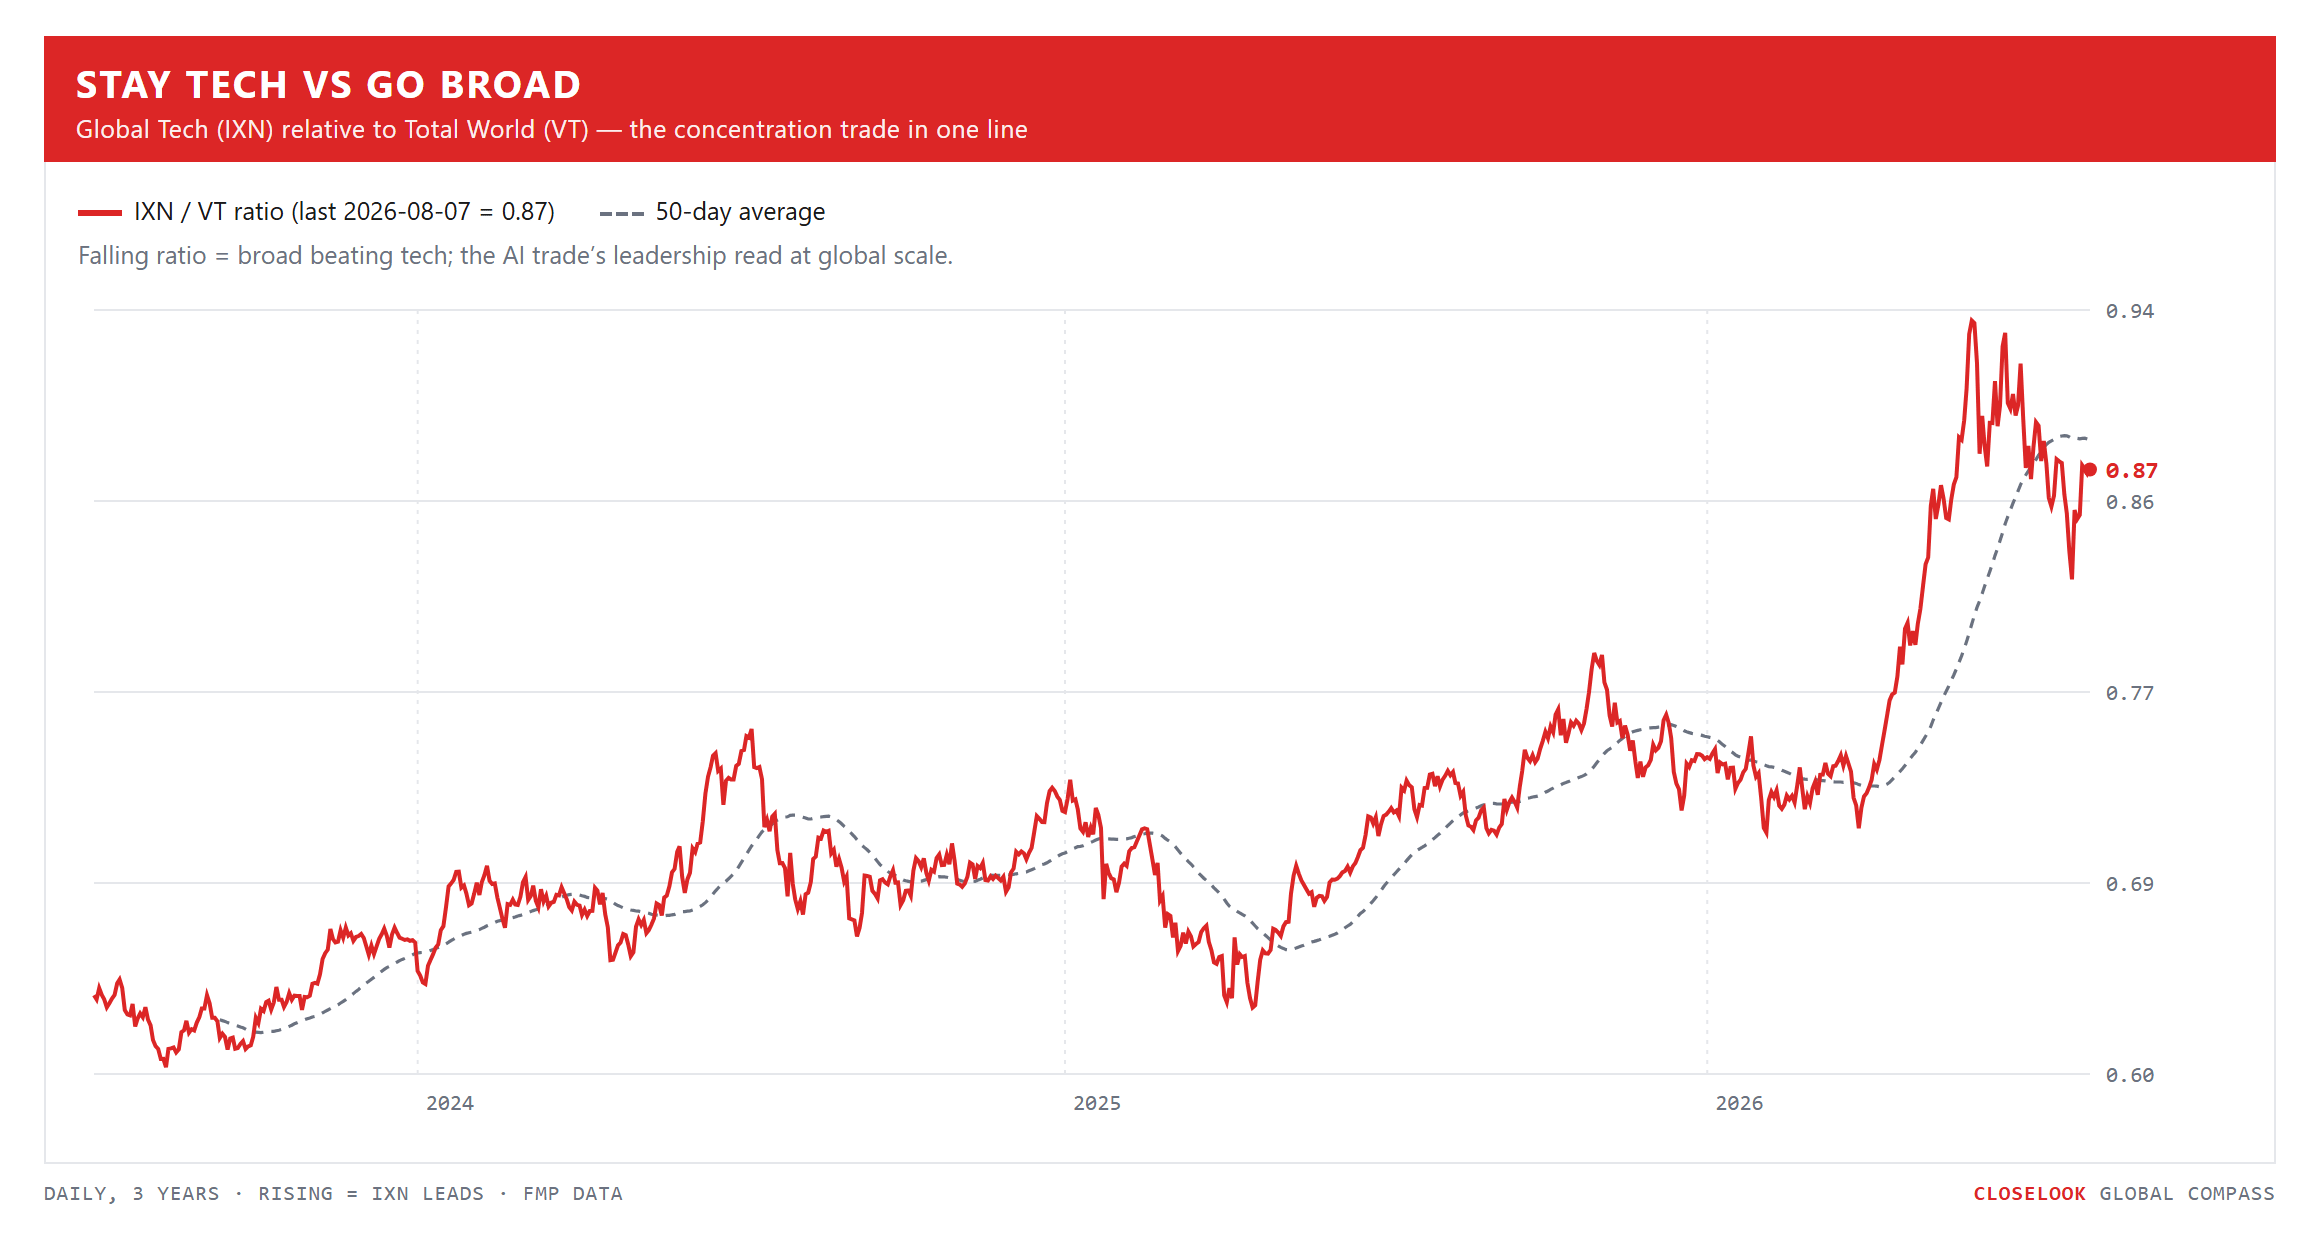
Stay tech vs go broad. Two weeks ago this ratio broke below its 50-day average, and we called it the equal-weight bulls’ broadening signal. This week global tech gained 6.2% against the world’s 3.5%, and the ratio snapped back toward the average — and here is the part that matters: the broadening survived anyway. Small caps, the periphery, the KOSDAQ, the equal-weight cuts all outran their flagship indices in the same week tech led the sectors. Tech leading is not the opposite of broadening when the average stock keeps pace. That combination — leadership and participation — is the rarest state on this board, and it is the state the week closed in.
2 · The State
The mechanism, named: the market fired the rate rise. Friday morning the US reported payrolls of minus 23,000 against a consensus near plus 80,000 — the first negative print of this cycle, below even the most pessimistic house estimate on the street. The composition made it worse than the headline: government payrolls fell 53,000 while private hiring, at plus 30,000, ran at less than half its expected pace; the unemployment rate held at 4.1% only because participation slipped; wage growth, at +0.1% on the month and +3.2% on the year, threatened nothing.
Within the hour, the intermediate Treasury fund reclaimed the two-year trendline it had been breaking all week — the line this publication’s daily editions have tracked for five sessions as “the bond veto” on the equity charts. The close settled it: the veto died. (The level-by-level scoring of that death belongs to tomorrow’s US letter; the map consequence belongs here.)
A labor market this soft, with wages this quiet, takes the central-bank rate rise that hung over the summer off the table for the year — if the inflation prints cooperate. That conditional is the whole architecture of next week: the market has already voted; the CPI gets to veto the veto’s death.
The metals complex is the receipt. How do you know the market truly traded the no-hike conclusion, rather than just enjoying a soft-landing Friday? You look at what led. Copper miners +11.6%, silver +9.8%, gold +7.3%, the gold miners +21.3% — the leveraged, rate-sensitive, hard-asset end of the board outran every stock index on earth, while the dollar barely moved and bonds barely moved.
Gold in particular kept doing what we documented on Wednesday: trading as a risk asset, correlated with the Nasdaq, bought with leverage — its 90-day correlation with the tech index sits above +0.5 when a true haven would sit near zero or below (the full mechanics are this week’s Knowledge Corner). And copper — the metal the AI buildout physically consumes, the one sitting under this letter’s constraint-sector thesis — led the entire complex.
The money is not hiding from something. It is front-running the price of money going down, and buying the things a cheaper-money, still-building world consumes.
Oil, the other half of the same sentence. The barrel lost 8.7% in five sessions — the sharpest weekly fall since the year’s rally began, on rising expectation that the Iran war may finally be ending in fact rather than in communiqués. Hold both halves of the energy picture honestly: oil remains up massively on the year, and one diplomatic week does not unwind a structural bid.
But the direction matters for everything else on the map — because the summer’s inflation anxiety was substantially an oil-price anxiety, and a falling barrel is disinflation the CPI has not printed yet. The market spent Friday connecting exactly those dots: soft labor, falling oil, quiet wages — and priced the hike away. Energy equities (−3.8% globally) paid for the privilege.
The earnings floor under all of it. None of this happened in a vacuum — it happened in the final week of the strongest US reporting season in years. With the June-quarter season now past its peak, blended S&P 500 earnings growth stands near 47% year over year against expectations of roughly 29% when the season began — driven by enormous upside surprises from the megacaps, with analysts raising forecasts into the season rather than trimming them, which is itself unusual.
And the house caveat travels with the number, every time it appears: strip the largest outliers — Alphabet and Amazon, whose results carry exceptional non-operating investment gains — and the growth rate compresses back toward the high twenties. Both numbers are true. The 47% tells you why the tape could absorb a negative payroll print and rally; the ex-megacap 29% tells you the aggregate is concentrated and the average company’s quarter, while strong, is not a moonshot.
The June-quarter comps are now mostly done; the second leg — the July-quarter enders, the enterprise-software cohort among them — begins next week, and it lands in tomorrow’s letters’ territory.
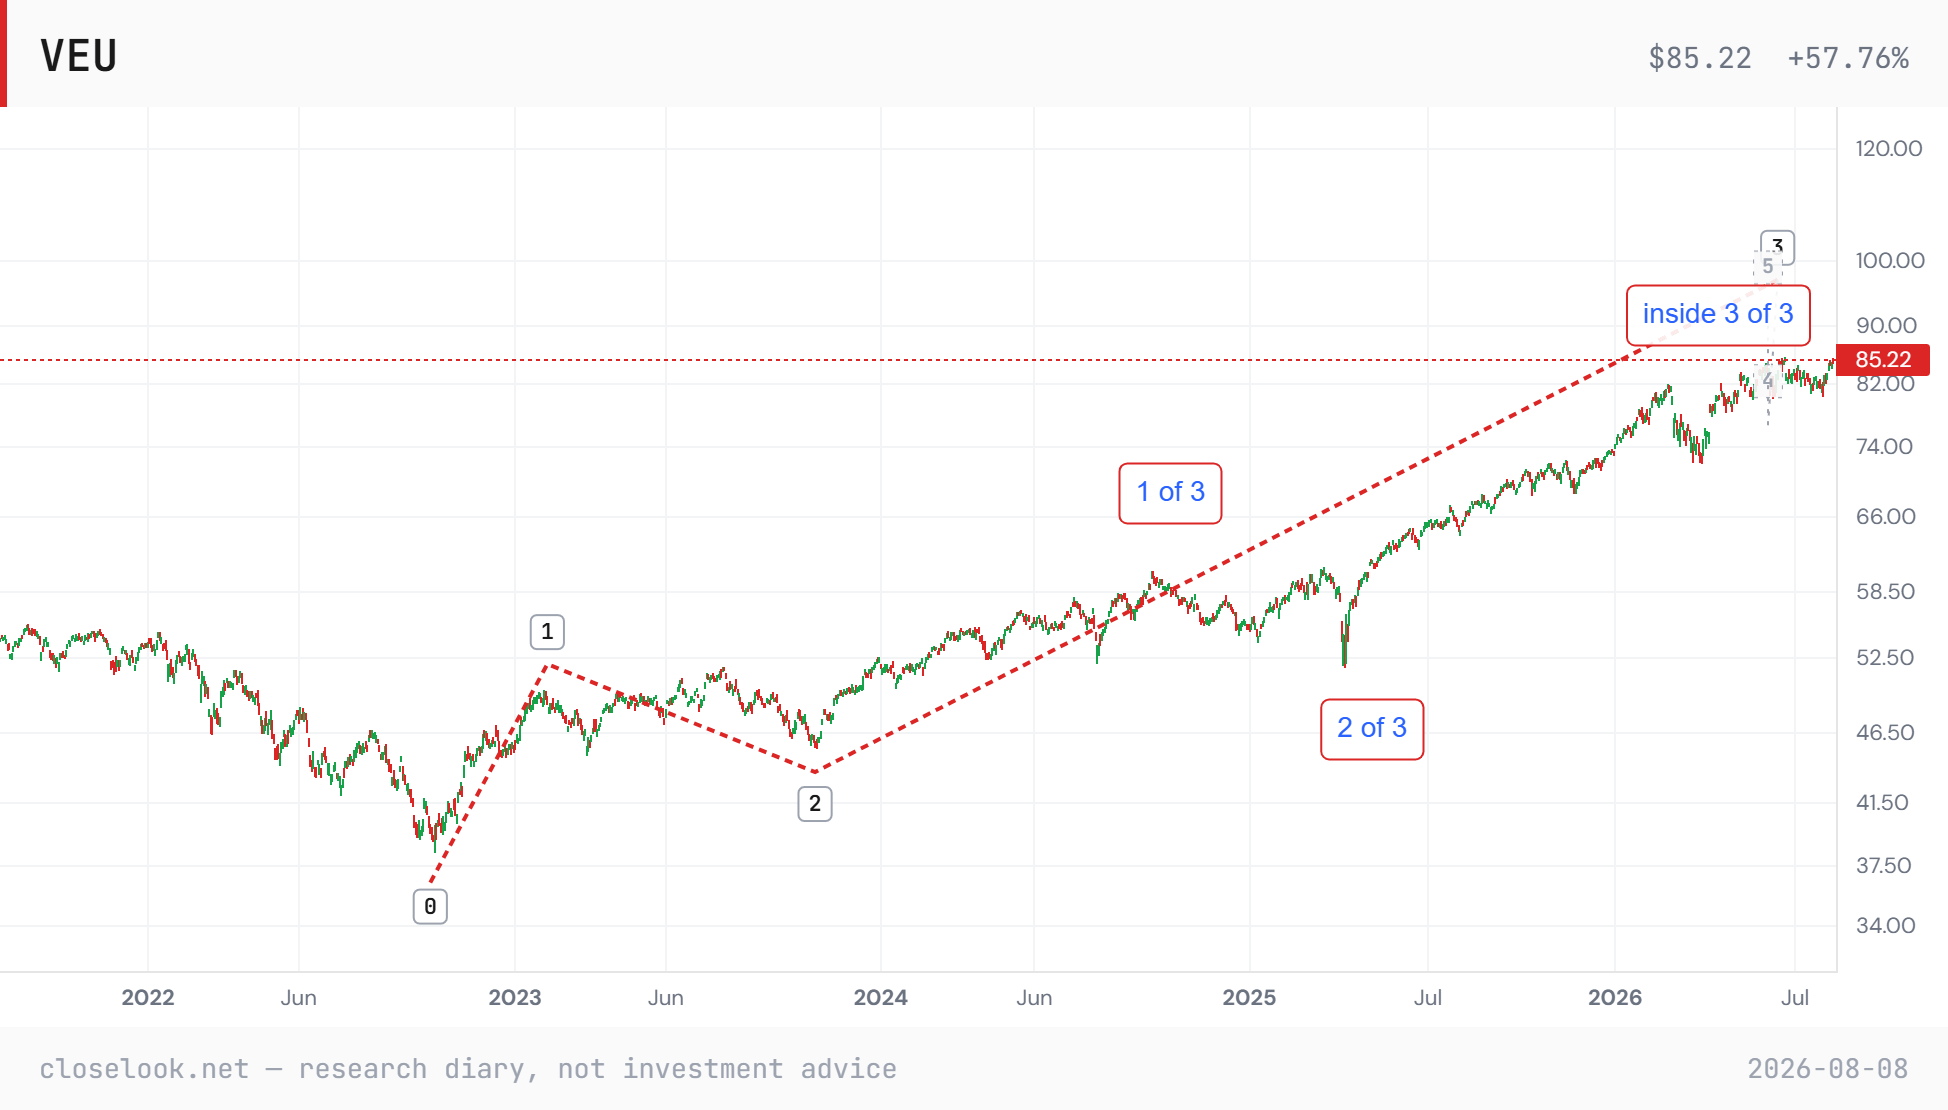
The structural read — the count, upgraded. Last Saturday this letter drew a decision line under the ex-US index: the rising channel line from the April 2025 low — hold it and wave 3 continues, break it and an extended rest begins. The week resolved the branch upward, emphatically. VEU closed Friday at 85.22 — one cent under its all-time closing high (85.23, set June 22), with only the June intraday mark at 85.74 above it.
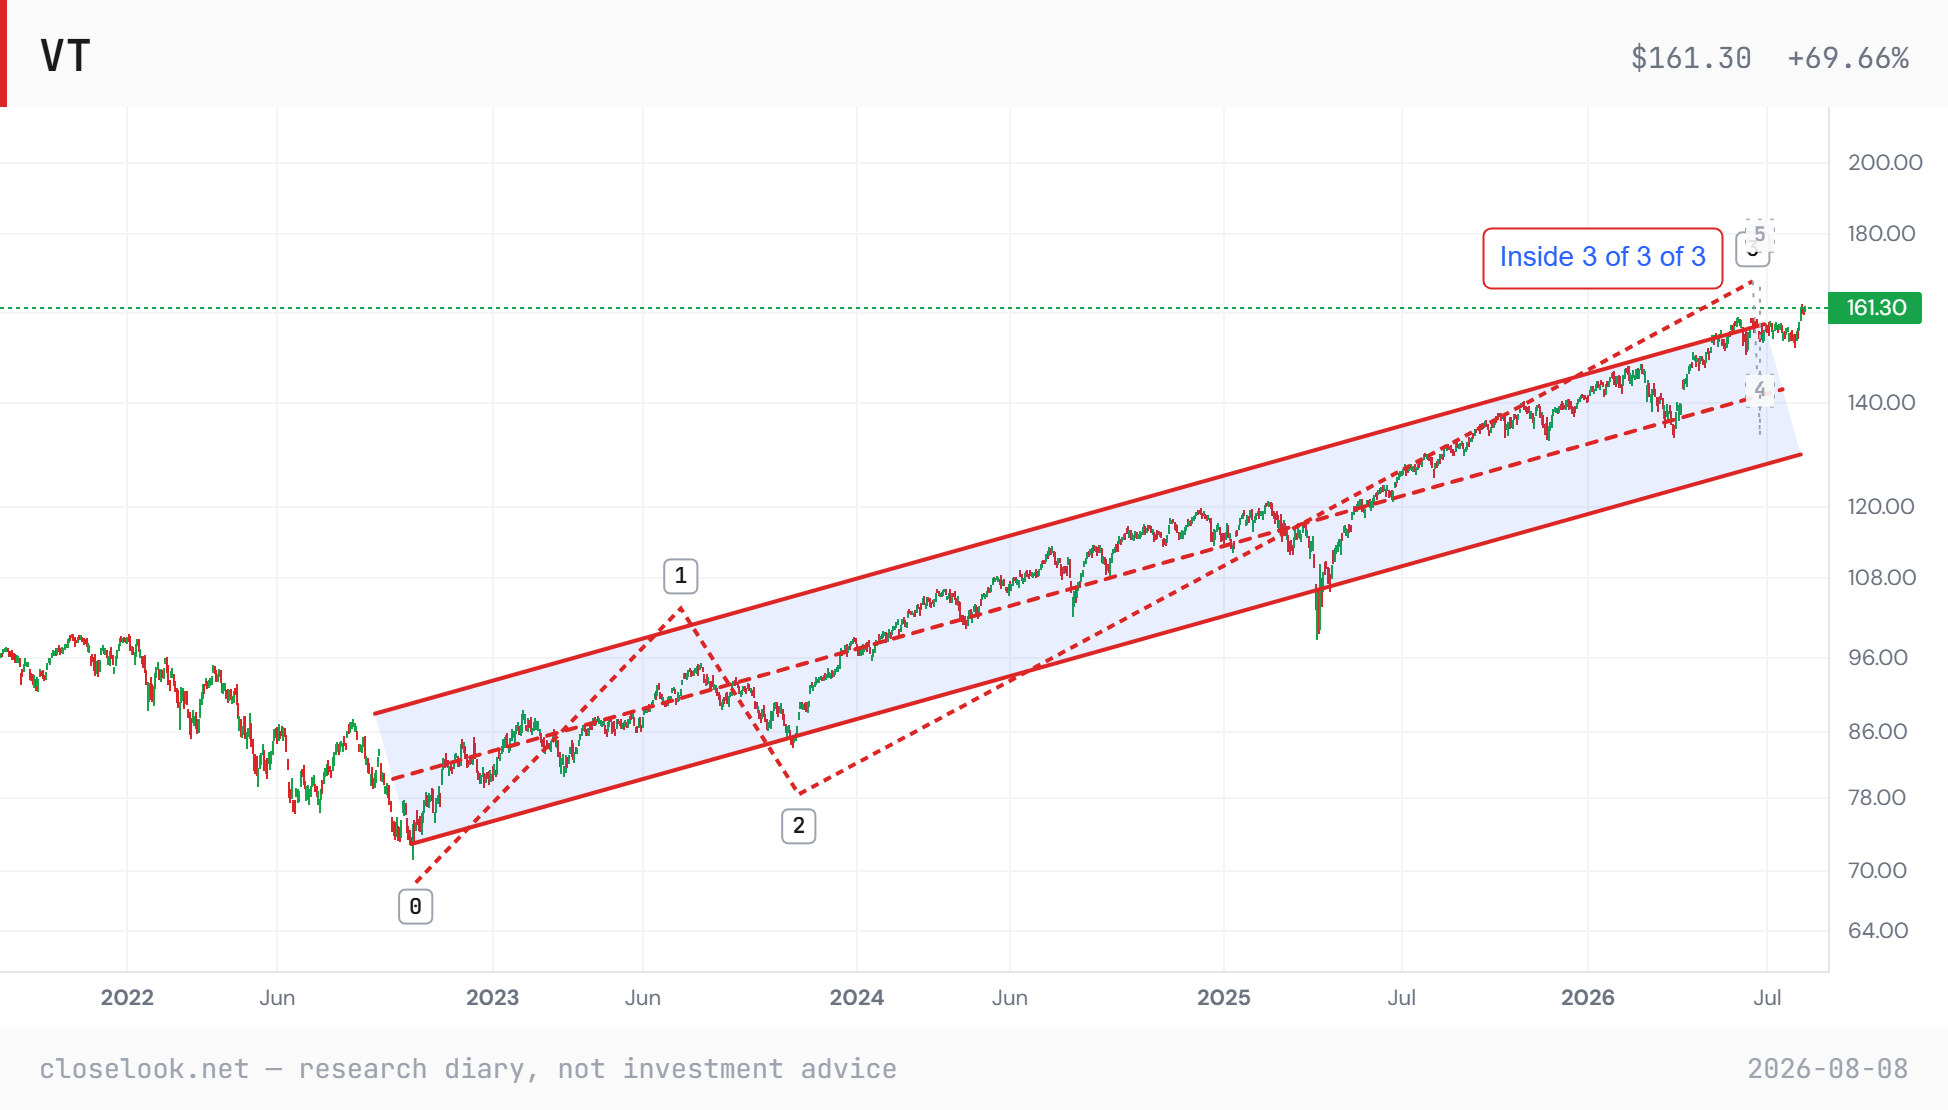
The working count from the October 2022 low now reads: waves 1 and 2 complete by late 2023, and the long third wave subdividing — its first leg carrying to the June top, its second the spring 2025 pullback, and the index now inside the third wave of that third wave, the segment of a trend that historically does the most work in the least time. The chart below carries the full map, with the fourth and fifth waves ghosted above.
And the confirmation did not wait for VEU: the total-world index closed the week at an all-time high, 161.30 — the aggregate this letter’s core thesis owns broke out first, with the ex-US half one cent from joining it. The breakout question is next week’s business; the count says the trend that would power it is already in its strongest segment.
3 · The Outlook
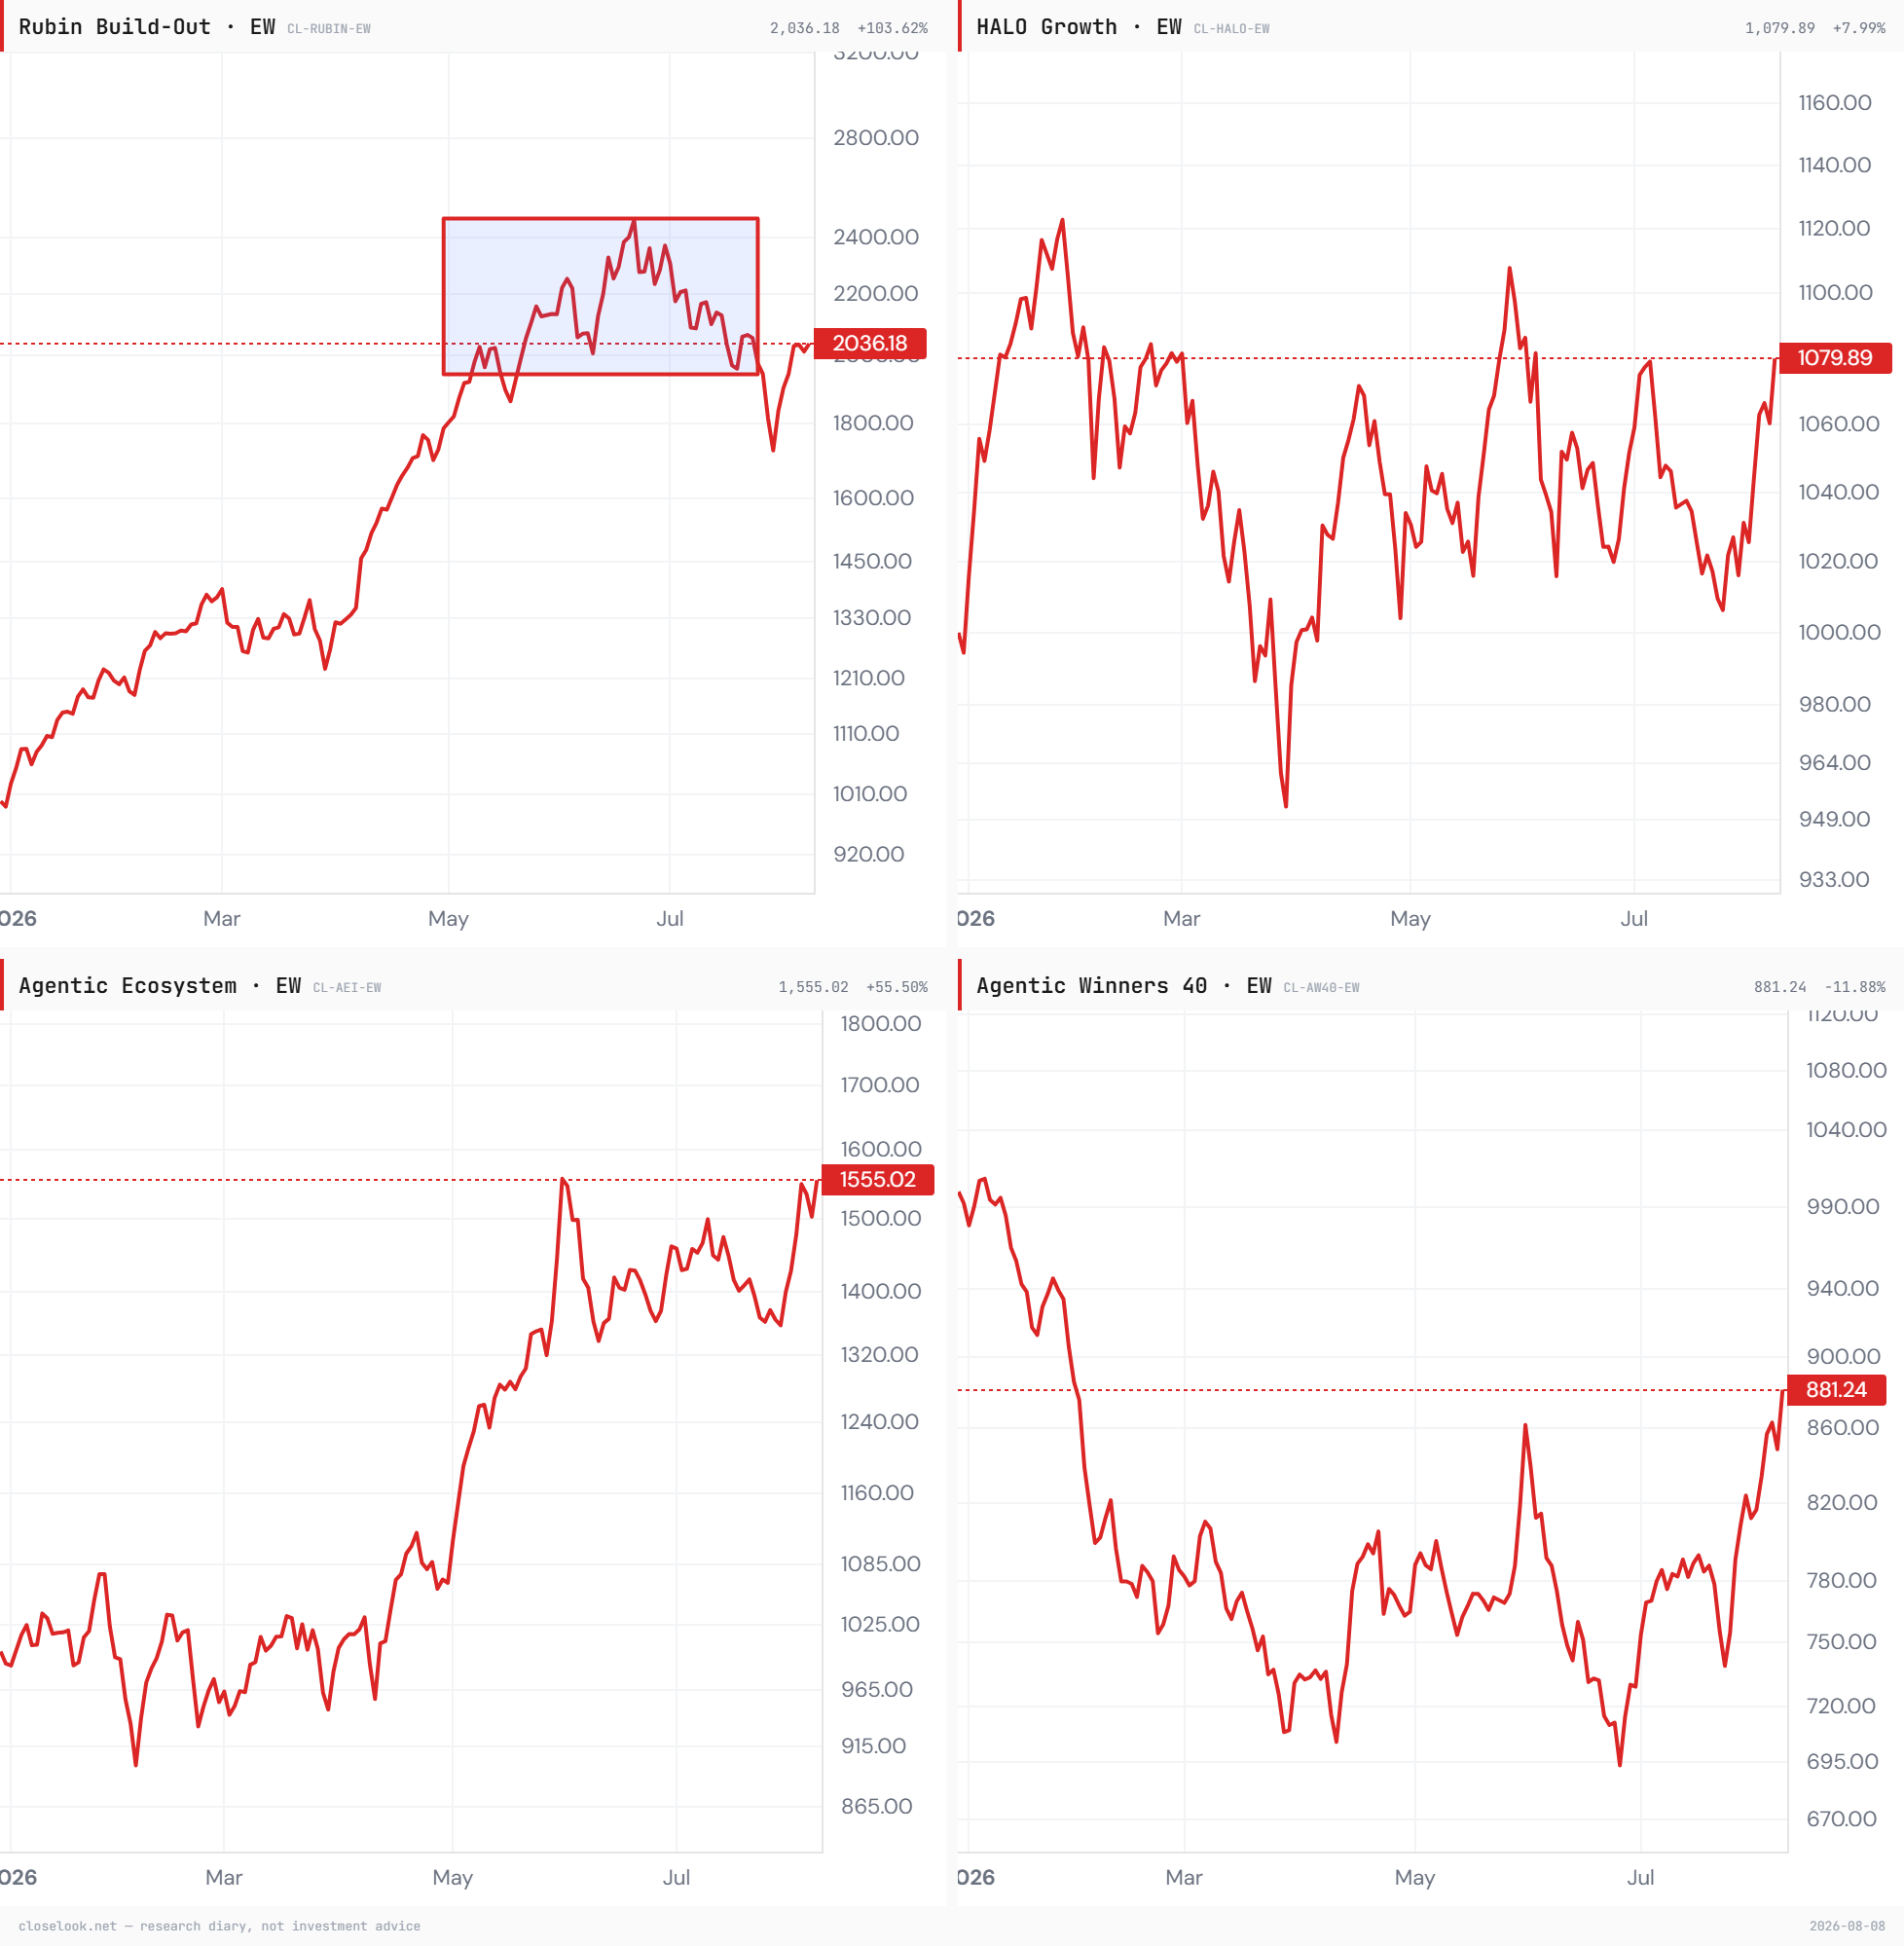
The four-index read — all layers paid, for the first time. Since this letter began scoring the AI trade’s layers separately, the story has been rotation: money leaving one layer to fund the next, the ladder inverting week by week — last week the applications gained eight percent while the builders fell three and a half. This week broke the pattern in the only direction nobody positioned for: everything was bid. Rubin, the build-out layer, +7.1%. The Agentic Ecosystem — the operating layer — +8.9%. The Agentic Winners — the applications — +8.0%. HALO, the broad growth basket, +5.3%. Euro-AI +4.7%. Five baskets, five different theses, one week, all up between five and nine percent.
The house referee ratios barely moved in consequence — the use-against-build line sits at 1.41, a week-over-week tick of less than one percent — because a handoff gauge goes quiet precisely when nothing is being handed off: both sides rising together is not rotation, it is expansion.
Whether that expansion is the start of the broad leg — the one the wave counts on both sides of the Atlantic now sketch — or a one-week truce in the rotation war is the question the letters will score next Saturday. The full print-by-print anatomy belongs to tomorrow’s US letter; the name-level ladder to Hypergrowth.
The regime gauge. The Money Temperature instrument board warmed from neutral to roughly the low sixties this week — the first warm reading after three neutral weeks — with the US legs individually hot (the S&P instrument at 87, the Nasdaq at 79) while gold (58), the ex-US world (69) and bitcoin (51) sit warm-to-neutral. Read it plainly: the tape is no longer cool enough to call any of this early, and not yet uniformly hot enough to call it a chase. Rotations get funded here; so do first mistakes.
🔒 Be Informed — the rest is for subscribers. Free: the LinkedIn newsletter + closelook.net. C+ (paid): real-time push on every portfolio move → closelook.net/subscribe/.
