


Korea’s fund fell 15%, Taiwan’s 7%, Indonesia’s 16% on an MSCI threat, and the Nasdaq, US tech and the chip majors closed under the rising lines that had carried them since March. The money did not leave the market; it changed seats. Staples and health care rose in America, Europe and developed Asia, energy made its highest close of the year, and Switzerland, Mexico, India and Britain rose 3 to 4 percent. Europe’s own tech rose 2.1% while America’s fell 7.7%. The ten-year yield fell from 5.24% to 5.10% despite hot inflation, the long bond had its best week in a year — and the editor’s wave count moves on, and the world ex-US is forming its fourth wave.

1 · This Week’s Action
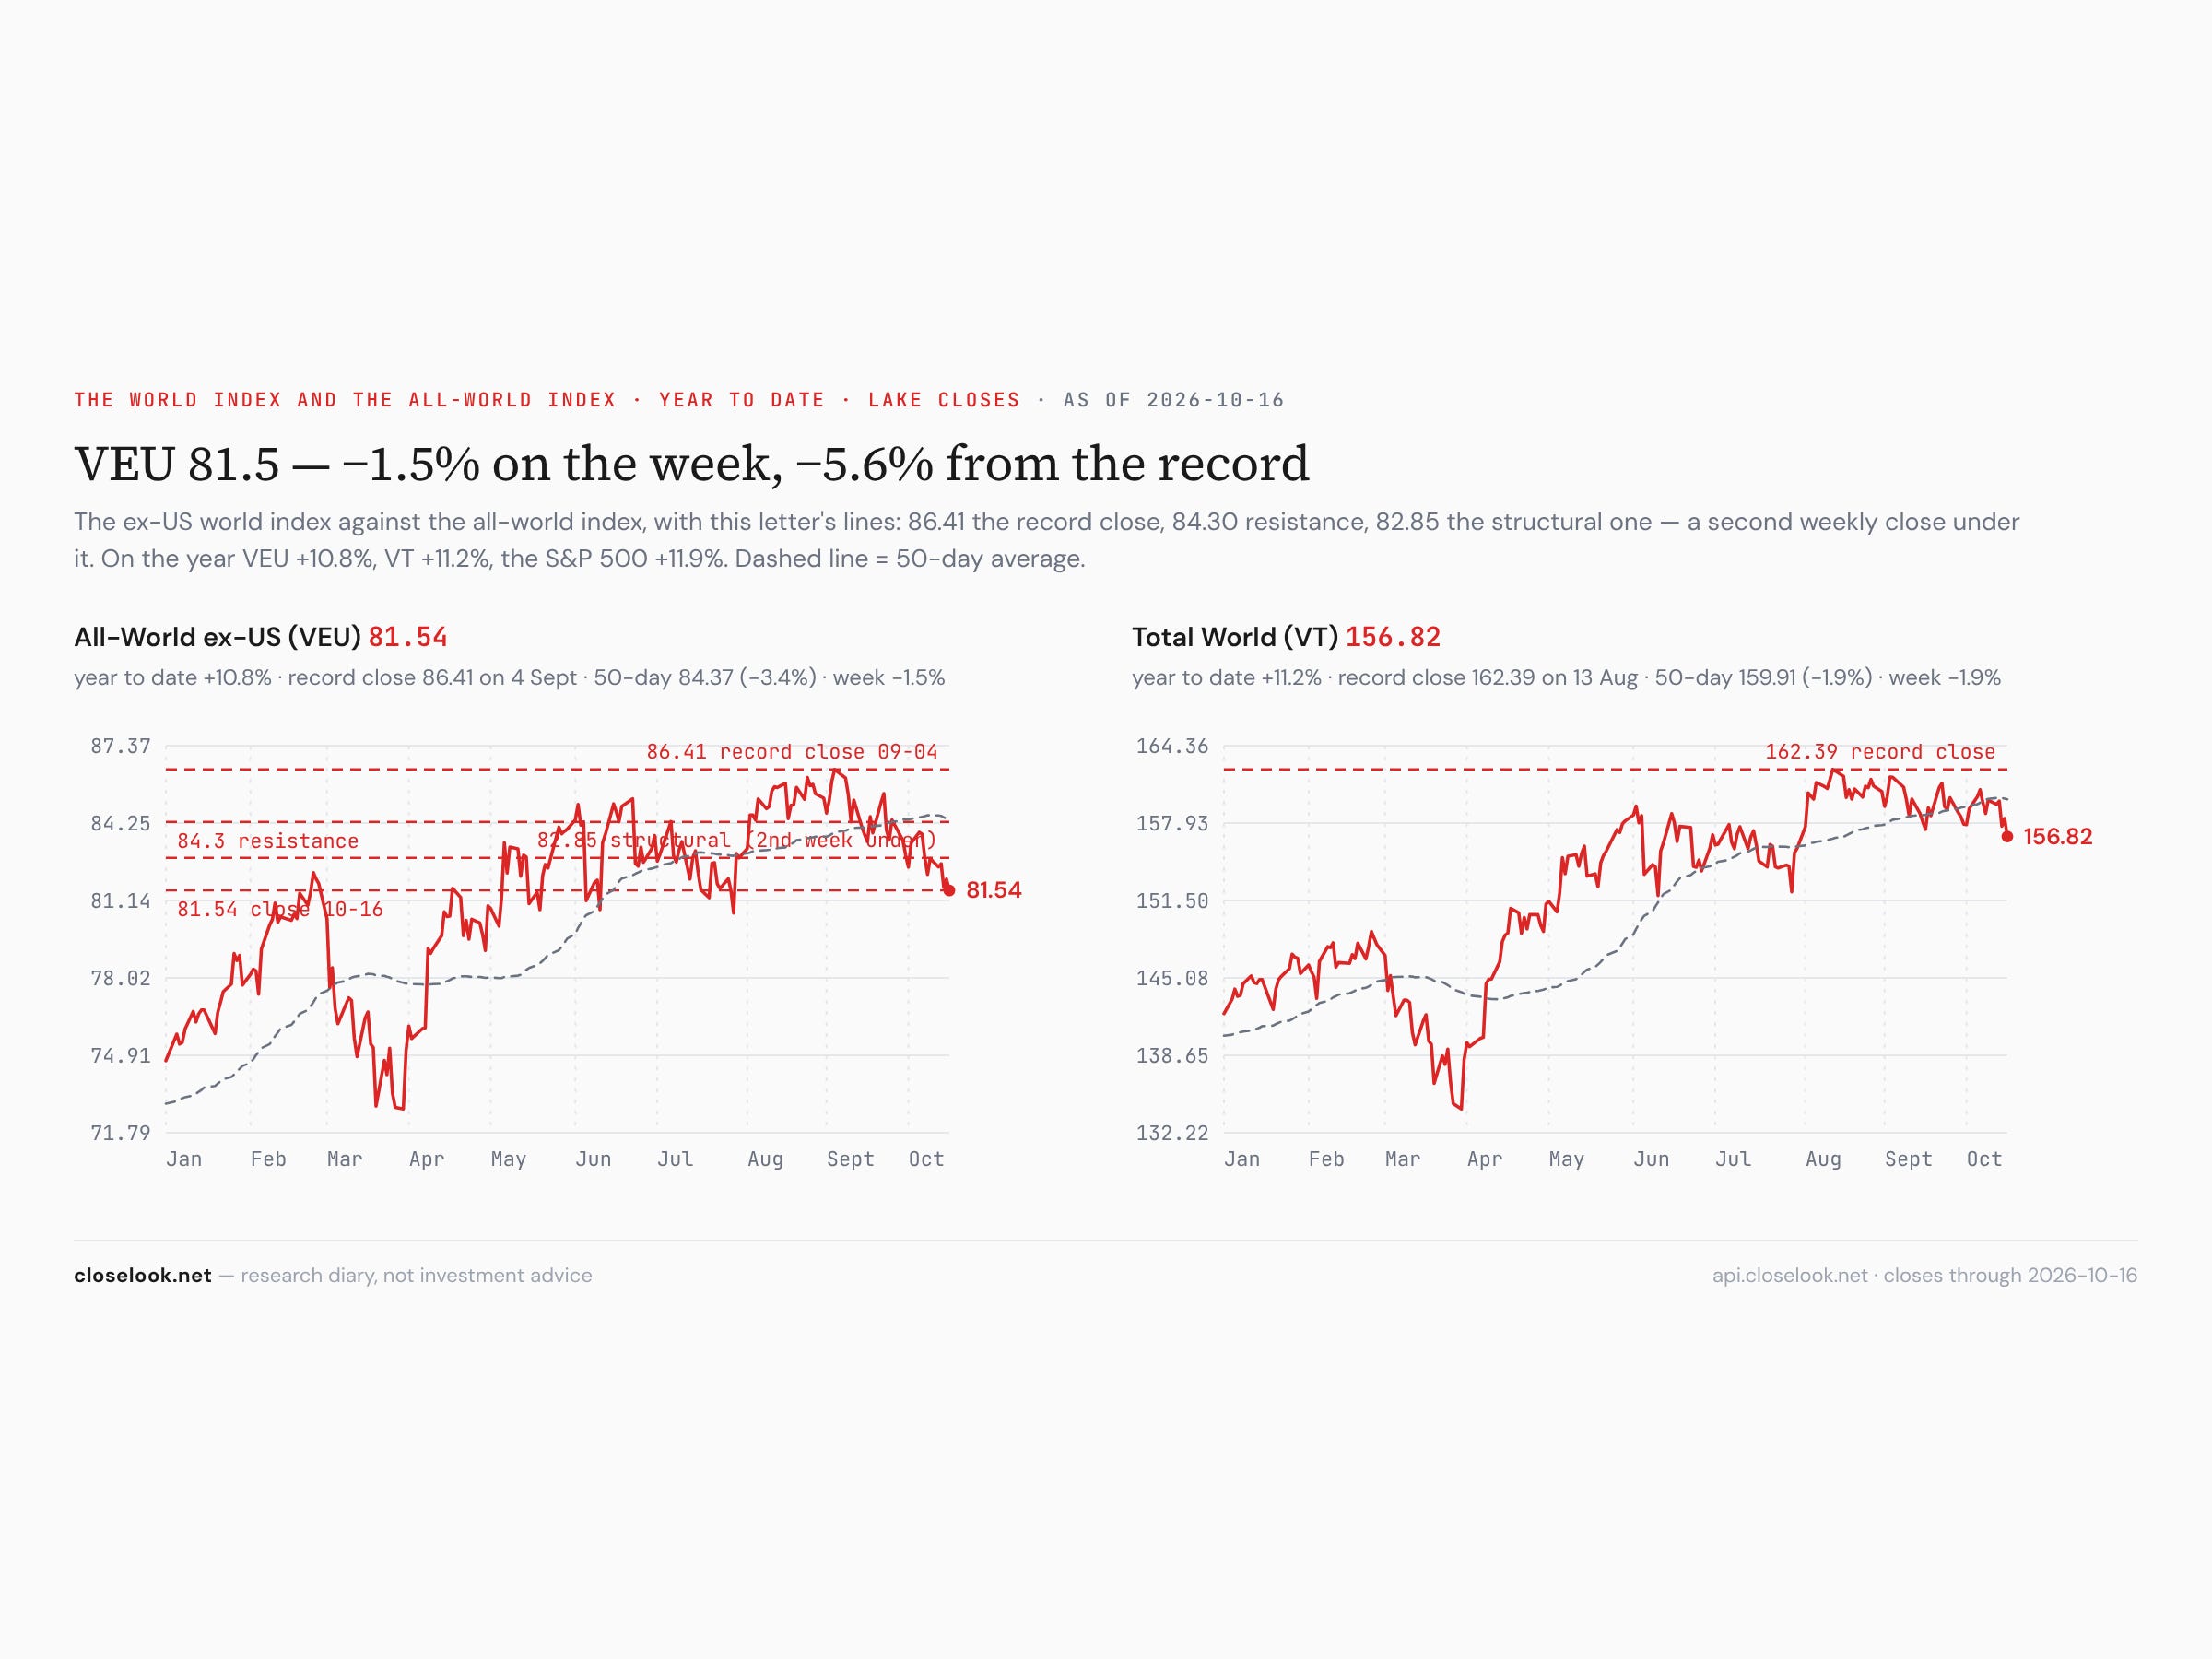
The global view. The ex-US world index closed the week at 81.54, down 1.55% — a second weekly close under 82.85, the structural line this letter has carried since the summer. The path: Monday 82.49, Tuesday 82.61, Wednesday 81.66, Thursday 82.00, Friday 81.54. The index sits 5.6% under its September 4 record of 86.41 and 12.1% above its spring low of 72.75. The all-world index fell 1.88% to 156.82. The S&P 500 fund fell 1.97% to 763.25, 2.0% under its October 6 record; the Nasdaq 100 fund fell 5.52% to 709.80, 6.6% under its own.
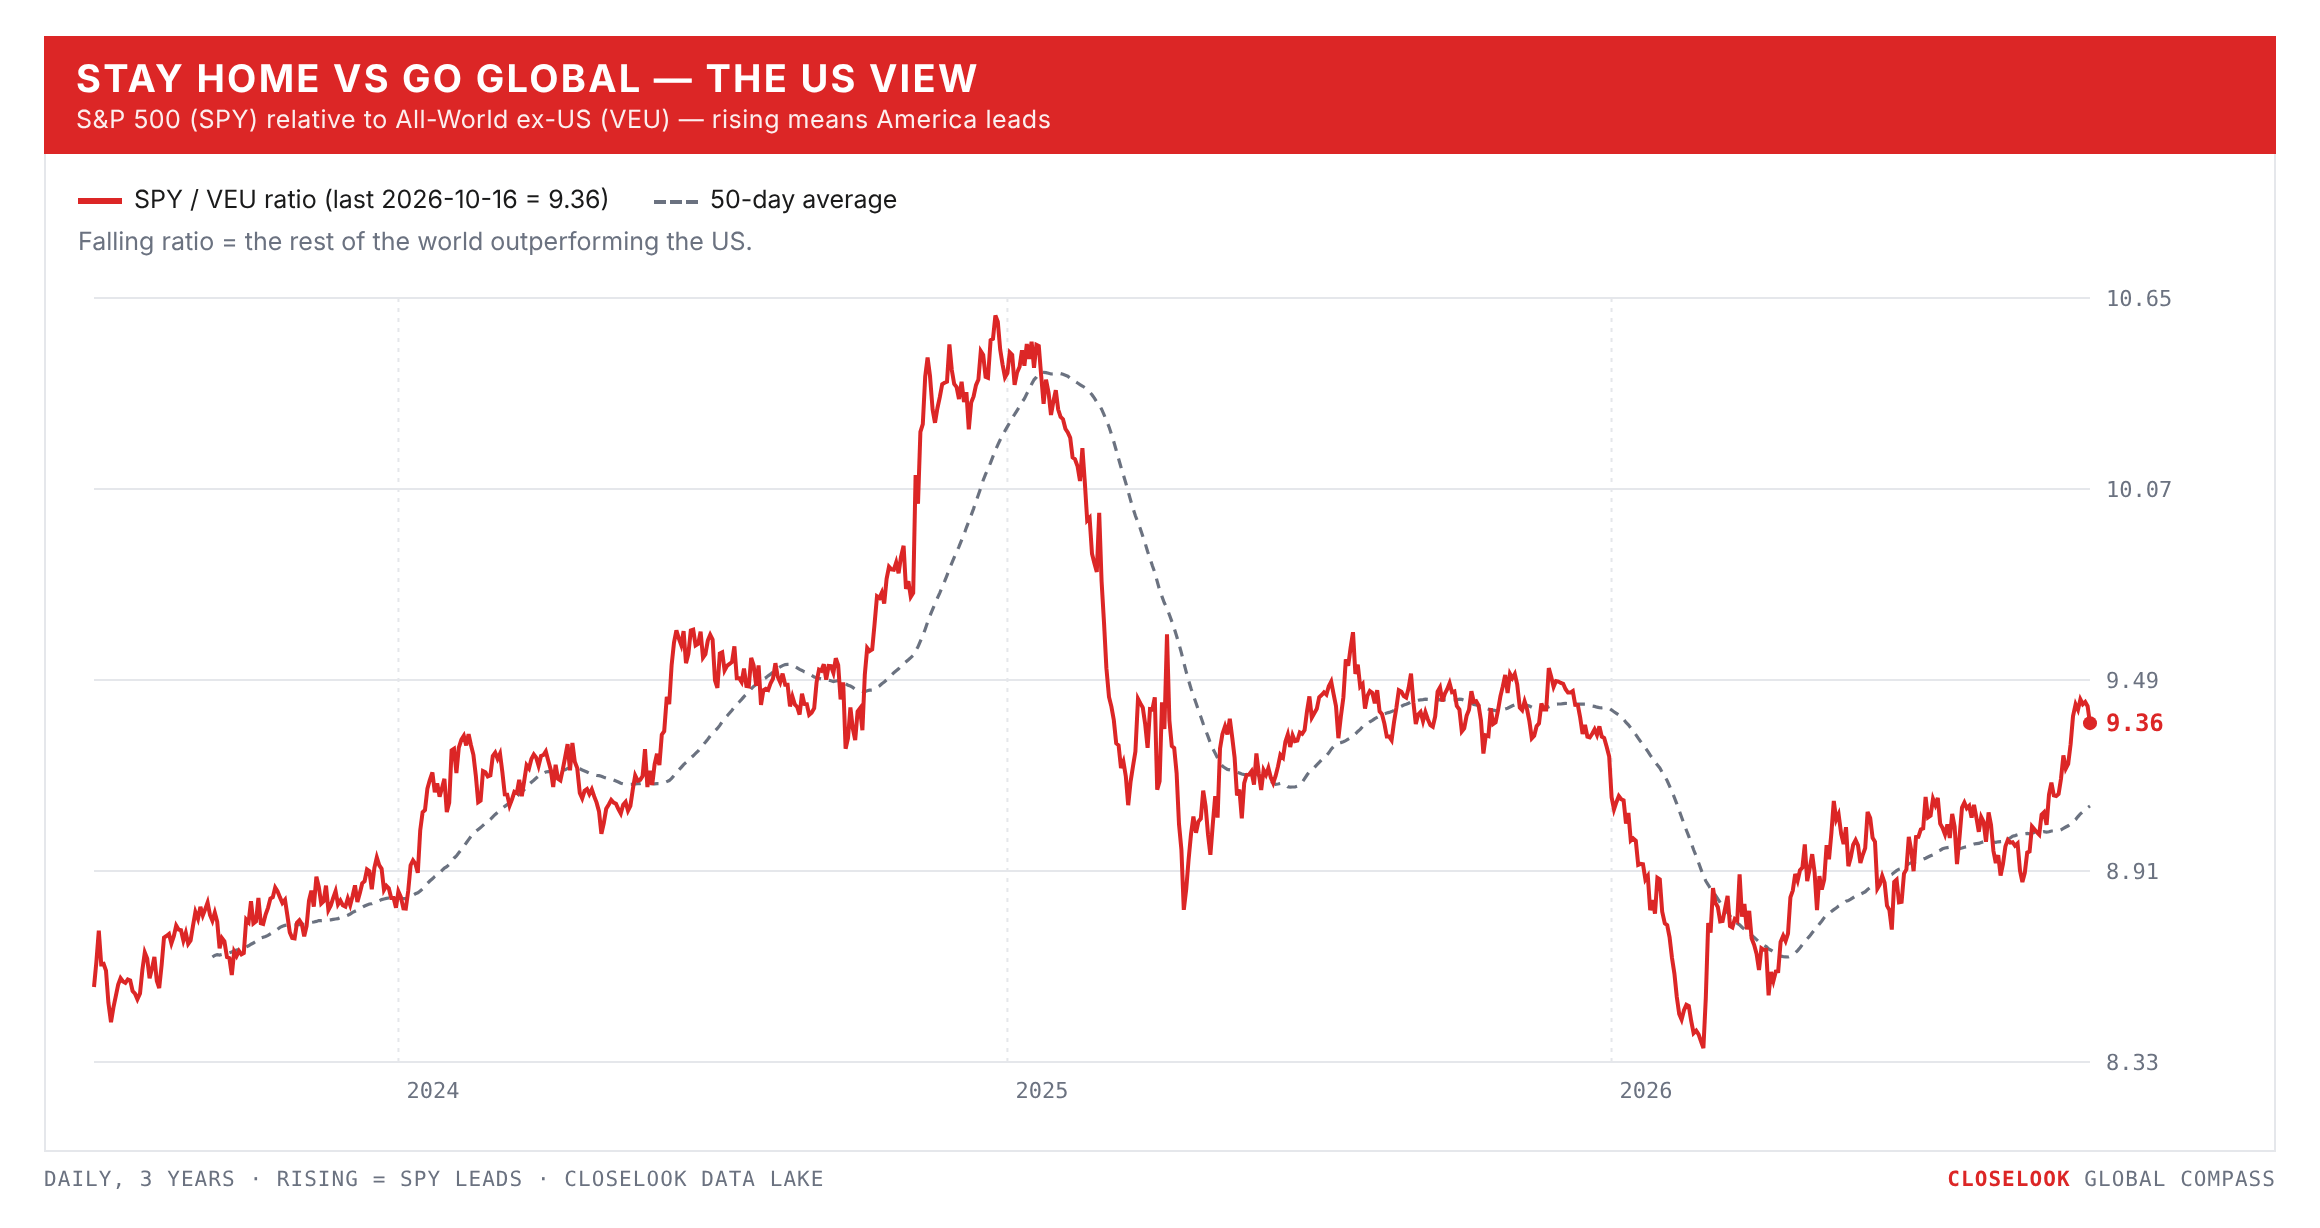
America still leads the year — by less. The S&P 500 fund is +11.9% for 2026, the all-world index +11.2%, the world ex-US +10.9%. A week ago America led by 1.6 points; this week by 1.1. A week in which the American tech complex was sold hardest narrowed the gap without closing it. The house cointegration monitor still lists the VEU/SPY pair as breaking, the spread now 2.0 standard deviations below its mean, from 2.6.
The AI winners, sold in order. Read the week by what was sold, and when. Monday and Tuesday it was the chip makers: memory and optics first — Lumentum, SanDisk, Micron — and on Tuesday Korea’s Kospi fell 5.5% and broke the uptrend line it had held since April 2025. Wednesday the software joined: hot September consumer prices (3.7% on the year, the core rate 2.6%), BlackRock’s research arm cutting US stocks to neutral, and the software fund down 2.4% the same morning. Thursday Seoul fell another 7.6% with a trading halt, Tokyo 4.9%, Jakarta 10.8% on an MSCI downgrade warning. Friday the whole complex went: chips for an eighth losing day, software −4.3% — CrowdStrike, Snowflake and Palo Alto about −7% — and the hyperscalers too: Meta −3.7% on the day, Alphabet −2.5%, Microsoft −1.9%, Amazon −1.9%. This was not a verdict on one part of the AI trade. It was profit taking across all of it, from the parts that had risen most.
The scale of it. The chip index fell 11.4% and the chip majors fund 10.5%; equal-weight chips 12.5%; the memory vehicle DRAM 18.8%. Software fell 7.4% (IGV), the cloud fund 6.8%, the AI fund AIQ 6.9%, cybersecurity 10.2%. Of the hyperscalers on the week: Oracle −9.3%, Amazon −4.7%, Alphabet −3.1%, Meta −1.3%, Microsoft −1.1%; the Magnificent Seven fund −3.4% — after a record close on Tuesday. Global tech lost 8.3% and closed at 137.37, 10.2% under its October 6 record.
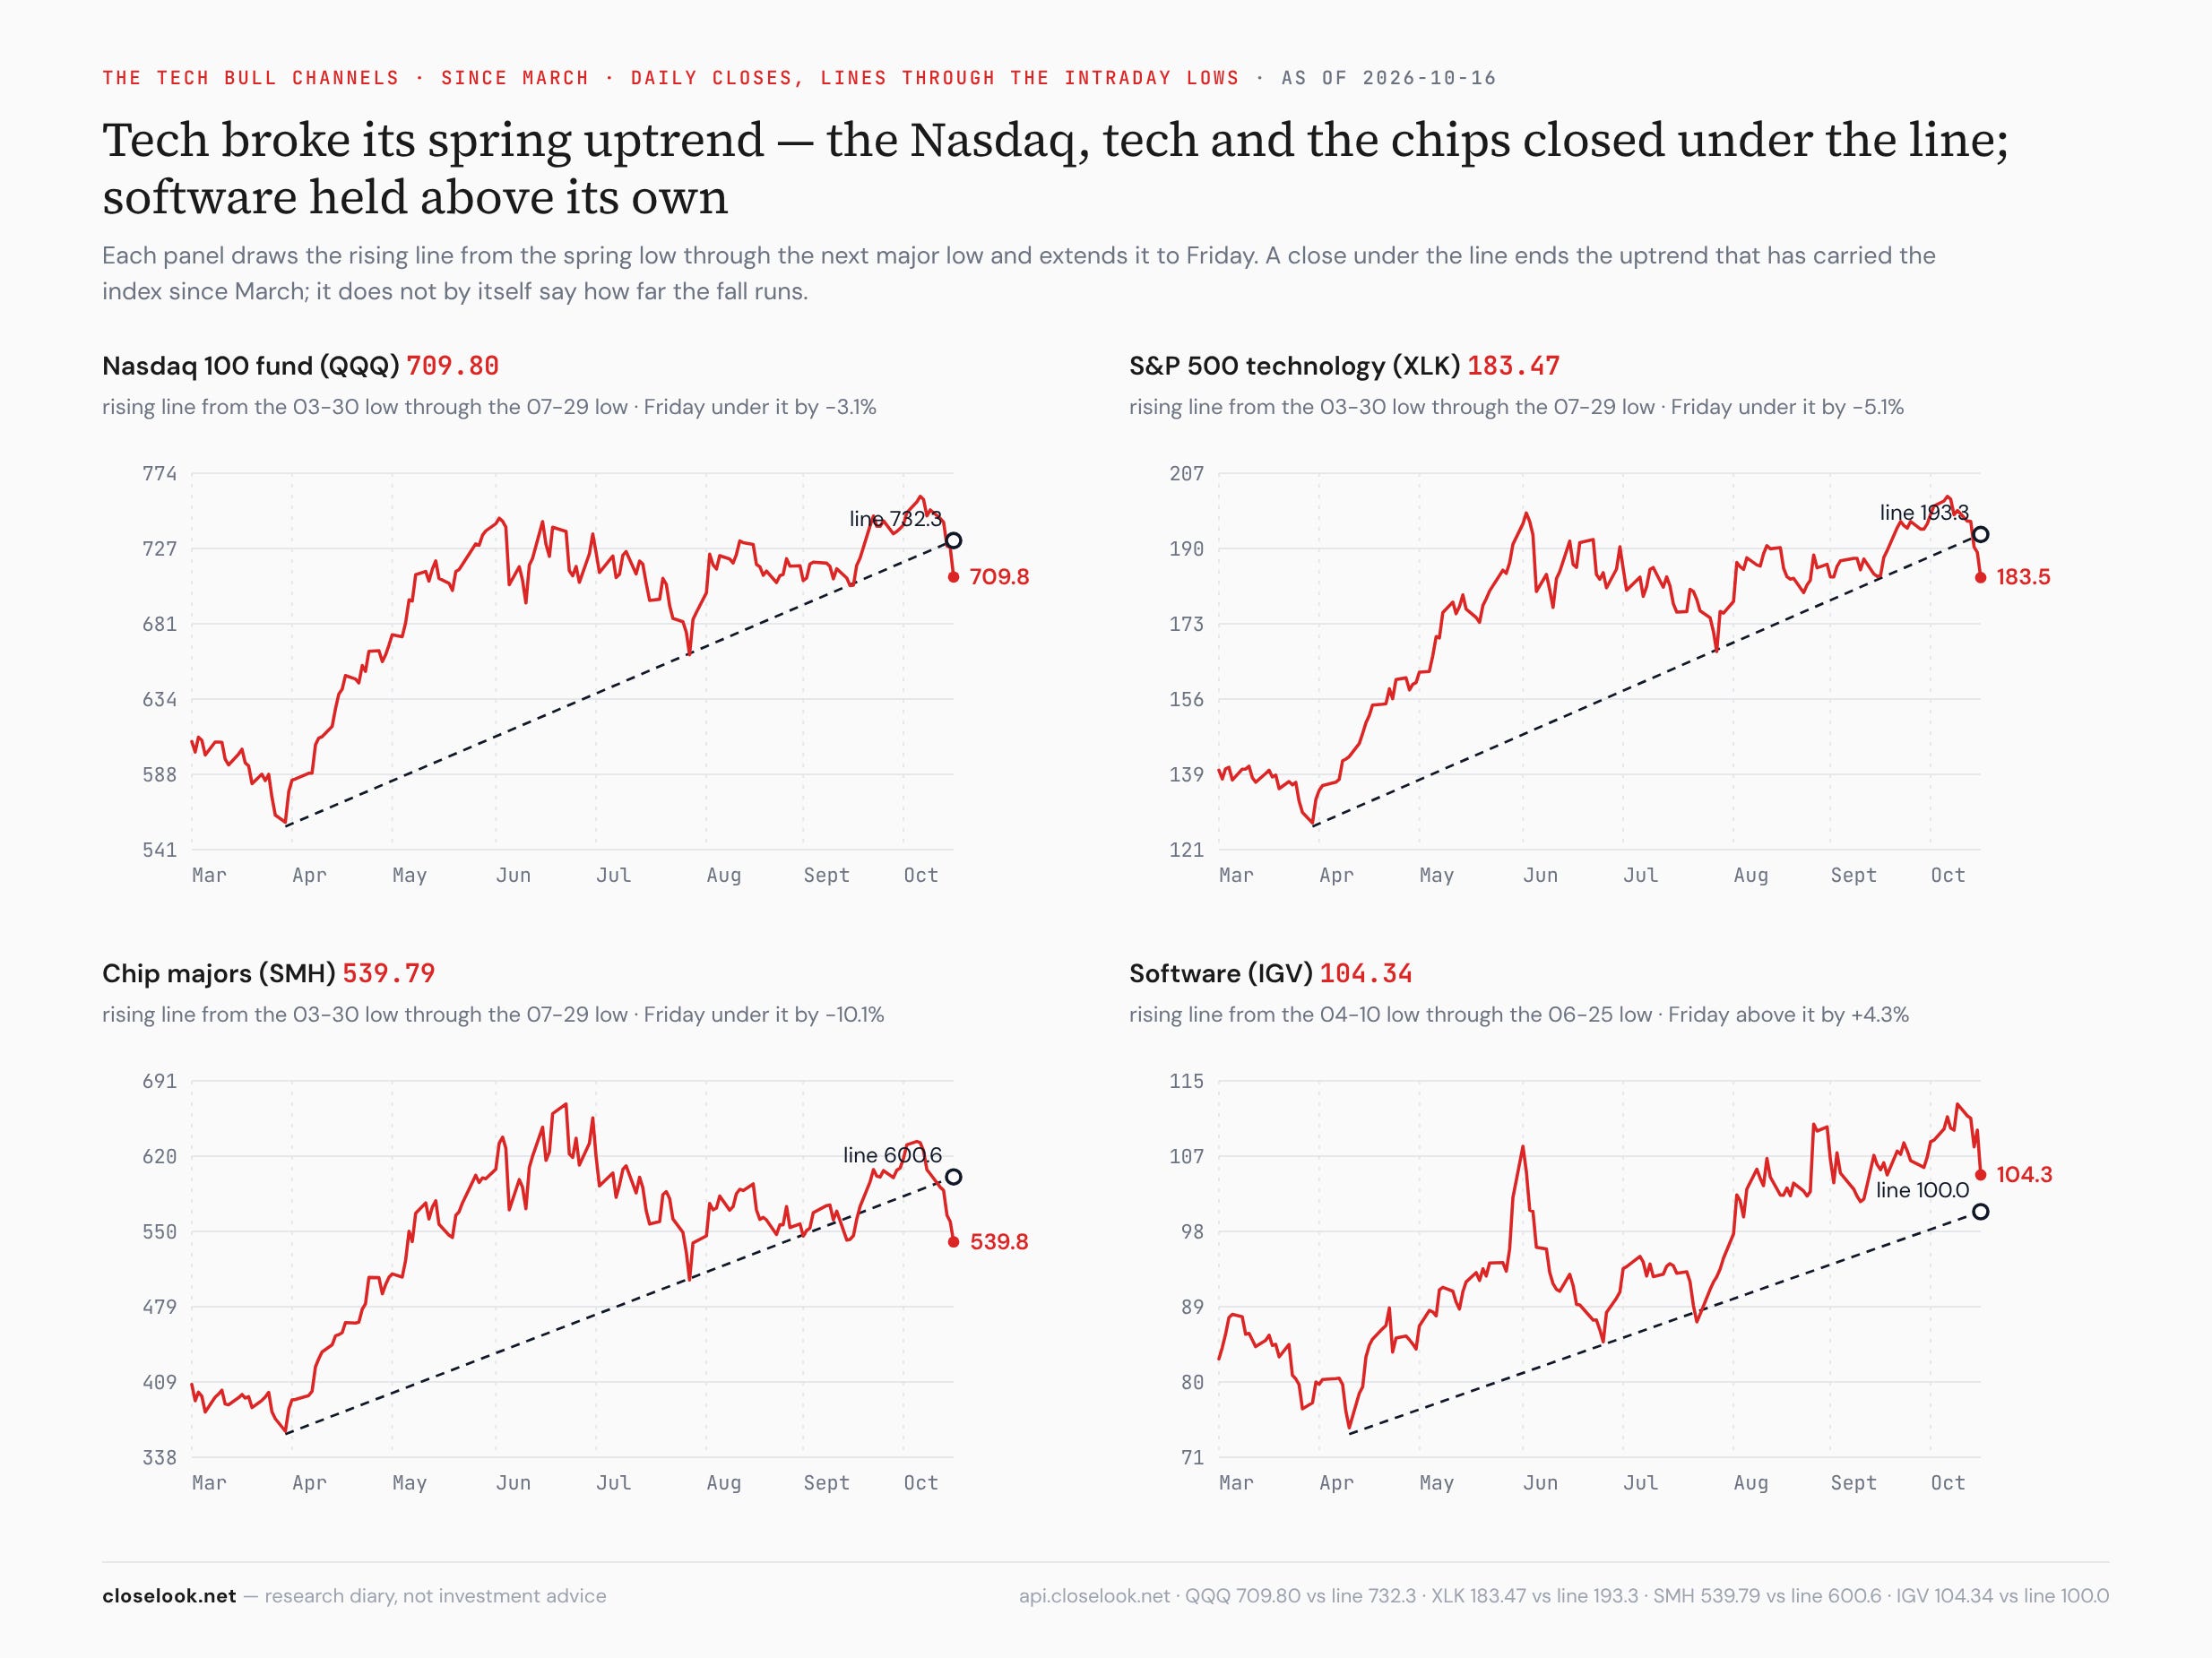
The tech uptrend broke. Since the March low, the tech complex has risen along a line that every pullback respected — the July drop included. This week three of the four funds closed under it. The Nasdaq 100 fund closed at 709.80 against a line at about 732 — 3.1% under; US technology (XLK) at 183.47 against 193 — 5.1% under; the chip majors at 539.79 against 601 — 10.1% under. Software is the exception: IGV’s own spring line sits at about 100, and the fund closed at 104.34, 4.3% above it. A broken uptrend does not say how far the decline runs. It says the trend that carried the index since March has ended — and that the next rally has to prove itself from below the line.
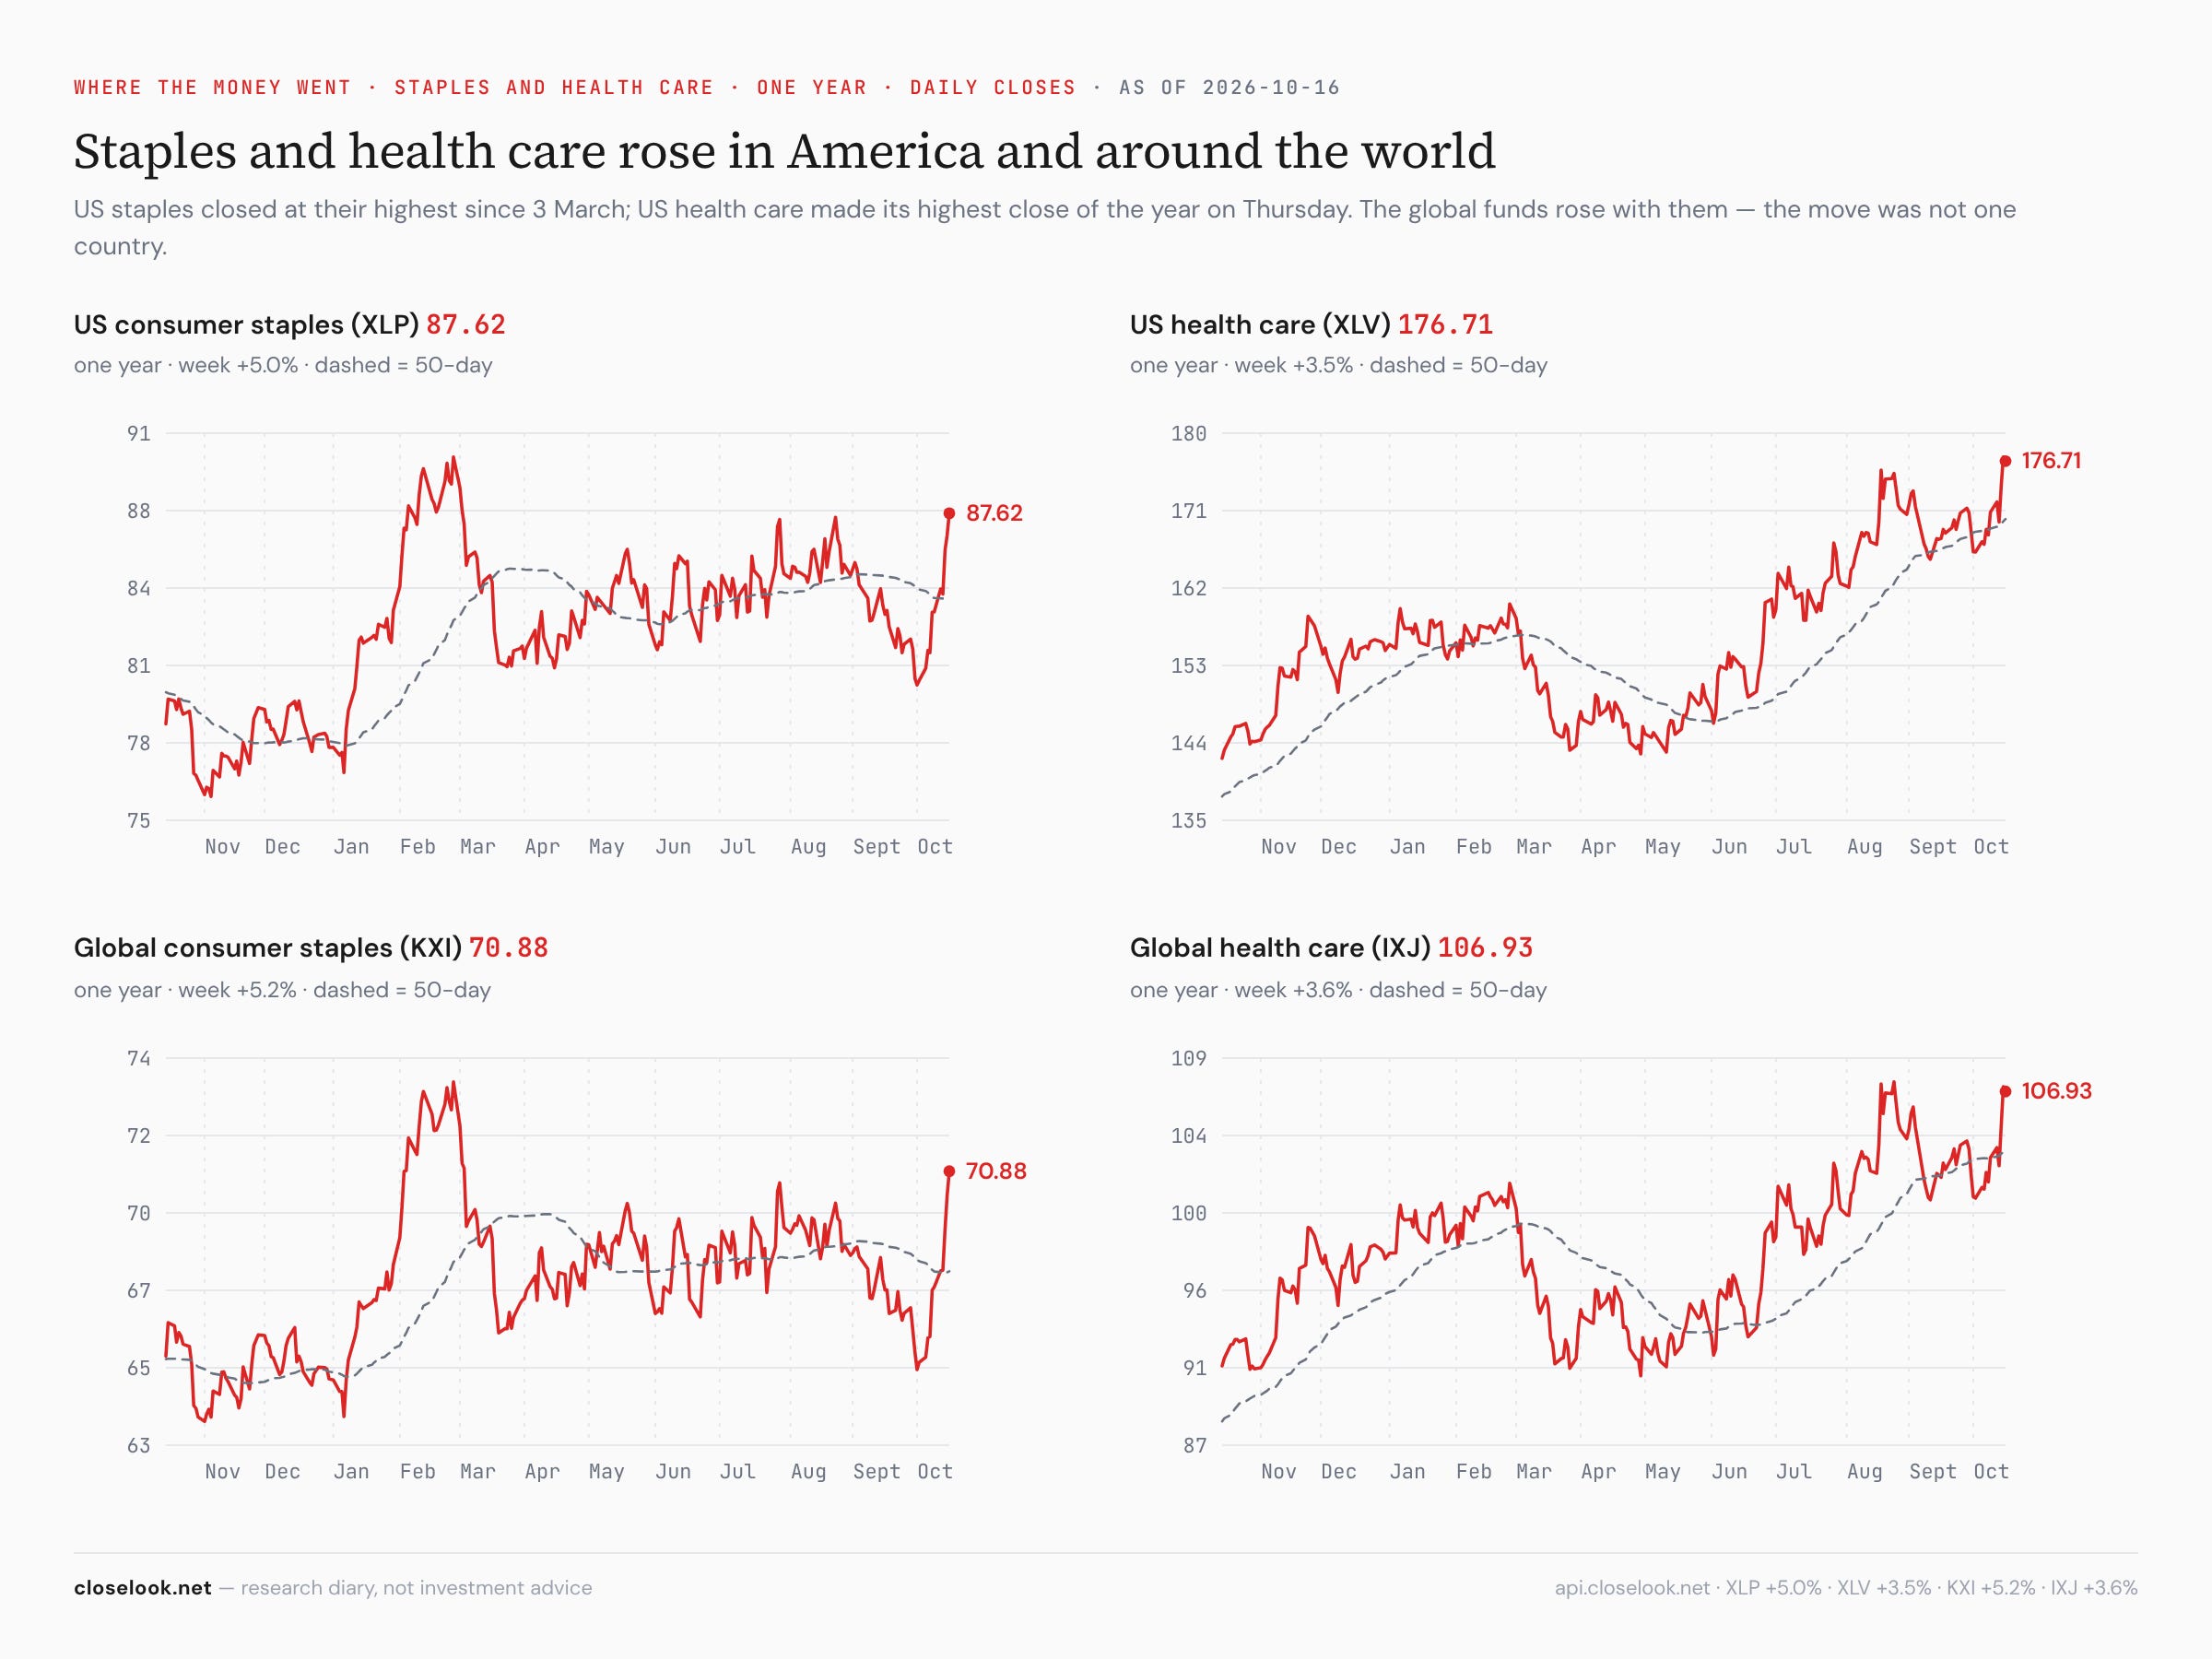
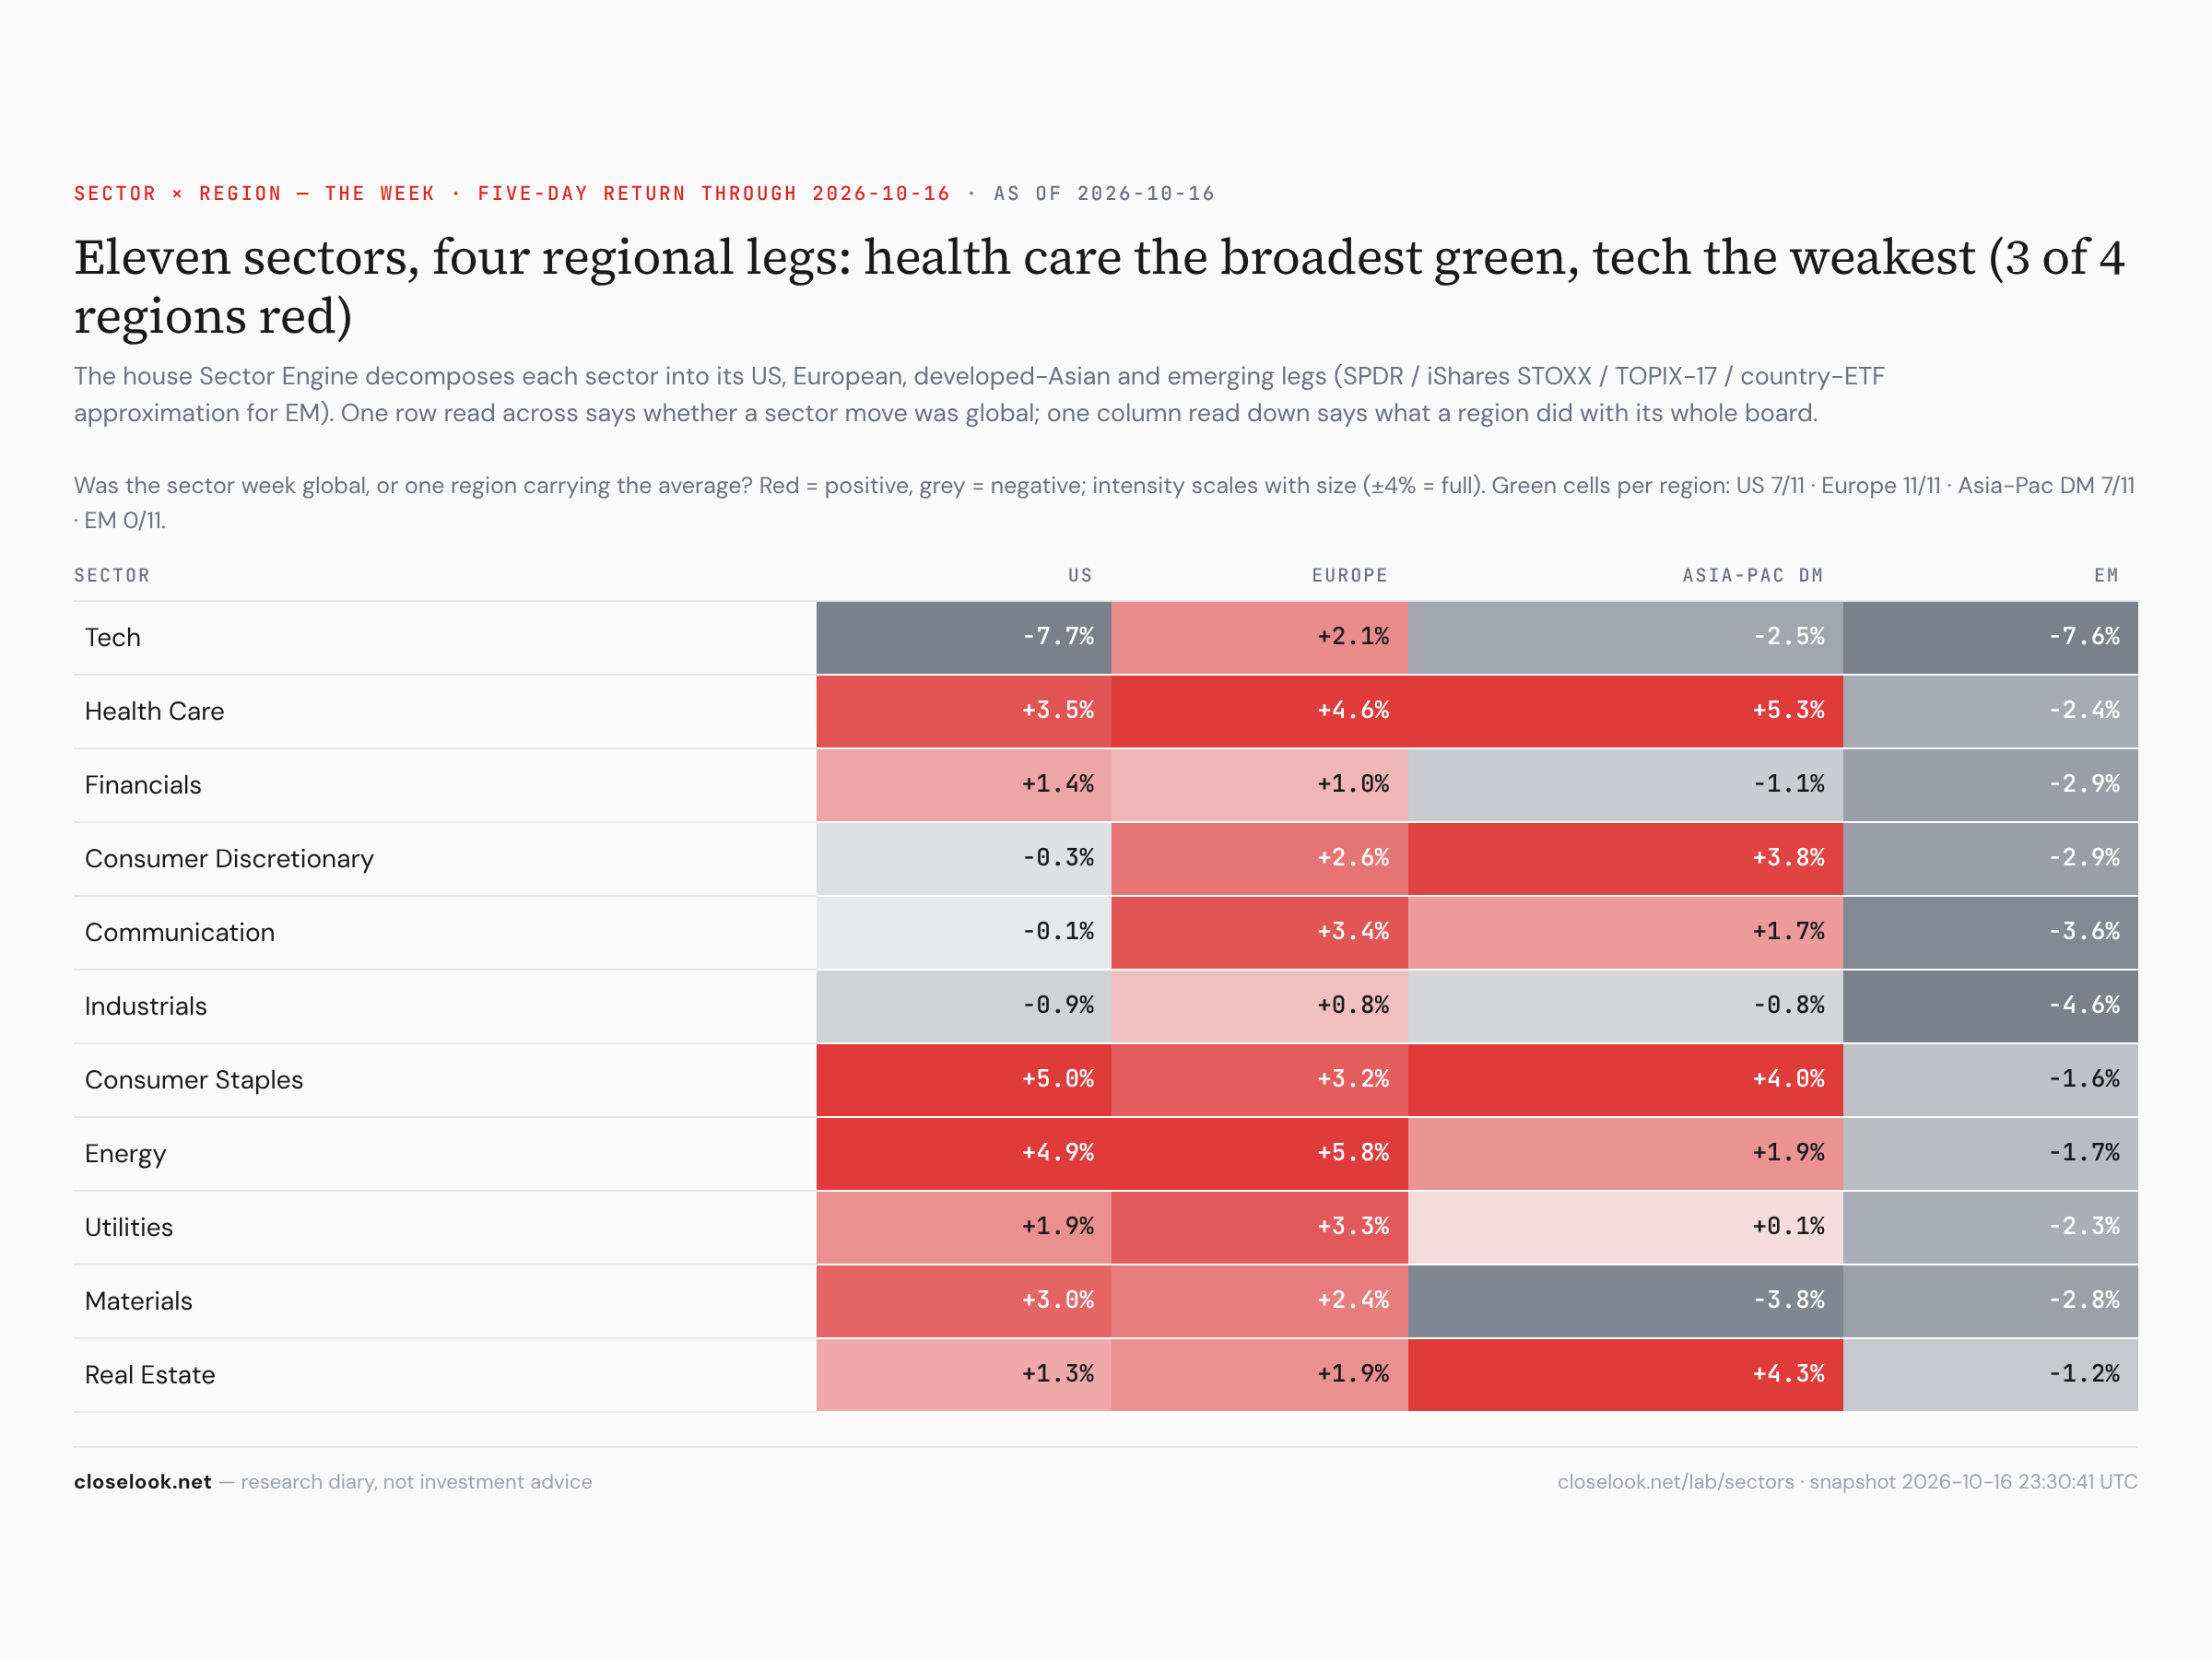
Where the money went — staples and health care, everywhere. The money did not leave the market; it changed seats. US consumer staples rose 5.0% to 87.62, their highest close since 3 March; US health care rose 3.5%, and on Thursday closed at 177.19, its highest close of the past year. It was not one country’s trade: the global staples fund rose 5.2% and global health care 3.6%, and the house Sector Engine has staples up in America (+5.0%), Europe (+3.2%) and developed Asia (+4.0%), health care up in all three (+3.5%, +4.6%, +5.3%). Seven of the eleven S&P 500 sectors rose while technology fell 7.7%. A tech week this bad with seven sectors green is a rotation, not a flight.
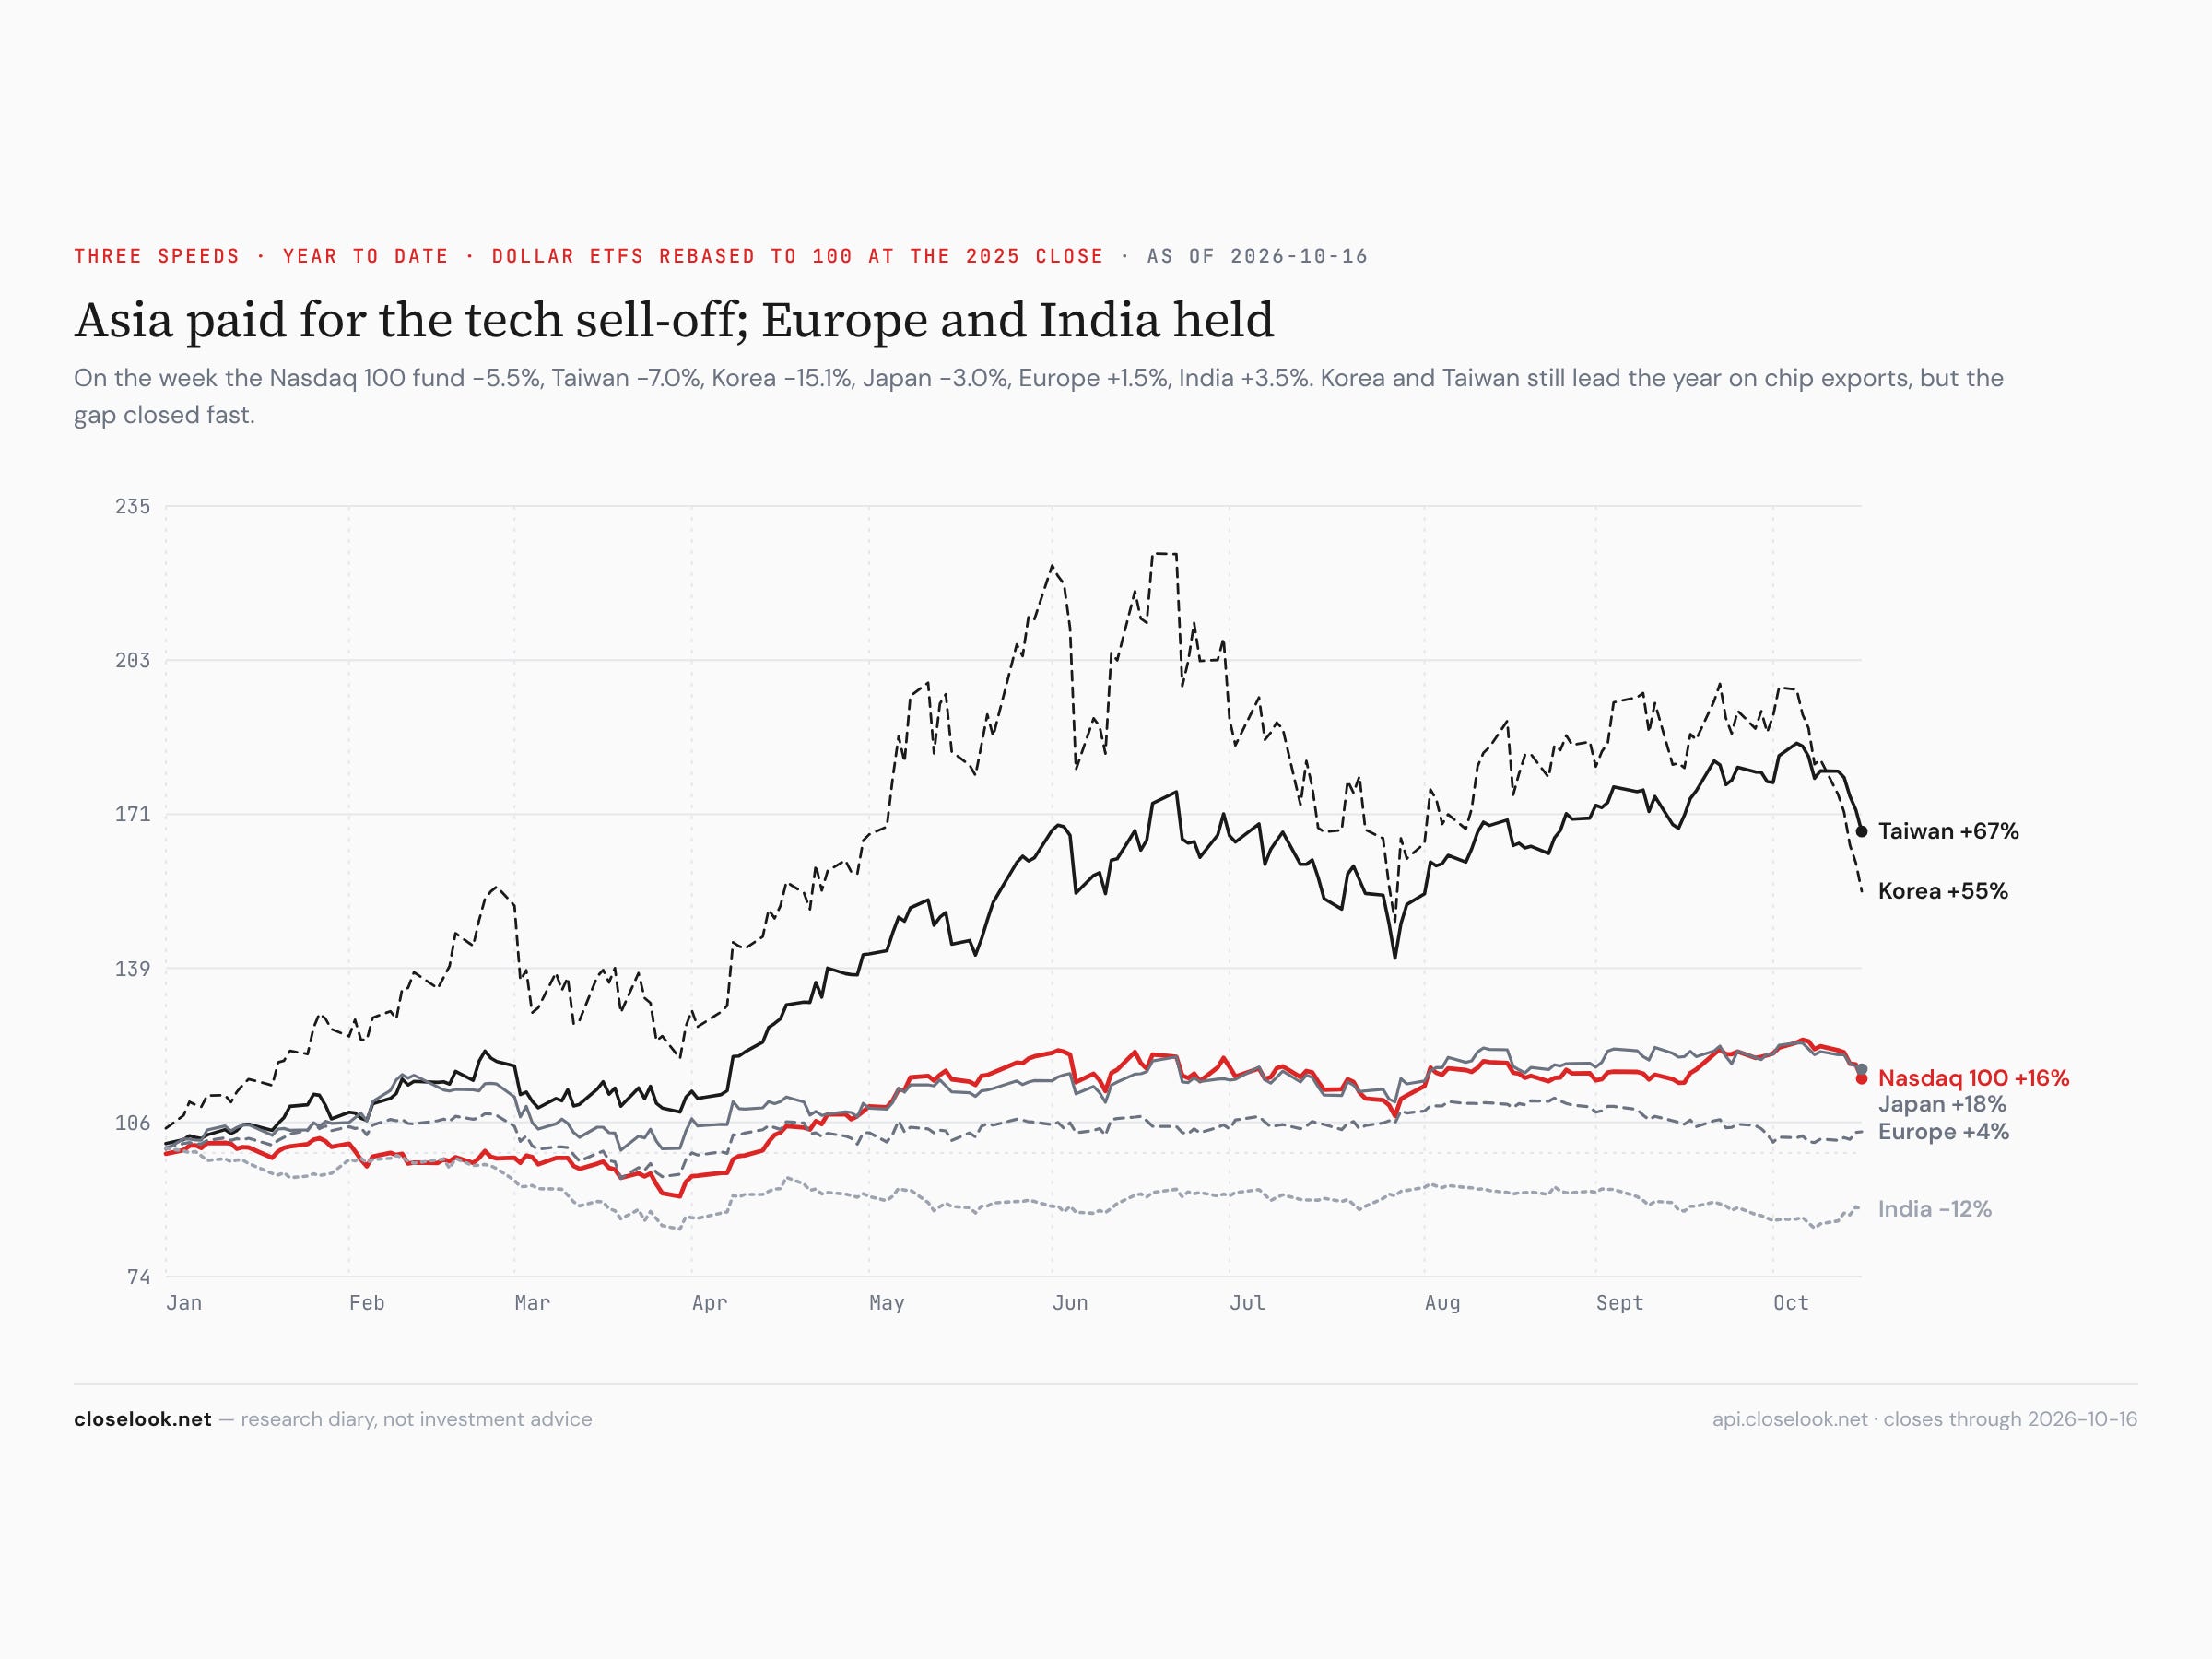
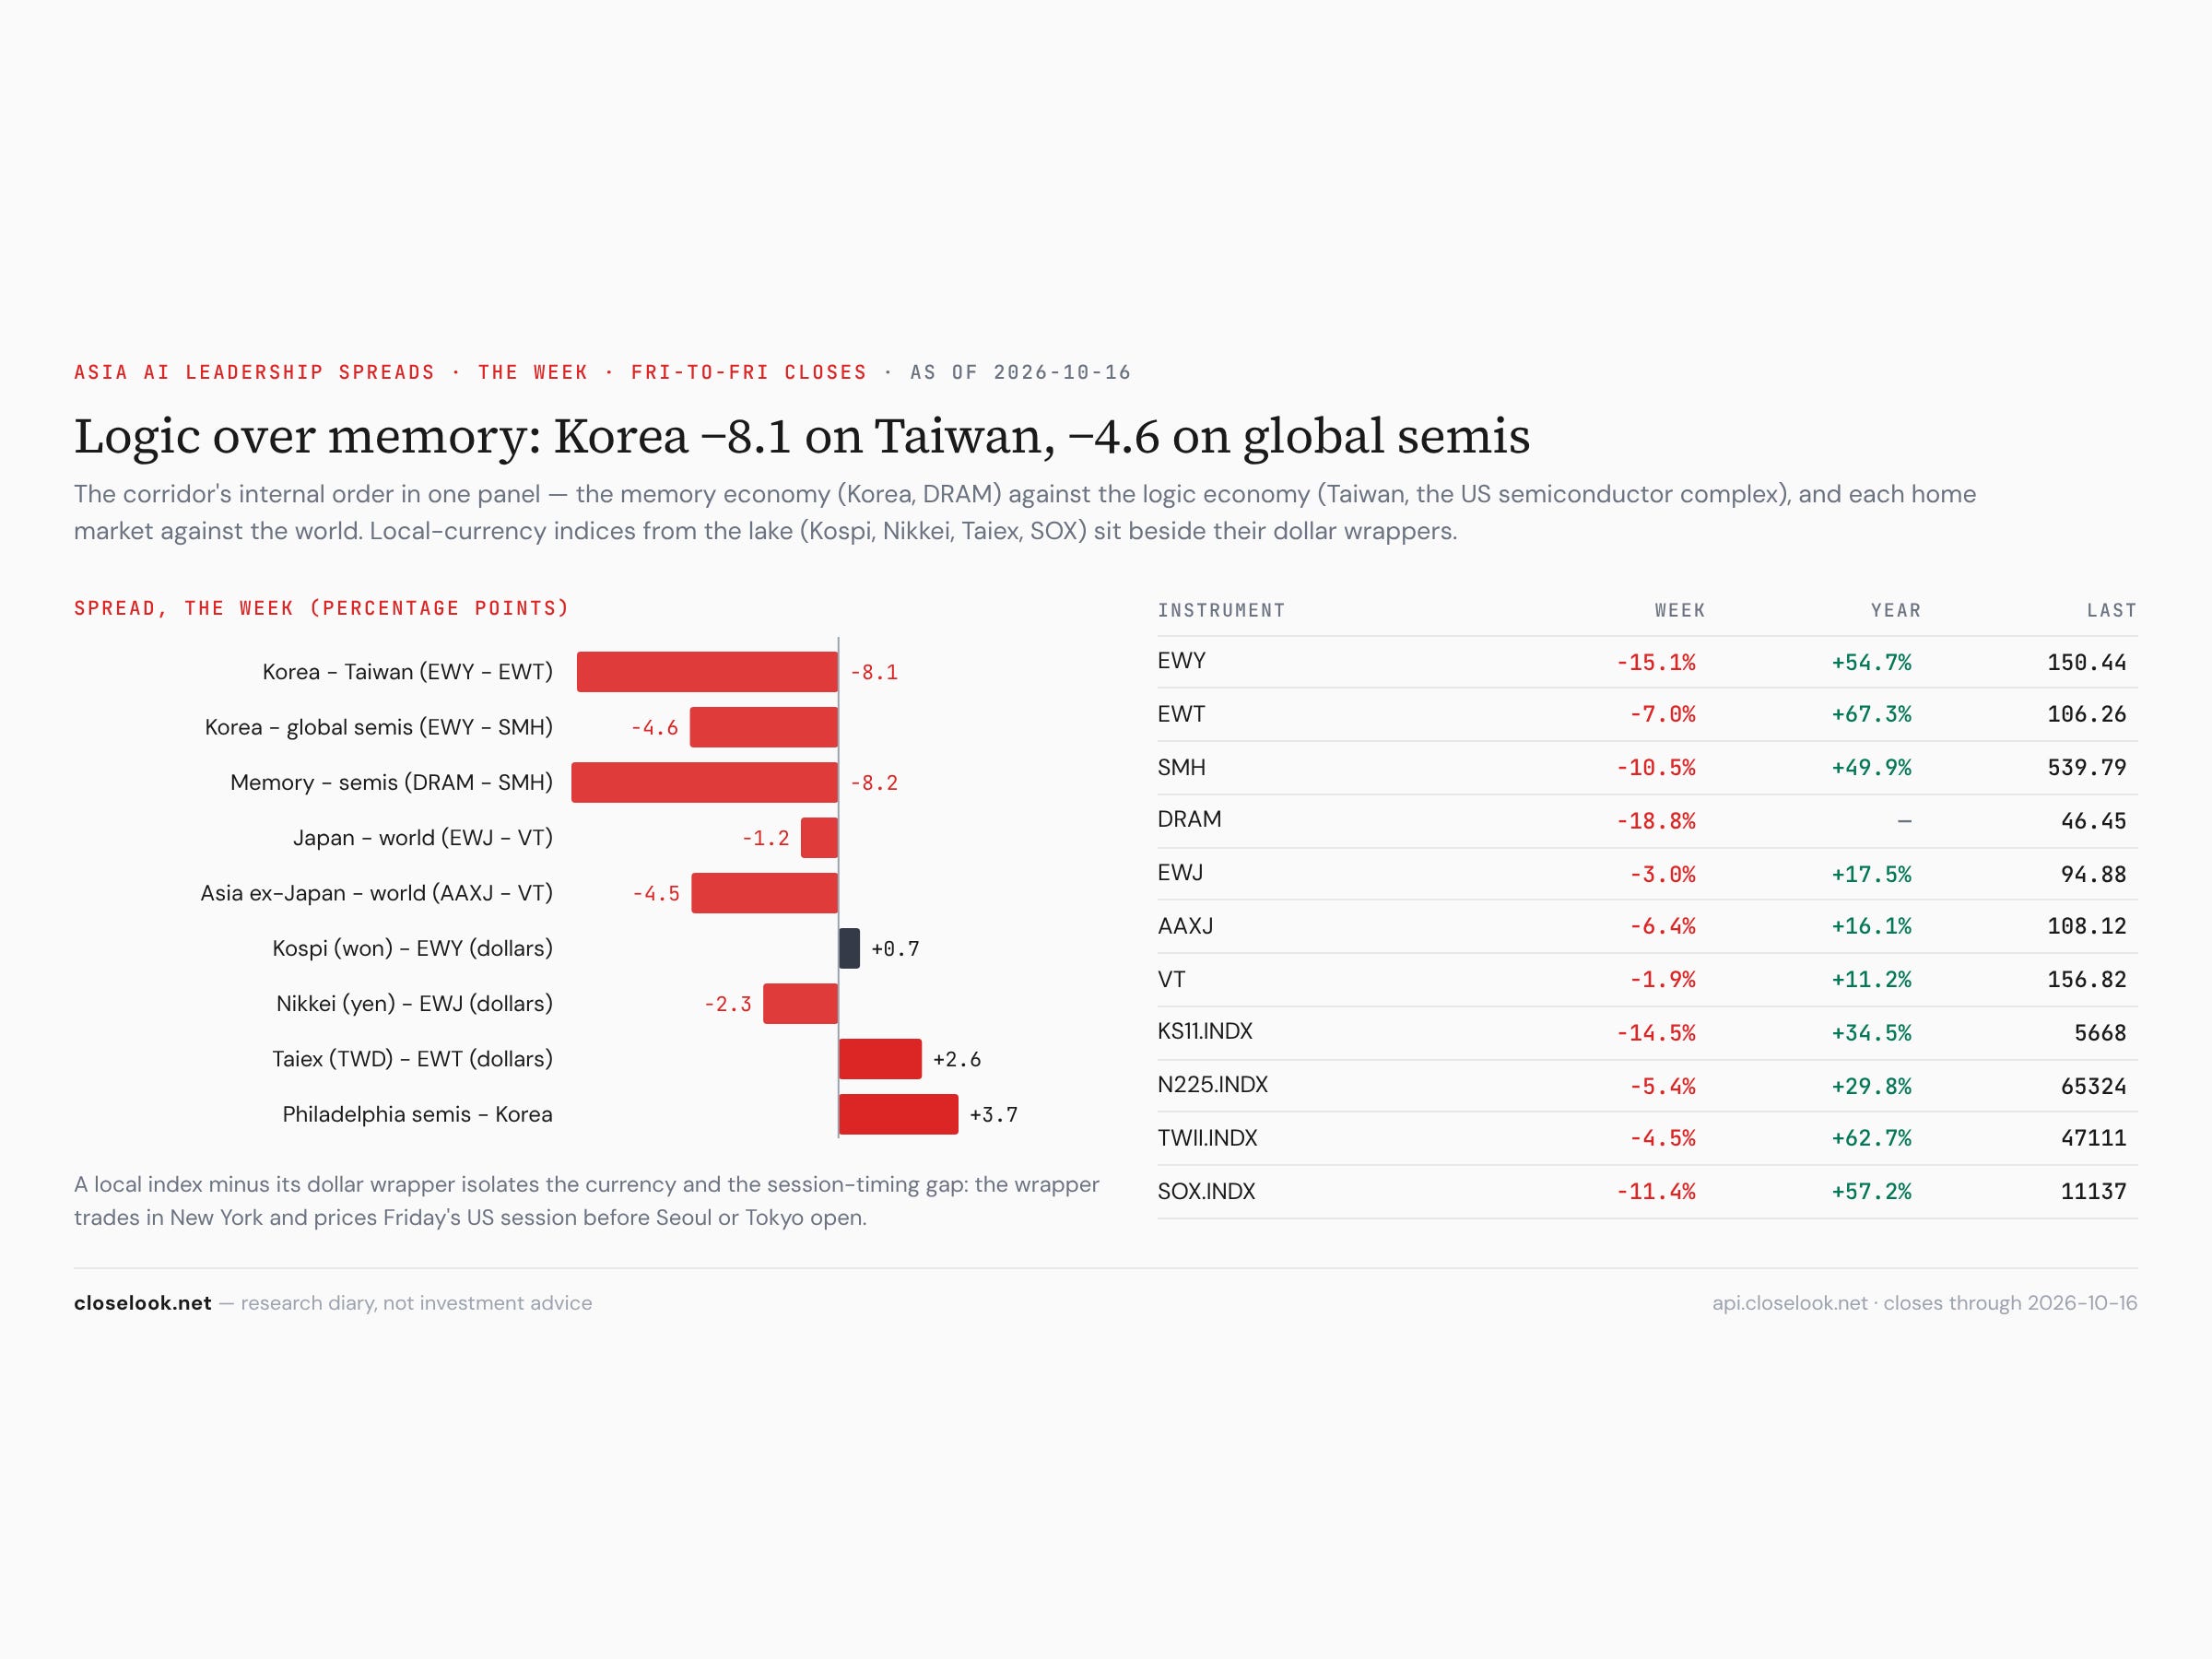
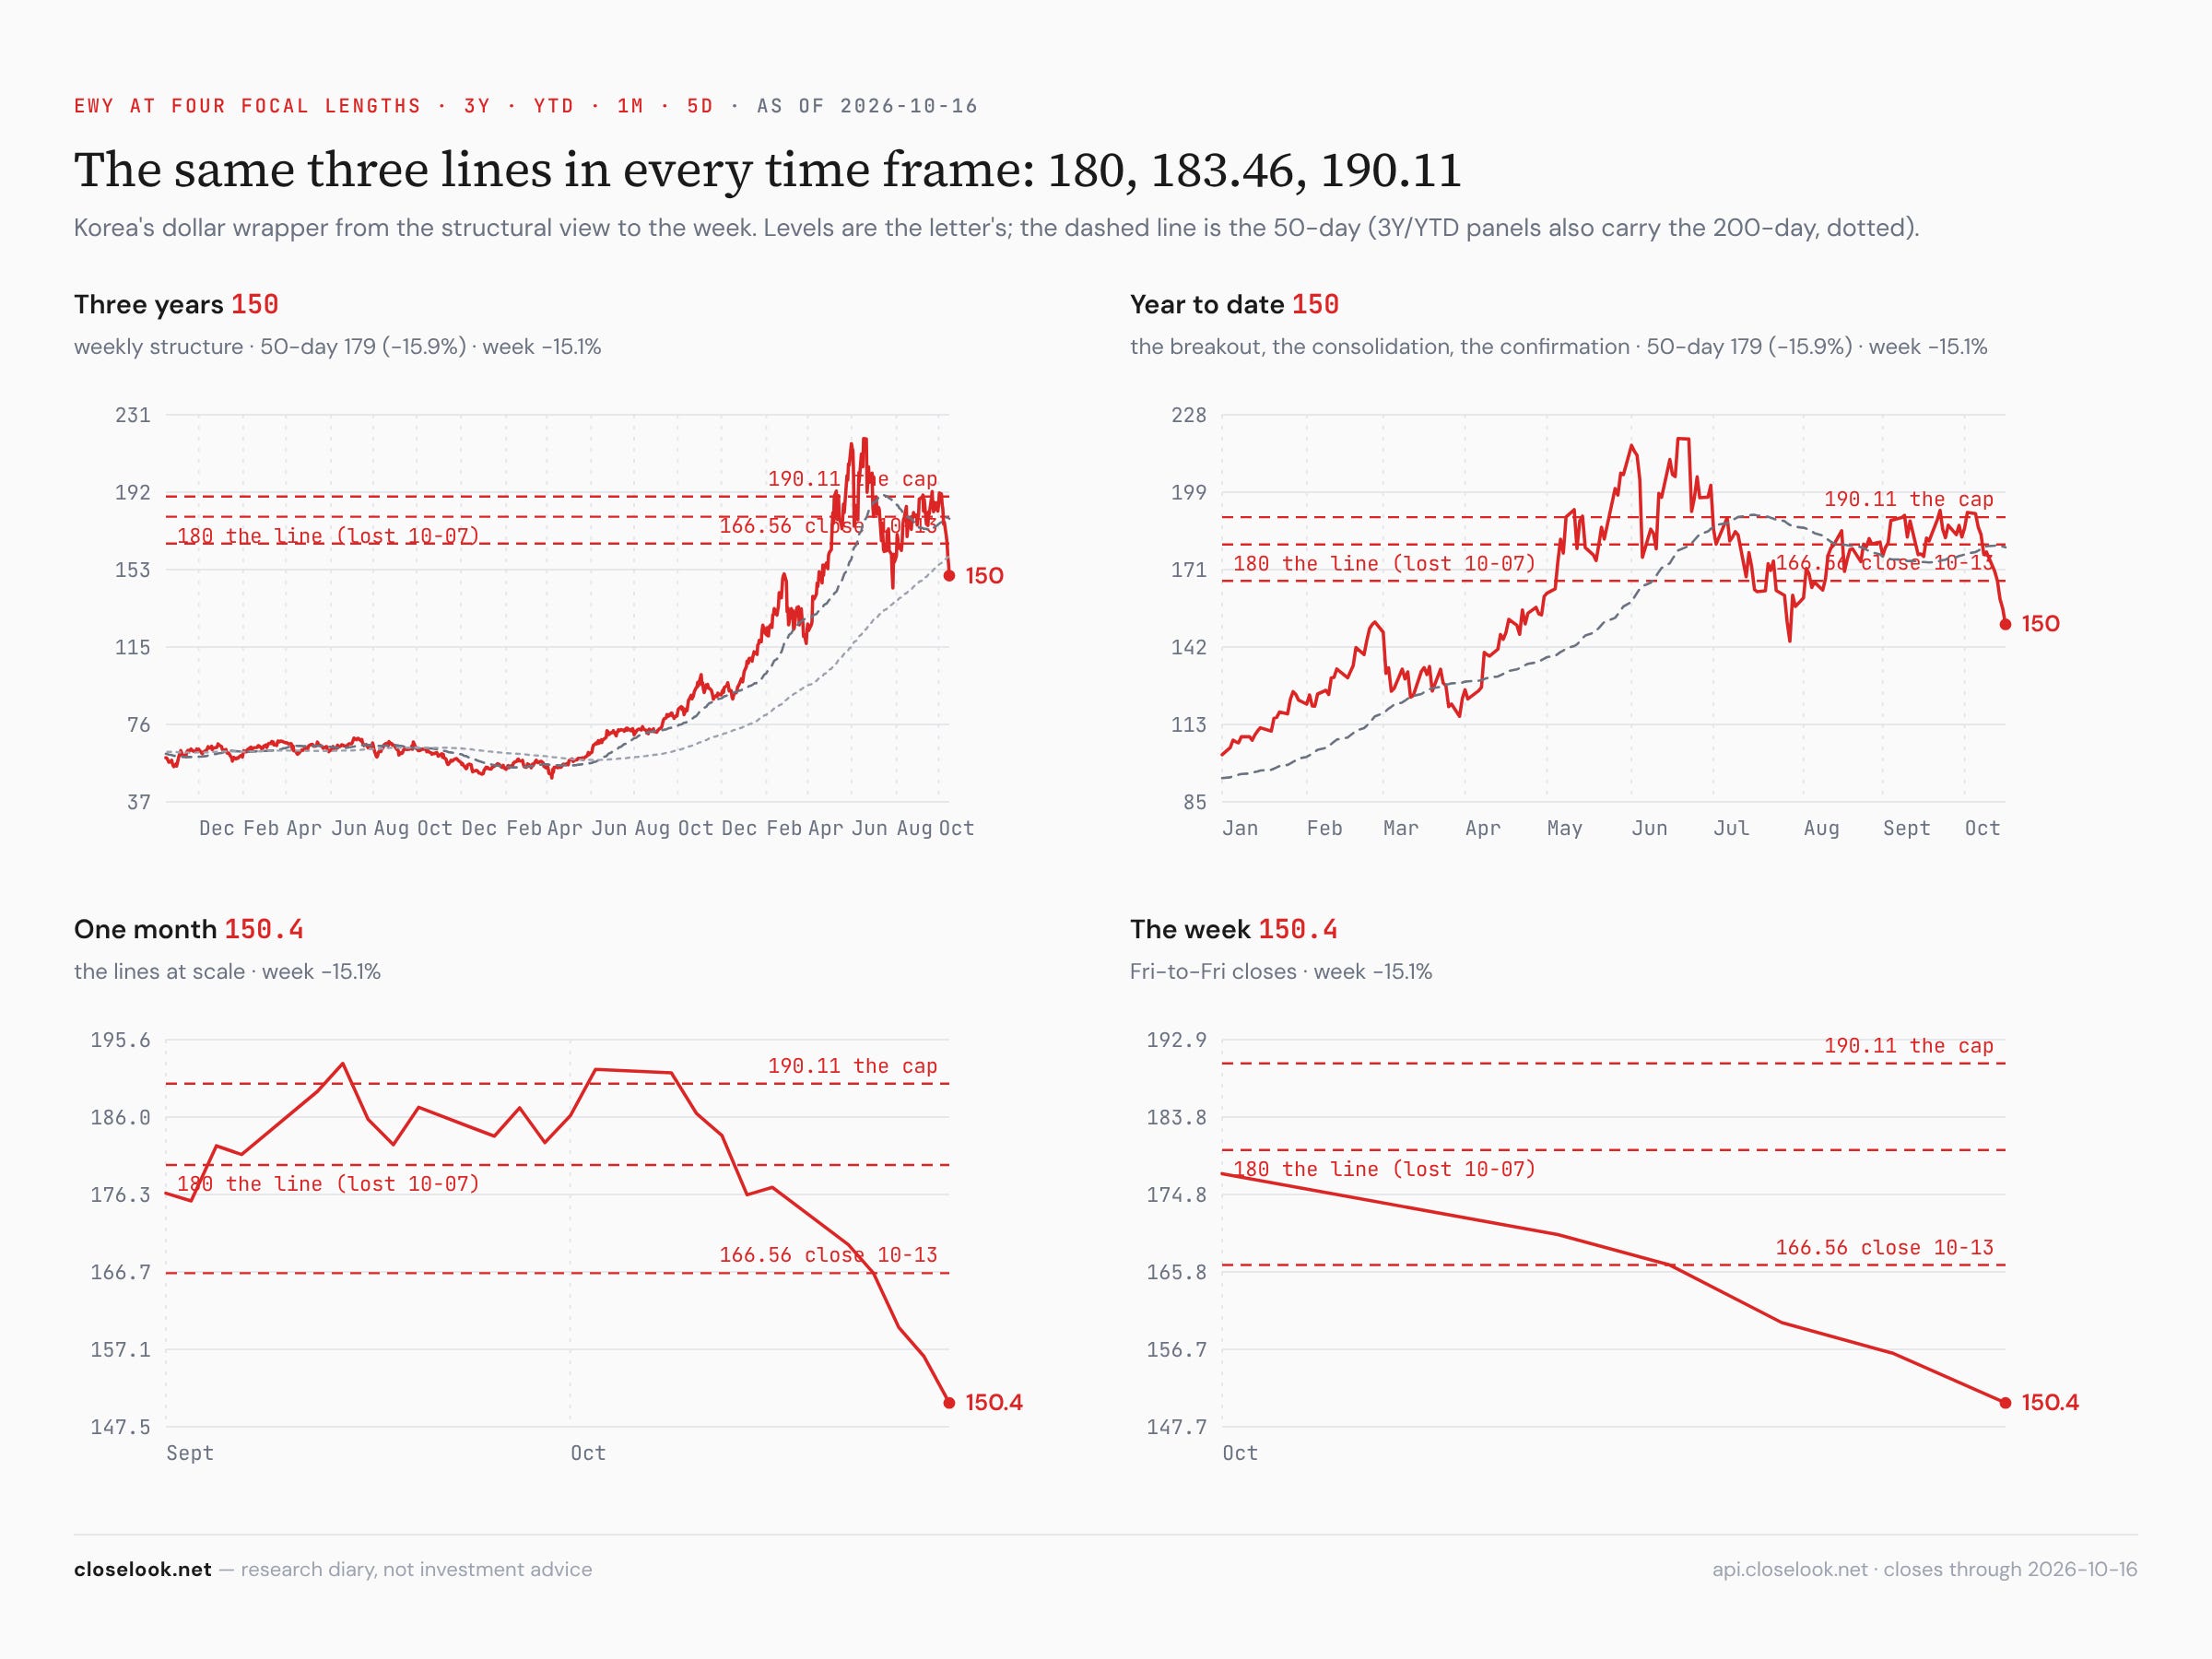
Asia paid for the sell-off. Korea’s fund fell 15.1% to 150.44; the Kospi lost 14.5% to 5,668 and the tech-heavy Kosdaq 10.9%. The Kospi is now 37.8% under its June high; the fund 31.4% under its own — and still +54.7% for 2026. Taiwan’s fund fell 7.0% to 106.26, 10% under its October 5 record; the Taiex 4.5%. Japan: the Nikkei −5.4% to 65,324, the TOPIX only −1.0% — Tokyo sold its chip names, not its market. Indonesia’s fund fell 16.4% after MSCI warned it may treat the market as standalone; Jakarta fell 10.8% on Thursday alone, its worst day since 1998. China’s A-shares −3.9%, the large caps −1.2%, Hong Kong flat.
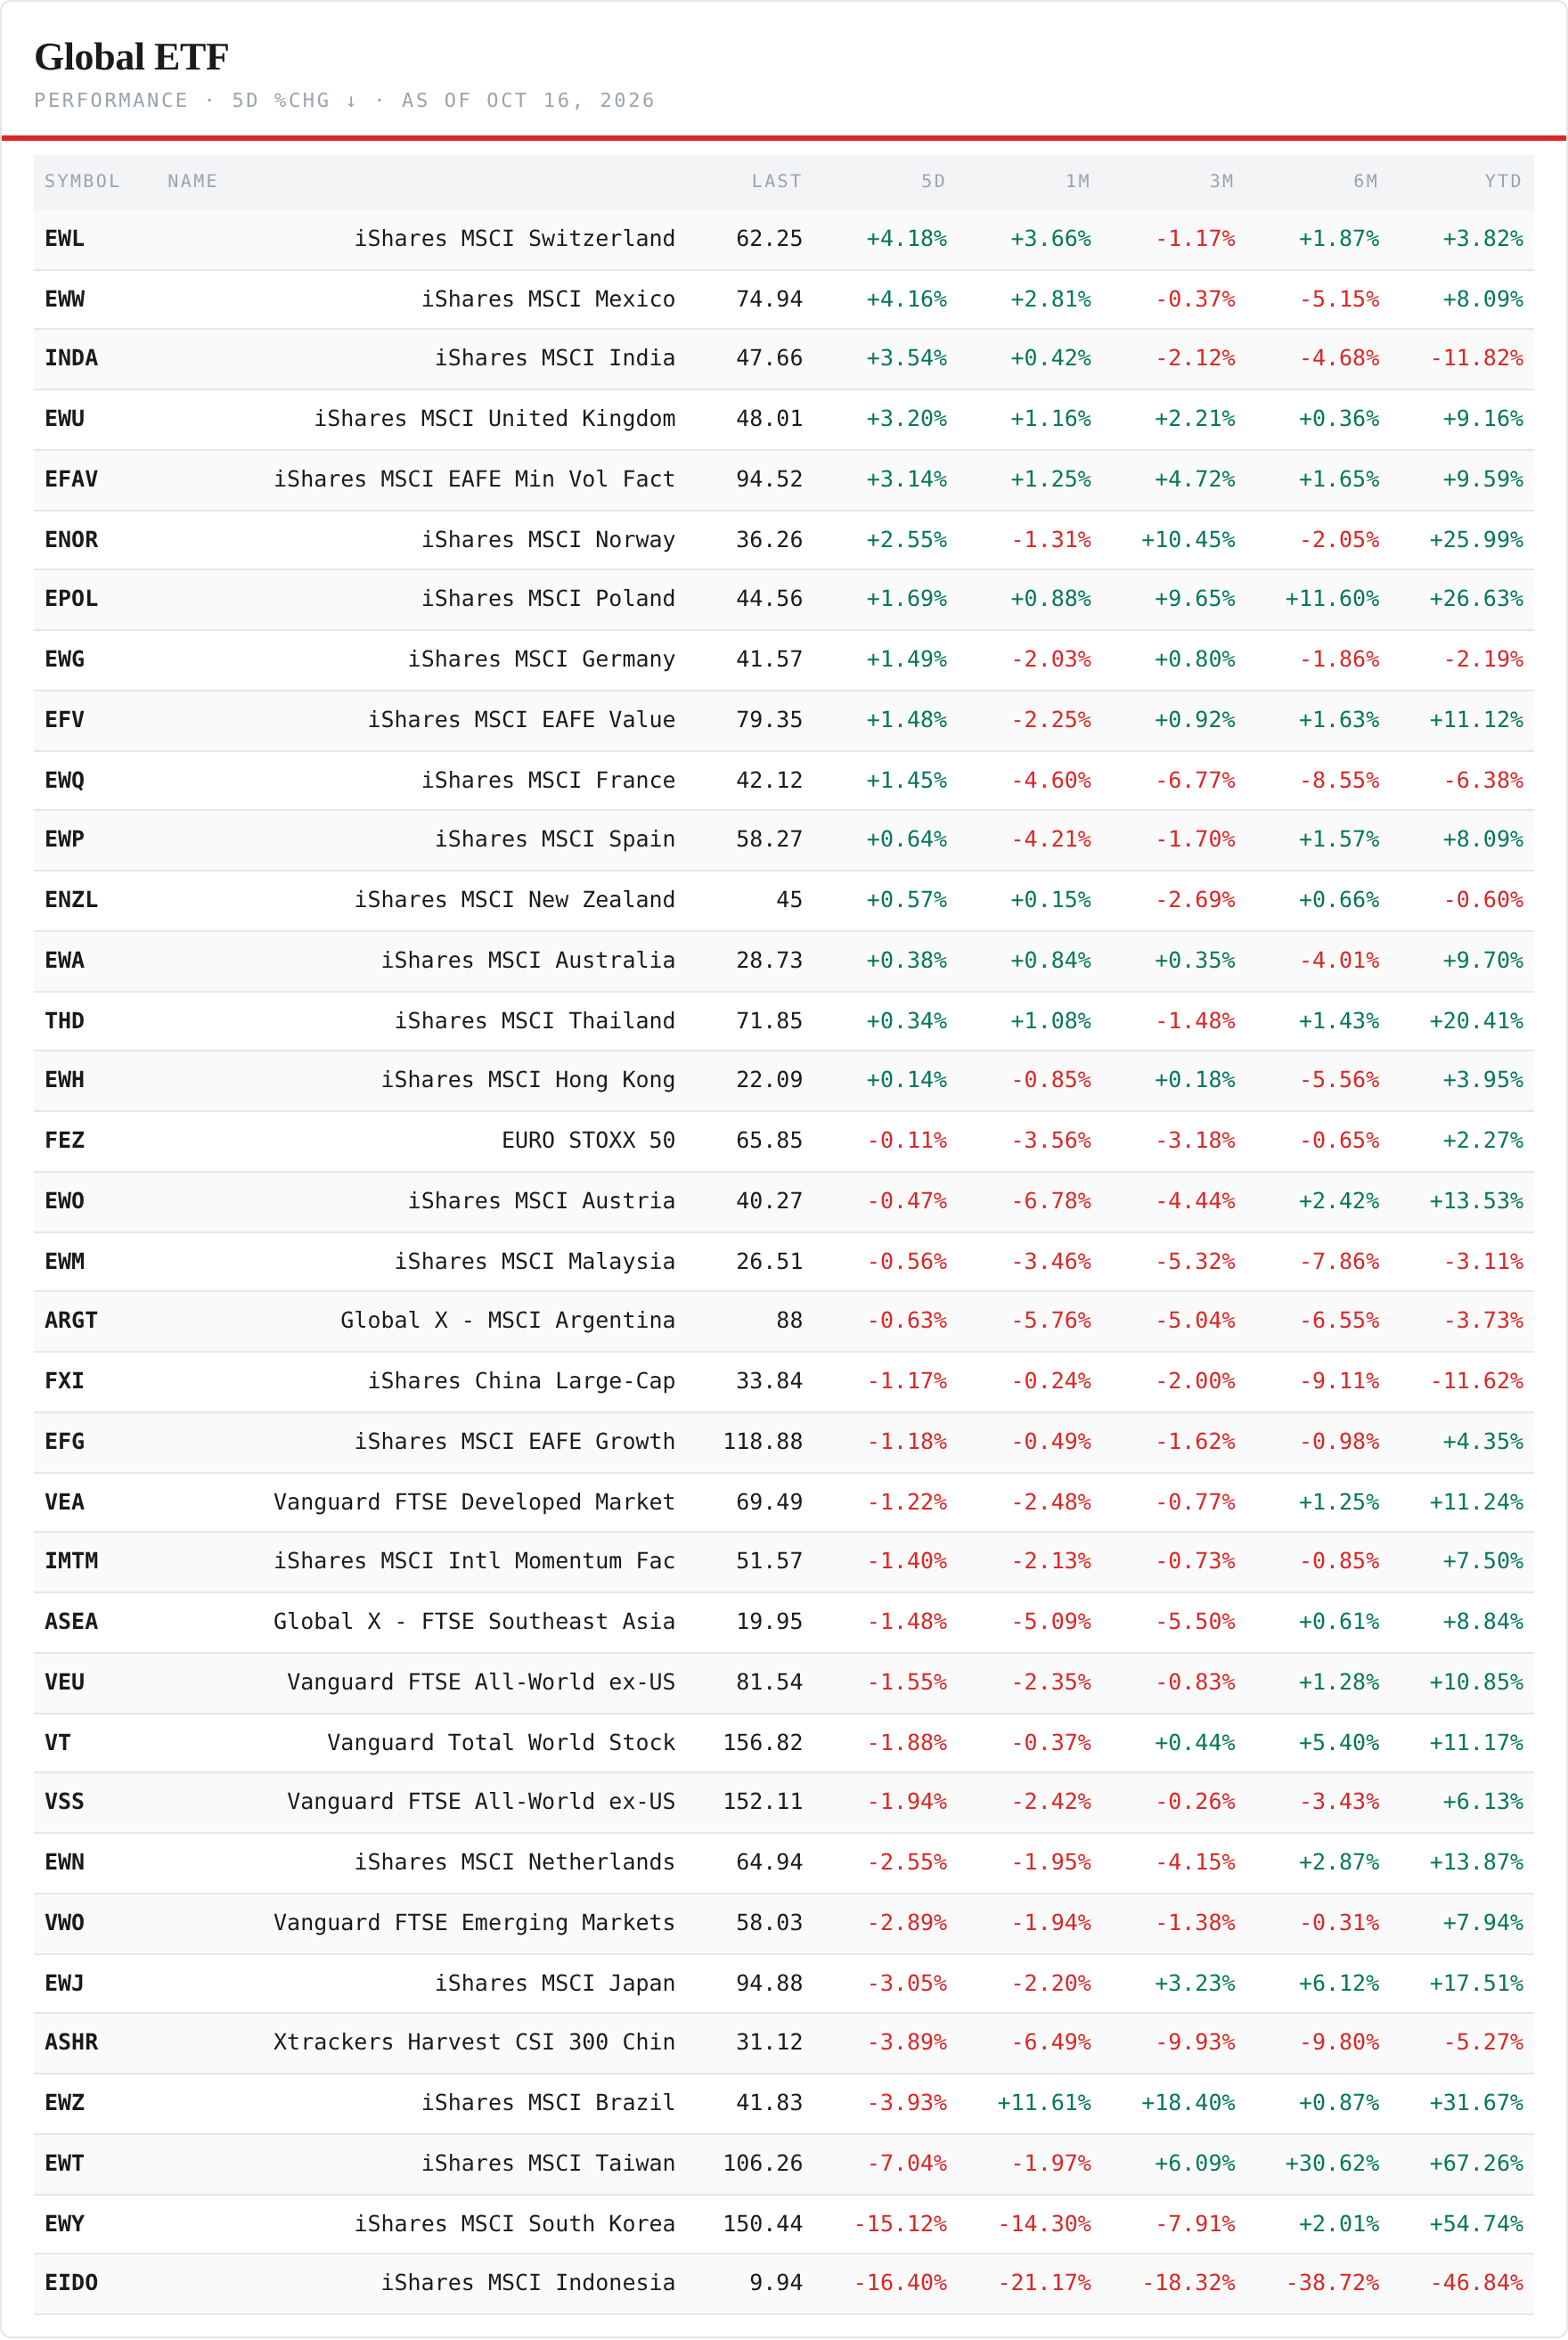
The regional board — fifteen green of thirty-five, and none of them in the chip corridor. The top: Switzerland +4.18%, Mexico +4.16%, India +3.54%, Britain +3.20%, EAFE min-vol +3.14%, Norway +2.55%, Poland +1.69%. The bottom: Indonesia −16.40%, Korea −15.12%, Taiwan −7.04%, Brazil −3.93%, China A-shares −3.89%, Japan −3.05%, emerging markets −2.89%. The best-to-worst spread was 20.6 points. Brazil gave back part of last week’s 14% ahead of its 25 October runoff.
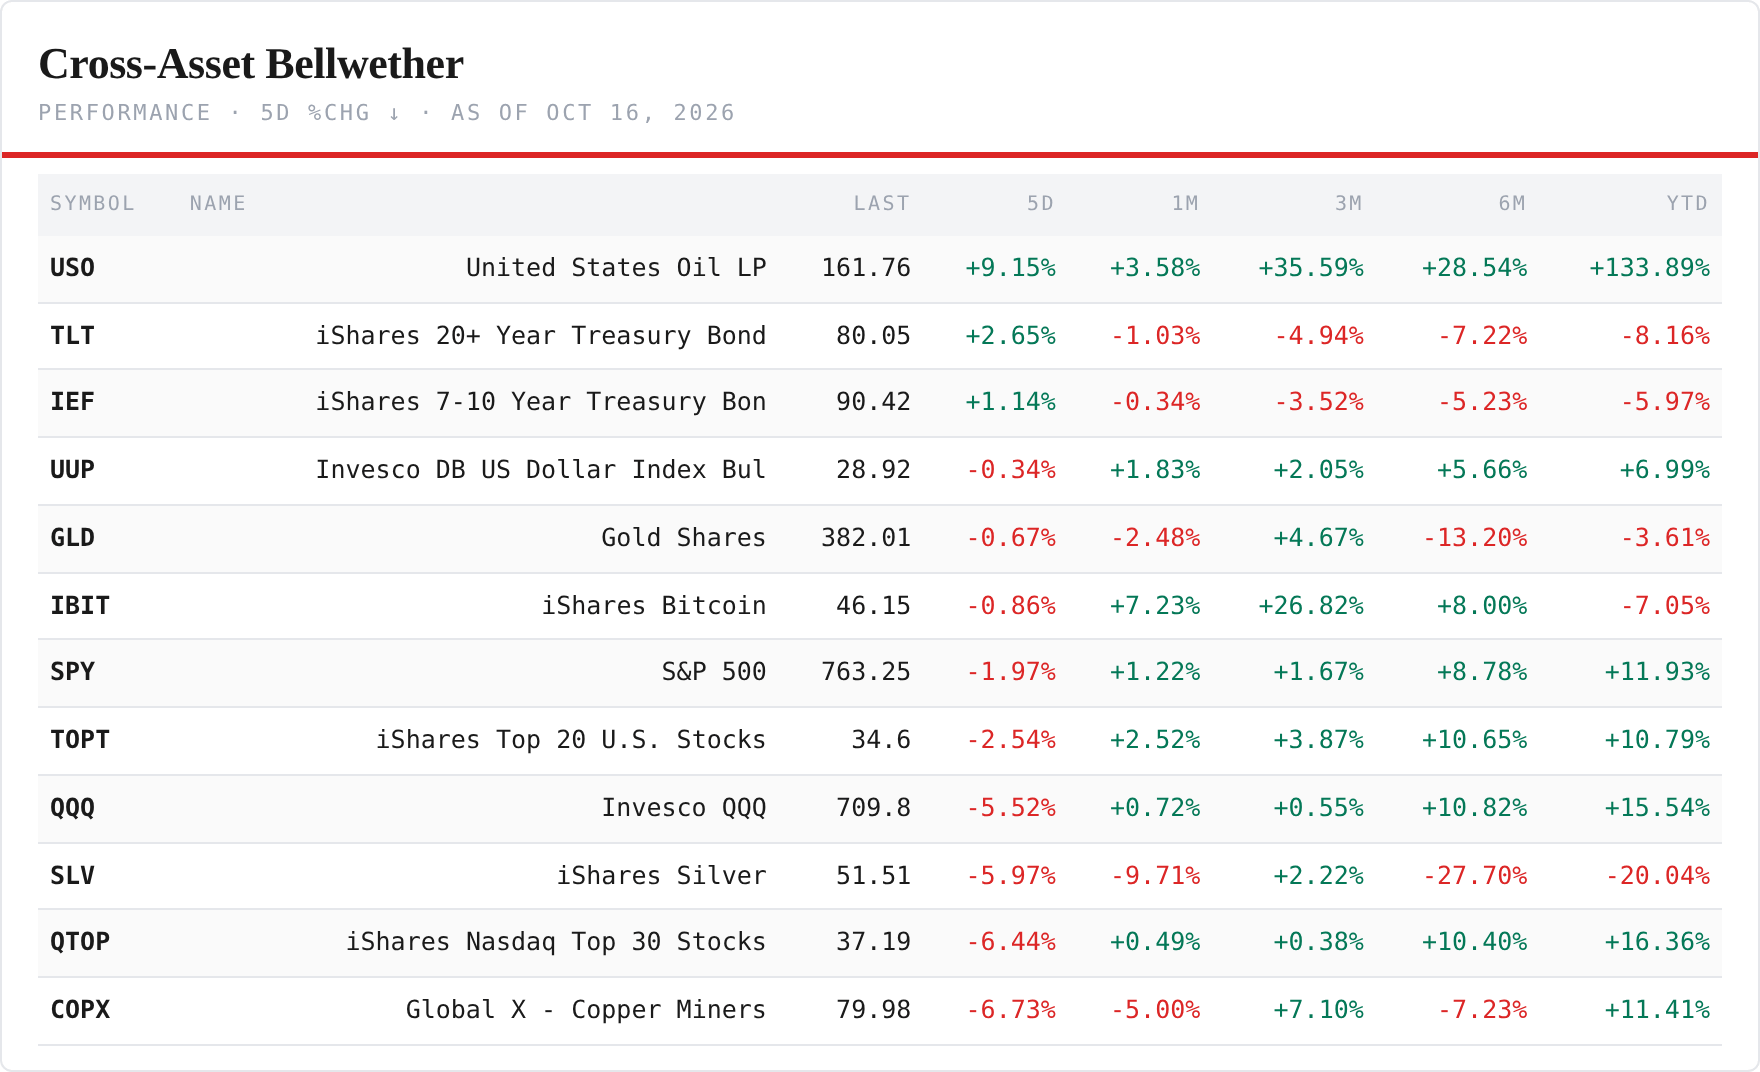
The cross-asset backdrop — oil up, the long bond up, the metals down. Three green of twelve: oil +9.15% to 161.76 — a dime under its September high close — the long bond +2.65% and the belly +1.14%. The red: copper miners −6.73%, the Nasdaq top-30 fund −6.44%, silver −5.97%, the Nasdaq 100 −5.52%, the US top-20 fund −2.54%, the S&P −1.97%, the bitcoin fund −0.86%, gold −0.67%, the dollar −0.34%. The volatility index closed at 19.99, up 35% on the week.
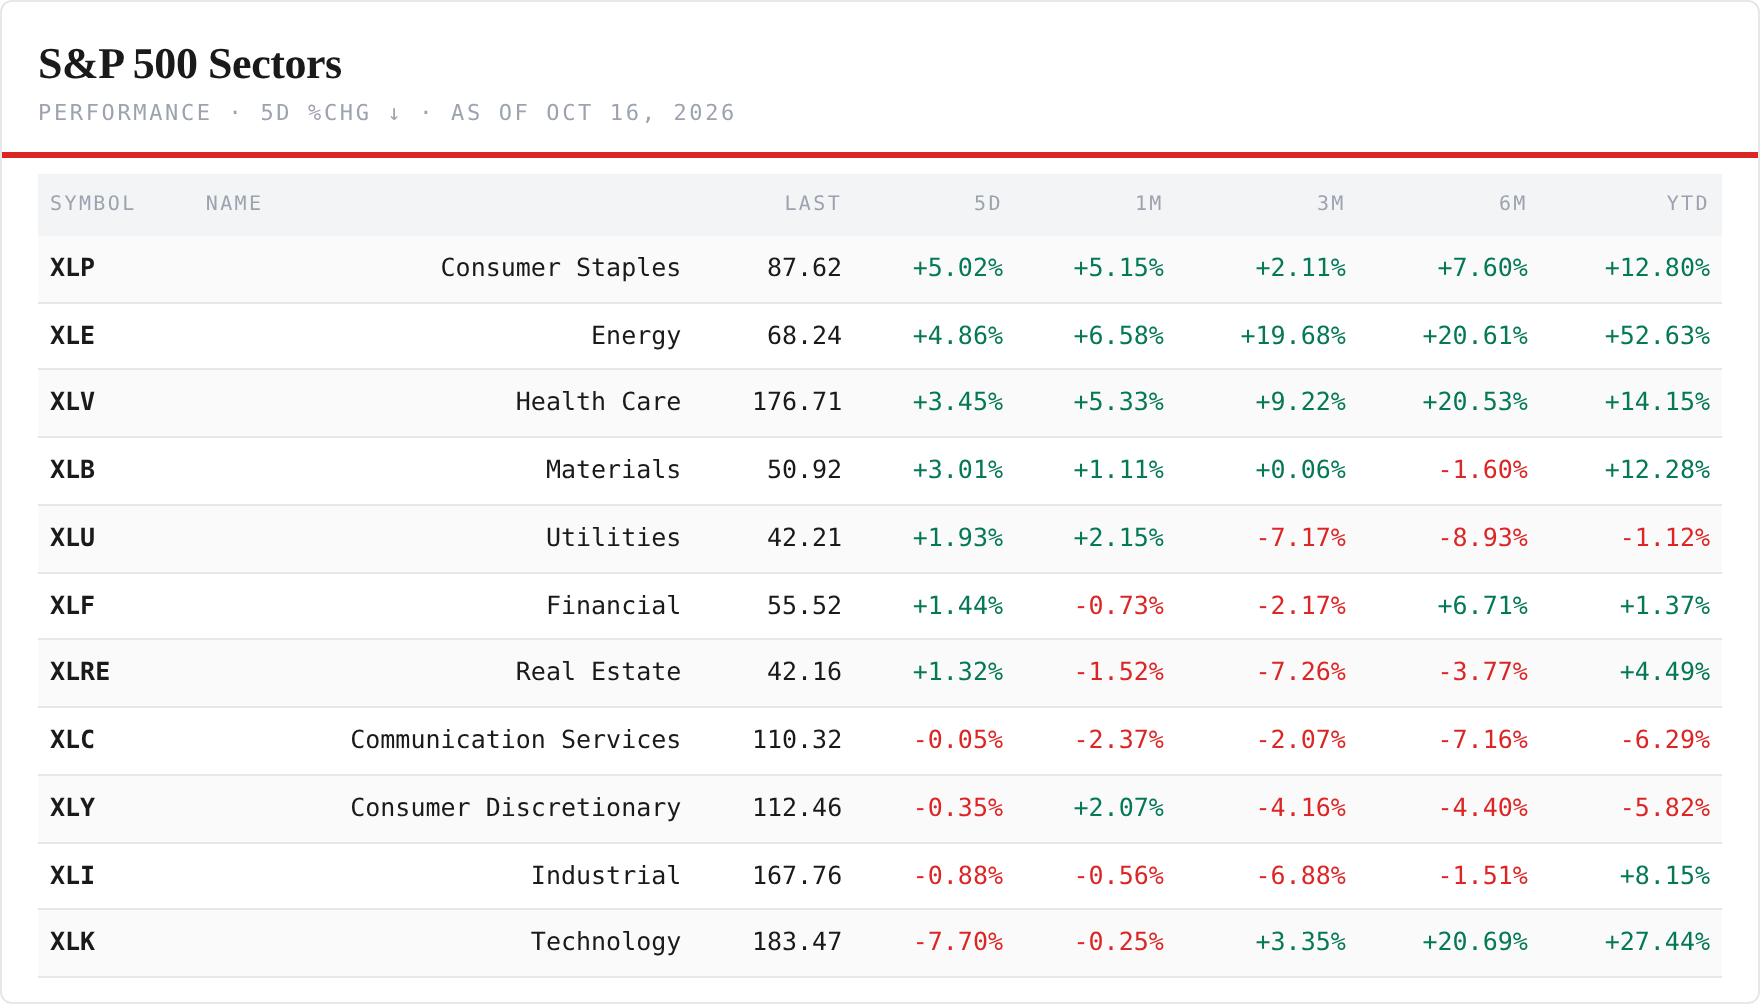
The US sectors — seven of eleven green, technology alone at the bottom. Staples +5.02%, energy +4.86% — at its highest close of the year — health care +3.45%, materials +3.01%, utilities +1.93%, financials +1.44%, real estate +1.32%. Red: communication −0.05%, discretionary −0.35%, industrials −0.88% and technology −7.70%. The equal-weight S&P rose 0.49% while the S&P fell 1.97% and the Nasdaq 100 5.52% — the average stock beat the index for a second week, this time by two and a half points.
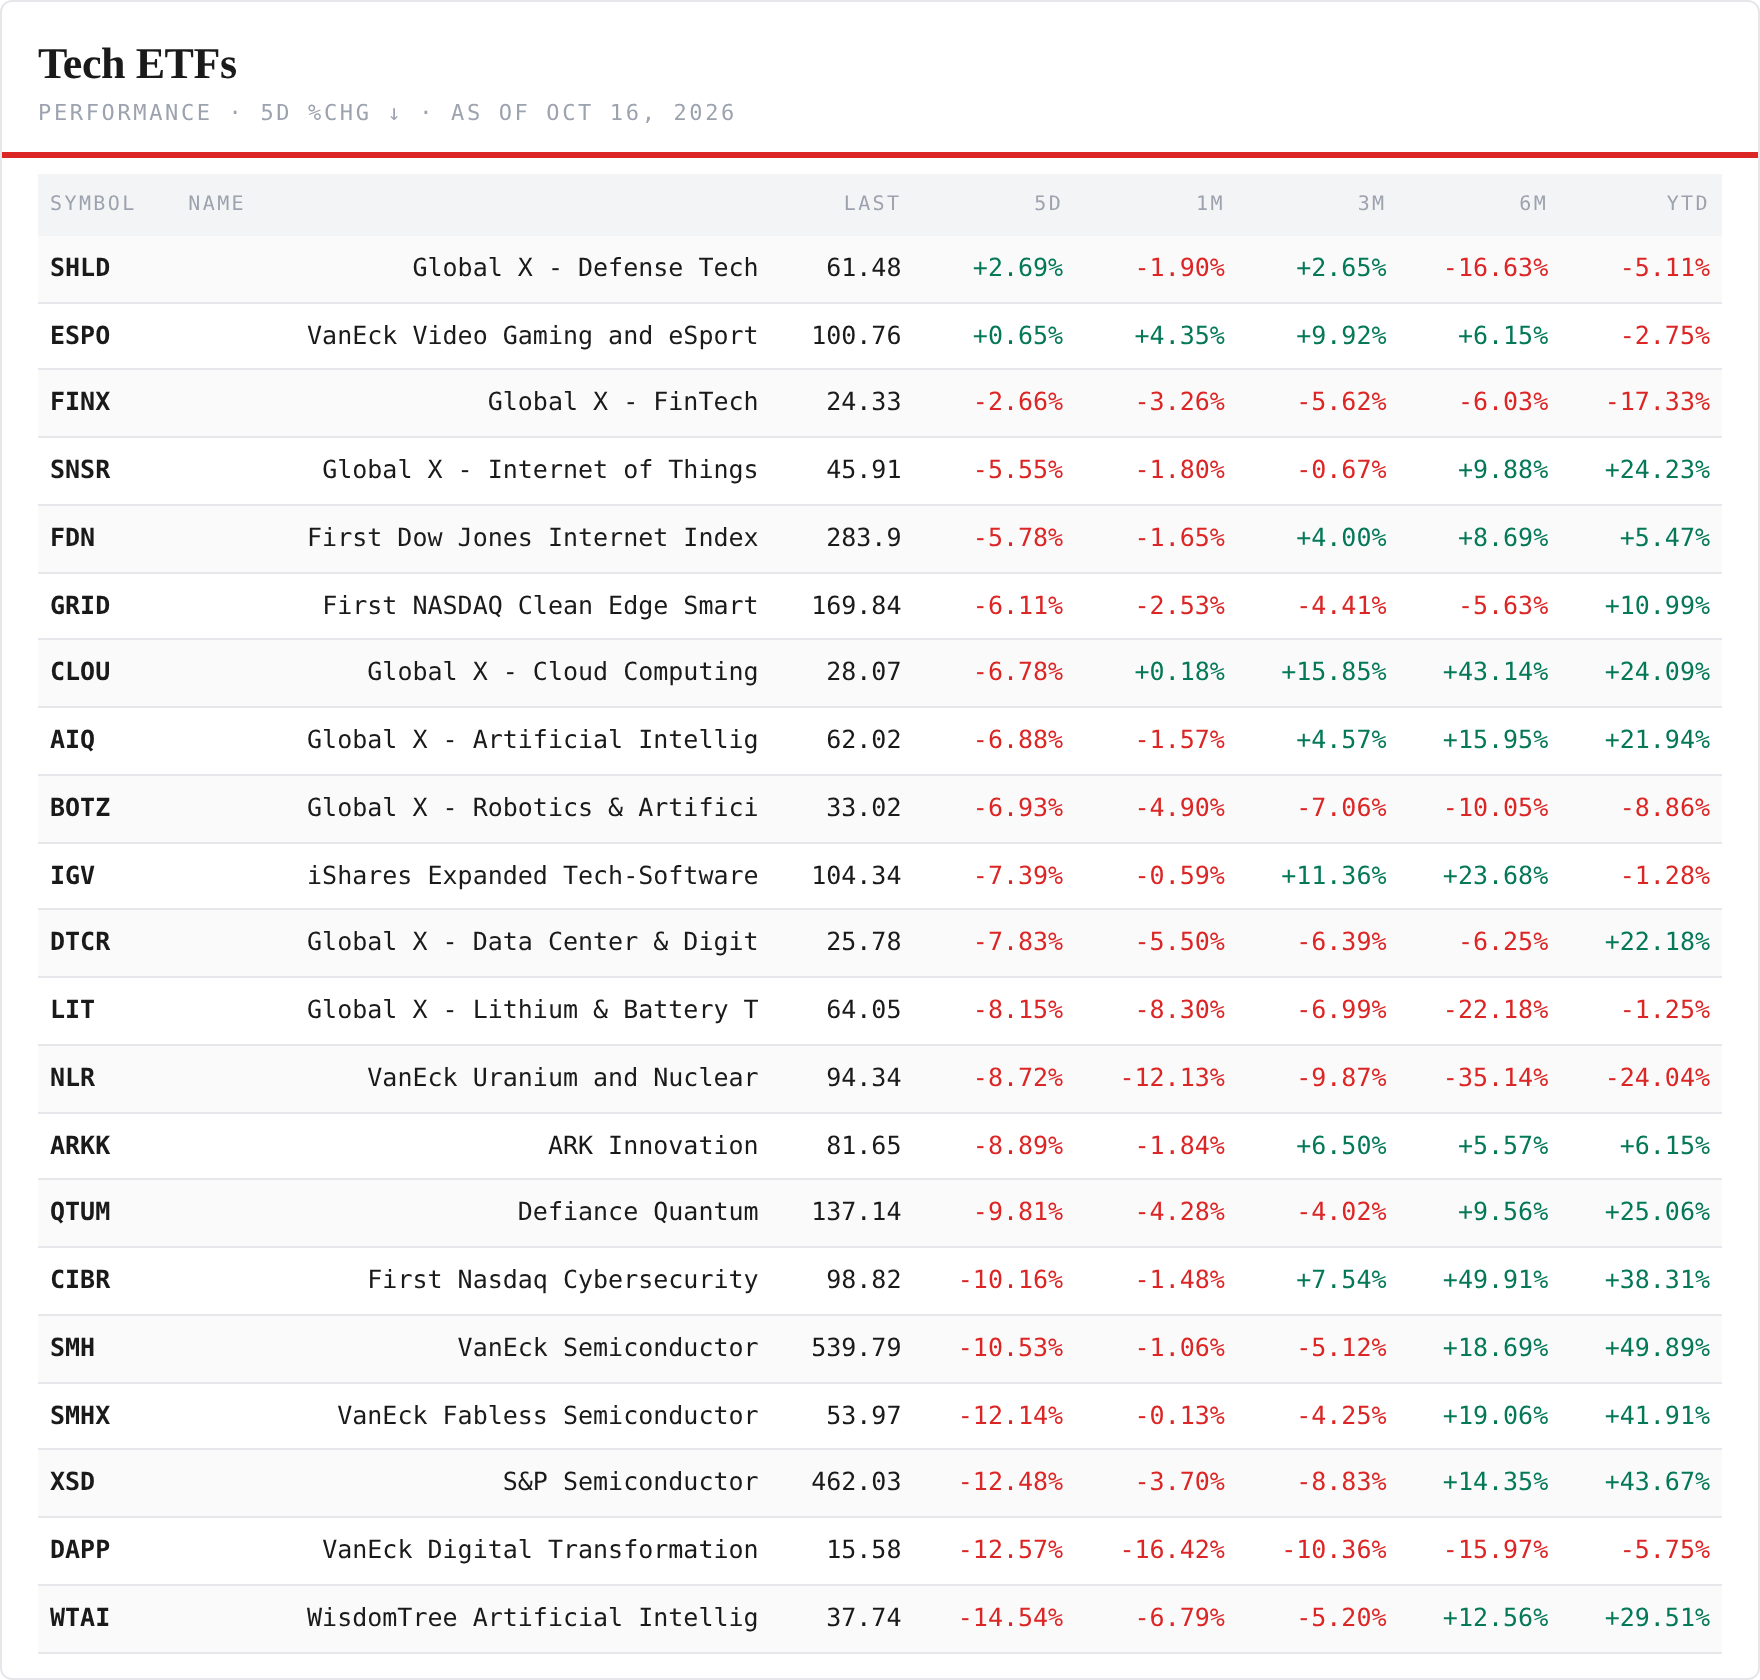
The tech ETFs — two of twenty-one green. The only green lines were defence technology +2.69% and gaming +0.65%. Everything else fell, software with silicon: WisdomTree AI −14.54%, digital transformation −12.57%, XSD −12.48%, the fabless fund −12.14%, SMH −10.53%, cybersecurity −10.16%, quantum −9.81%, IGV −7.39%, CLOU −6.78%. Last week software rose against the chips. This week it fell with them.
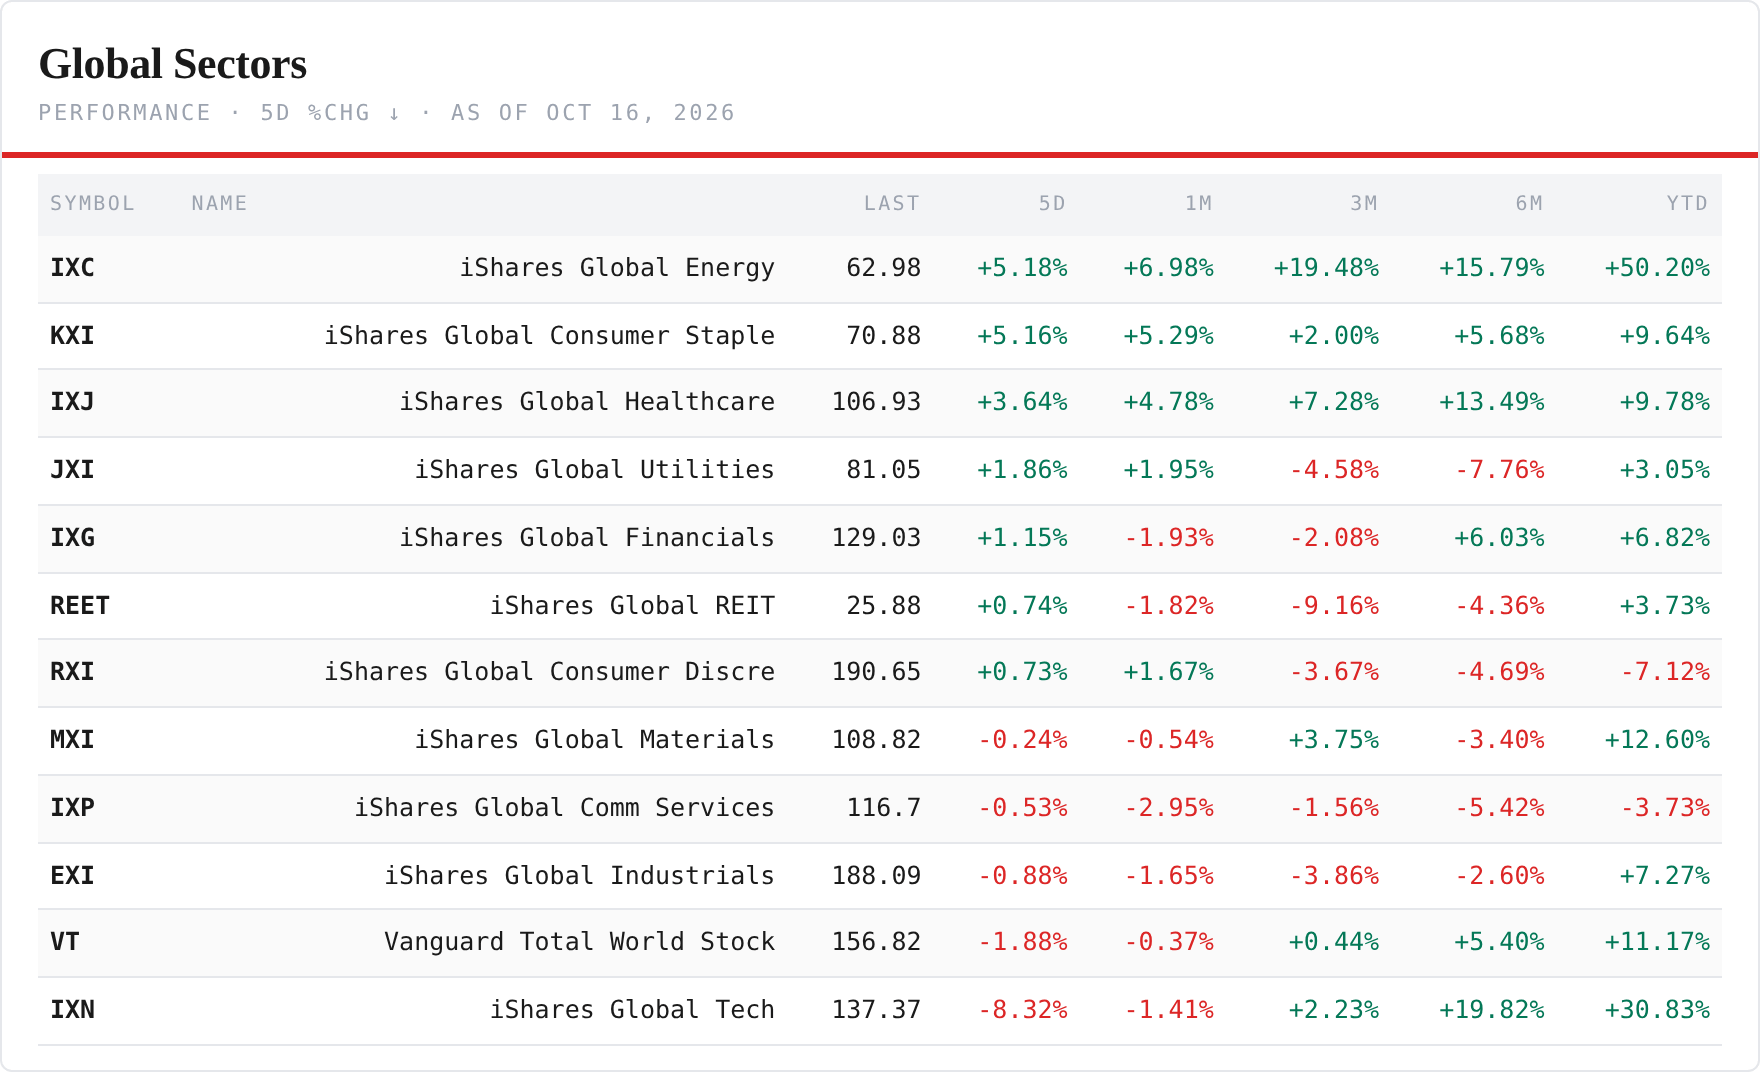
The global sectors — the defensives and energy led. Seven of eleven green: energy +5.18% (a record close of the year at 62.98), staples +5.16%, health care +3.64%, utilities +1.86%, financials +1.15%, real estate +0.74%, discretionary +0.73%. The red: technology −8.32%, industrials −0.88%, communication −0.53%, materials −0.24%. Global tech lost the 149.74 June high on Monday’s close and did not see it again.
Was the sector week global, or one region carrying it? Technology fell in America (−7.7%), emerging markets (−7.6%) and developed Asia (−2.5%) — and rose in Europe (+2.1%). Europe’s tech leg is mostly software and services; the emerging leg is Korea’s and Taiwan’s chips. The US-minus-Europe tech spread was −9.8 points, the widest in the matrix. Europe was green in all eleven sectors, America in seven, developed Asia in seven, emerging markets in none.
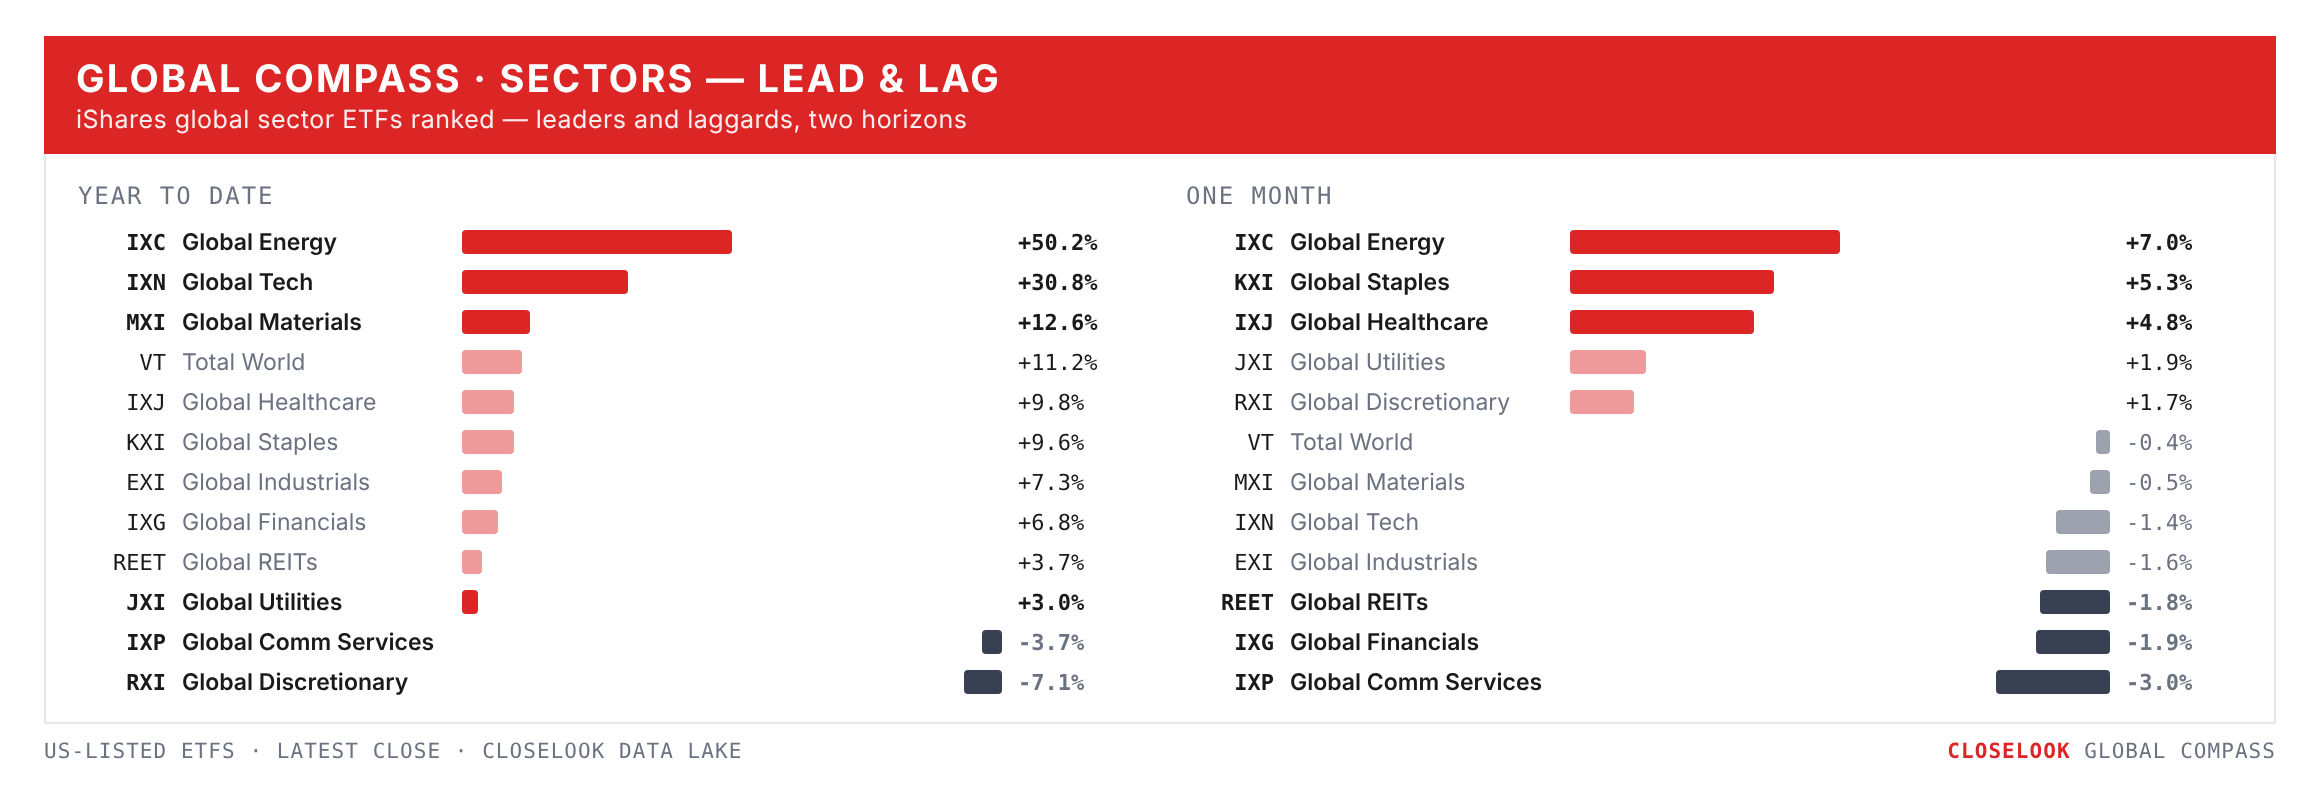
The Global Compass
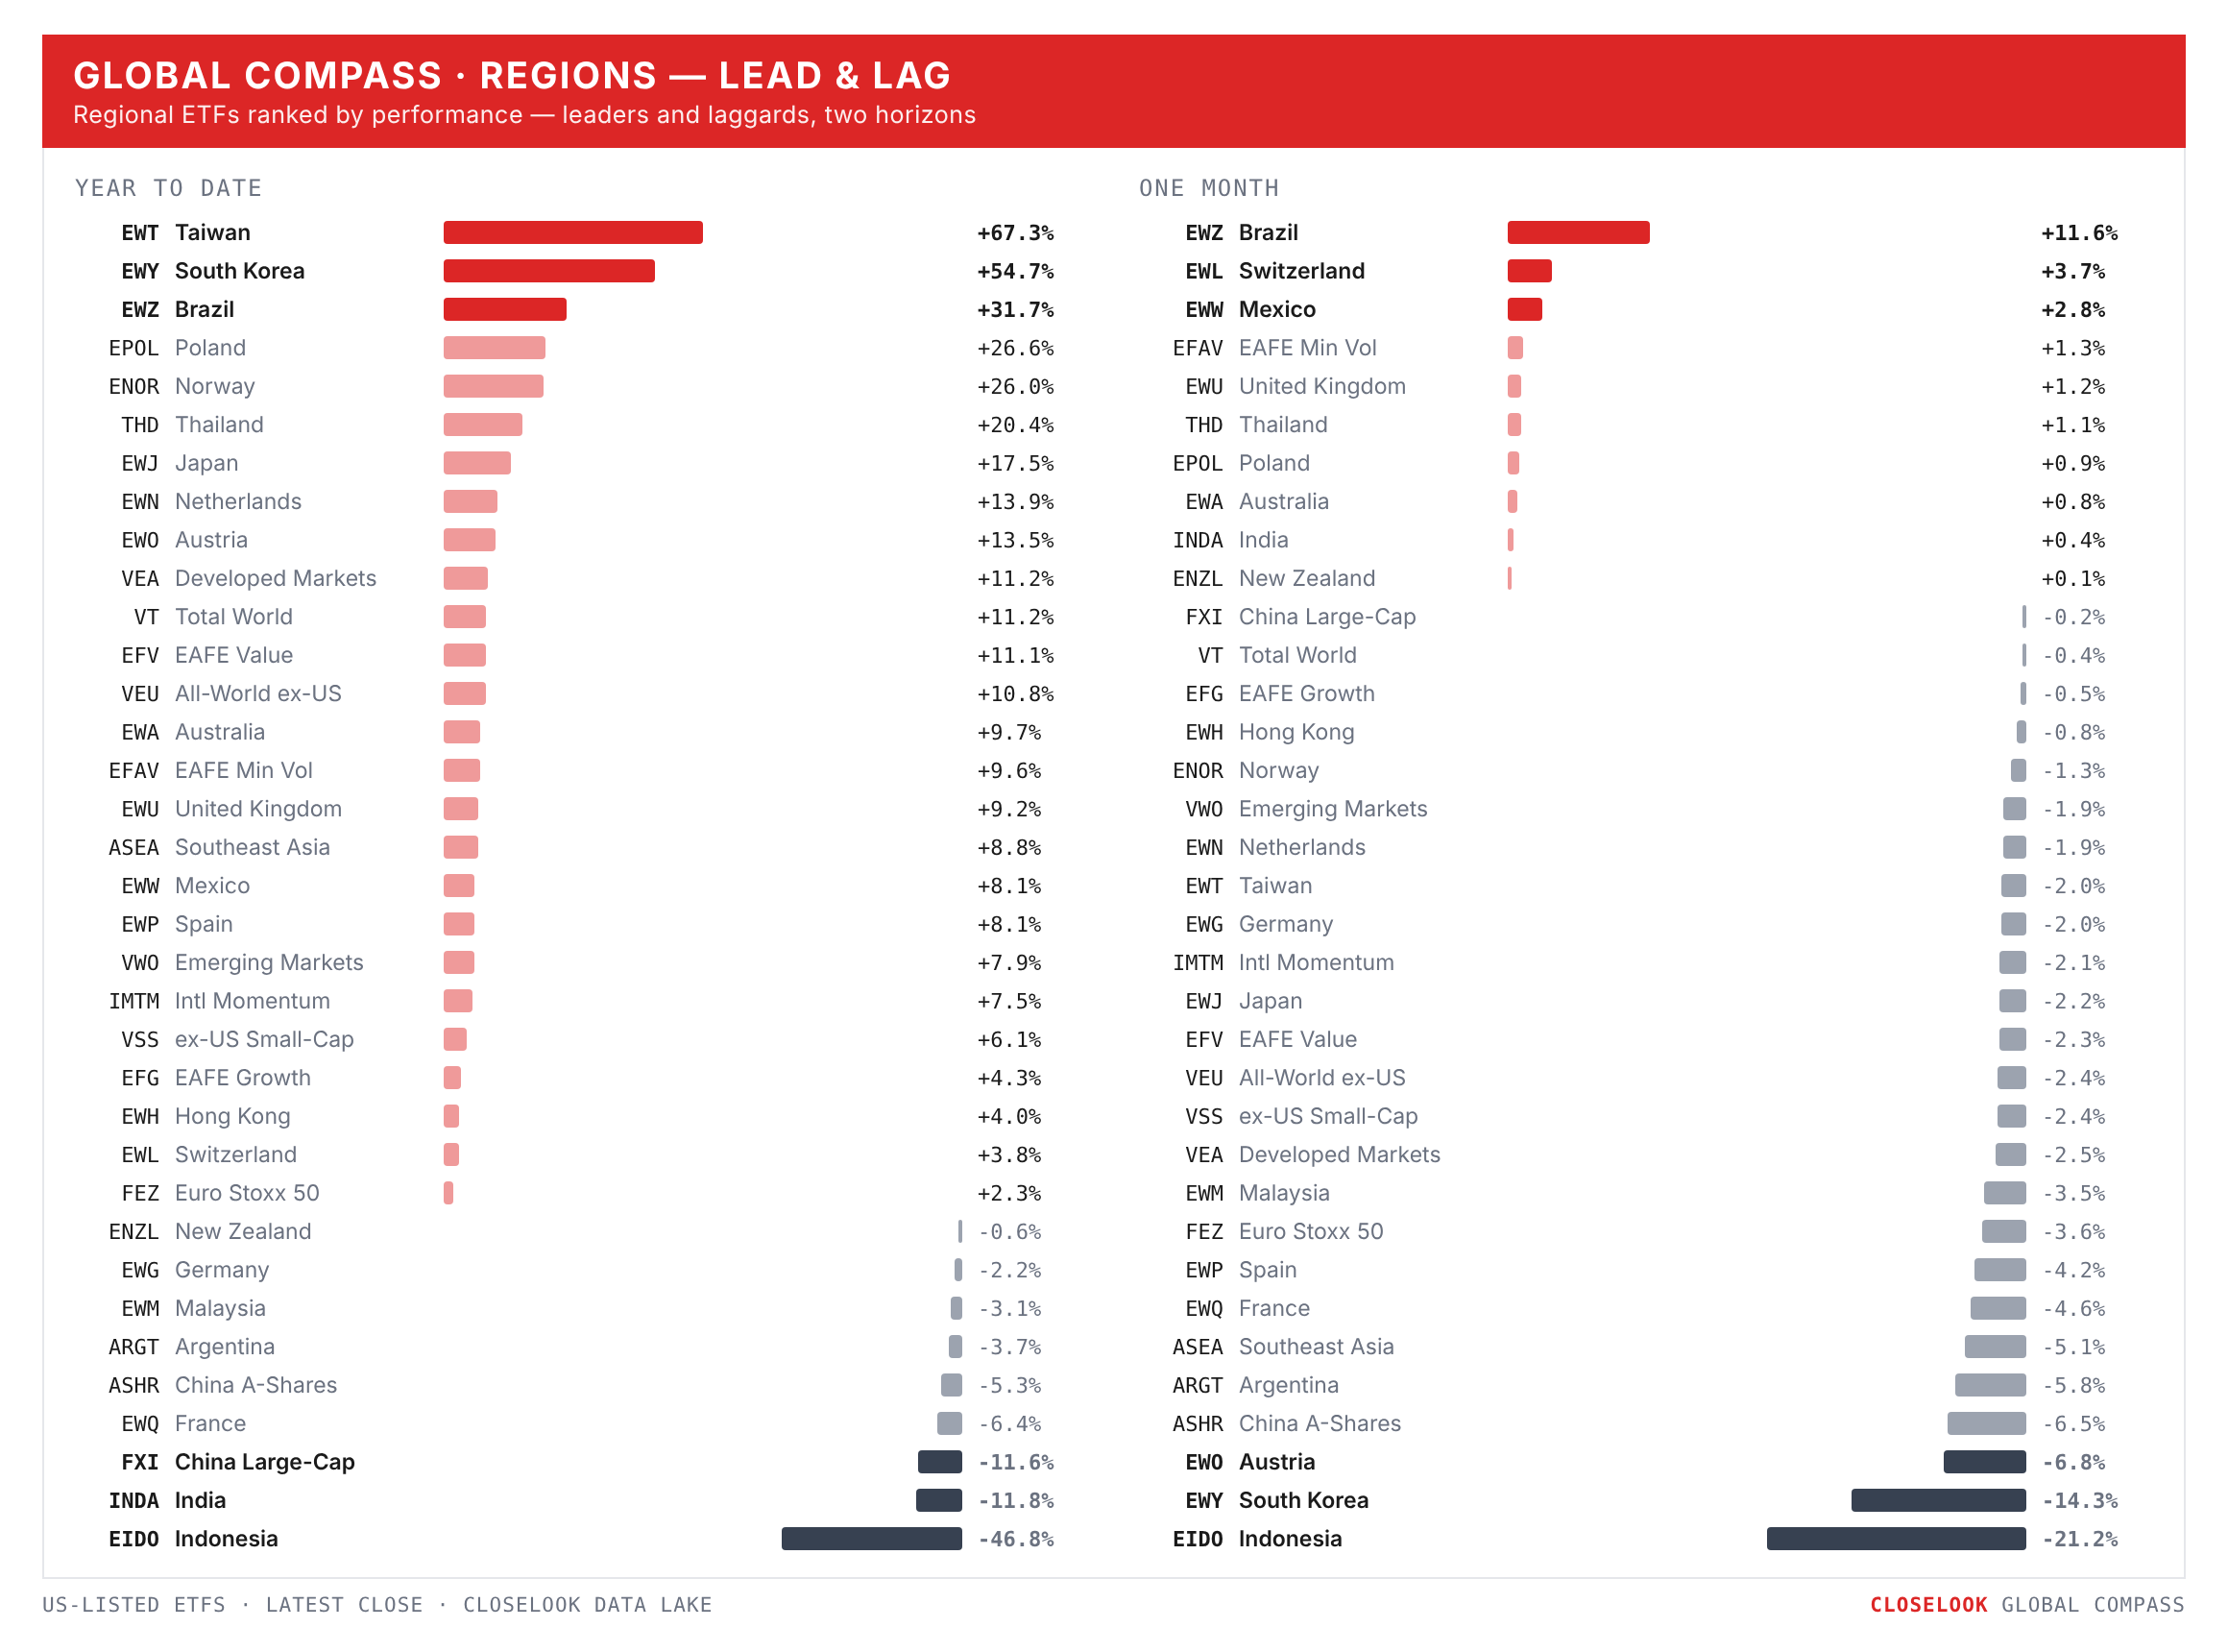
Regions: developed over emerging. VEA −1.22% against VWO −2.89% — the reverse of last week. The emerging basket carries Korea, Taiwan and India’s opposite week; the corridor won the argument by losing more.
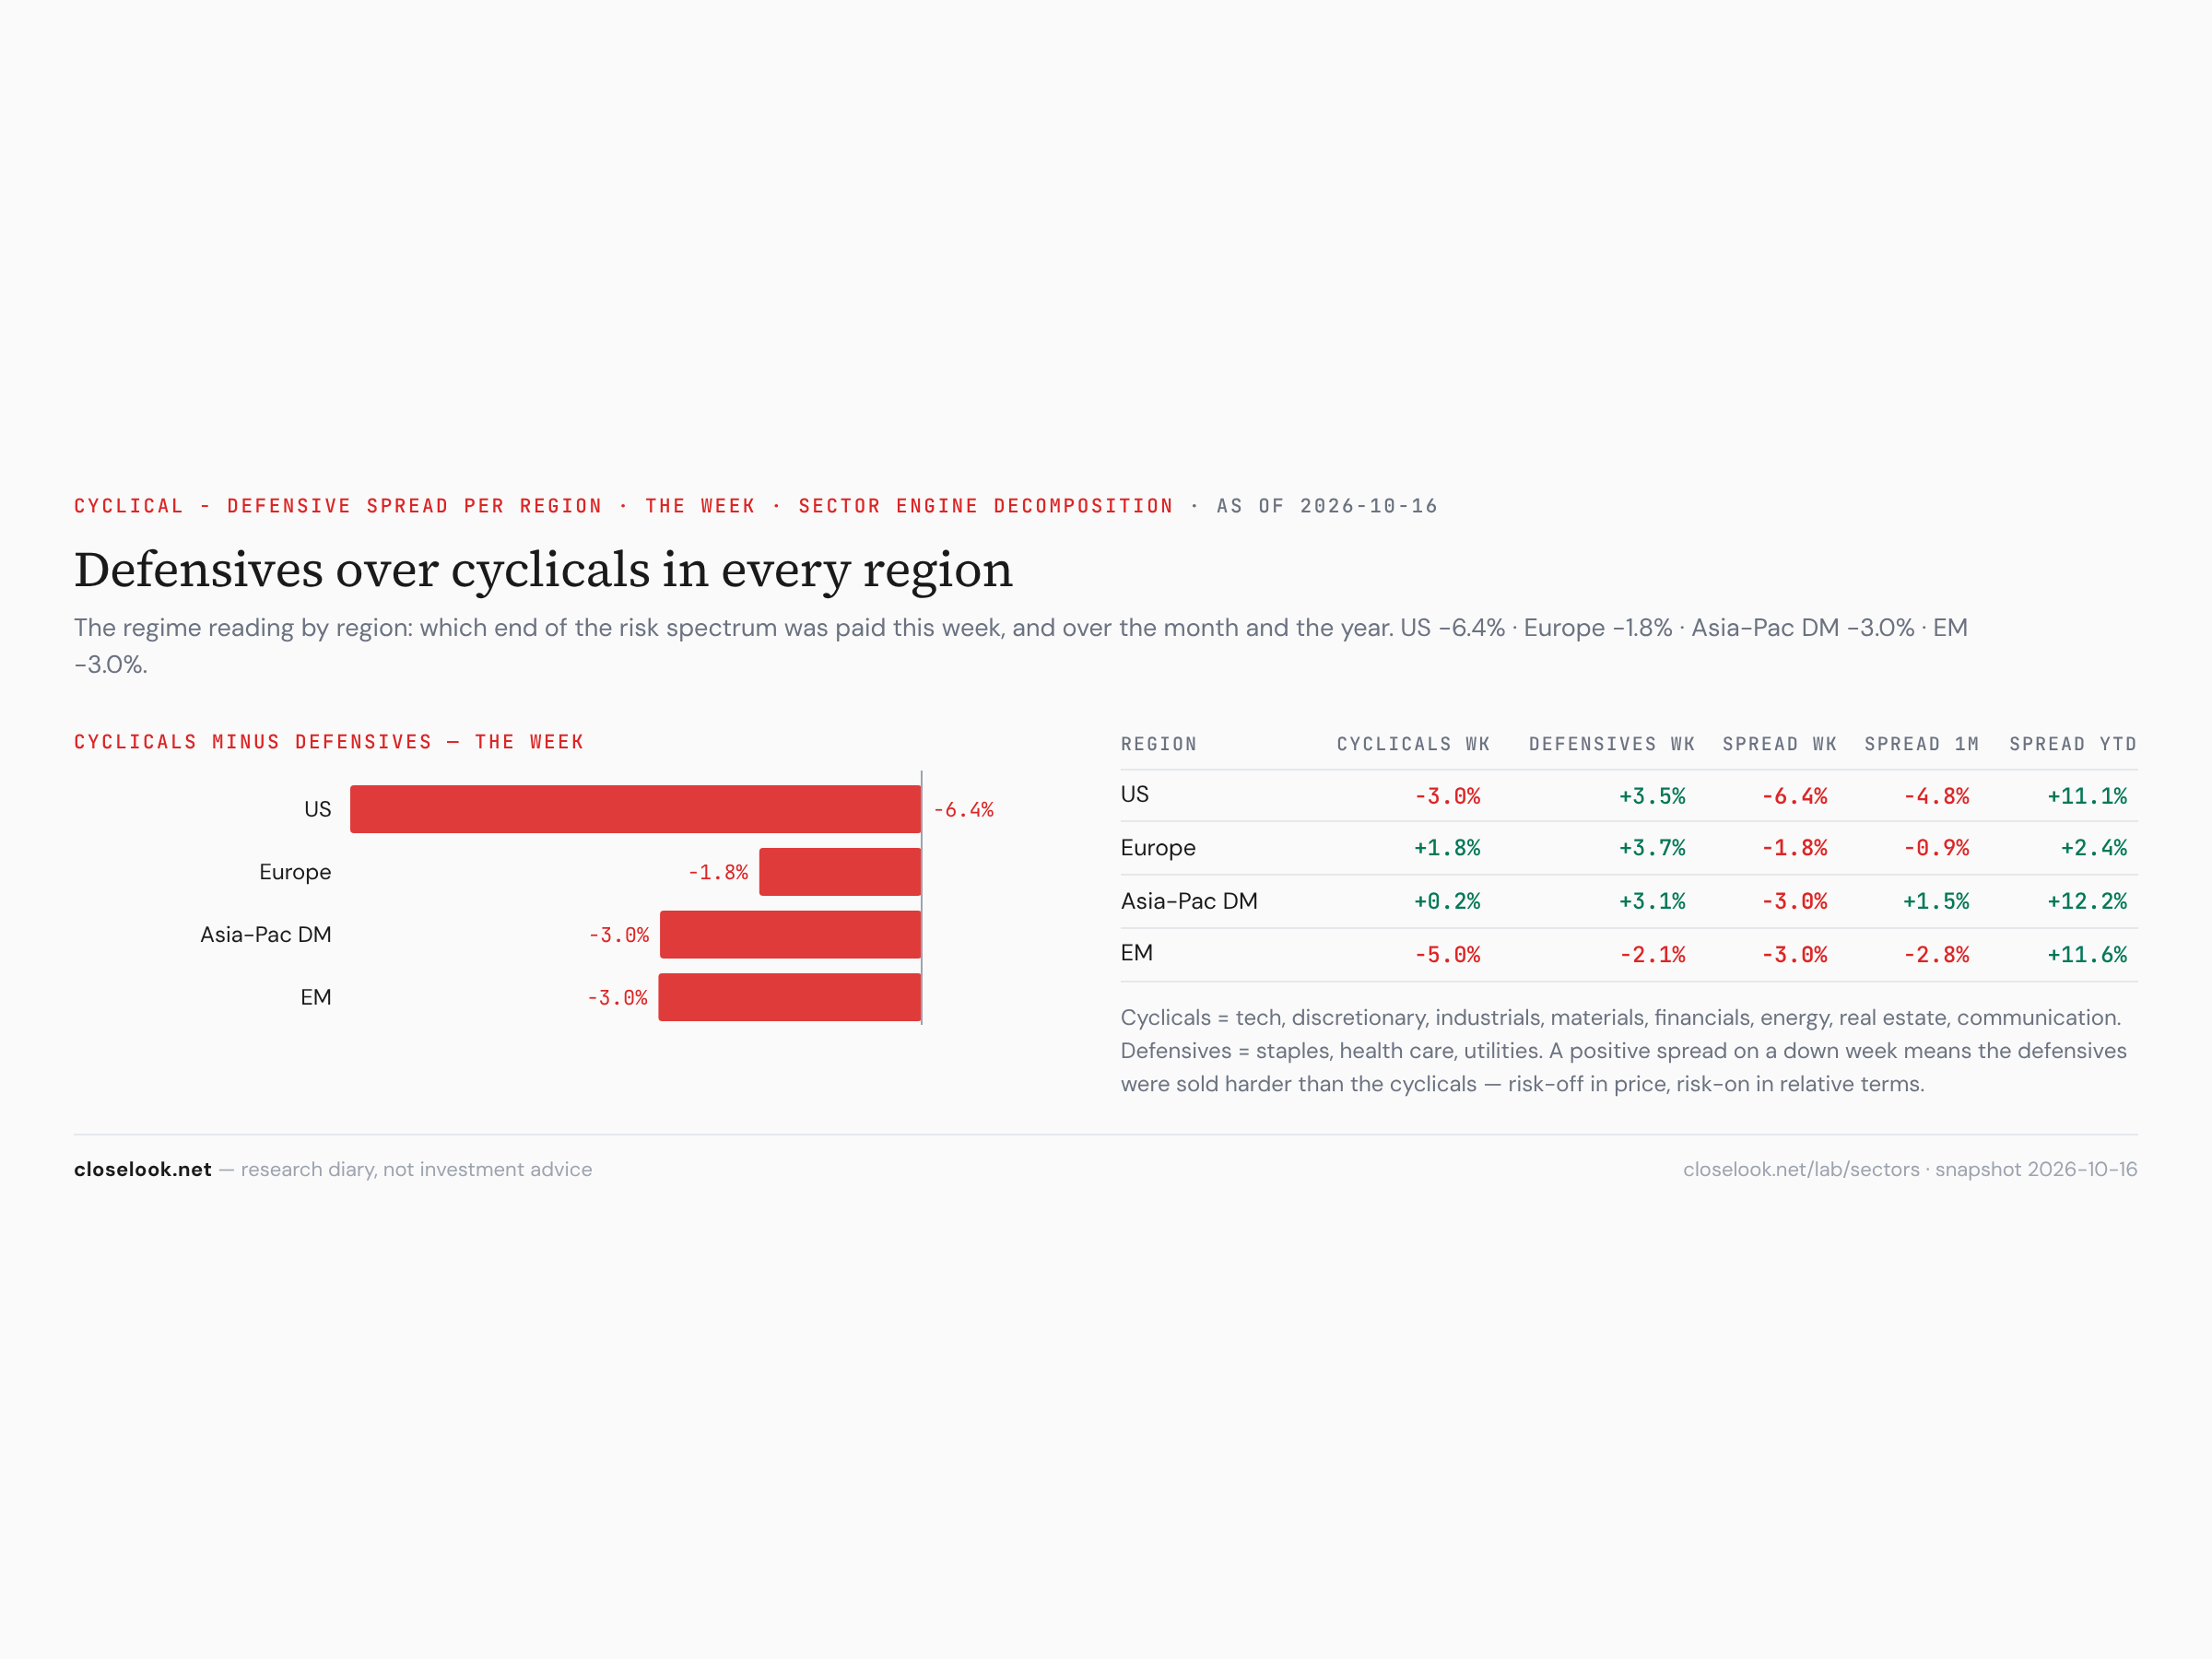
Sectors: defensives over cyclicals, in every region. The engine’s cyclical-minus-defensive spread was −6.4 points in the US (cyclicals −3.0%, defensives +3.5%), −3.0 in developed Asia, −3.0 in emerging markets and −1.8 in Europe. On the year the US spread is still +11.1 points; on the month it has turned to −4.8. Two weeks of defensives in a row is a pattern worth writing down.
Sectors: the leaders’ bench. Technology 137.37, 10.2% under its record. Industrials 188.09, 9.1% under August. Financials 129.03, 5.8% under the September 3 record, a sixth week under the 134.55 line. Materials 108.82, an eighth week under the February line.
Stay home vs go global — the US view. America lost the week but kept the year: SPY −1.97%, VT −1.88%, VEU −1.55% — the first week in six in which the world ex-US beat America. On the year: +11.9% against +11.2% against +10.9%.
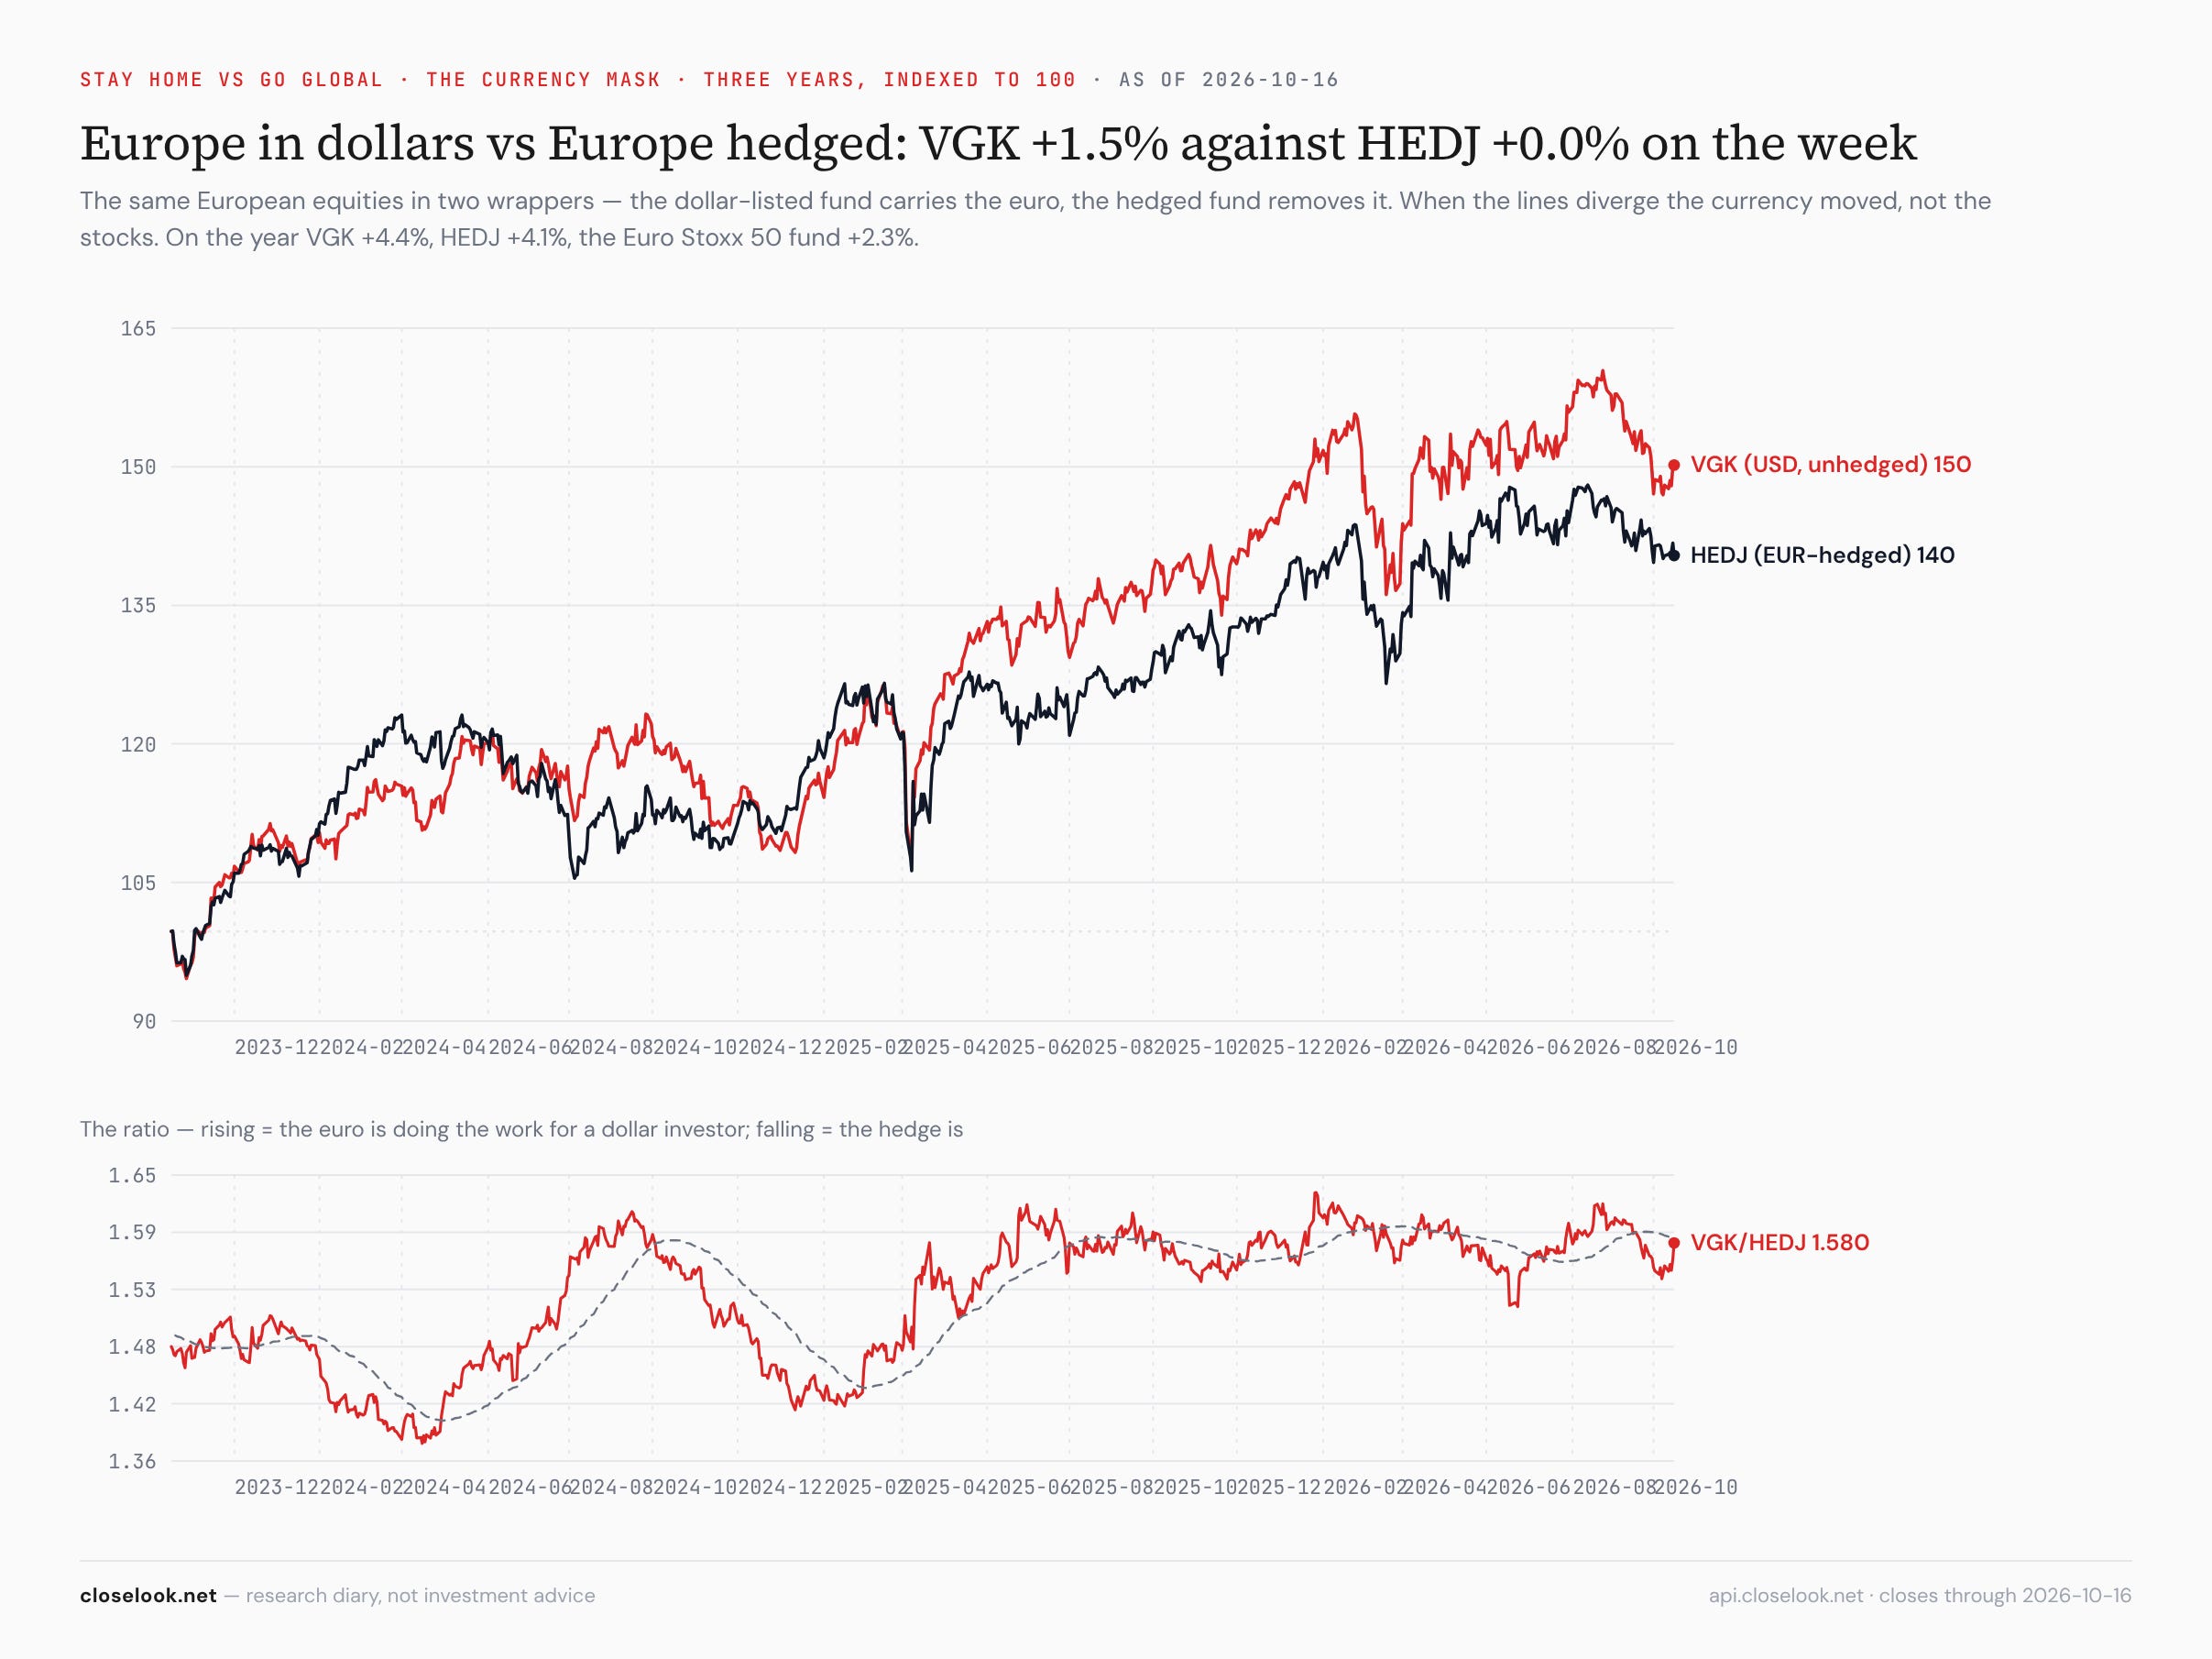
Stay home vs go global — the Europe view: everyone up. In local terms: the STOXX 600 +2.09% to 644.74, the DAX +2.13% to 25,623, the CAC +1.97% to 7,957, the IBEX +1.54%, the Euro Stoxx 50 +0.50% — and outside the euro the FTSE 100 +3.13% to 10,882, 0.3% under its February high close, and Switzerland’s SMI +4.29%. The dollar-listed Europe fund rose 1.46%, the euro-hedged one 0.02% — the hedged fund holds the euro area’s exporters, chip equipment among them; the unhedged one also holds Britain and Switzerland, which led. The French fund made its lowest close in a year on Monday, 41.24, and ended at 42.12. The euro made a new low of the year on Monday too, 1.1160, and closed the week at 1.1236.
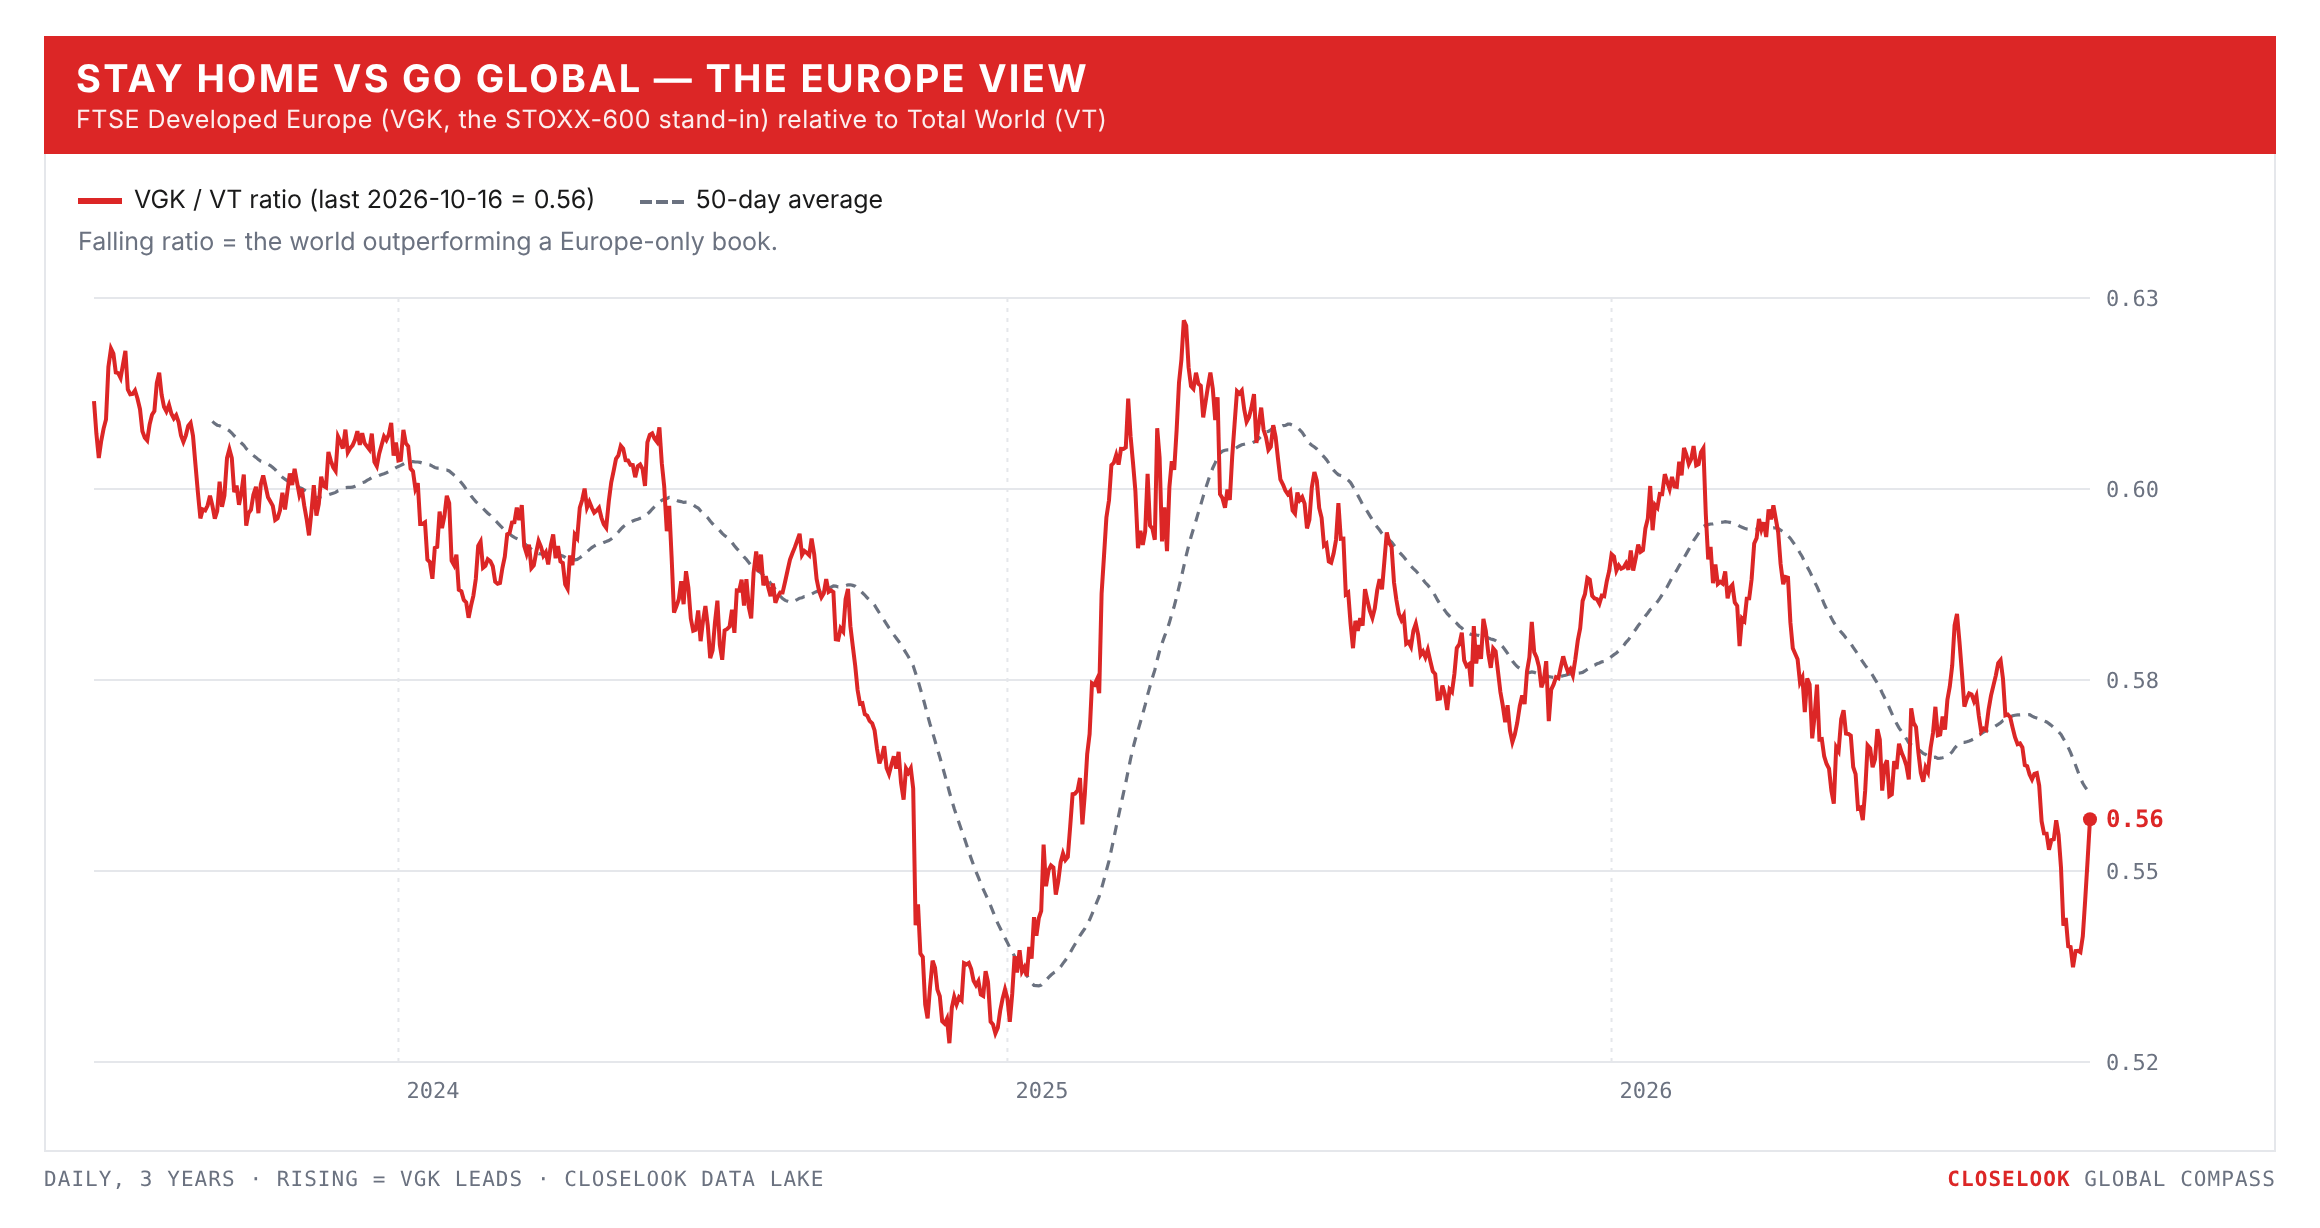
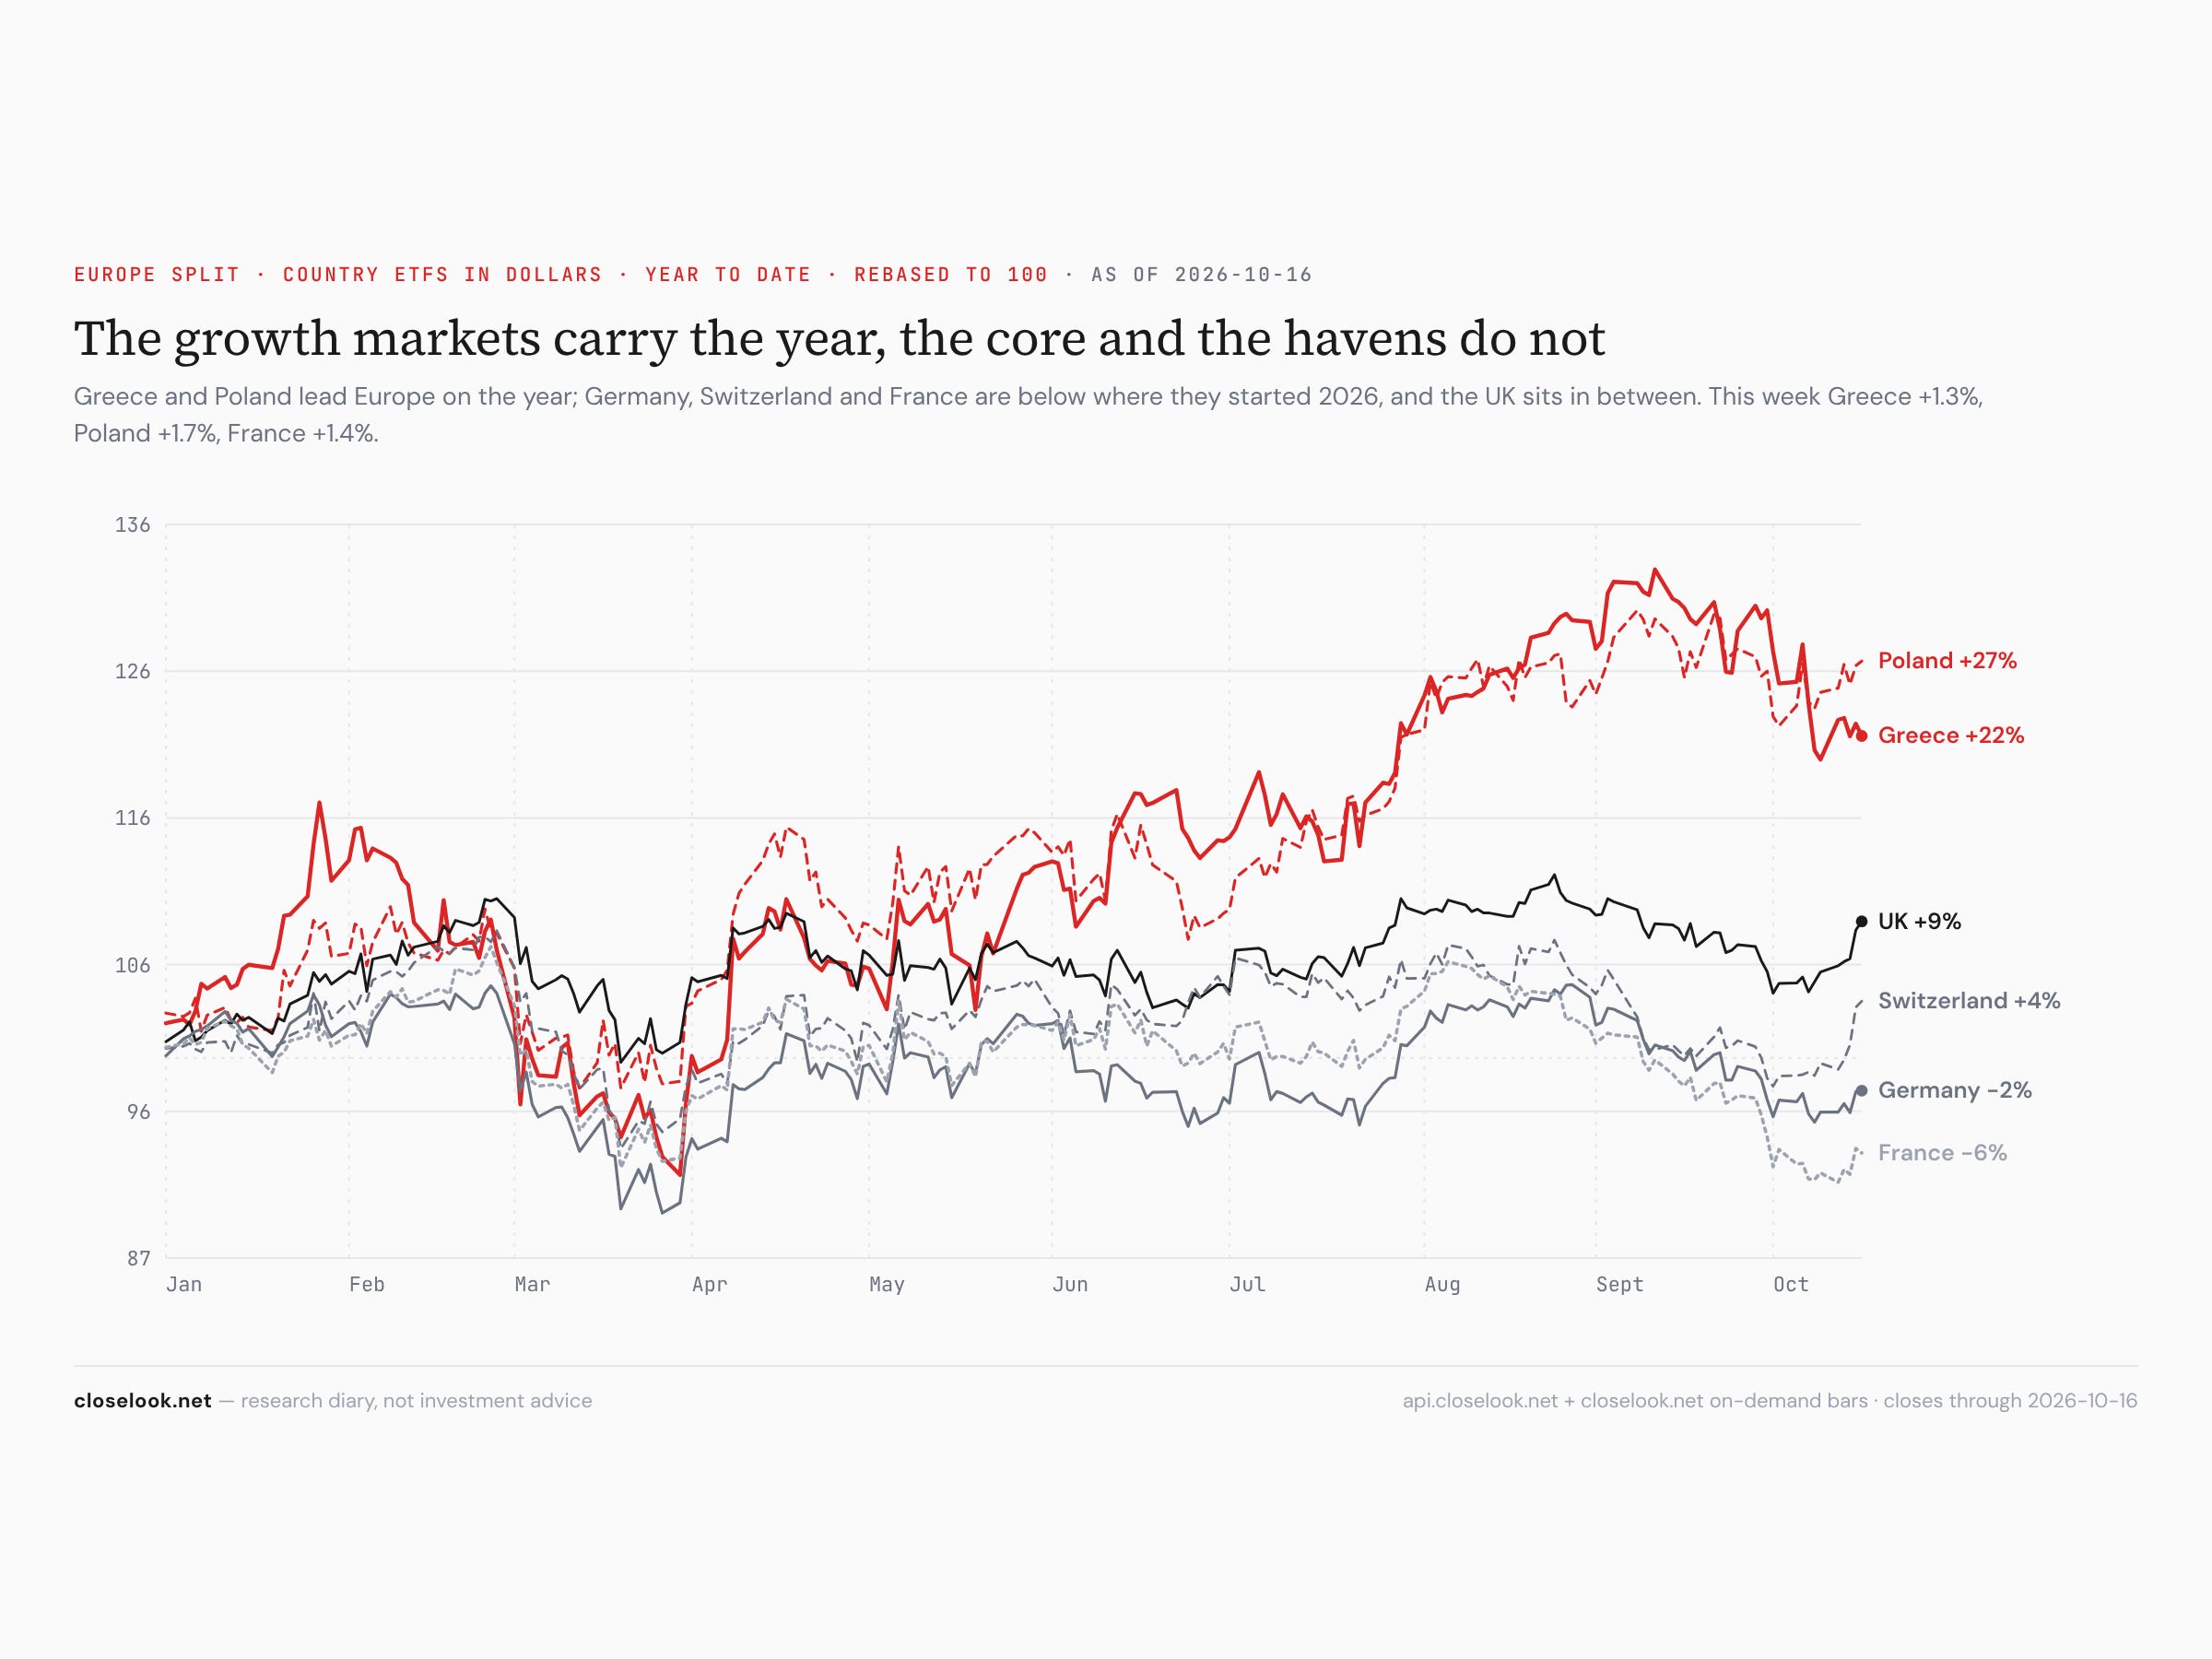
Europe split — the defensive markets led. Switzerland +4.2%, Britain +3.2%, Norway +2.6%, Poland +1.7%, Germany +1.5%, France +1.5% — against the Netherlands −2.6% and Austria −0.5%. The Netherlands is Europe’s chip-equipment market, and it fell with the chips. Switzerland and Britain are heavy in pharma, food and consumer staples — this week’s winning sectors, in index form.
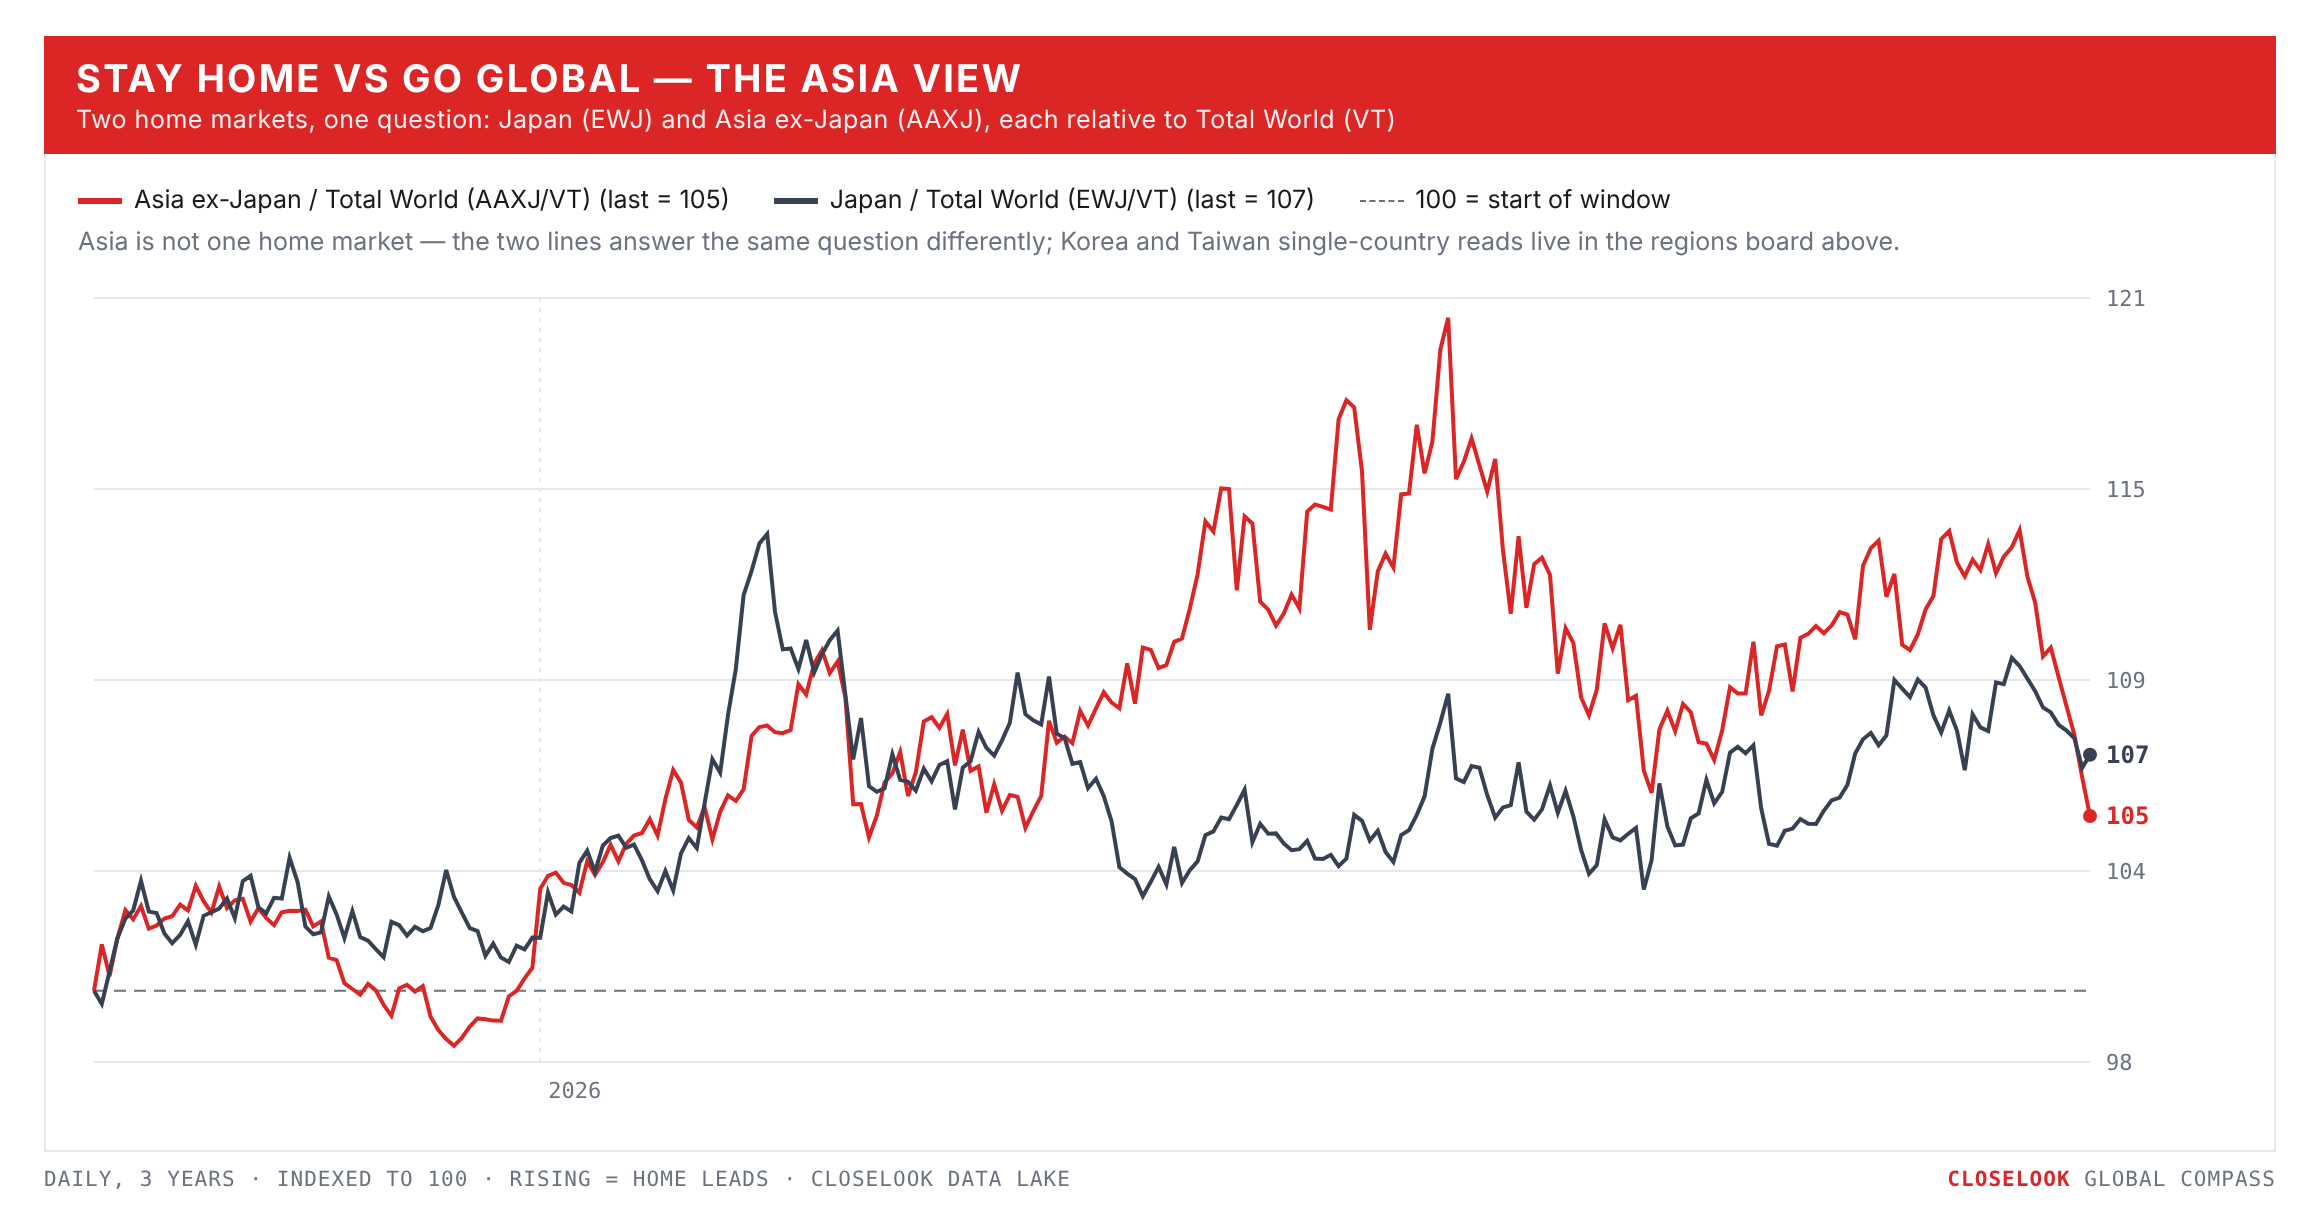
Stay home vs go global — the Asia view: the corridor broke, India rose. Korea: EWY −15.12%; the Kospi −14.5%, with a trading halt on Thursday. Taiwan: EWT −7.04%; the Taiex −4.5% to 47,111, 5.4% under its October 6 record. Japan: the Nikkei −5.4%, the TOPIX −1.0%, the dollar fund −3.05% with the yen at 157.99. India: the Sensex +3.1% to 74,729, up from the low of the year it made on 8 October; the Nifty +2.8%; the dollar fund +3.54%. Australia +1.0%. India, the market that trailed all year because it owns almost no AI hardware, rose for the same reason this week.
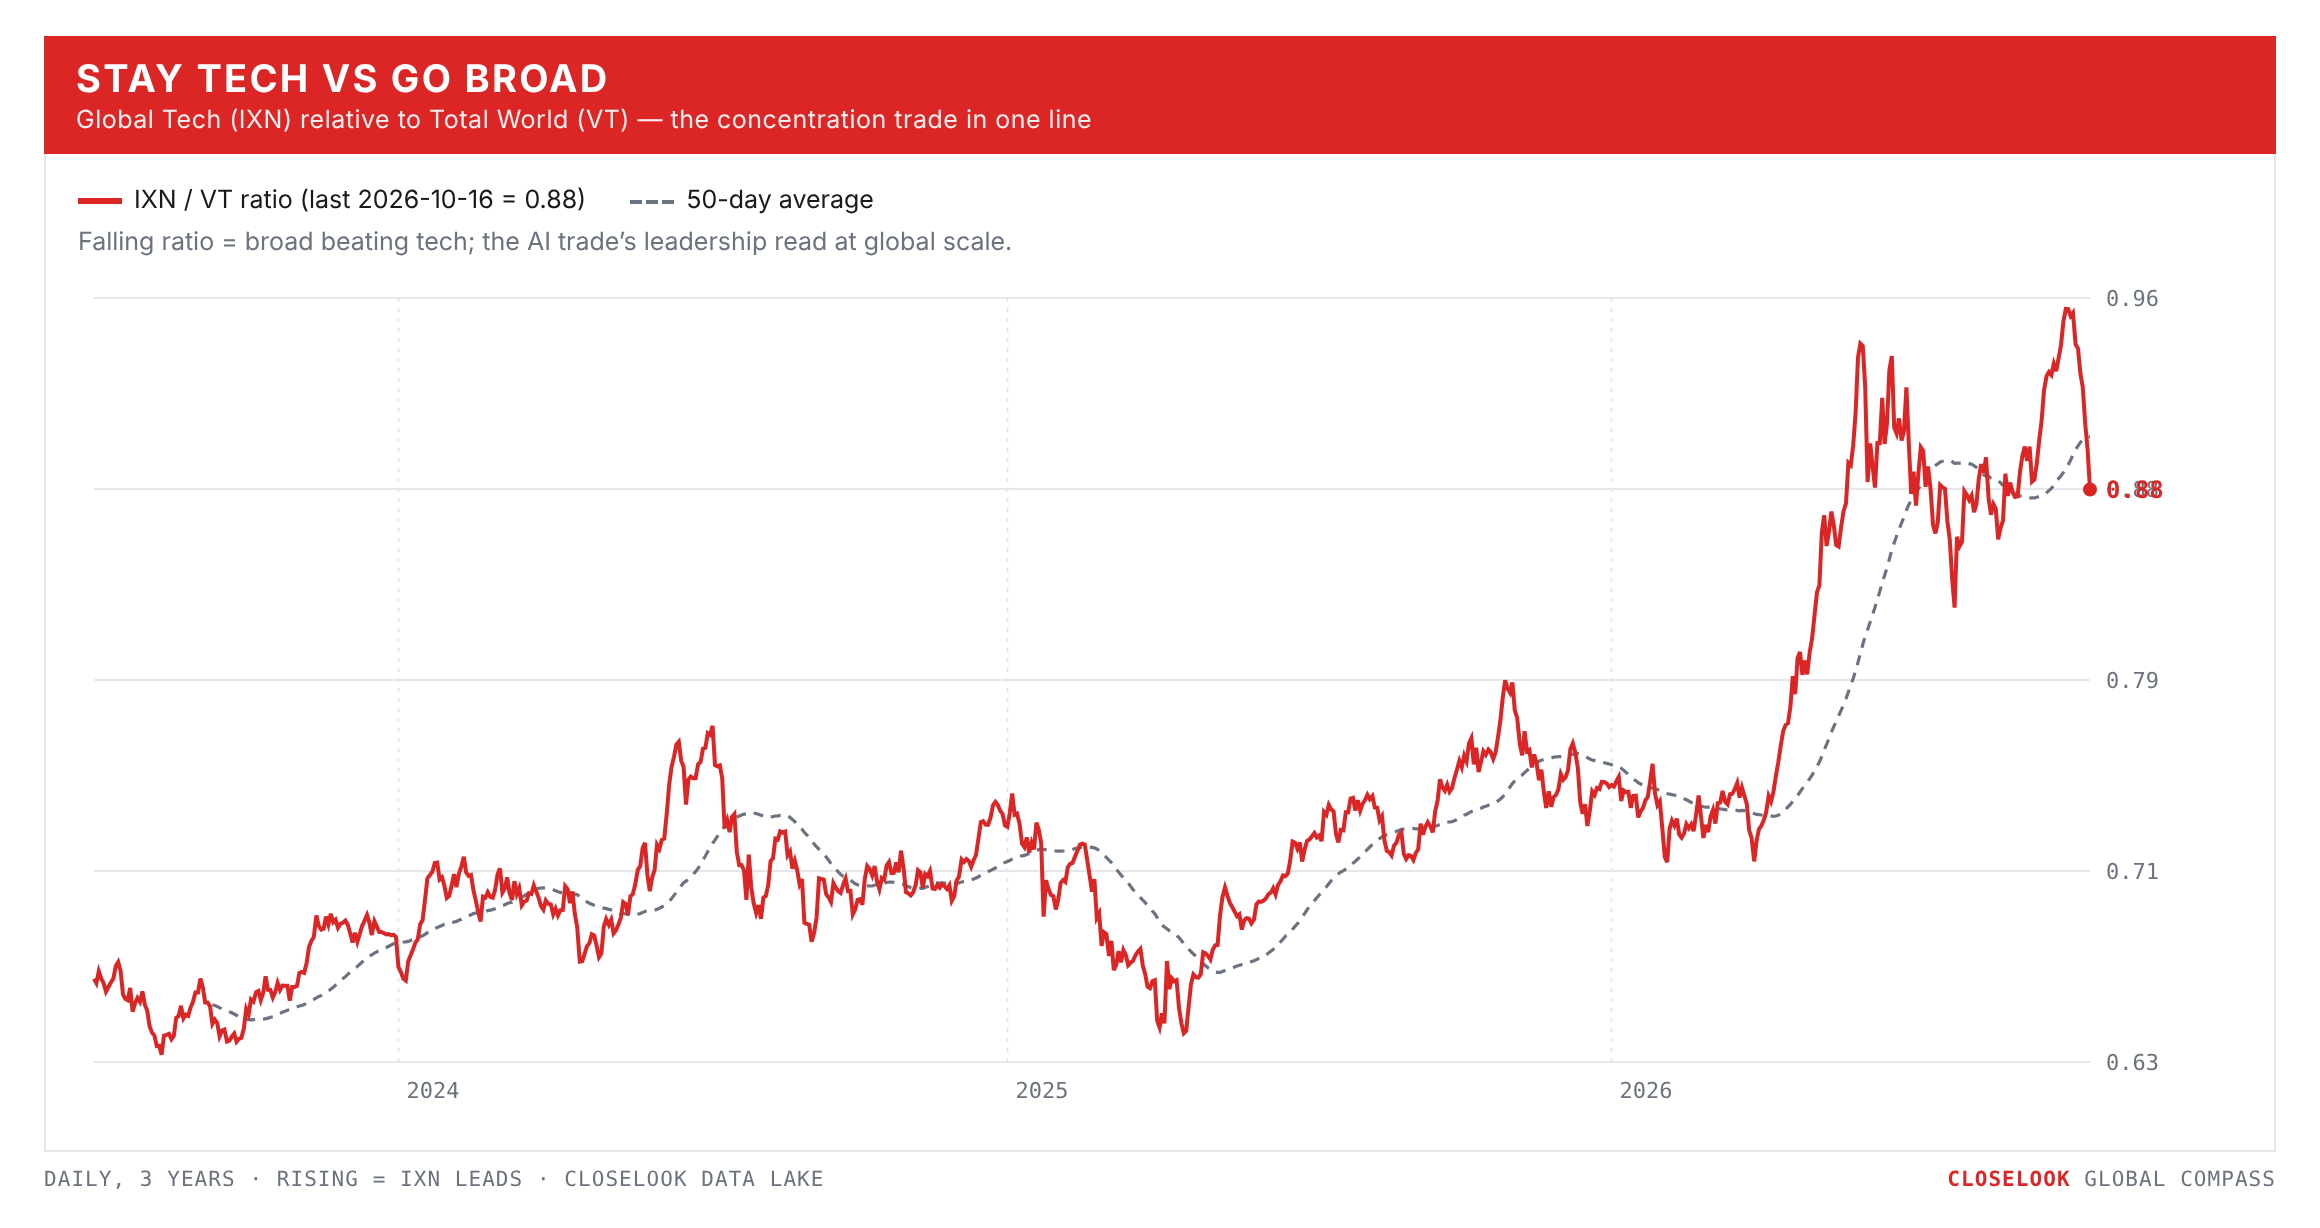
Stay tech vs go broad. Broad won again, by more. The equal-weight S&P +0.49% against the S&P’s −1.97% and the Nasdaq 100’s −5.52%; the world −1.88% against global tech’s −8.32%. On the year tech still leads: global tech +30.8% against the world’s +11.2% — from +42.7% a week ago.
Momentum vs defensive — min-vol takes the year. International momentum fell 1.40% to 51.57; international min-vol rose 3.14% to 94.52, global min-vol +1.68%. On the year min-vol now leads, +9.6% against +7.5% — a week ago momentum led by 2.7 points. Momentum outside America is heavy in the chip exporters; min-vol is staples, utilities and health care.
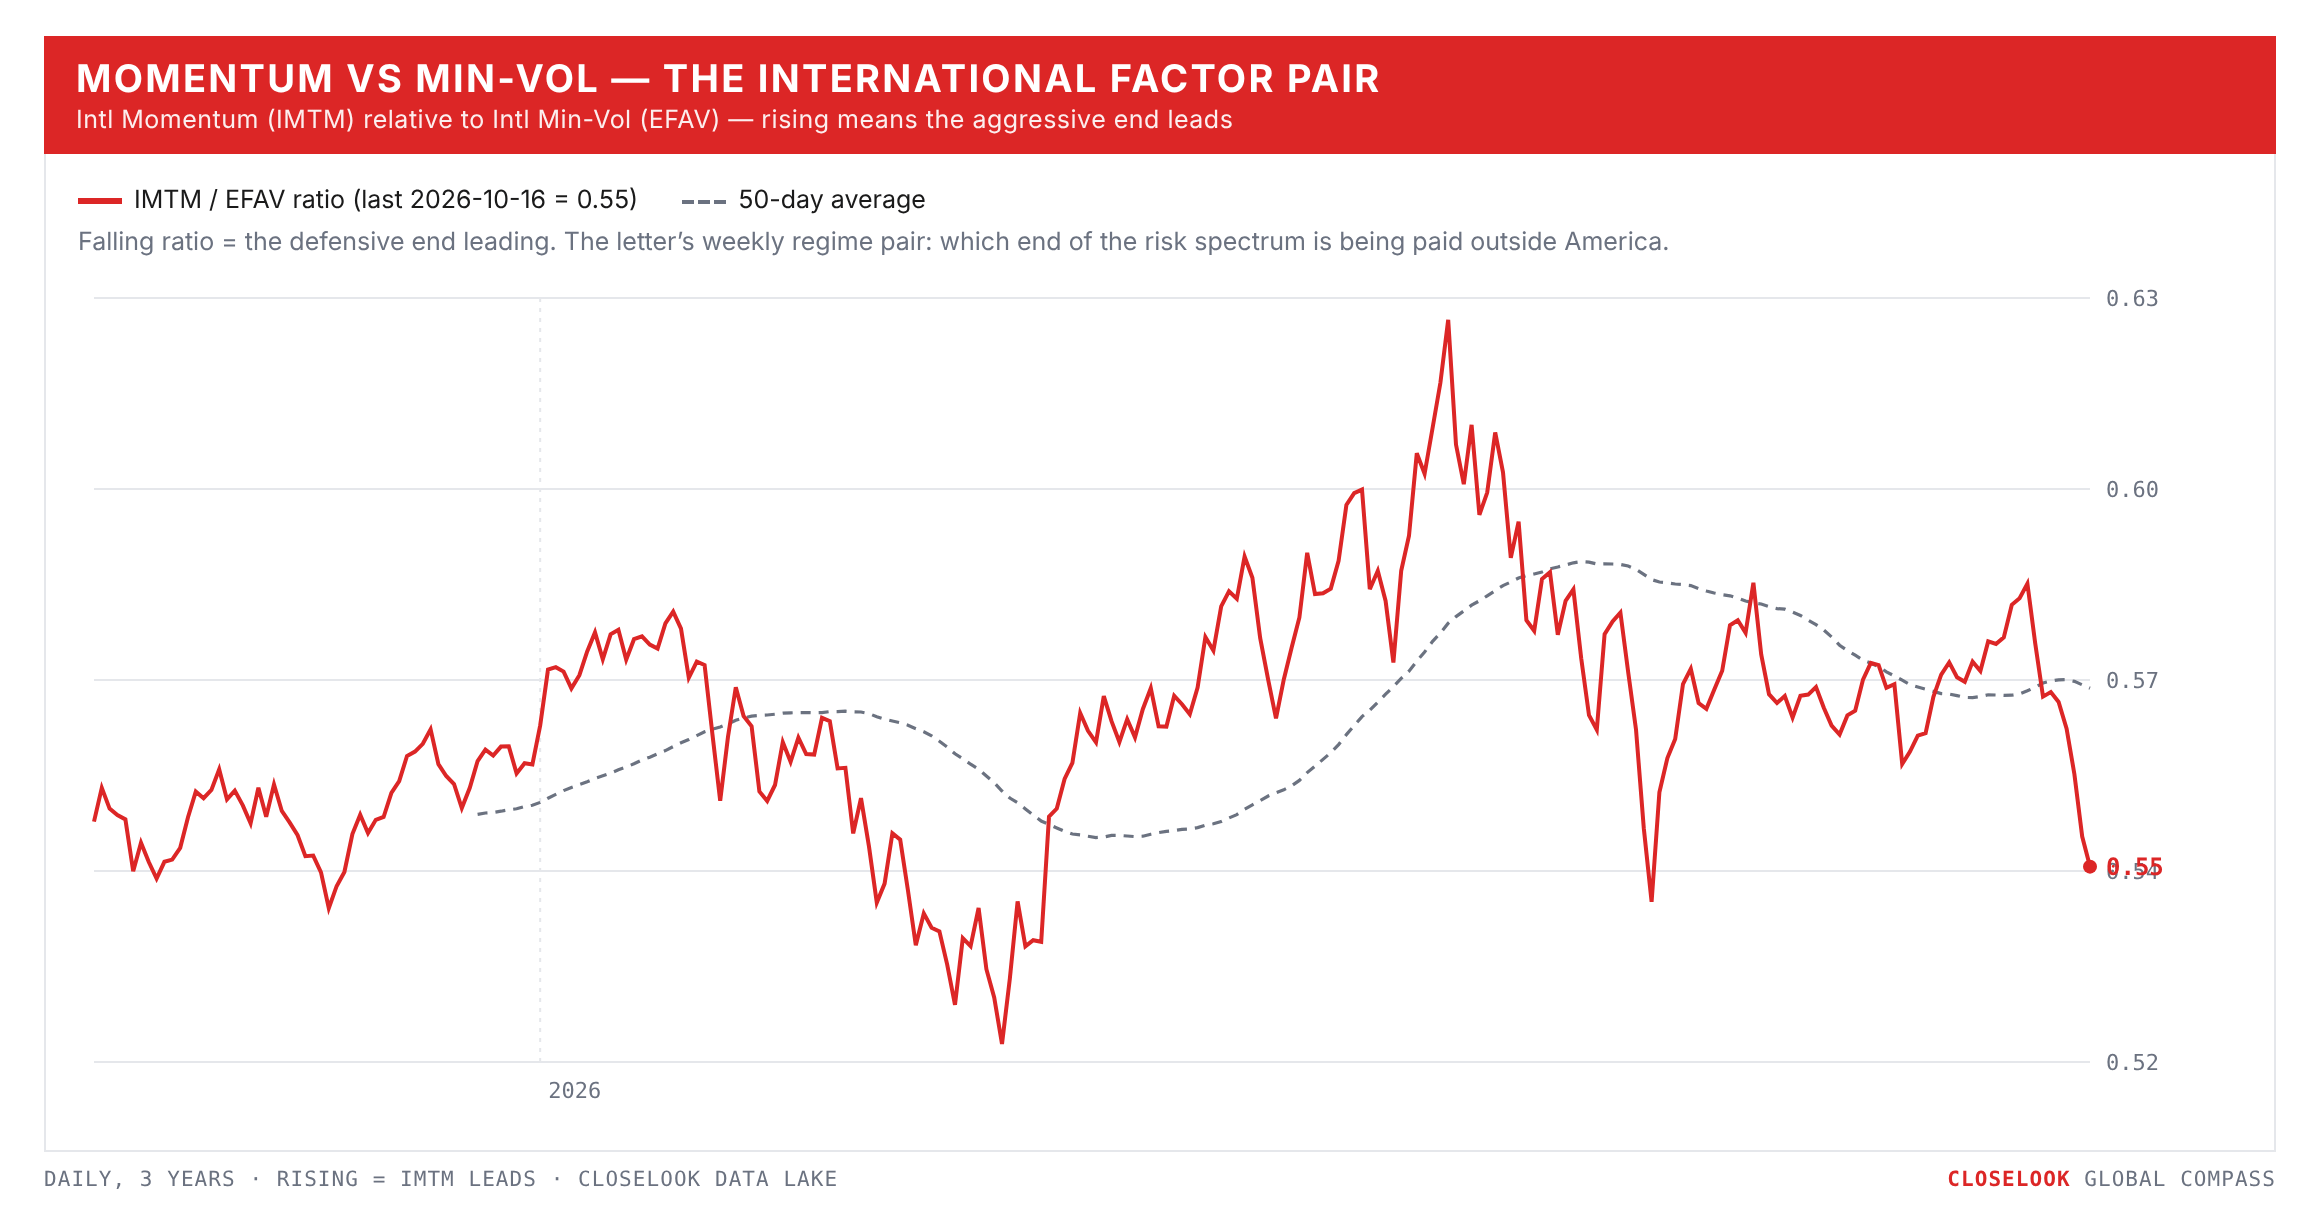
One more pair: value over growth. EAFE value +1.48% against growth −1.18%. On the year value leads +11.1% against +4.4%.
The Closelook letters — where this one sits. The house thesis, compressed: the stock market is a growing system at the aggregate level in which most constituents slowly fade while a small group massively outperforms — and that group changes dynamically; it never stays static. Own the aggregate, know the current winner group, watch for the rotation. Last week the rotation ran inside the winner group, from the builders to the sellers. This week the winner group as a whole was sold, and the money went to the sectors that had been left behind all year. This letter reads the map; Sunday’s US letter reads the tape and its levels; Sunday evening’s Hypergrowth letter reads the names.
2 · The State
The mechanism, named: broad profit taking in the winners, and a rate peak underneath. Put the week in order. Monday: Seoul came back from its holiday and sold its memory makers; in New York memory and optics fell again — Lumentum −7.7%, SanDisk −6.5% at midday — while a few platforms rose. Tuesday: the Kospi −5.5%, under 6,000 at the low, after China’s CXMT flagged a new memory chip; the bank reports began, and good numbers met a cold reception. Wednesday: ASML reported a record €11.7 billion quarter and said it is sold out into 2028 — and the chip fund still fell 4.5%, to 20% under its June high; September consumer prices rose 3.7%, above forecast; BlackRock’s research arm cut US stocks to neutral; Barclays wrote that companies are putting only about 5% of their IT budgets into AI, and Dell fell 11.3%; software joined the selling. Thursday: TSMC posted a sixth record quarter and called itself “prudent” on 2027; producer prices jumped 1.3% in a month — and the ten-year yield fell to 5.10%. Friday: the whole complex sold, the hyperscalers included, while staples, banks and utilities rose.
The pattern under the dates: the best news of the season — ASML sold out, TSMC at a record — did not lift the chips, and the hottest inflation prints of the autumn did not lift the yield. A market that sells good news and ignores bad data is a market that is repositioning, not reacting. The repositioning had one direction: out of what had risen most, into what had not risen at all.
The rate peak, a second week. The ten-year closed at 5.09% on the house sovereign board (5.10% on the index), from 5.24% a week ago and 5.31% at the close on 5 October. The long-bond fund rose five days in a row from its 77.11 low close and finished at 80.05, +2.65%, its best week in a year; IEF 90.42, +1.14%. This happened in a week with 3.7% consumer inflation and a 1.3% monthly jump in producer prices — the bond market looked through both, to slower growth ahead. The odds of another Fed hike on 28 October fell from about a third on Thursday to about one in six on Friday.
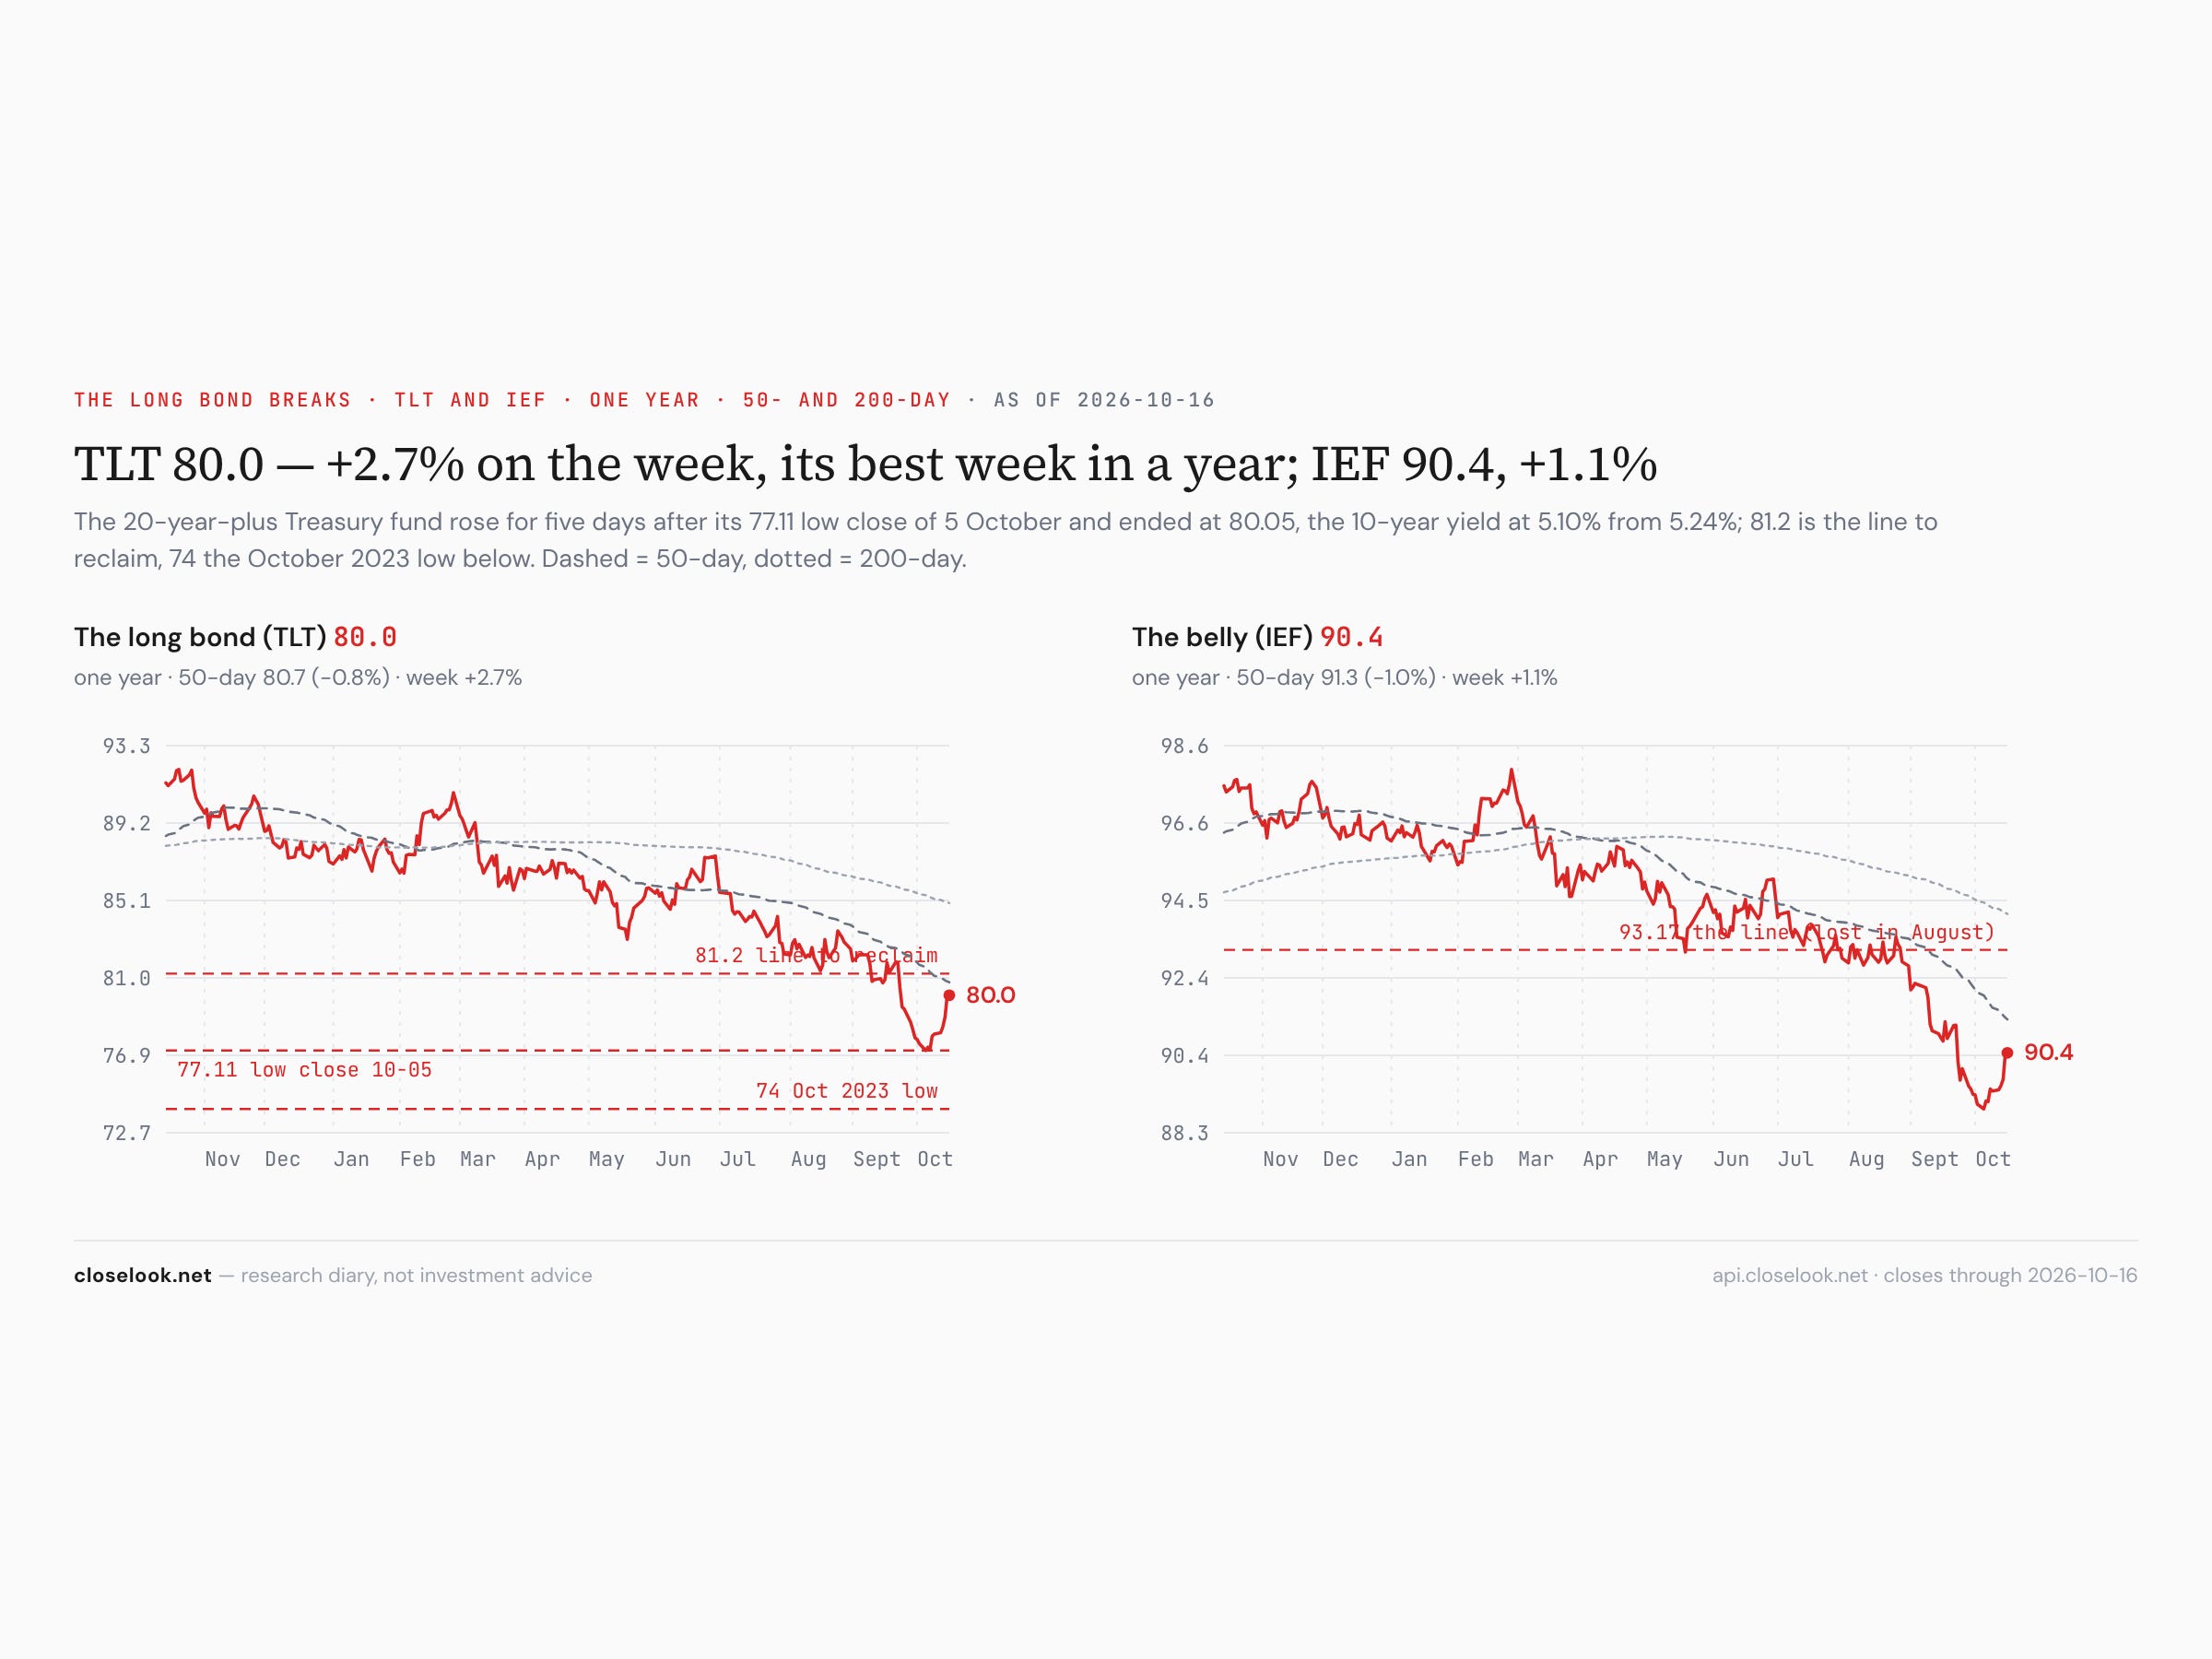
The rate map — one sentence each. America: 5.09% on the ten-year, down 15 basis points on the week. Britain: 5.38%, 5.85% on the thirty-year — still the highest long yield on the board. Japan: 2.93%. Germany: 3.44%. France: 4.79%, Italy 4.48%. The French ten-year pays about 135 basis points over the Bund, from 138 — narrower by three, and still 31 basis points more than Italy; over 21 days the French ten-year has risen 33 basis points while the German one fell 5. The house sovereign pressure index slipped from 0.04 to −0.09, the equal-weight ten-year at 4.28%, from 4.36%.
The consequence — the map, adjusted. This letter’s positioning, restated: this diary stays away from mainland Europe’s core, and from France in particular; Greece and Poland stay the exceptions. This week adds a nuance, not a change: the defensive markets — Switzerland and Britain — did what defensive markets do in a week like this one. The book holds Switzerland and has had it under review for weeks; a 4% week does not change why. This is a diary’s positioning, not advice.
Oil — the other winner. The oil fund rose 9.15% to 161.76, a dime under its September 15 high close of the year; Brent traded above 107 dollars on Monday. US energy closed at its highest of the year, 68.24, and global energy at 62.98. Oil at these levels is a cost for every economy that imports it — Europe and most of Asia — and a reason the bond market’s calm about inflation can be tested.
The hard assets — the metals fell, the coin held. Gold fell 0.67% to 382.01 — a third week under the 391.74 support it broke at the end of September. Silver fell 6.0%, copper miners 6.7%. Bitcoin closed Friday at 82,046, −0.6%; it closed above 83,000 only on Sunday and Tuesday. The fund held 46.15, above the 44.5 line. A week of risk reduction that did not reach the coin is worth noting — it had already lost its floor the week before.
Seoul: through every line. The fund walked 170.11 → 166.56 → 159.83 → 156.22 → 150.44. Last week this letter set 190.11 as the cap, 183.46 as the old high water and 180 as the line. All three are now far above the price. EWY is 31.4% under its June high and +54.7% on the year — the best market on the board in 2026, and the one that has given back the fastest.
Taiwan: TSMC’s record, and the market fell anyway. EWT closed 114.27, 113.46, 110.94, 109.14, 106.26. TSMC’s quarter was the best in its history; the company’s word for 2027 was “prudent”, and the market heard the word, not the number.
Europe, the voting machine and the weighing machine. Euro-AI’s chip architecture layer fell 20.1% and semi equipment 10.9% — while defence rose 9.6%, enterprise AI and data 3.6%, medtech 1.3% and industrial AI 1.3%. Europe’s AI index fell 2.66% in a week the American ones fell 13–14%; Europe’s AI exposure is mostly its own software and its machines, and the machines were the only part that fell hard.
The macro print. Three numbers: 3.7% consumer inflation, a 1.3% monthly jump in producer prices, and a ten-year yield that fell 15 basis points anyway. The first two say inflation is not finished. The third says the bond market expects growth to slow enough to finish it. For the equity map that meant one thing this week: the money moved to the companies whose profits do not depend on the next year of AI spending — and to the countries that own them.
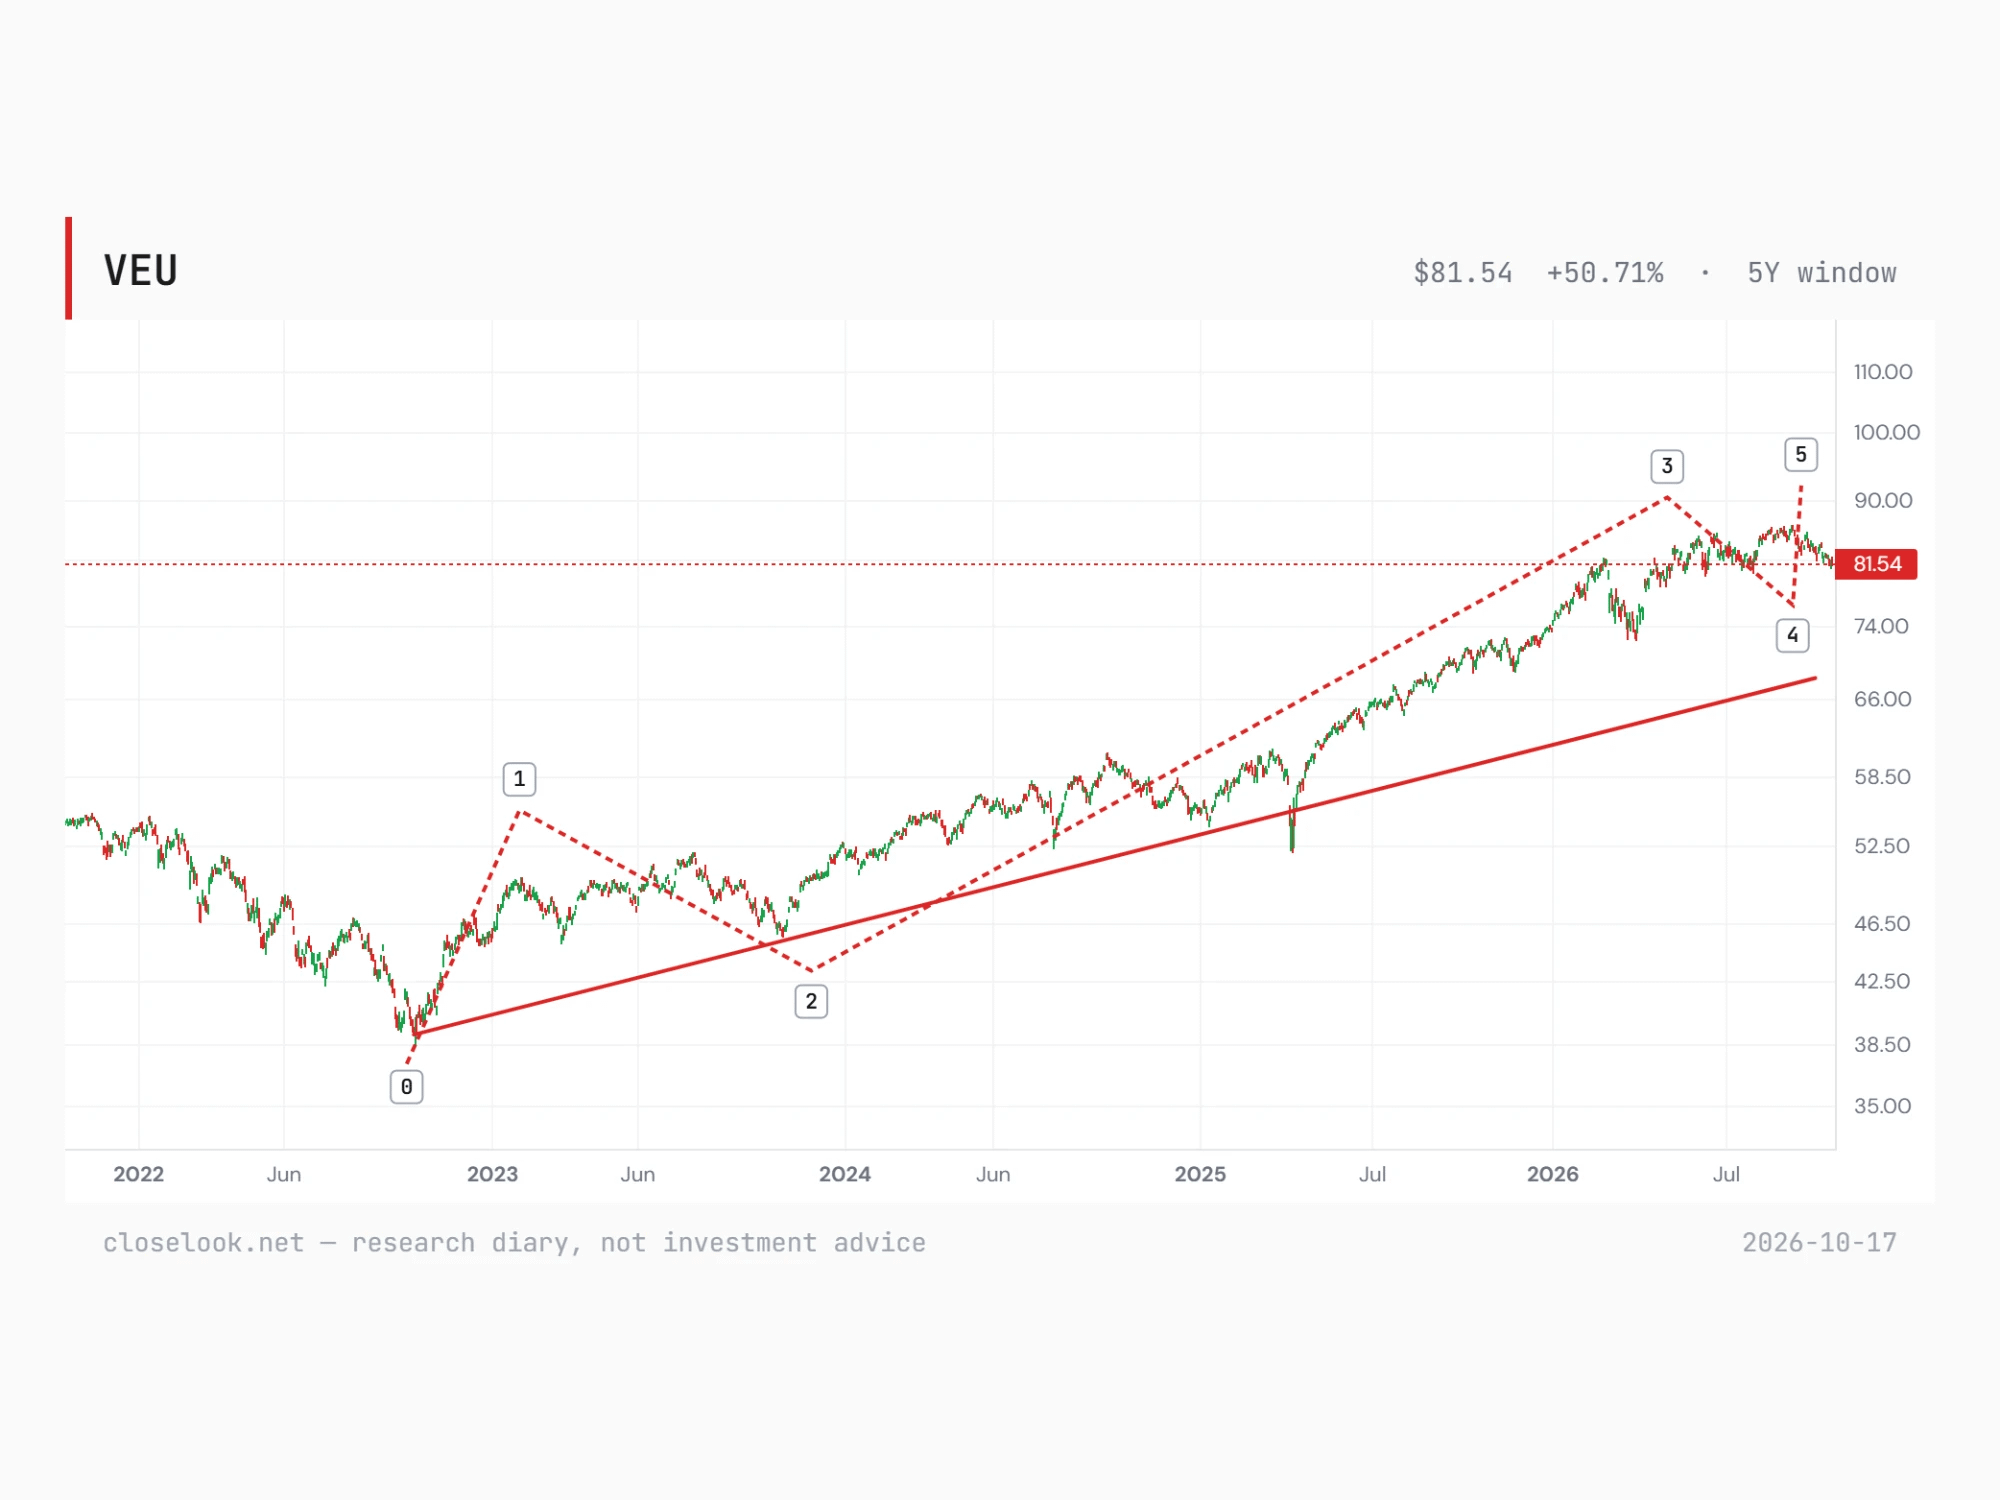
The structural read — the editor’s count moves on: wave 4 is forming. Last week this letter carried the editor’s preferred count on the world ex-US: still inside the third wave of the advance from the October 2022 low, with a fourth-wave correction as the alternative. This week the editor has updated the count. The world ex-US is forming wave 4 — in the editor’s words, a typical complex consolidation. On the redrawn five-year chart, wave 1 ran from the 2022 low into early 2023, wave 2 corrected into late 2023, and wave 3 carried the index to this year’s top area — the record close of 86.41 on 4 September. The dashed path now drawn for wave 4 points to the mid-70s; the fifth wave after it to a new high above 90. The solid rising line from the 2022 low, at about 67 today, stays the line under the whole advance.
What changed, and what did not. What changed: the editor no longer reads this autumn’s pause as a step inside a running third wave. A second weekly close under 82.85 and the week’s lows near 81 fit the slower count better. What did not change: the count is still bullish on the larger trend. A fourth wave is a correction inside an advance, not the end of it — and the typical fourth wave is exactly what this autumn has looked like so far: sideways, overlapping, tiring to watch. It ends when the price stops making lower highs and lower lows; the chart’s dashed path puts the low in the mid-70s, the spring low of 72.75 and the rising line below it. (Editor’s count, 10-17.)
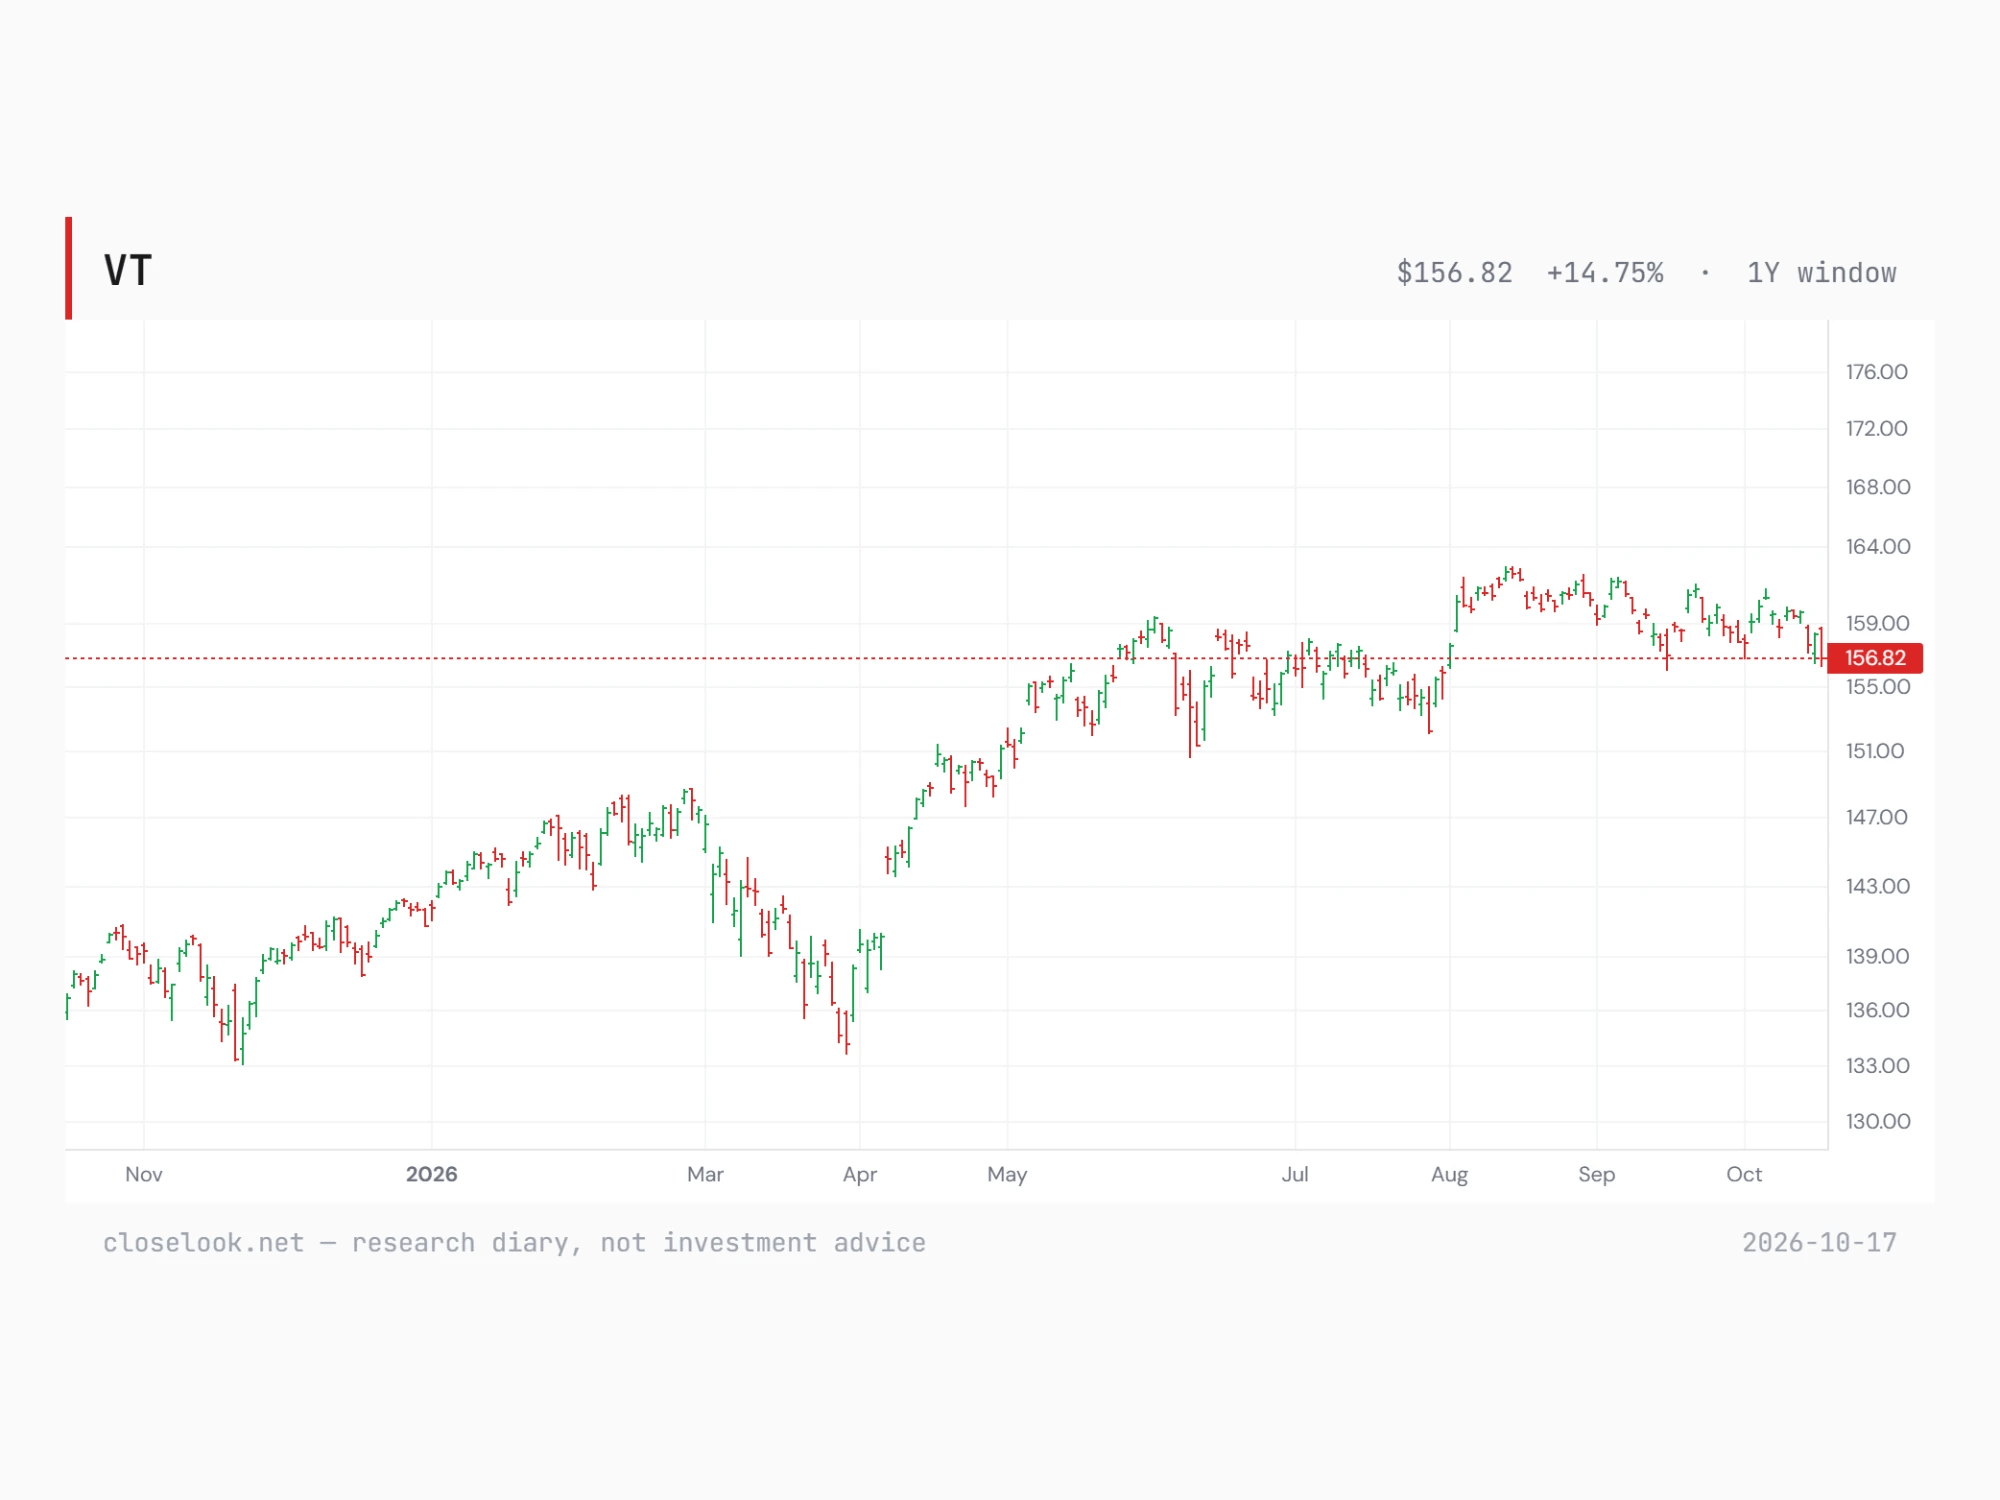
The all-world index — the same pause, seen closer. The editor reads VT the same way: the sideways stretch since August is the same kind of complex consolidation. On the one-year chart it is plain to see. VT made its high close of 162.39 on 13 August and has moved sideways since, between 156.82 and 162.39 on closing prices; Friday’s 156.82 is the lowest close of that range, 3.4% under the high. Below it are the 29 July low of 152.22 — the floor before the August breakout — and the spring low of 134.19. On the year VT is +11.2%. The world index is testing the bottom of its range, not yet out of it. (Editor’s read, 10-17.)
3 · The Outlook
The three-index read — the builder and the runner fell together, the sellers held until Friday. We read the three together because they are three stages of one spend: capex (Rubin Build-Out, what gets built), opex (Agentic Ecosystem, what it costs to run), applications (Agentic Winners, what gets sold on top).