


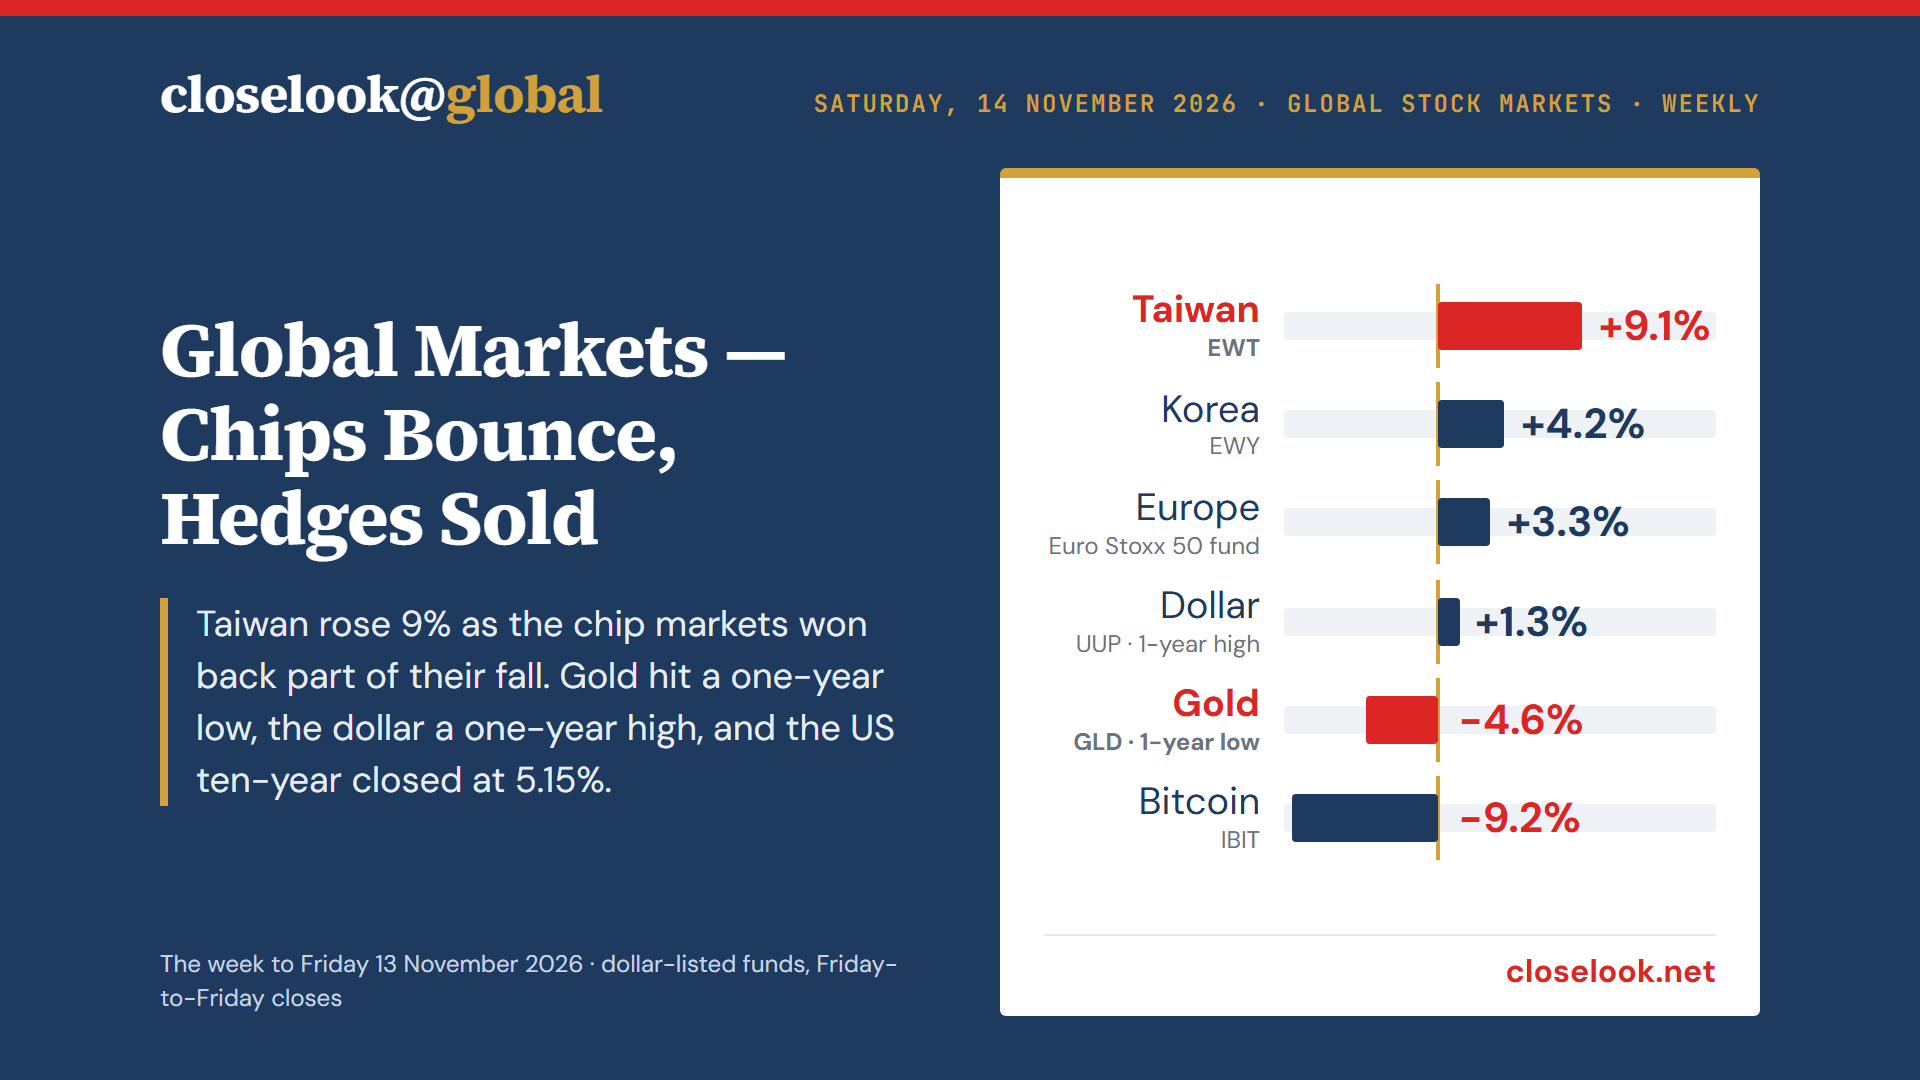
Taiwan's fund rose 9.1 percent, Korea's 4.2 and Japan's 4.0, and Europe's main indices rose about 3 percent; the STOXX 600 closed at its highest level of the past year. Gold fell 4.6 percent to its lowest close in a year, silver 5.9 percent, the long bond 3.1 percent and the bitcoin fund 9.2 percent, while the dollar closed at a one-year high. A hot inflation report took the US ten-year back above 5 percent, to 5.15 percent, and Nvidia's chief executive resigned. The world ex-US index closed back above its summer-low support, the all-world index back above its July low. A new board this week follows the funds that buy into AI adoption rather than AI hardware.
1 · This Week’s Action
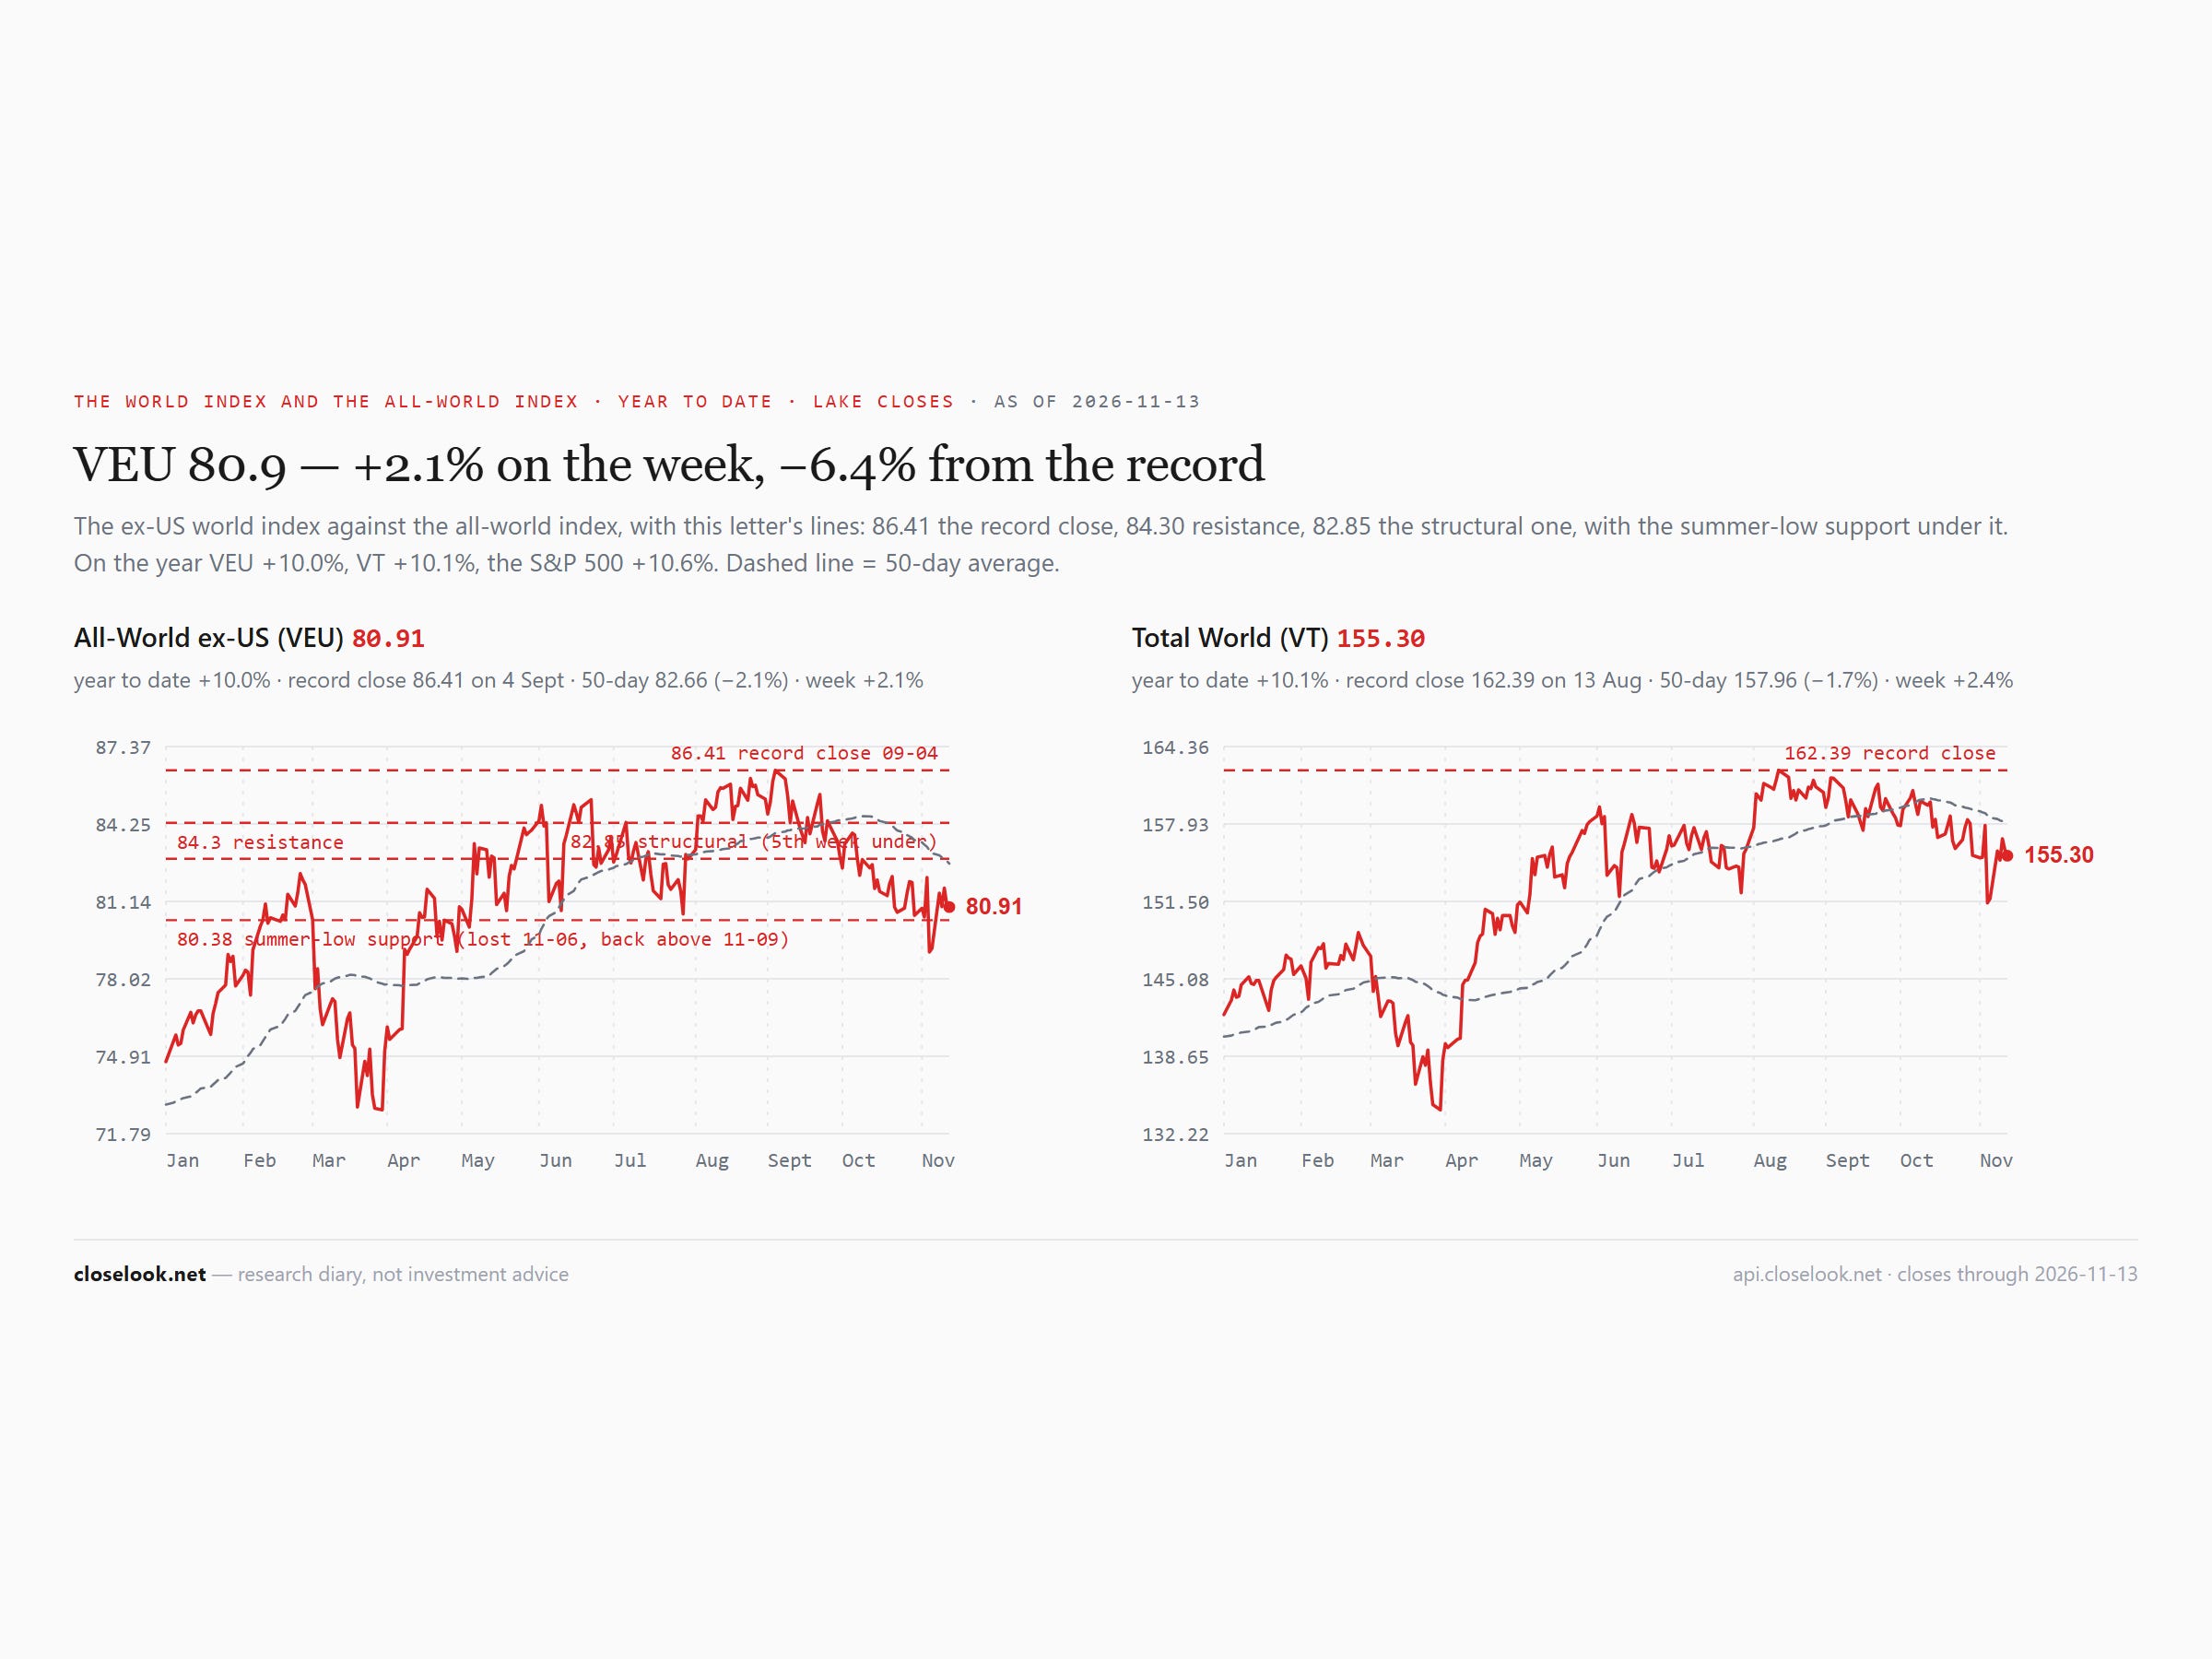
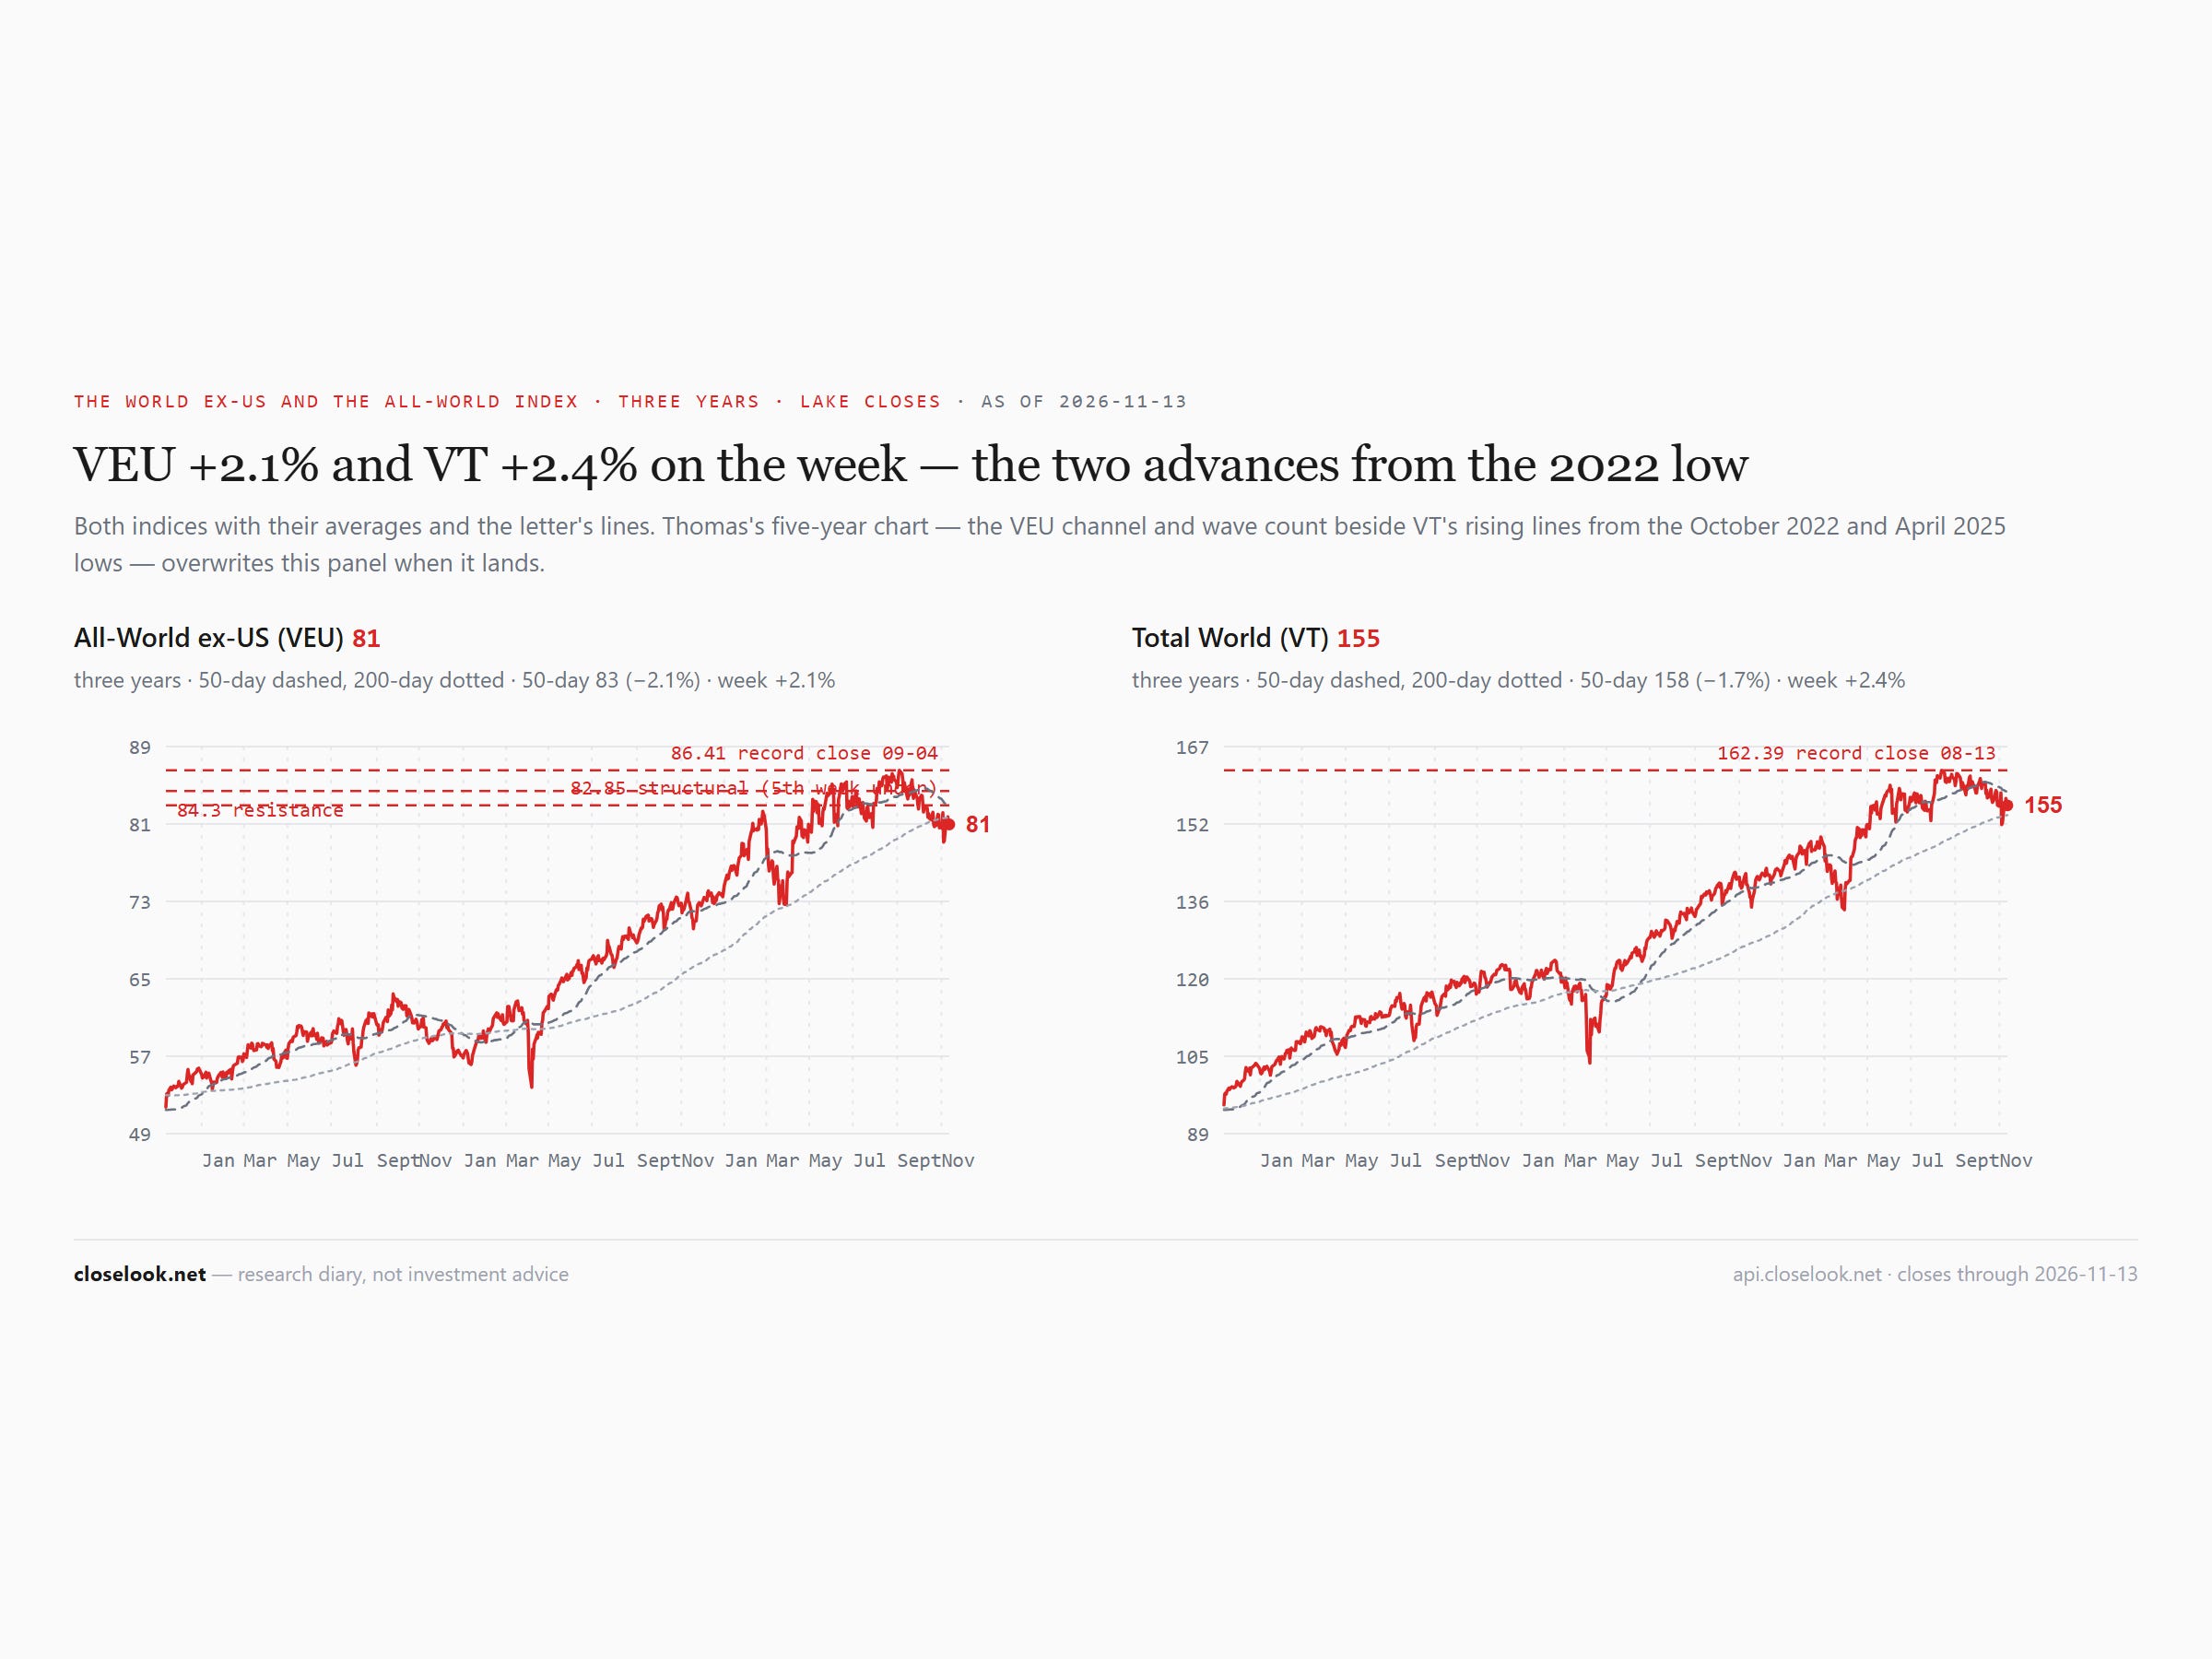
The global view. The ex-US world index closed the week at 80.91, up 2.09% — back above 80, and back above the summer-low support near 80.3 it lost a week ago. The path: Monday 81.47, Tuesday 80.92, Wednesday 81.67, Thursday 80.96, Friday 80.91; the week ran from 80.38 to 81.85 intraday. The index sits 6.4% under its September 4 record of 86.41 and 11.2% above its spring low of 72.75.
The all-world index rose 2.35% to 155.30 — back above its July low close of 152.22, still under the August–October range that starts at 156.82. The S&P 500 fund rose 2.59% to 754.37, 3.2% under its October 6 record; the Nasdaq 100 fund rose 3.63% to 679.89, 10.5% under its own. Wednesday was the best close of the week almost everywhere; Thursday and Friday gave part of it back.
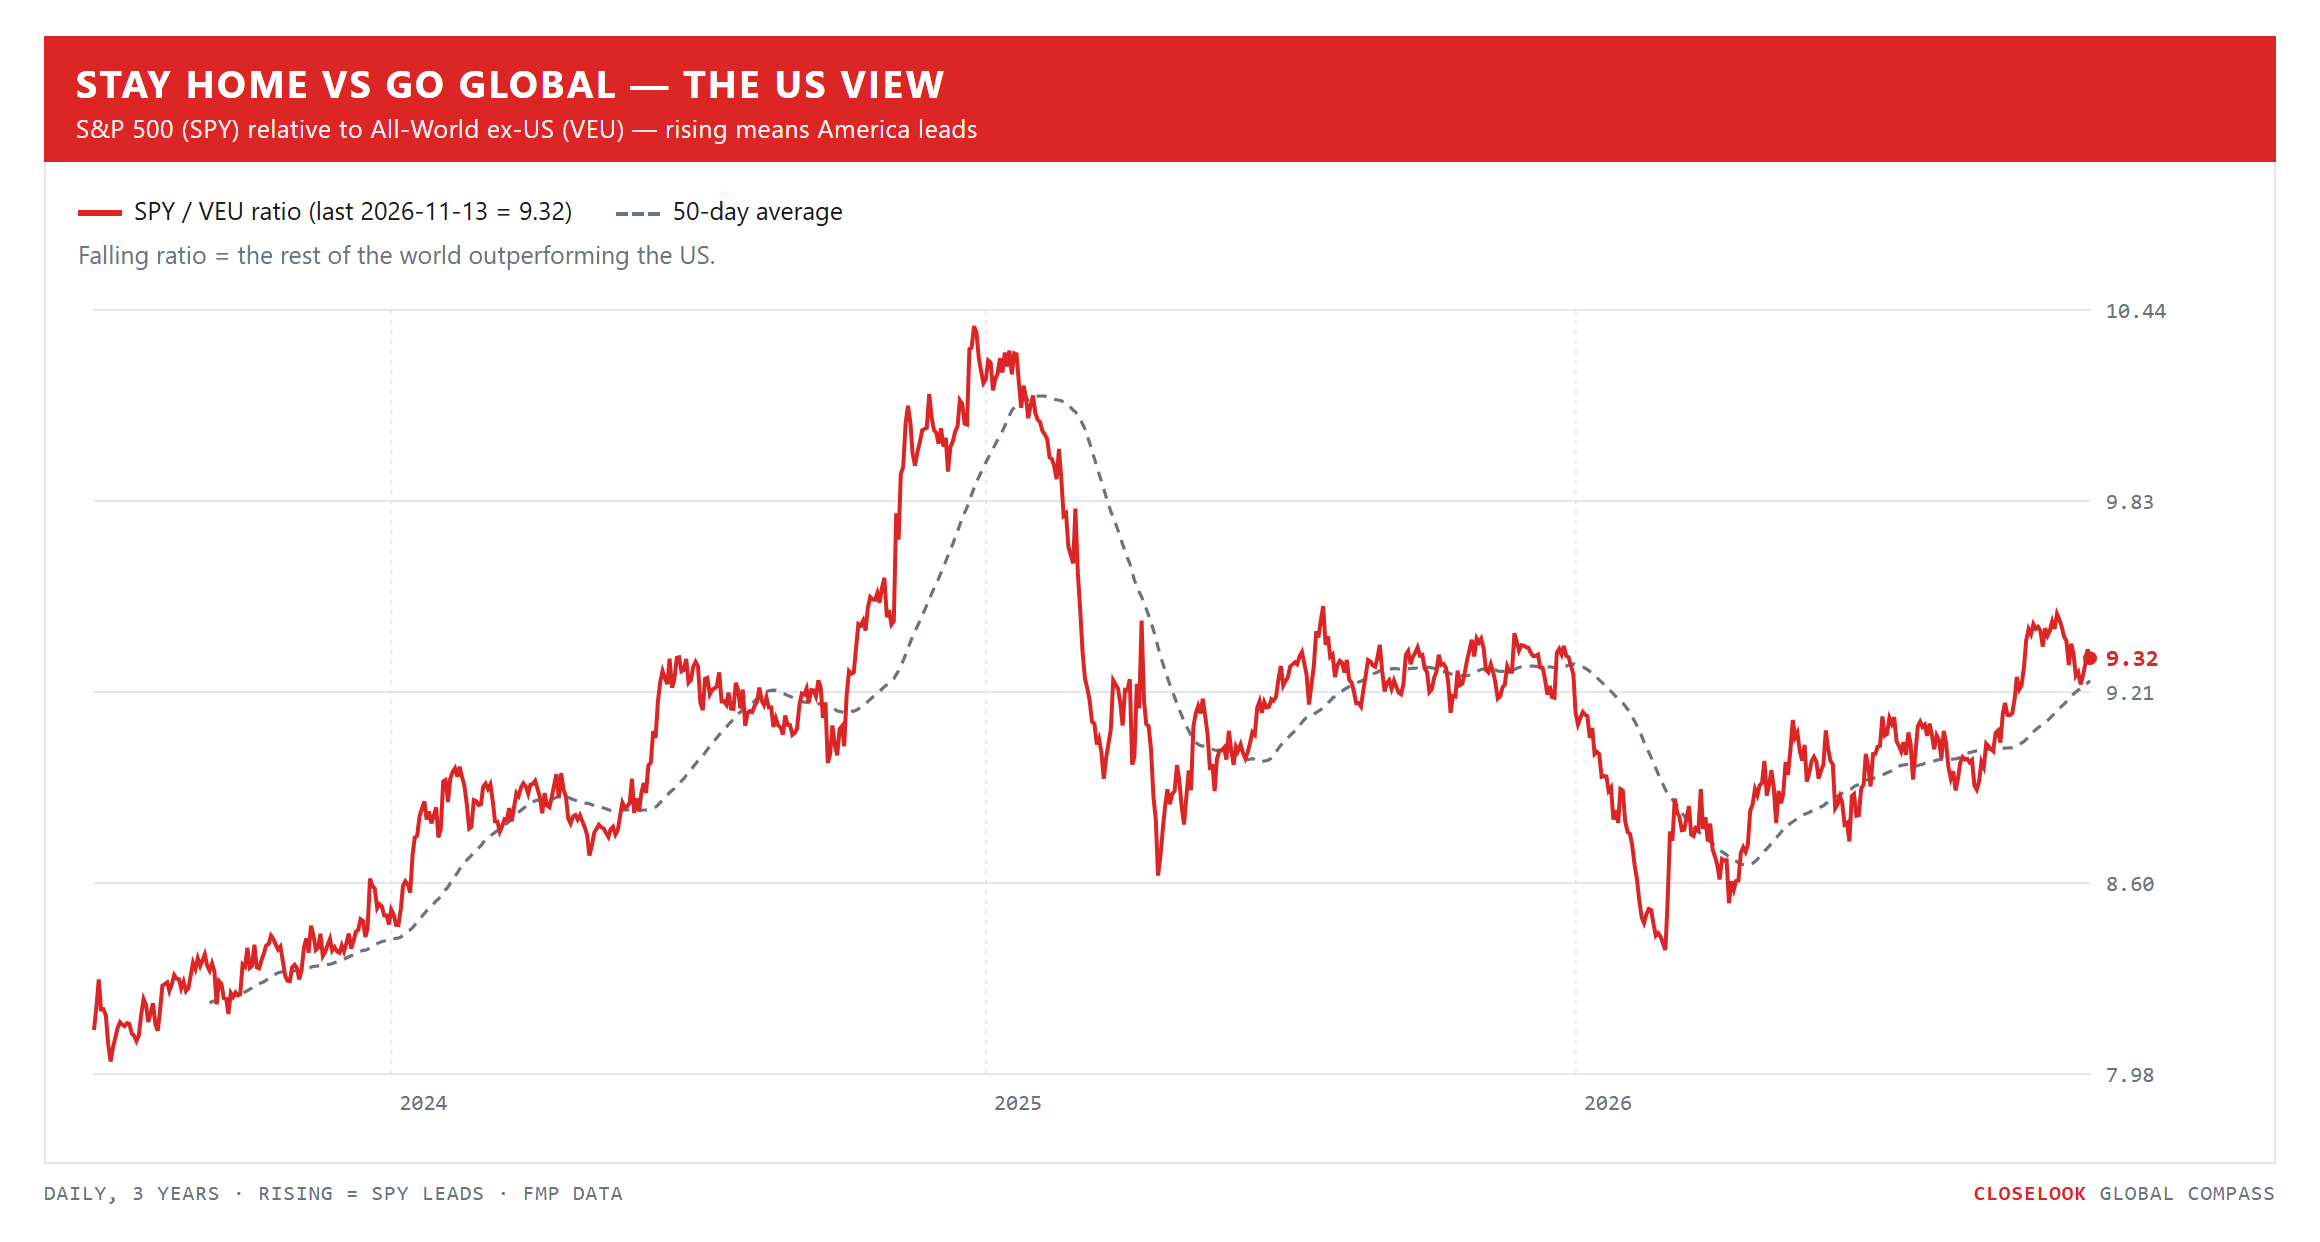
America’s lead for the year is back — barely. The S&P 500 fund is +10.62% for 2026, the all-world index +10.09%, the world ex-US +9.99%. A week ago America led the world ex-US by a tenth of a point; this week by six tenths. The house cointegration monitor still lists the VEU/SPY pair as breaking, the spread 0.73 standard deviations below its mean, from 0.85.
The week, in one line: the chip markets won back part of their fall, and the hedges were sold. Taiwan rose 9 percent, Korea and Japan about 4, Europe about 3. Gold fell almost 5 percent to its lowest close in a year, silver almost 6, the long bond 3, the bitcoin fund 9 — while the dollar closed at a one-year high. Twenty-eight of the thirty-three regional funds we can price rose, from twelve a week ago; two more on the board still carry a vendor data error and stay out. The best-to-worst spread was 13.3 points, from 18.4.
The corridor: a strong Monday, a hard Friday. The chip index rose 8.0% on the week to 10,146 — after 7.5% on Monday alone, the S&P’s best day since April, and 5.7% on Wednesday, when CoreWeave beat its forecasts and rose 24%. Friday took 3.4% back: Cisco and Applied Materials both reported above their own forecasts and both fell, and AMD lost 8.8%. The chip majors fund SMH rose 4.91% to 486.75, still 27.2% under its June record. Nvidia went the other way all week, −12.8% to 162.85, its lowest close of the past year: on Sunday Jensen Huang told staff of an affair with a woman who, the New York Times reported, US intelligence had concluded was a Chinese spy; on Thursday Jensen Huang resigned and finance chief Colette Kress became interim chief executive.
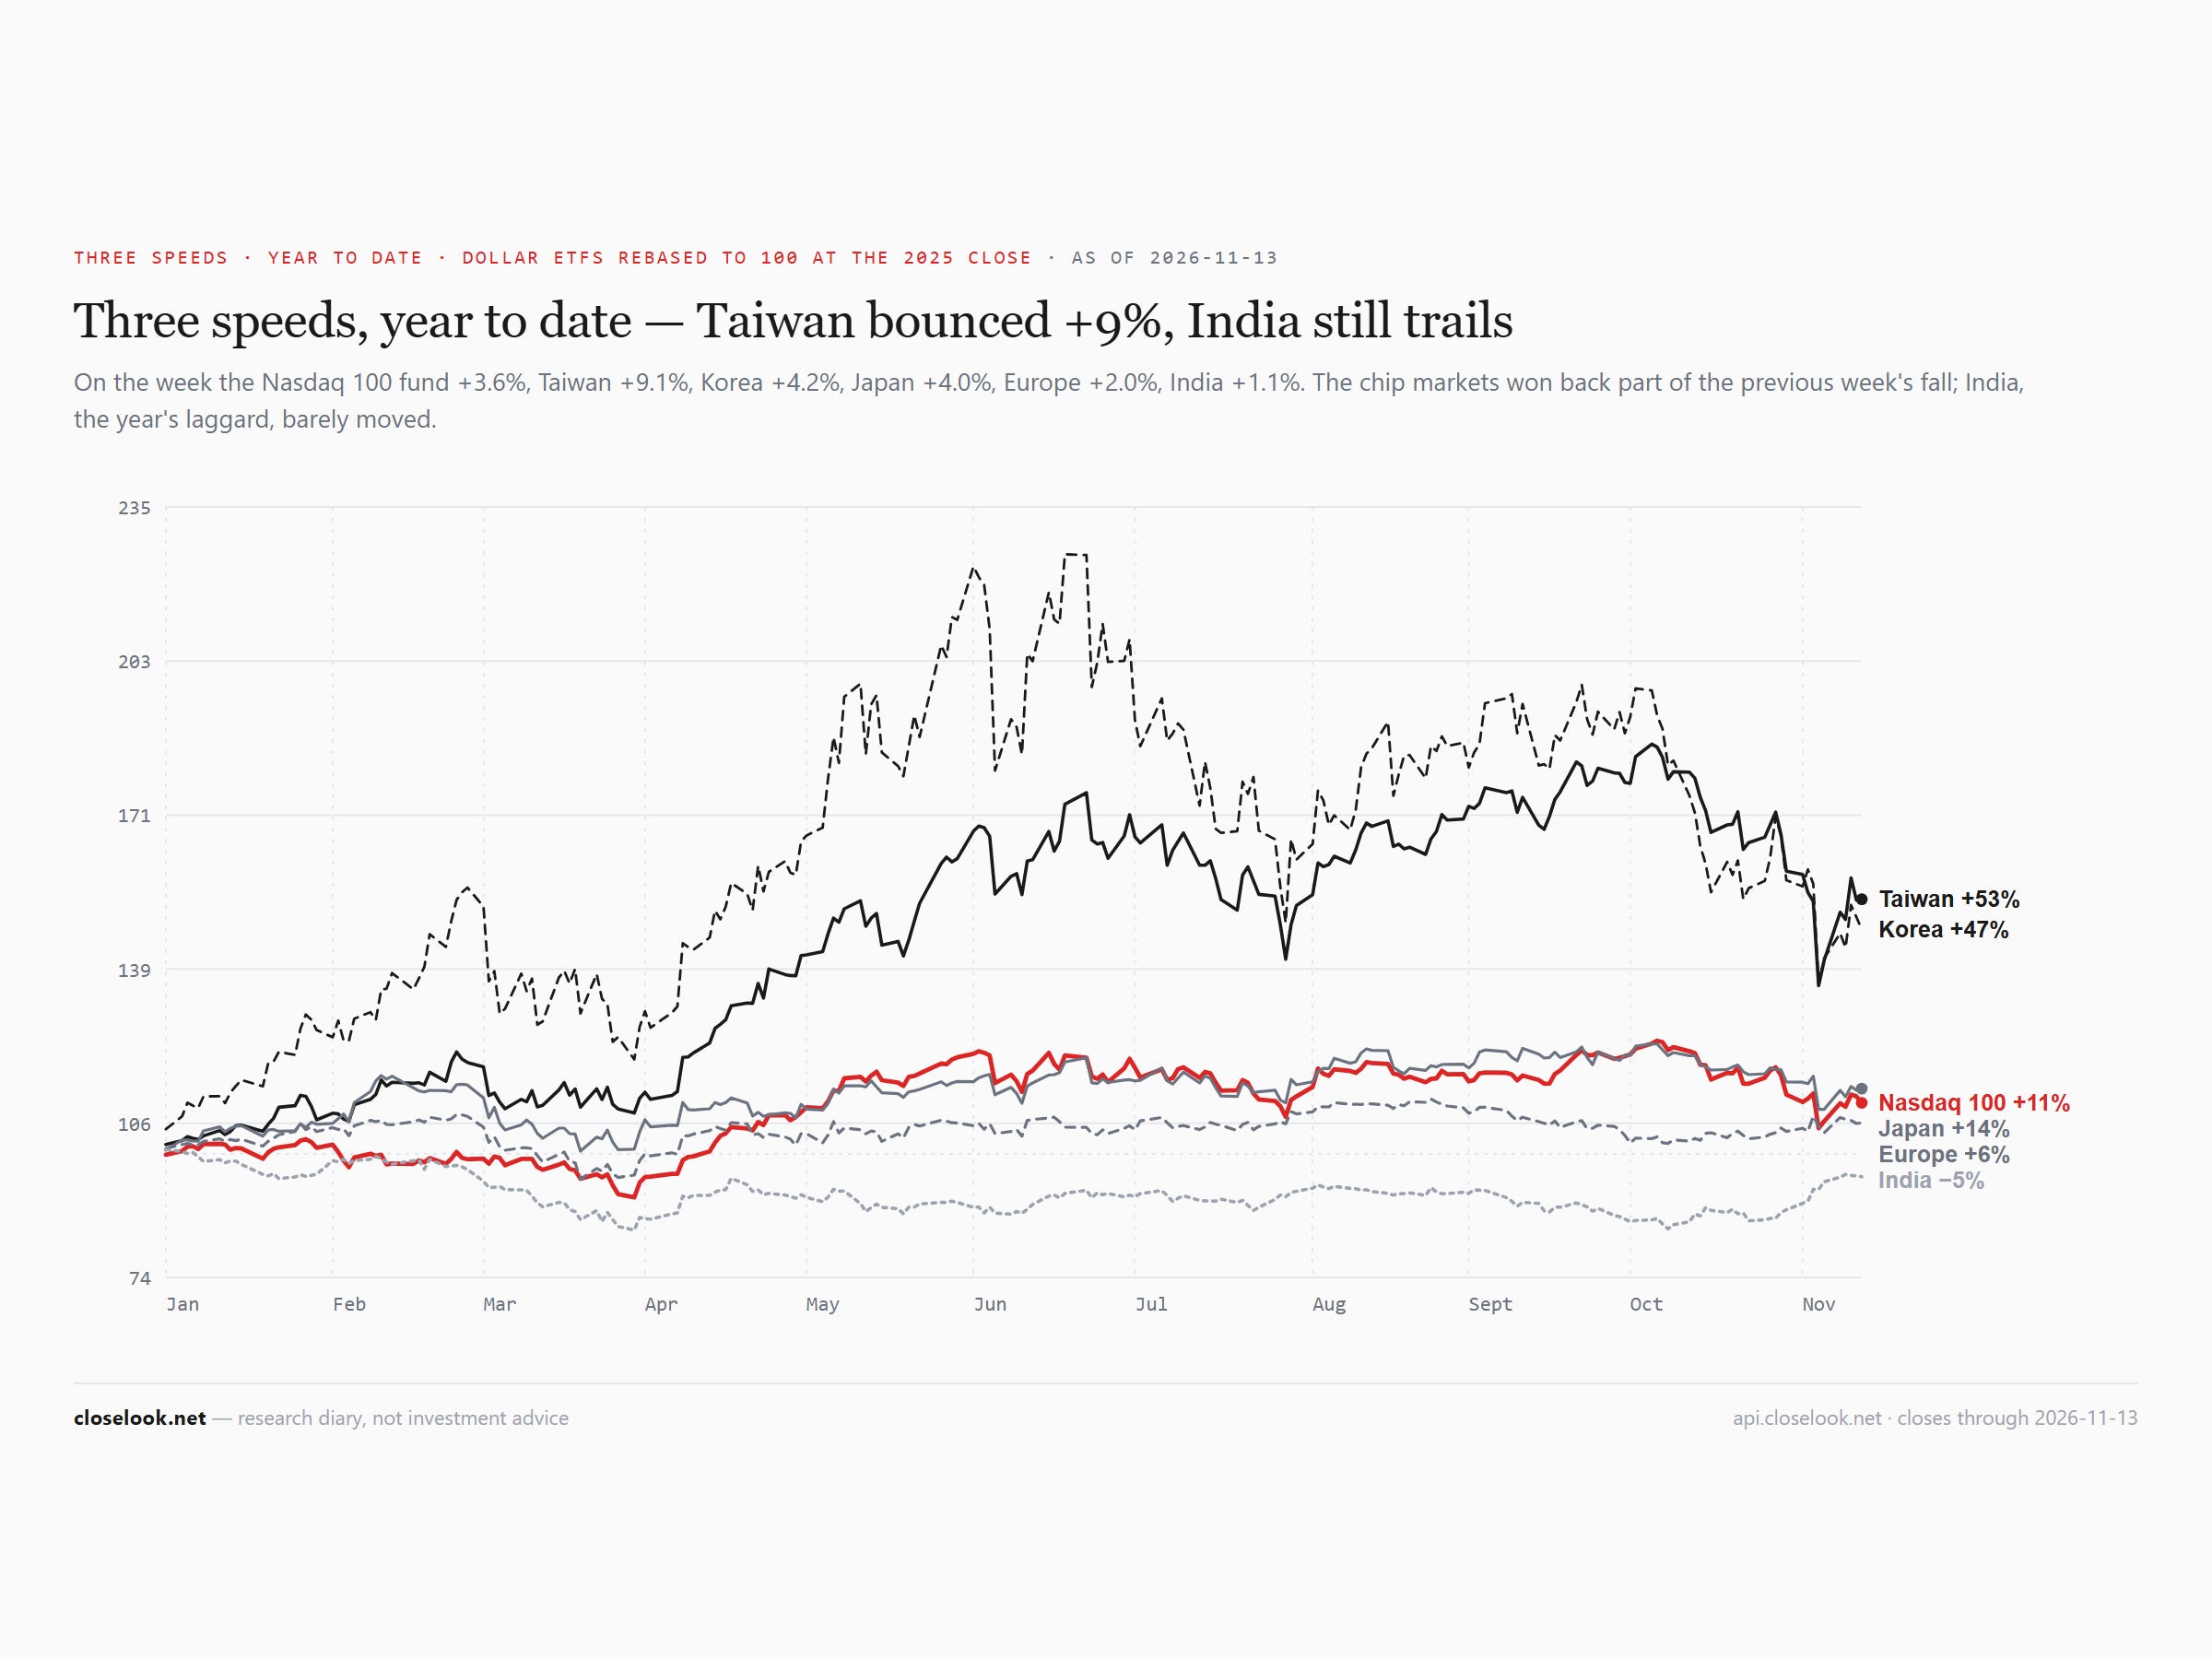
Asia’s chip markets, in their own currencies. Taiwan: the Taiex +10.0% to 43,675; the fund EWT +9.1% to 97.38. Korea: the Kospi +4.6% to 5,291, the Kosdaq +8.6% to 700; the dollar fund EWY +4.2% — on Friday the Kospi turned a 3% morning gain into a 1% loss. Japan: the Nikkei +6.5% to 61,142 — 15.5% under its June high, out of the bear-market zone it entered a week ago — the TOPIX +6.3%, the dollar fund +4.0%; the yen weakened from 158.48 to 159.72 per dollar, after 159.86 on Thursday. Hong Kong’s Hang Seng −3.5% to 23,638, China’s large caps −4.2%, the A-shares −0.9%. India: the Nifty +0.5% to 25,144, the Sensex +0.7%, the dollar fund +1.1%. Australia’s ASX 200 rose 0.7%.
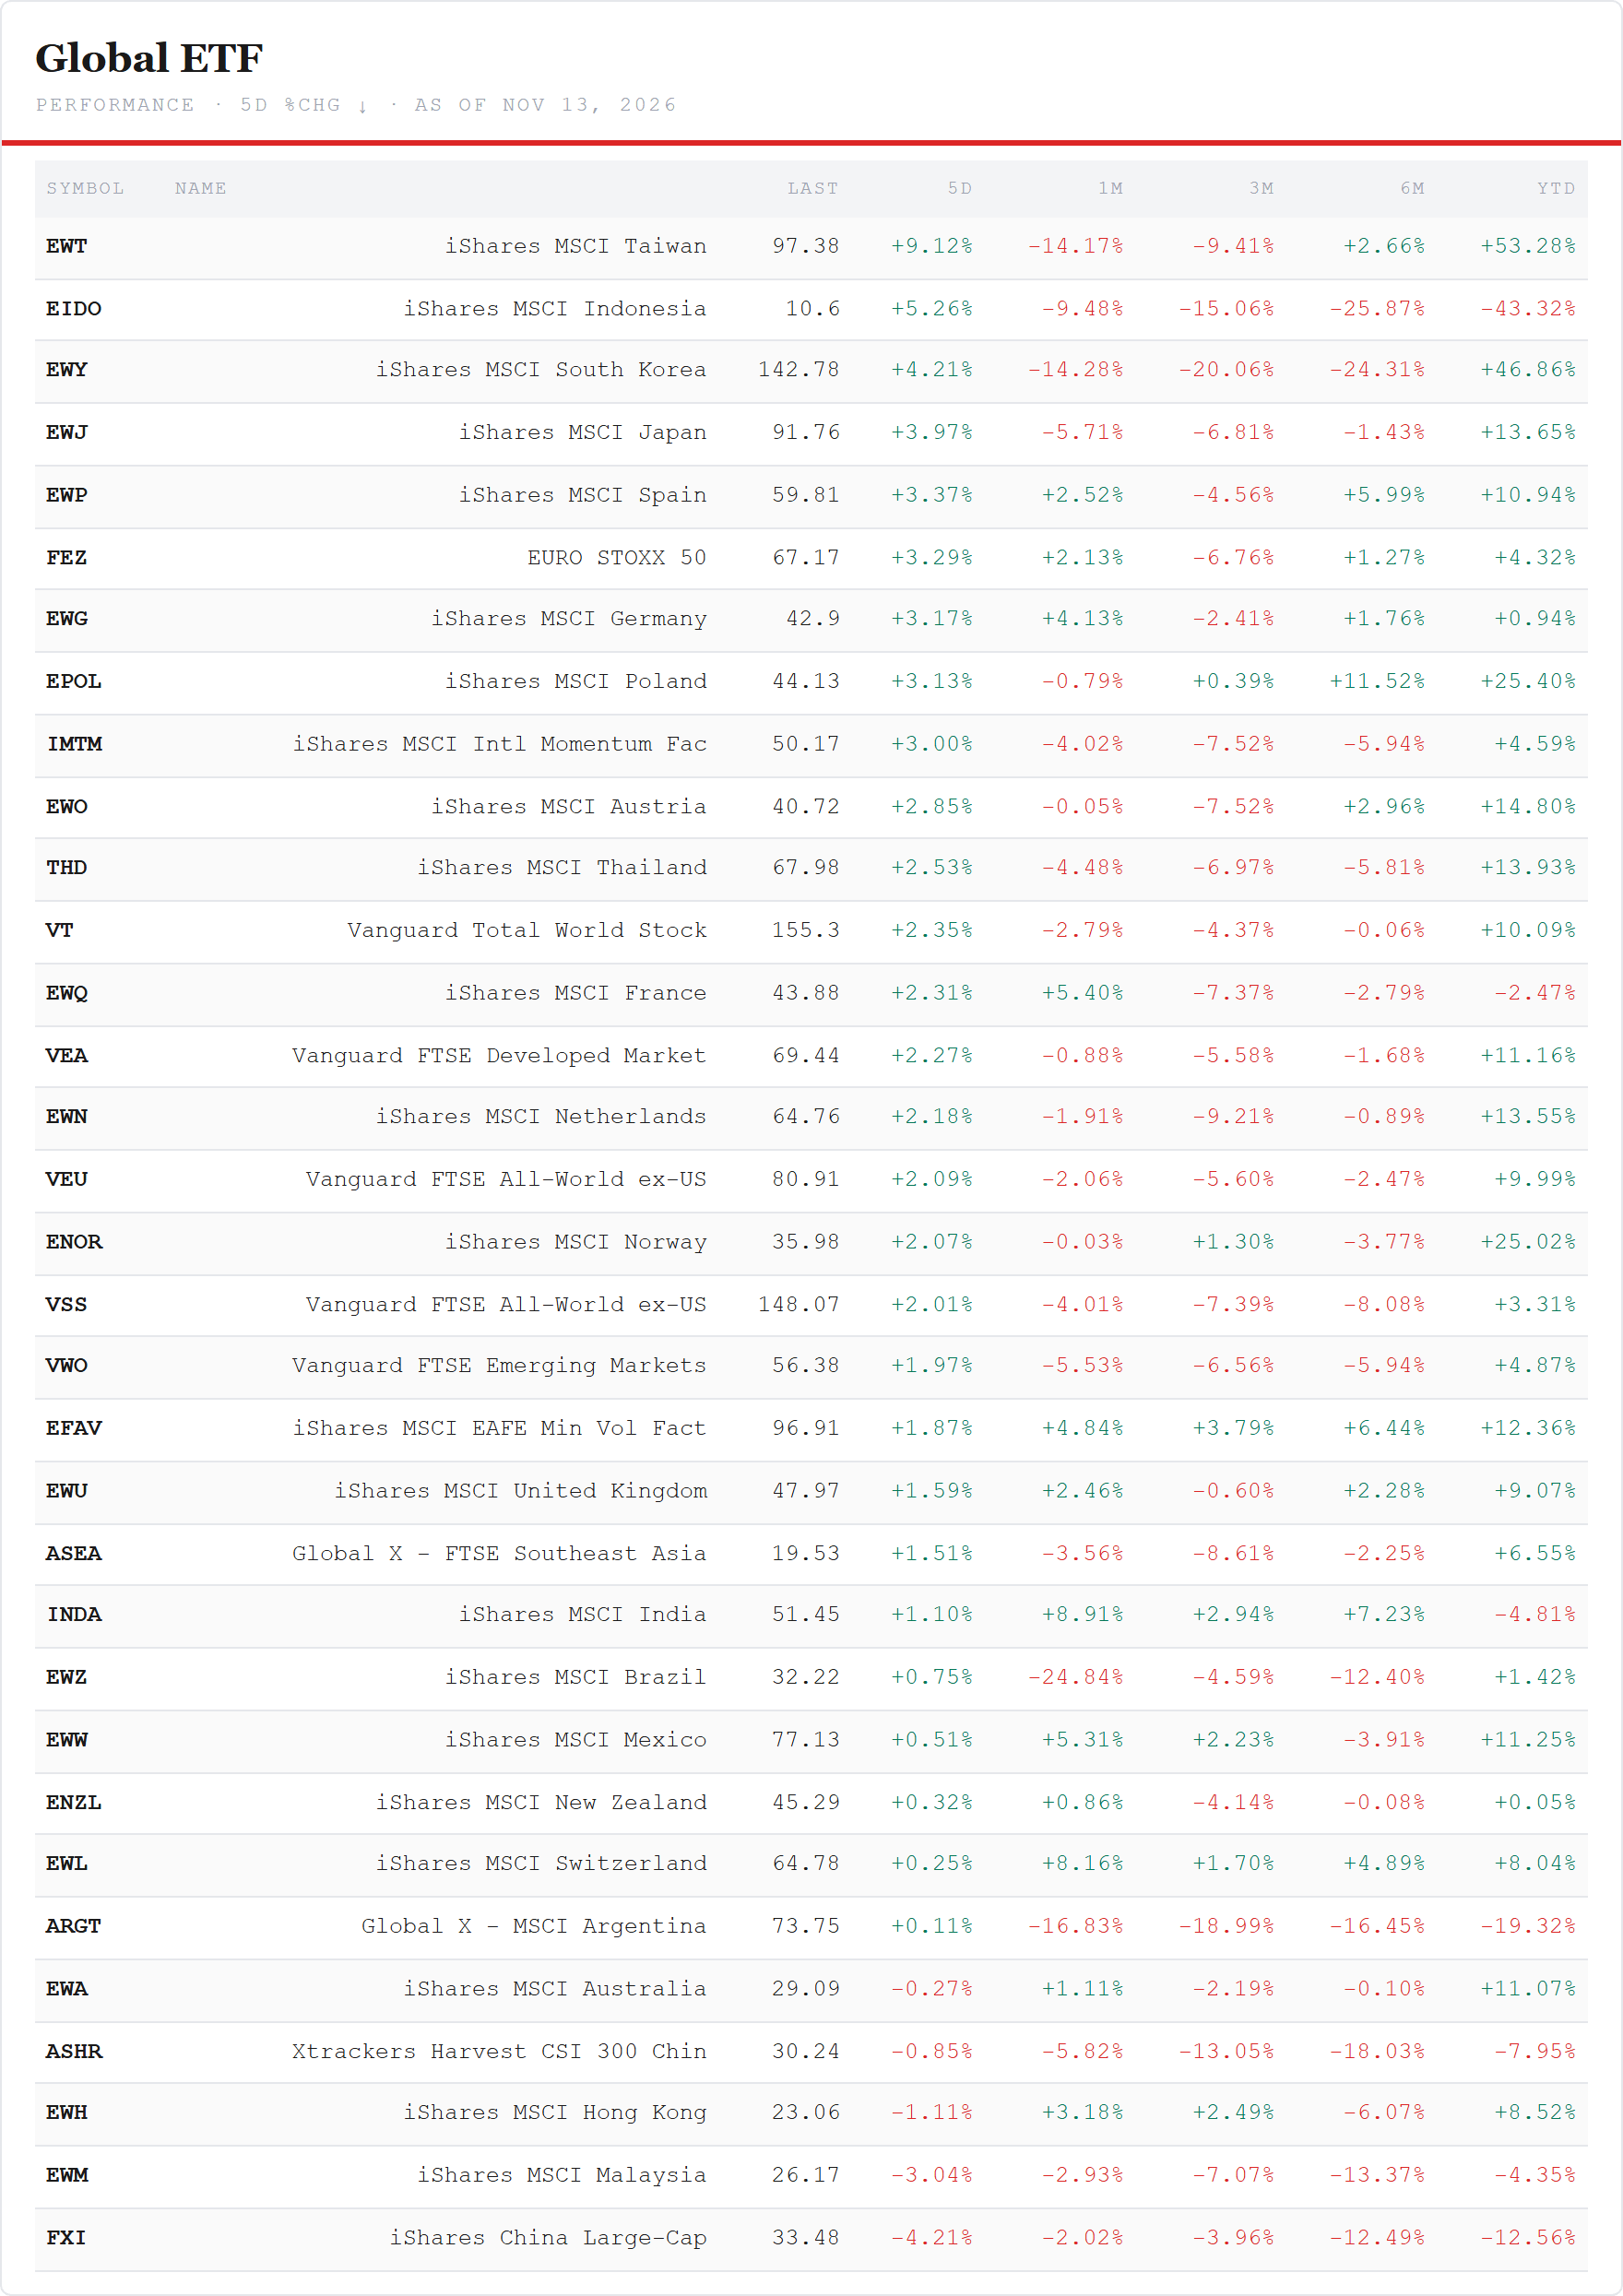
The regional board — twenty-eight green of thirty-three. The top: Taiwan +9.12%, Indonesia +5.26%, Korea +4.21%, Japan +3.97%, Spain +3.37%, the Euro Stoxx 50 fund +3.29%, Germany +3.17%, Poland +3.13%. The bottom: China large caps −4.21%, Malaysia −3.04%, Hong Kong −1.11%, the A-shares −0.85%, Australia −0.27%, then Argentina +0.11% and Switzerland +0.25%. India, last week’s leader, rose 1.10%; Brazil 0.75% to 32.22.
The cross-asset backdrop — the hedges sold, the dollar bought. Five green of twelve: the Nasdaq top-30 fund +3.97%, the Nasdaq 100 +3.63%, the S&P +2.59%, the US top-20 fund +2.25%, and the dollar +1.27% to 29.50 — its highest close of the past year. The red: the bitcoin fund −9.19% to 38.94, silver −5.85% to 44.13, gold −4.58% to 355.45, the long bond −3.10% to 79.38, copper miners −2.84%, the belly −1.98% and oil −1.91% to 145.58. Silver and gold made their lowest closes of the past year. The volatility index closed at 19.26, from 25.64; its lowest close of the week was 17.49 on Wednesday.
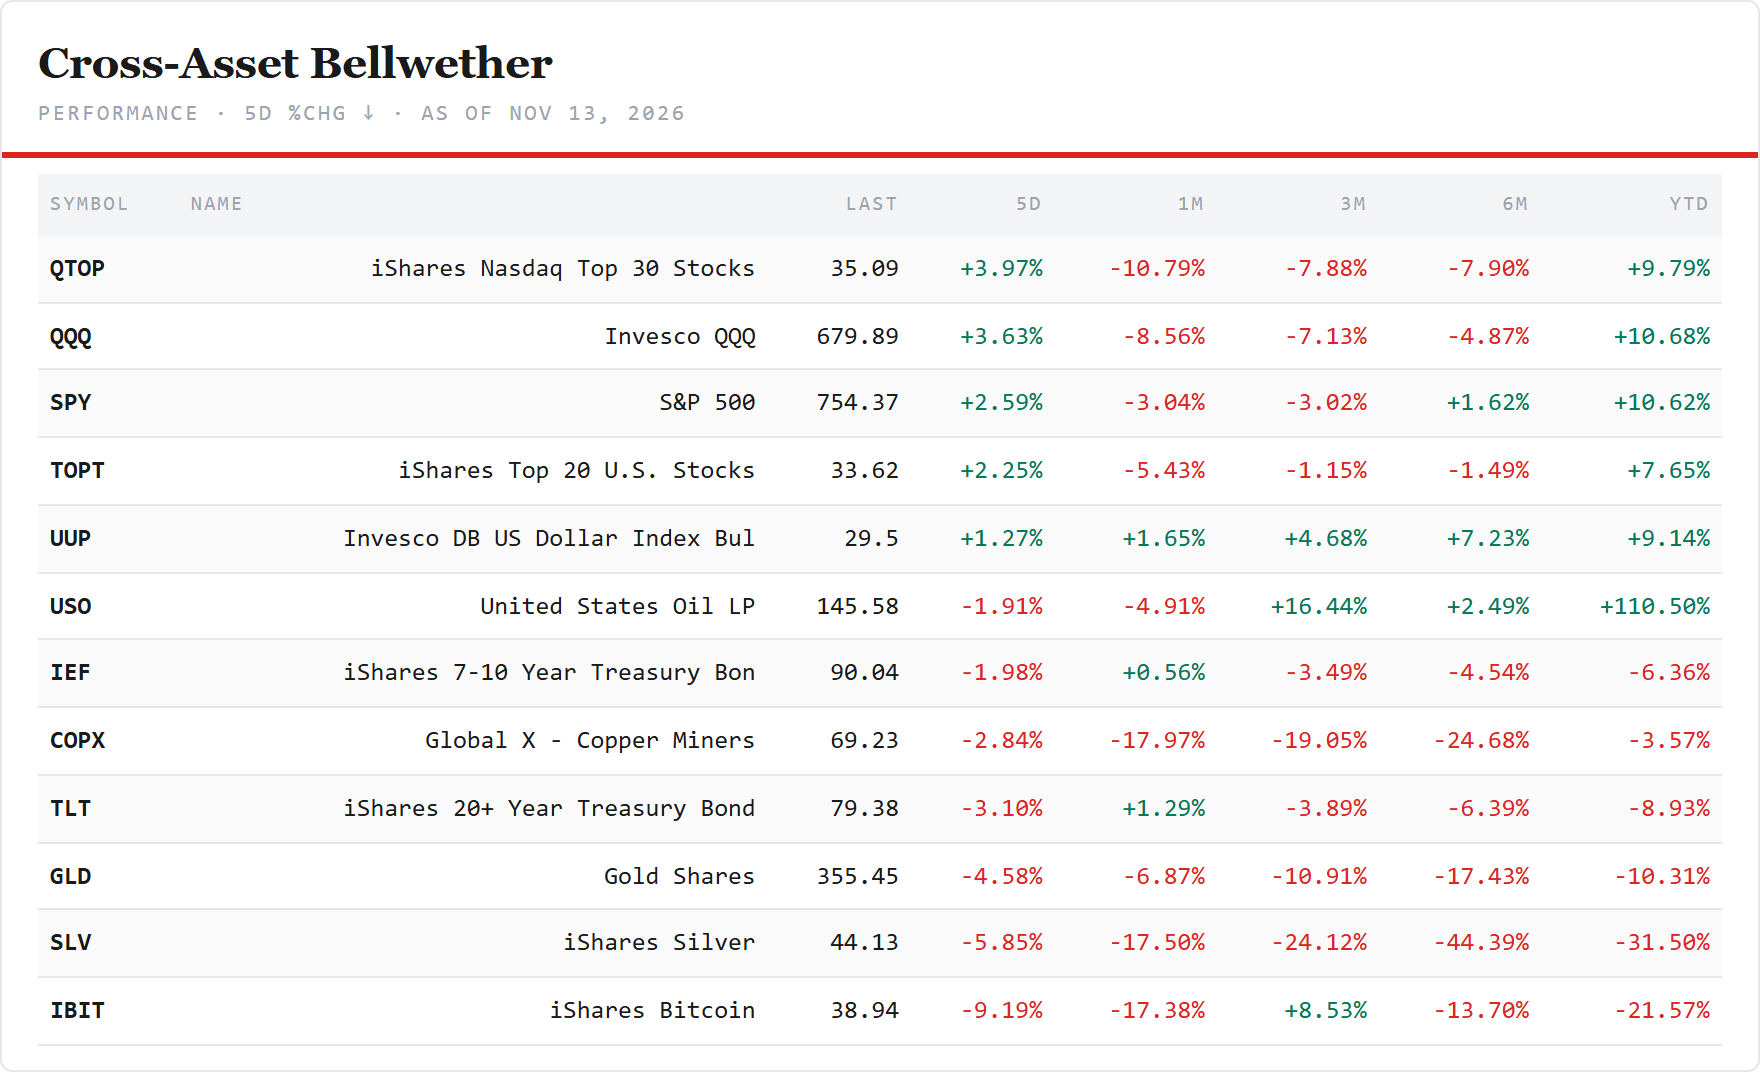
The tech ETFs — sixteen of twenty-one green, the chips on top. The WisdomTree AI fund +6.57%, the S&P semiconductor fund +6.13%, quantum +5.46%, the fabless fund +5.27%, the internet-of-things fund +5.27%, SMH +4.91%, cybersecurity +4.39%. Software (IGV) rose 2.34% to 101.19 — back above 100. The red was small: lithium and batteries −3.53%, ARK innovation −0.62%, fintech −0.46%, digital transformation −0.15%, uranium −0.06%. Last week nothing paid for Thursday; this week Monday and Wednesday paid for Friday.
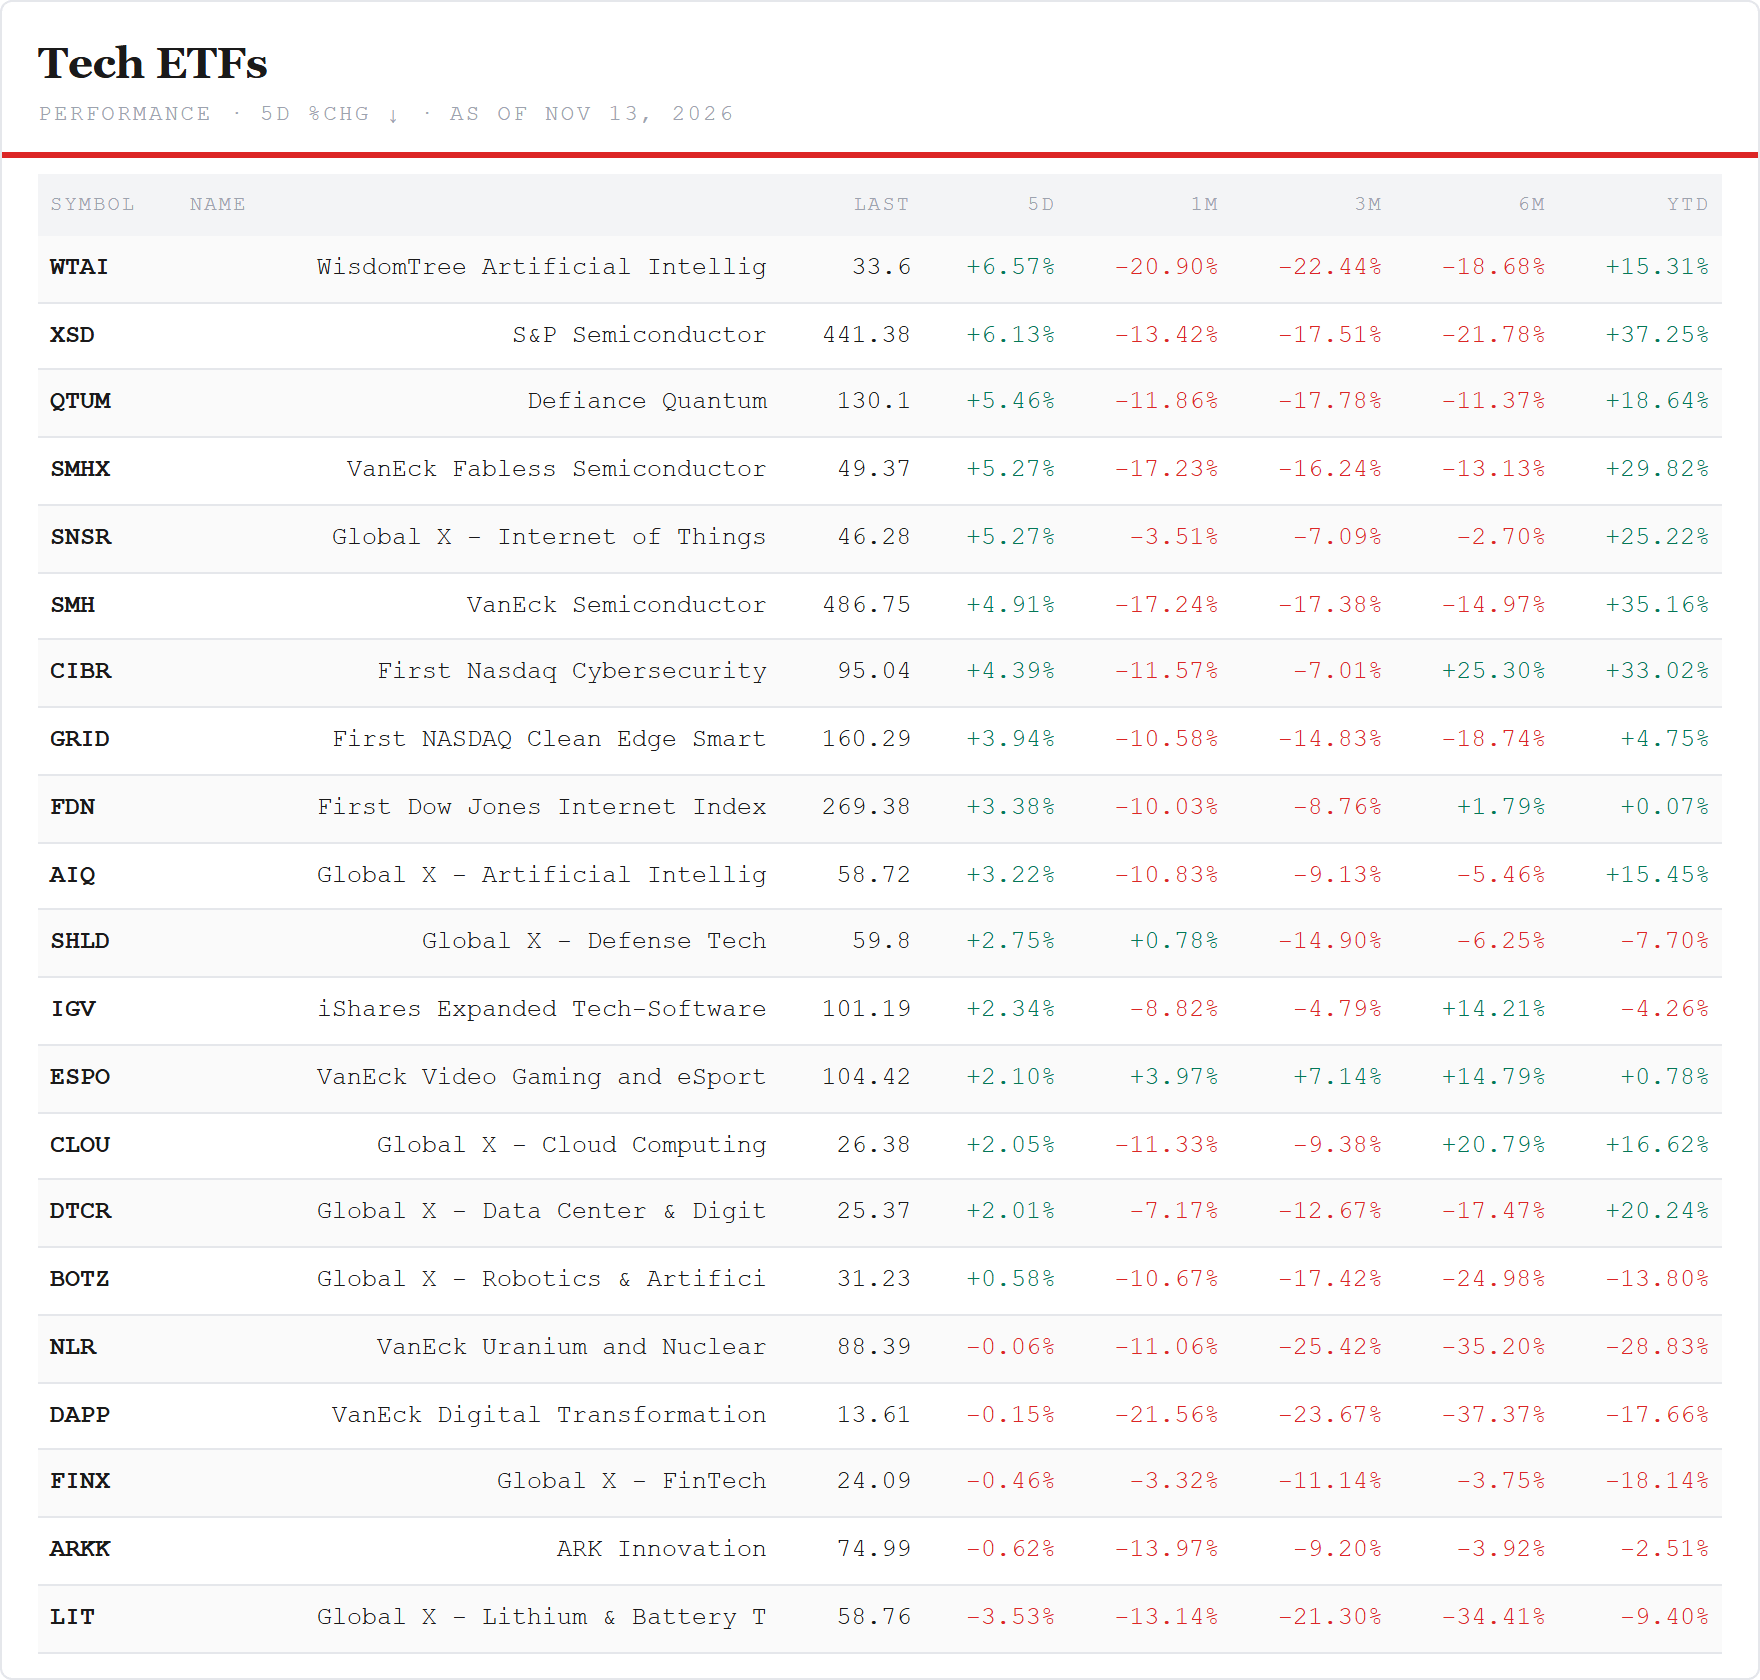
The AI adoption funds — a new board, all eight green, none at the top. From this week the letter carries a second AI board. The tech board above measures the companies that build AI; this one follows funds that buy the other side — companies that adopt AI and expect to benefit from using it, plus the software and cloud funds they are usually compared with. Cybersecurity +4.39%, the Invesco AI enablers fund +3.24% (in euros, on Xetra), the iShares Future AI Beneficiaries fund +2.69%, software +2.34%, the WisdomTree cloud fund +2.11%, the Global X cloud fund +2.05%, the iShares AI Adopters & Applications fund +1.74% (euros, Xetra), and software and services (XSW) +1.63%. On the week every one of them trailed the chip funds. On the month the order turns: the beneficiaries fund +5.74%, software and services +1.25%, the adopters fund −0.04% — against the enablers fund −12.95%, cybersecurity −11.57% and SMH −17.24%. The enablers fund moves with the builders; it sits on this board as the bridge between the two.
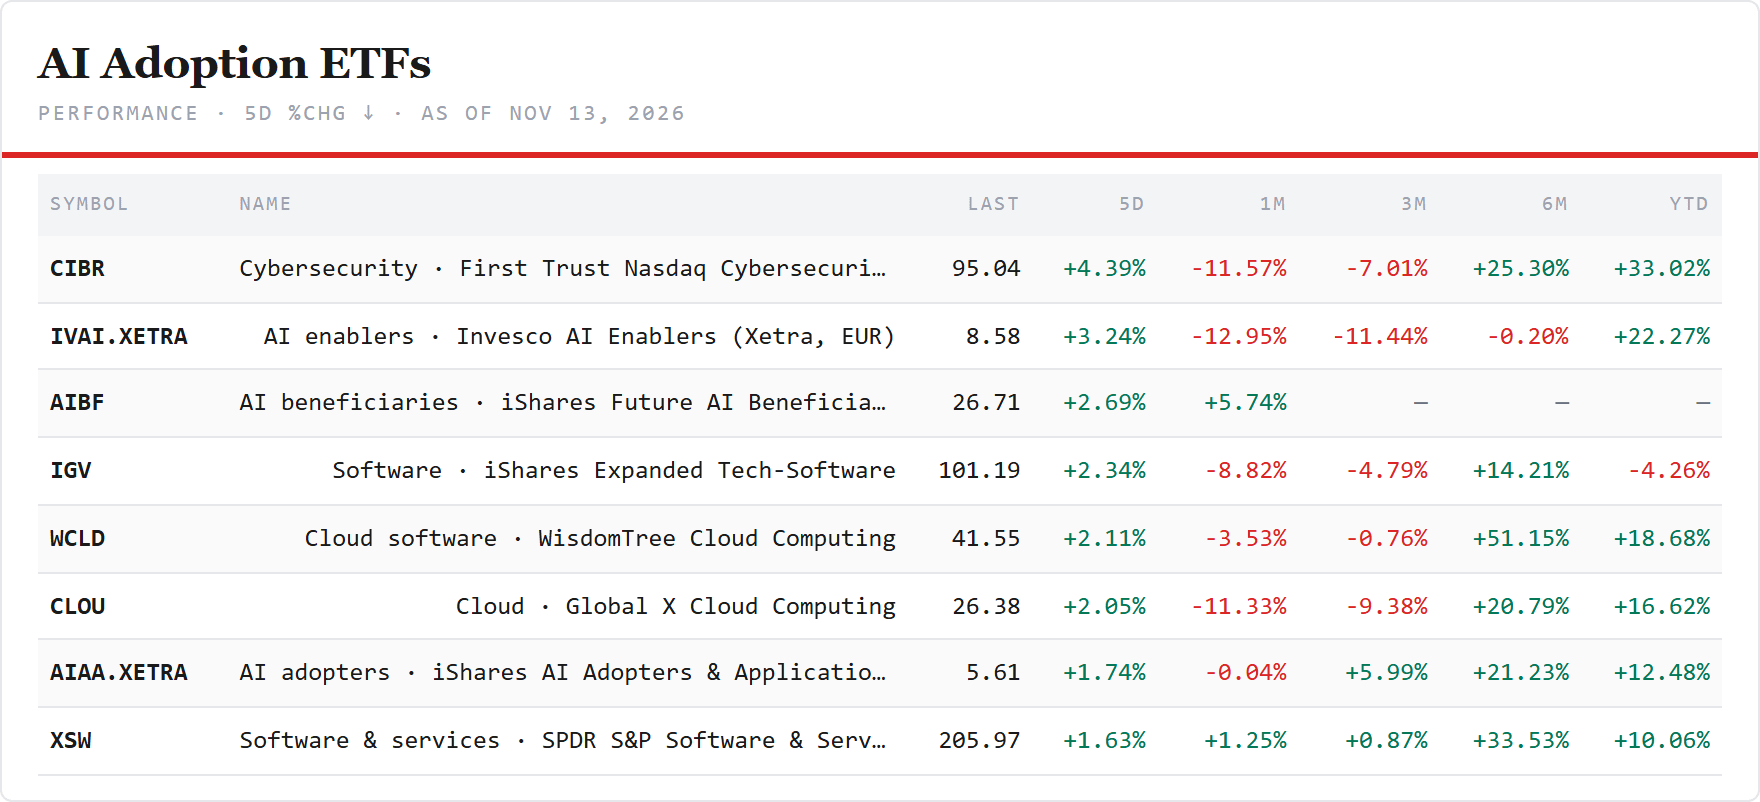
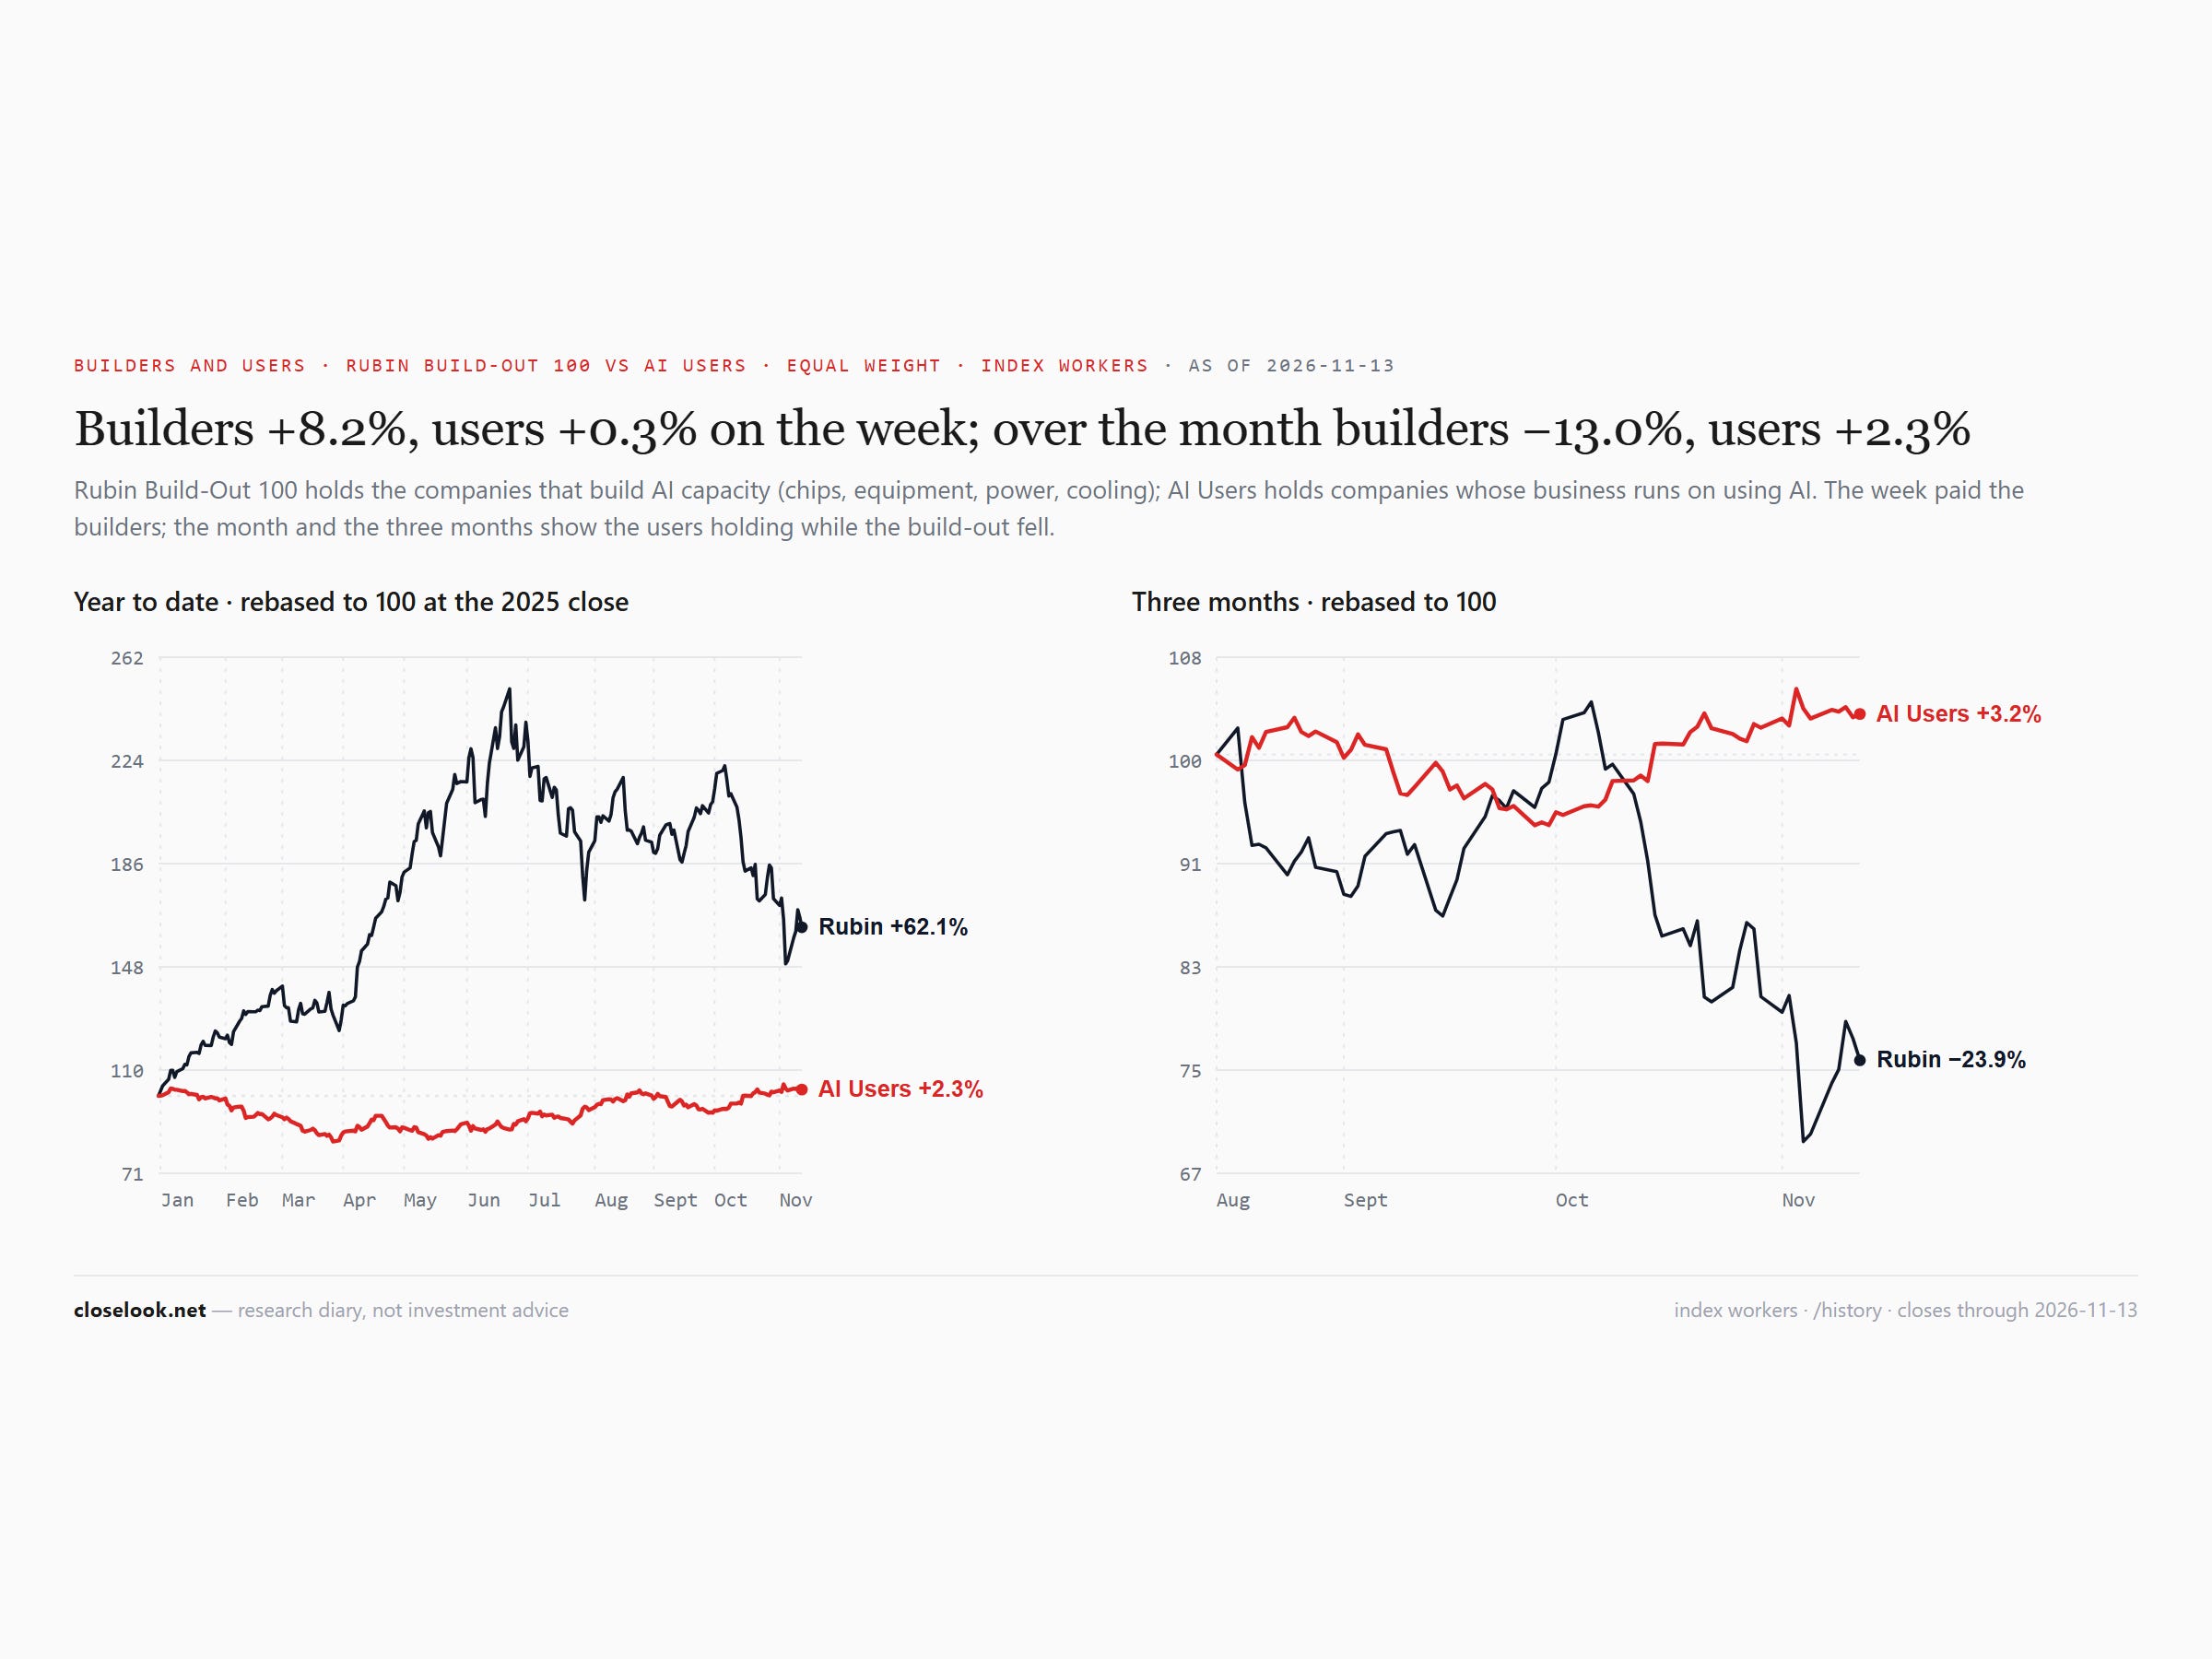
The same split in our own indices. Rubin Build-Out, the builders, +8.20% on the week; AI Users, the companies that run on using AI, +0.35%. Over the month the order is reversed: builders −13.0%, users +2.3%; over three months the builders are down about a quarter, the users up about 3%. On the year the builders still lead by a wide margin, about +62% against about +2%. This is the split the house books have started to act on — Saturday’s Pulse has the trades.
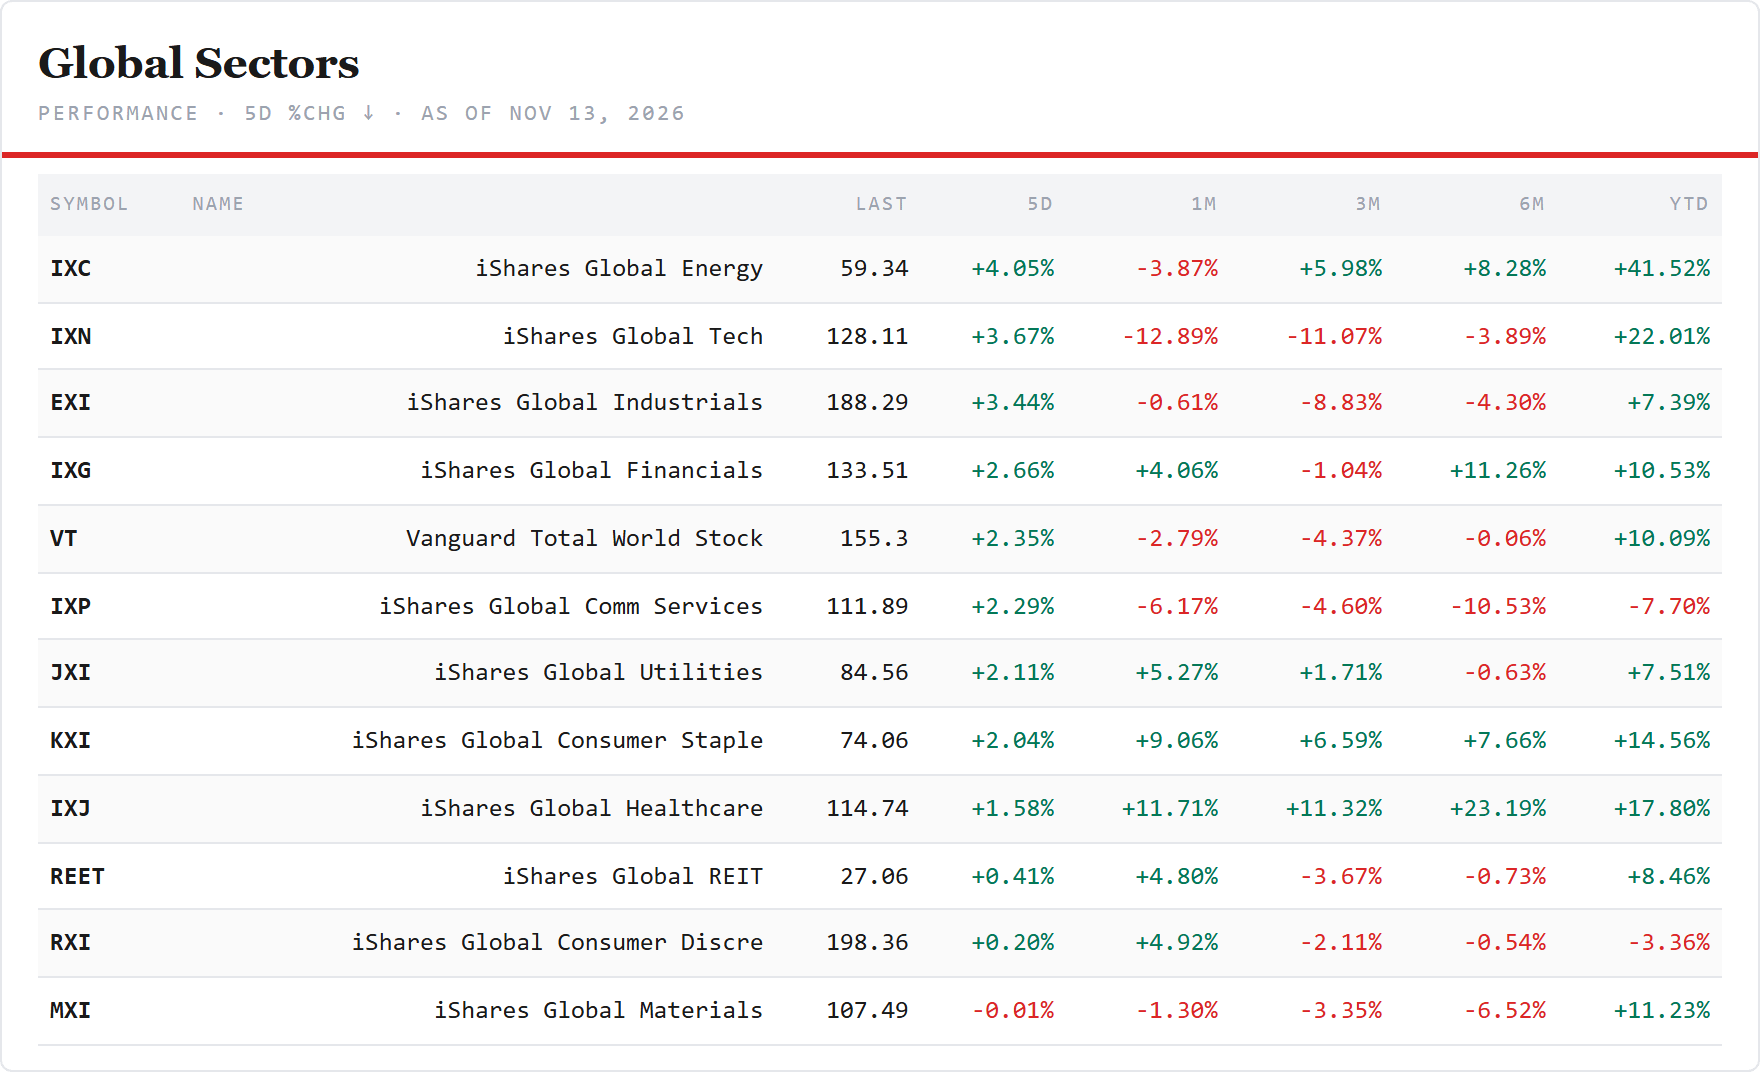
The global sectors — ten of eleven green, energy and tech on top. Energy +4.05% to 59.34, technology +3.67% to 128.11, industrials +3.44%, financials +2.66%, communication +2.29%, utilities +2.11%, staples +2.04%, health care +1.58%, real estate +0.41%, discretionary +0.20%. Materials ended flat, −0.01%. A week ago energy and tech were the two that fell; this week they were the two that rose most.
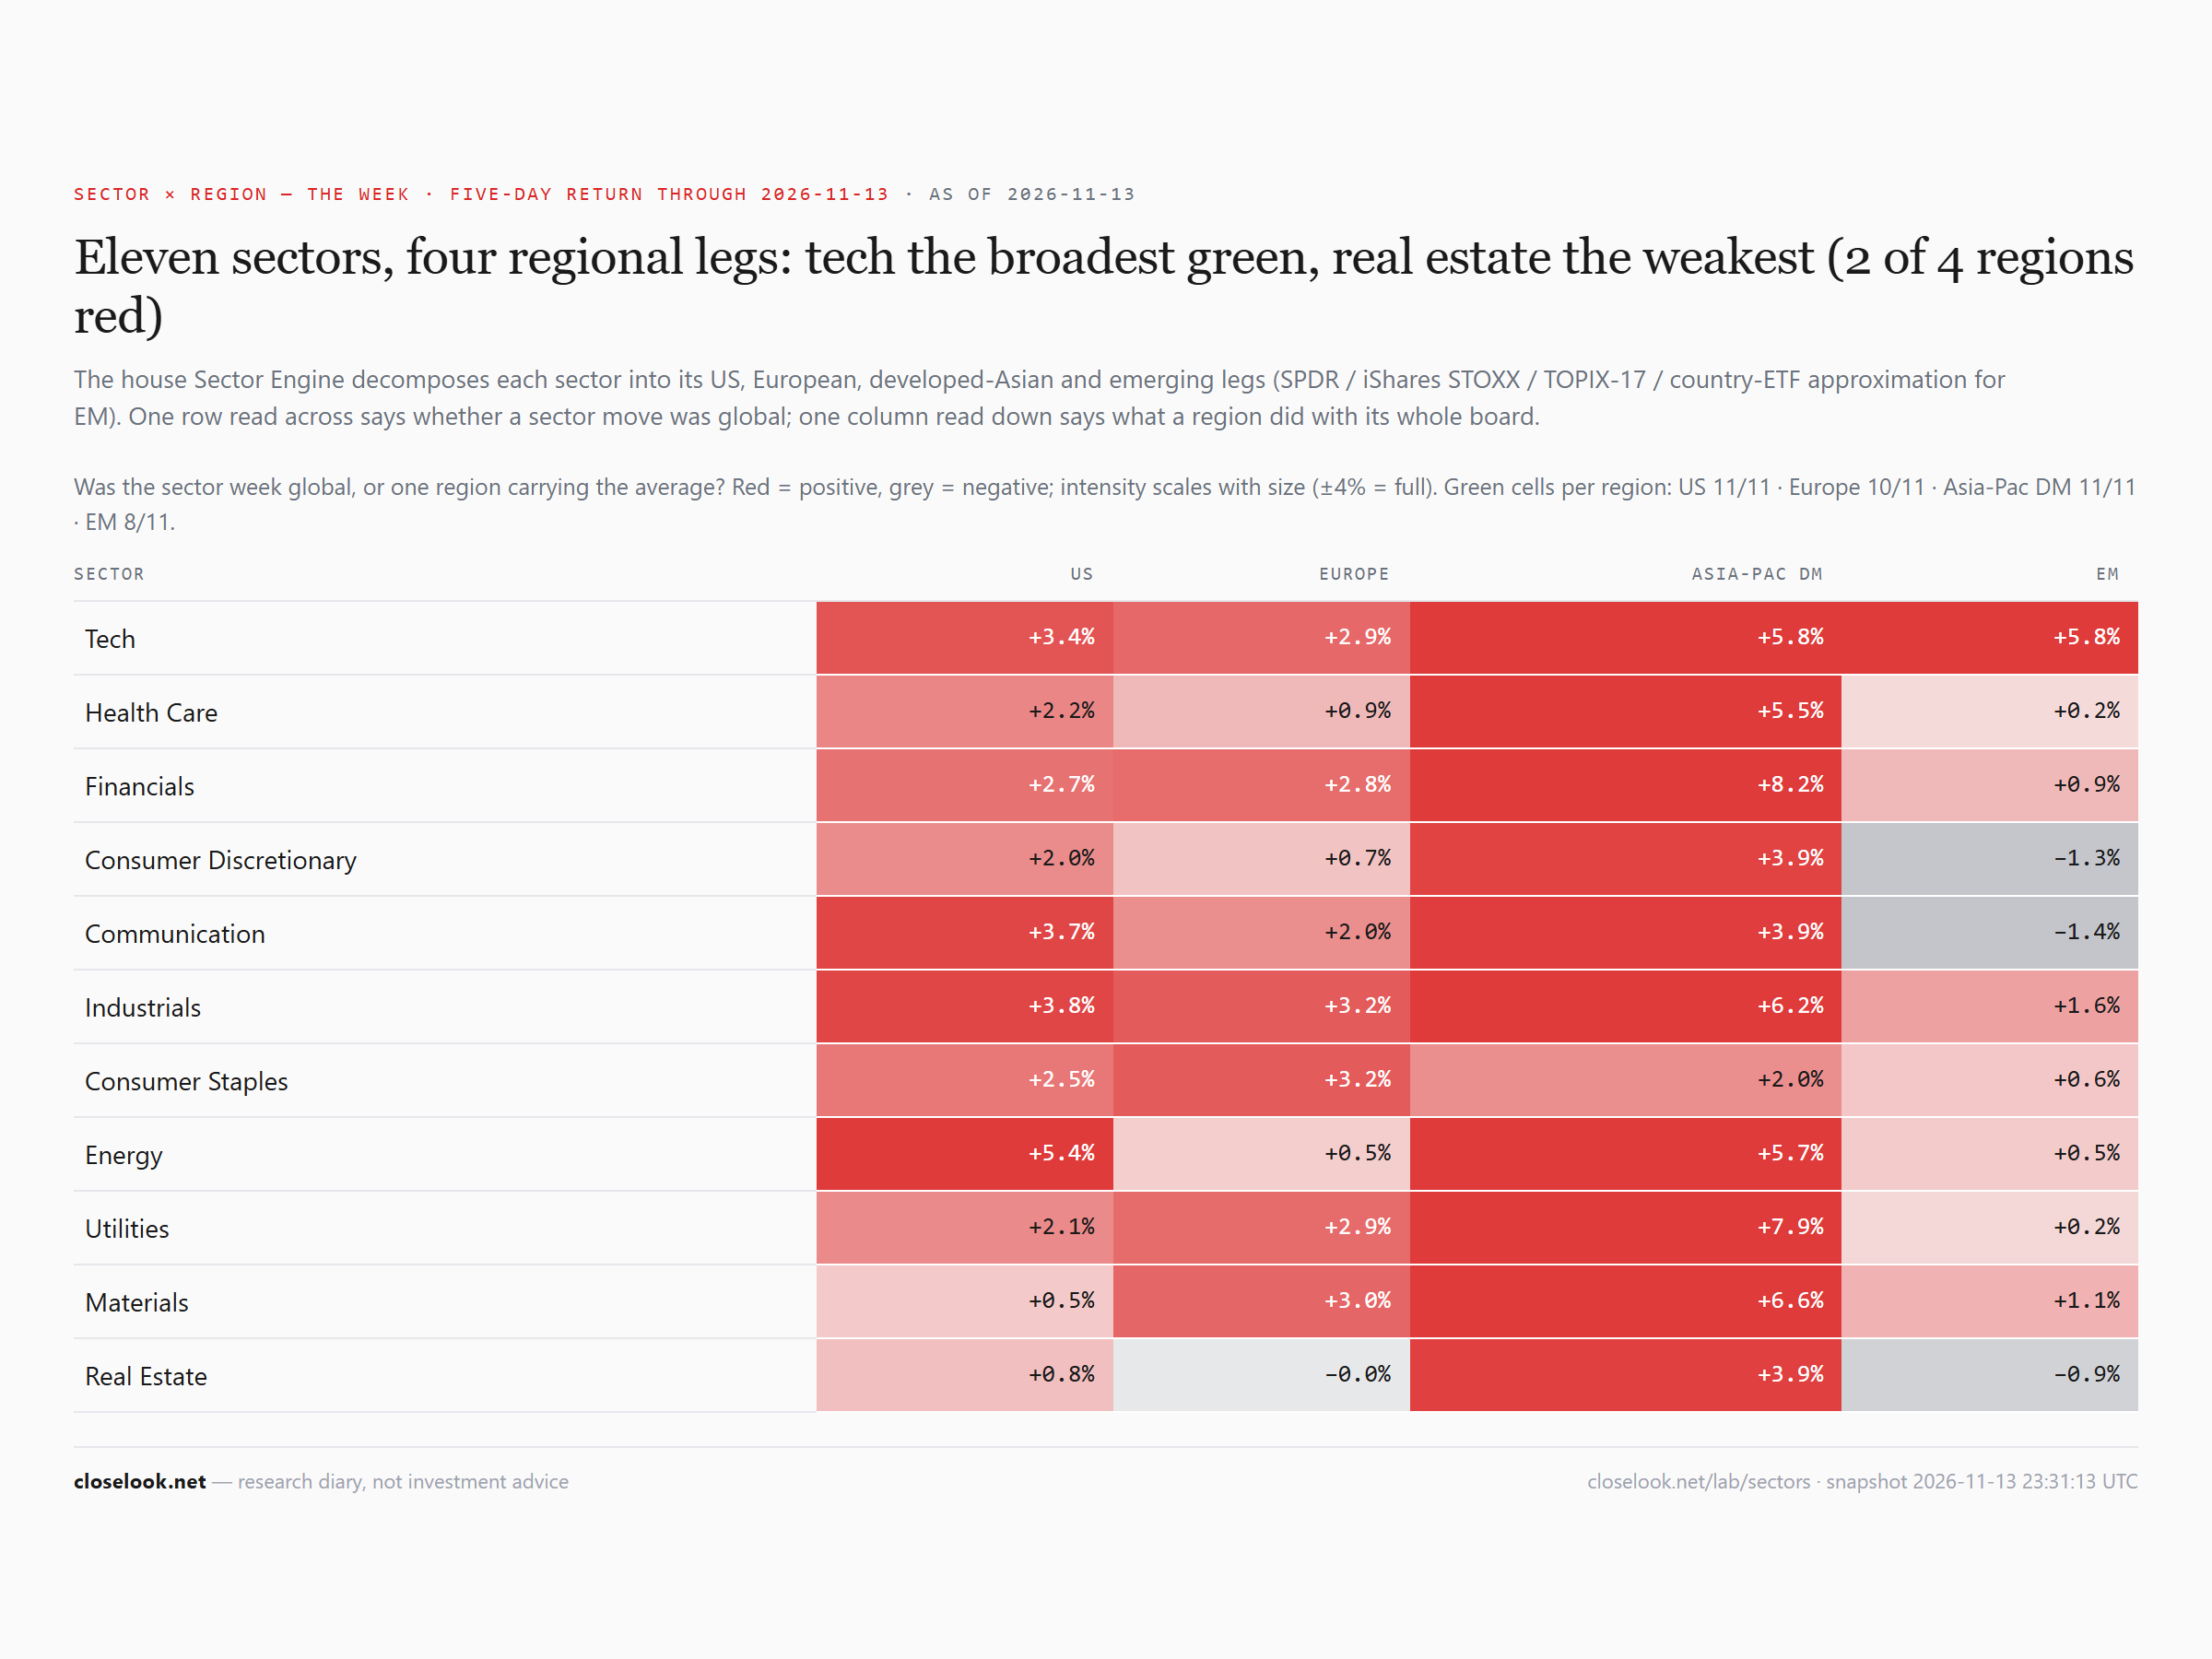
Was the sector week global, or one region carrying it? Technology rose in every region: America +3.4%, Europe +2.9%, developed Asia +5.8%, the emerging markets +5.8%. That is the week’s one global fact, the mirror of last week’s. Energy split again: America +5.4% and developed Asia +5.7%, against Europe +0.5% and the emerging markets +0.5% — a US-minus-Europe spread of +4.9 points. Developed Asia’s financials rose 8.2%, the strongest cell on the board. The red sat in the emerging markets: discretionary −1.3%, communication −1.4%, real estate −0.9%.
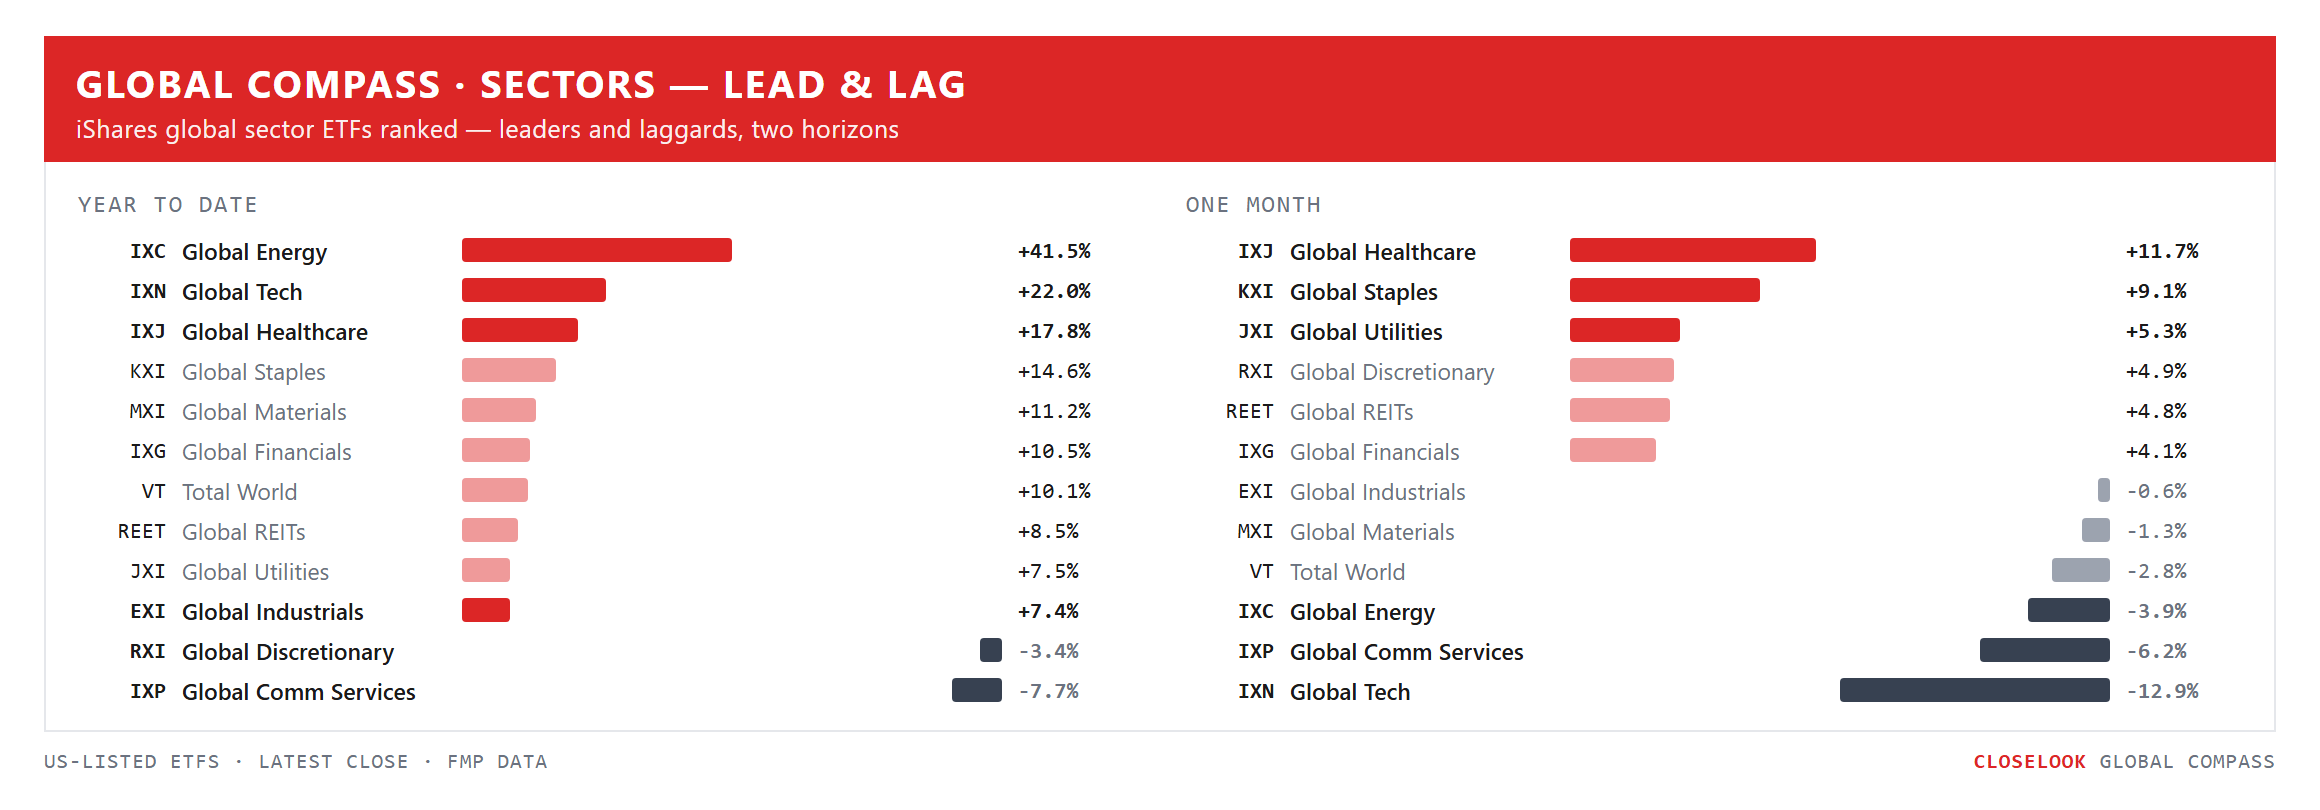
The Global Compass
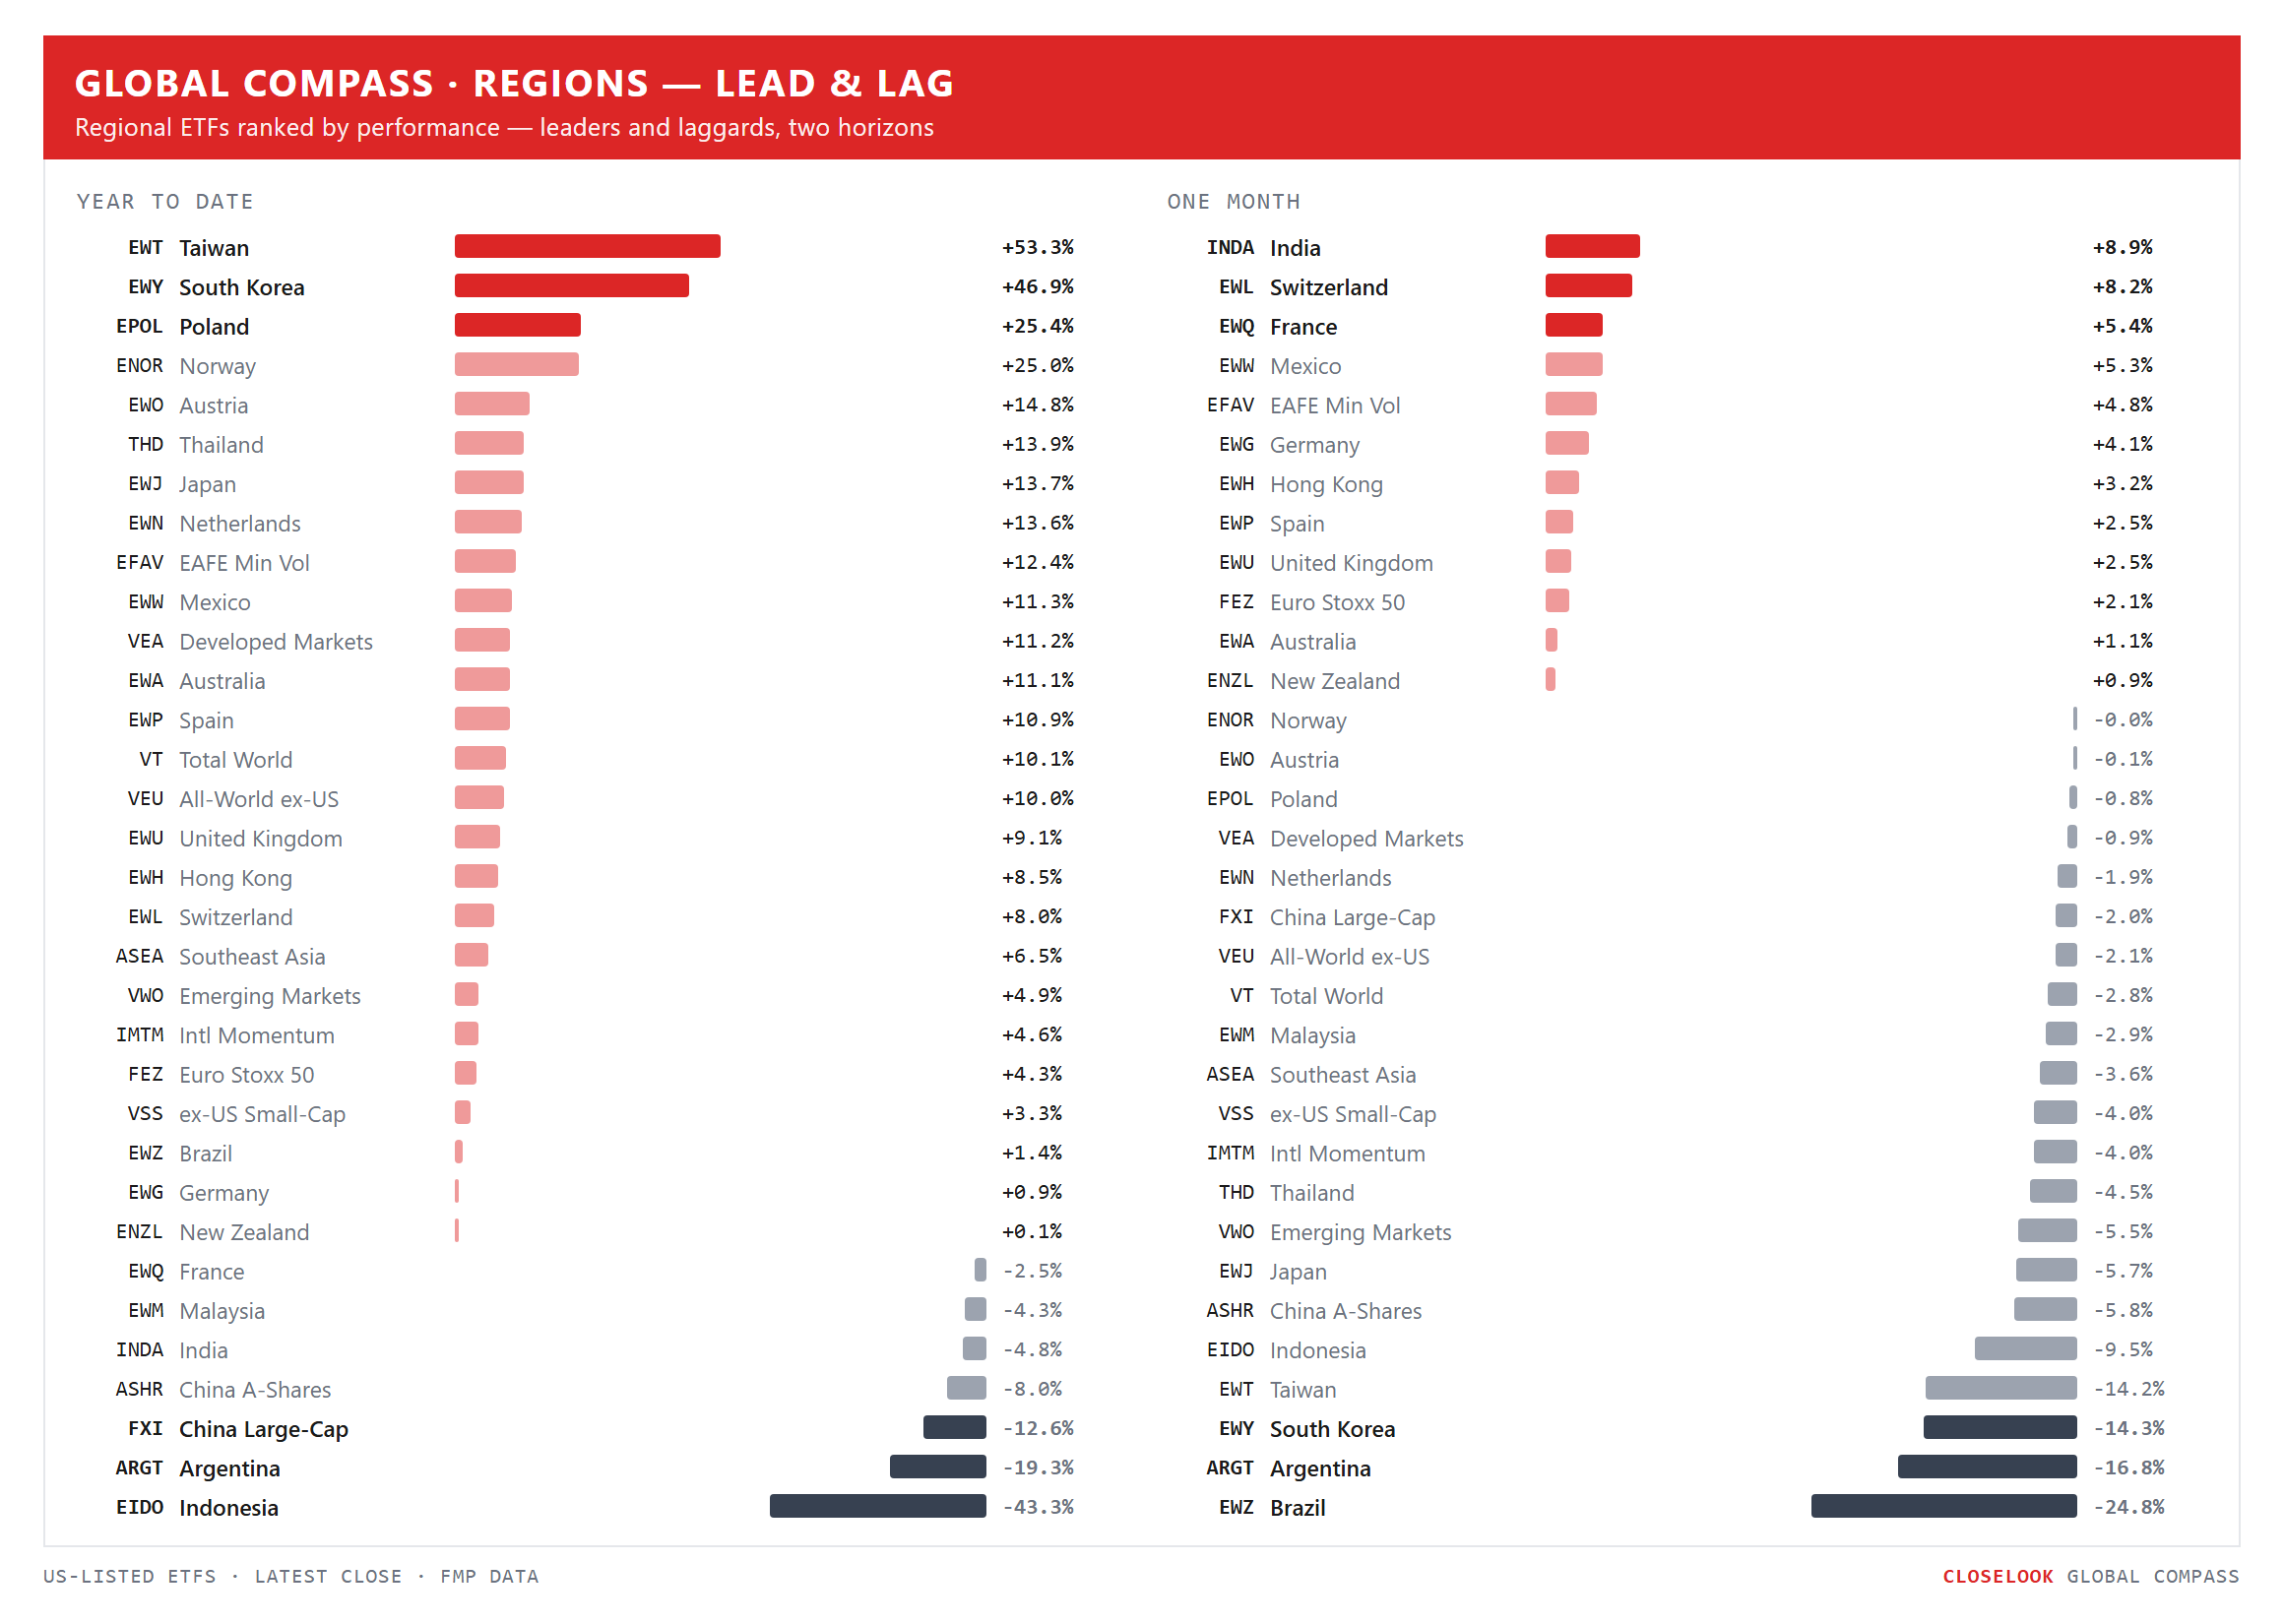
Regions: developed over emerging again. VEA +2.27% against VWO +1.97%. The developed basket carries Japan and Korea, two of the week’s bounces; the emerging basket carries Taiwan, the biggest, but also China and Hong Kong, two of the five funds that fell.
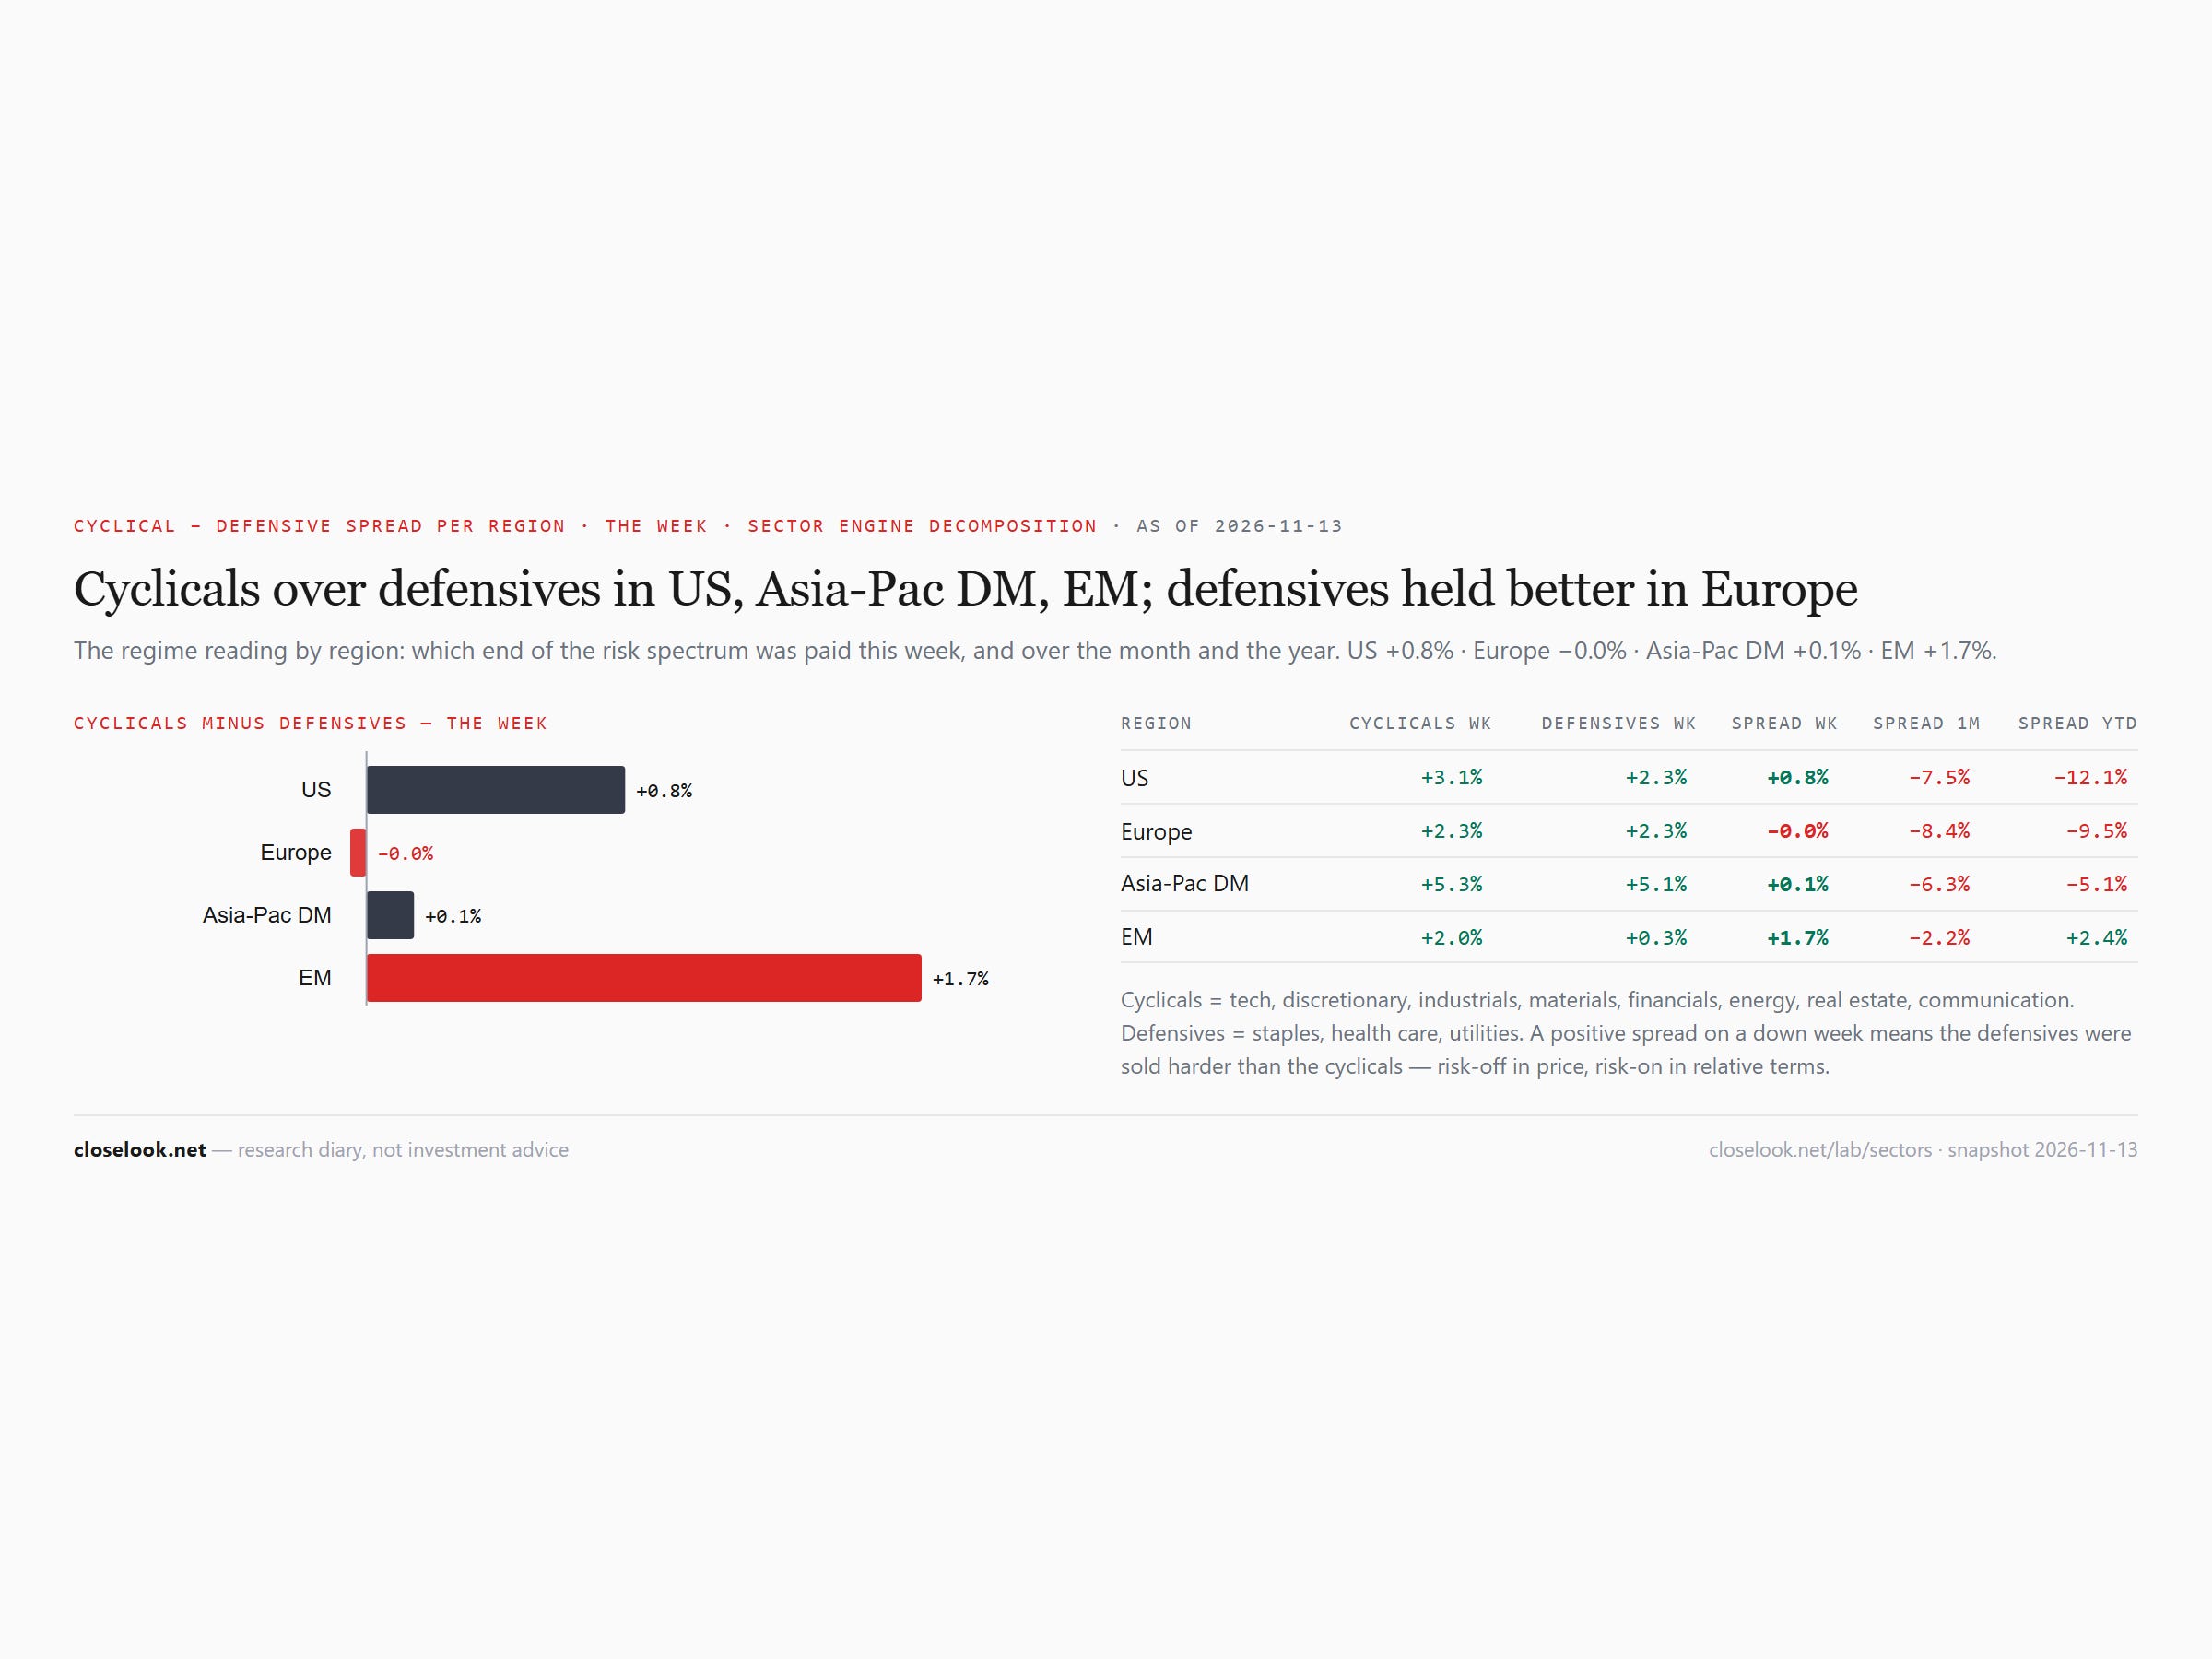
Sectors: the defensive streak paused. The engine’s cyclical-minus-defensive spread was +0.8 points in the US, level in Europe, +0.1 in developed Asia and +1.7 in the emerging markets. Last week all four regions leaned defensive, a fifth week in a row; this week none did. On the month the spread is still −7.5 points in the US and −8.4 in Europe, and on the year −12.1 in the US — one week does not undo that.
Sectors: the leaders’ bench. Technology 128.11, 16.2% under its October 6 record. Industrials 188.29, 9.0% under August. Financials 133.51, 2.5% under the September 3 record. Materials 107.49, 9.3% under its August high.
Stay home vs go global — the US view. This week America beat the world: SPY +2.59%, VT +2.35%, VEU +2.09%. On the year the three sit within seven tenths of a point: +10.62% for America, +10.09% for the world, +9.99% for the world ex-US.
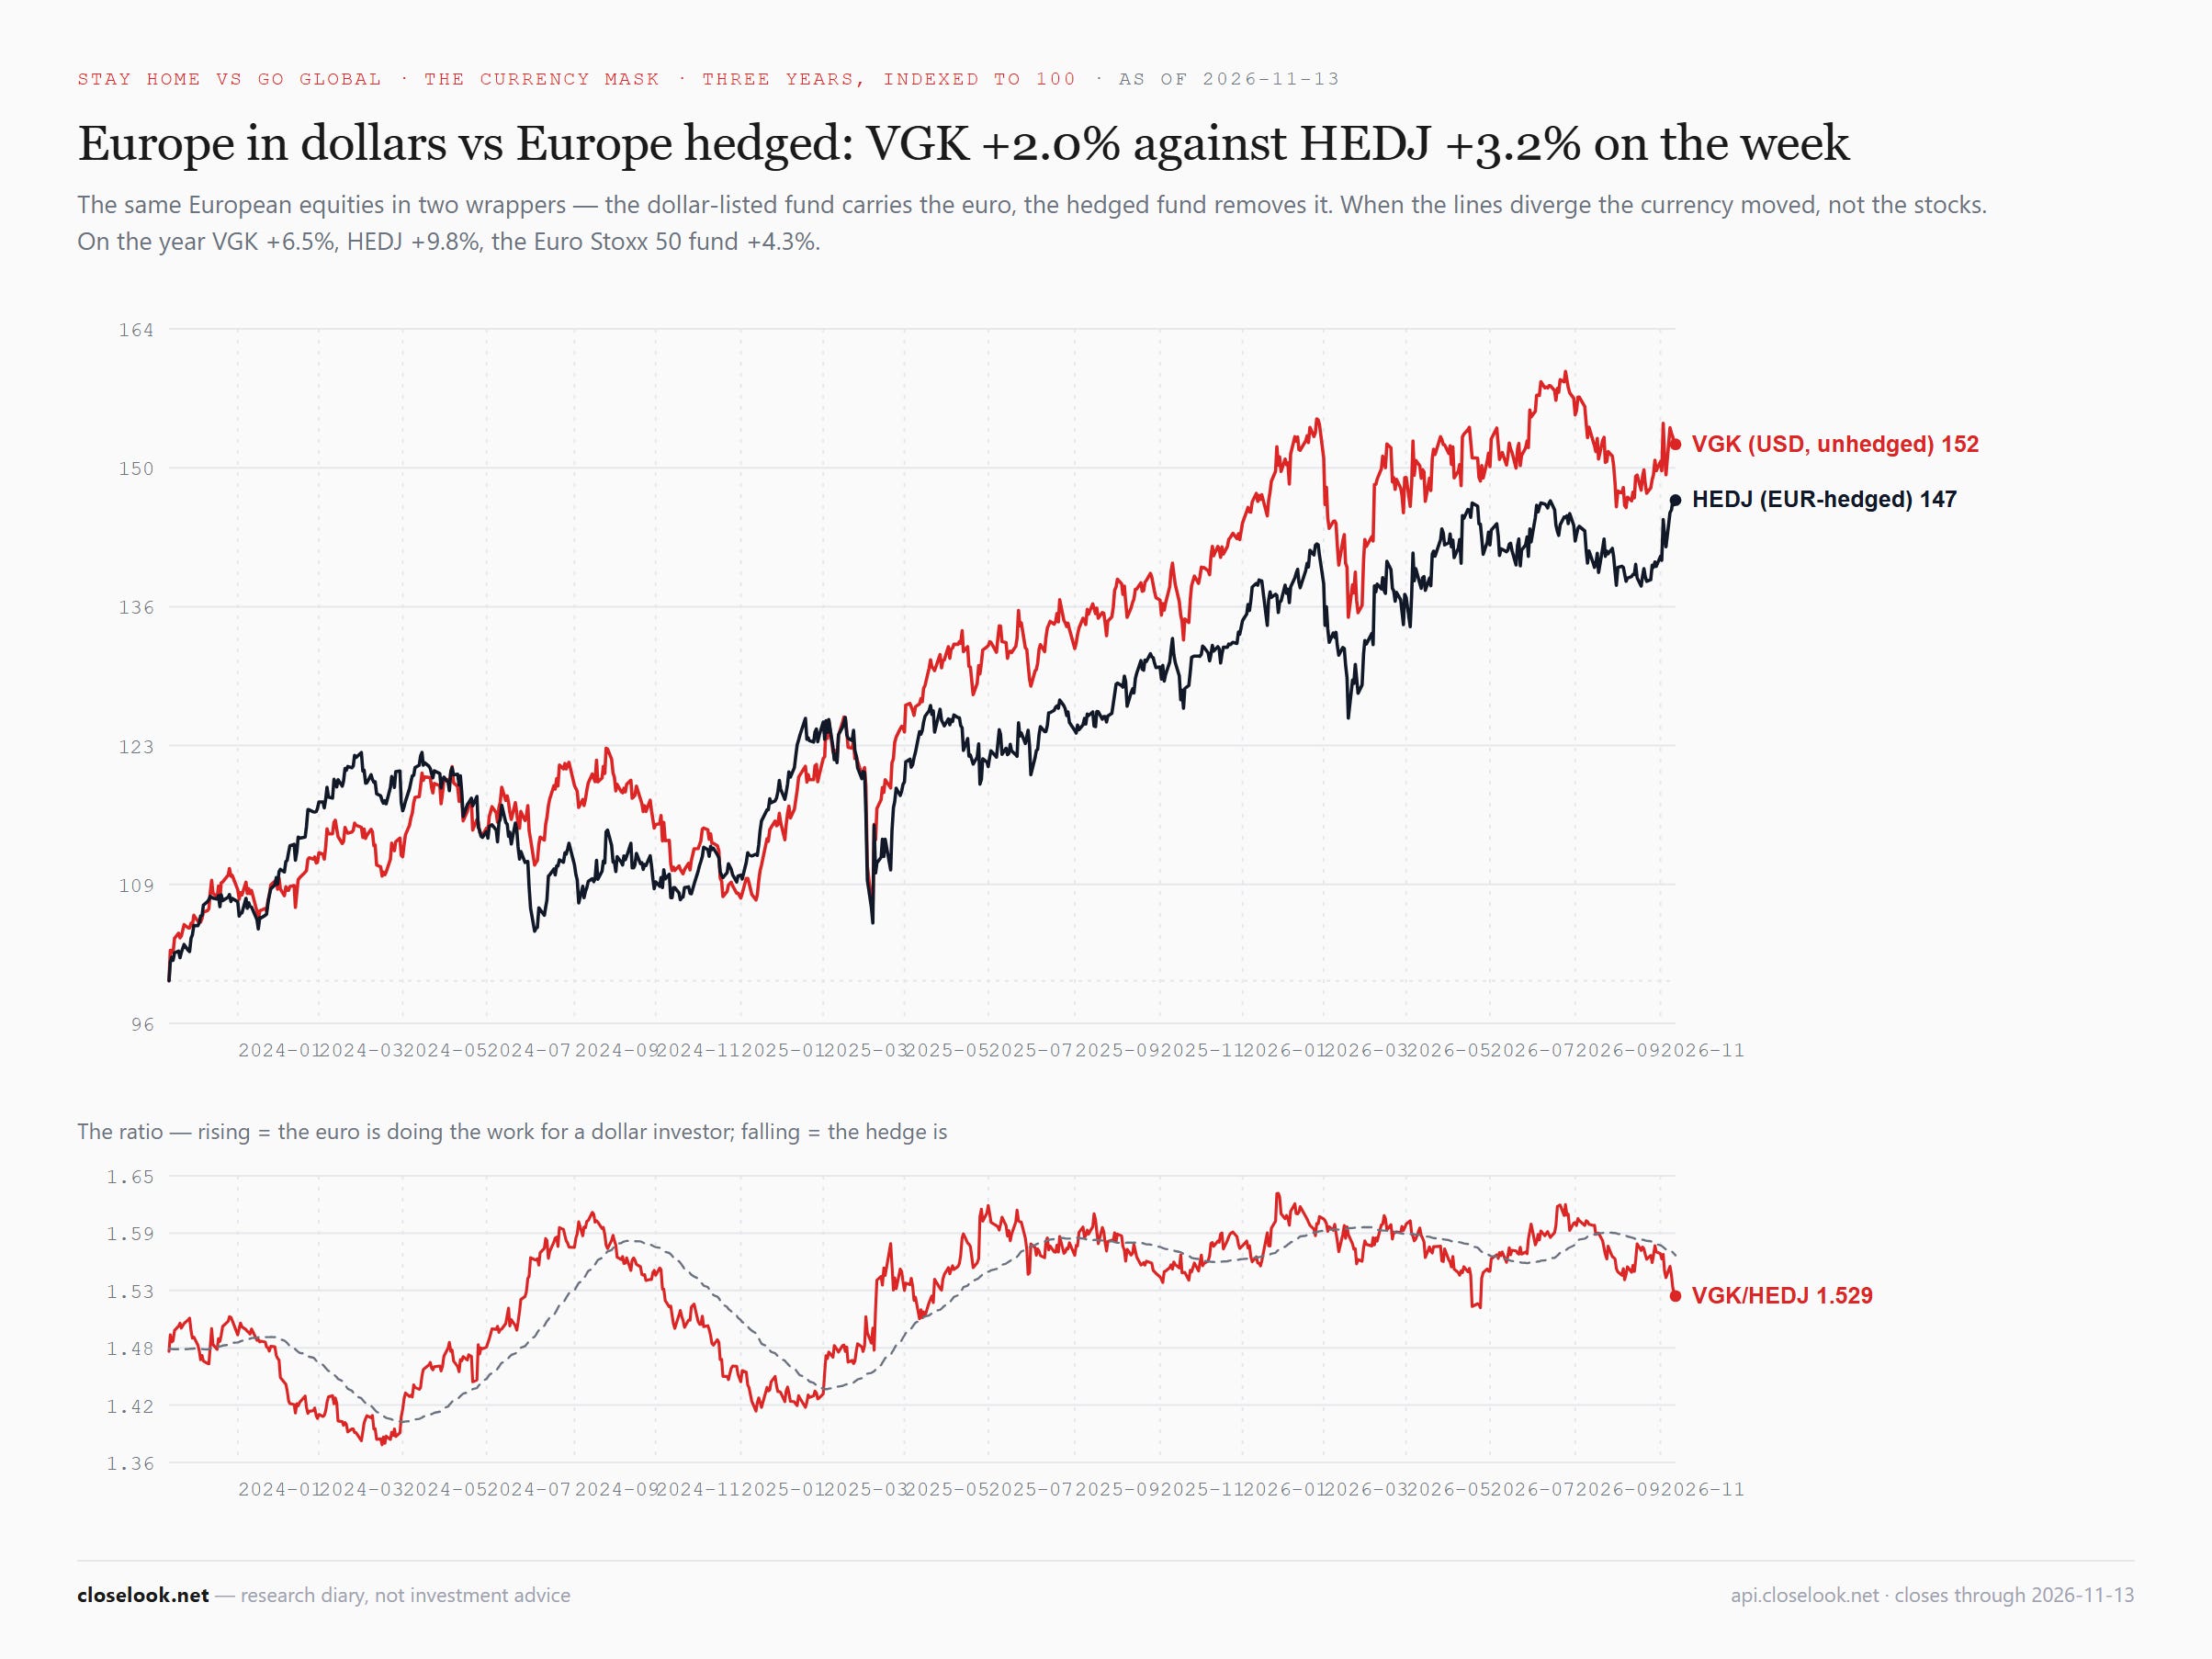
Stay home vs go global — the Europe view: higher in euros, less so in dollars. In local terms: the STOXX 600 +2.44% to 664.14, its highest close of the past year; the DAX +3.60% to 26,750, after 26,772 on Thursday, also a one-year high; the CAC +2.82% to 8,369; the Euro Stoxx 50 +3.51% to 6,387 — and outside the euro the FTSE 100 +2.02% to 10,889 and Switzerland’s SMI +2.09% to 15,106, after a one-year high close of 15,149 on Thursday. Spain’s IBEX rose 3.36%. The dollar-listed Europe fund rose 1.98%, the euro-hedged one 3.20% to 58.24, its highest close of the past year; the euro fell to 1.1050 on Thursday, its lowest close of the year. The French fund rose 2.31% to 43.88, 6.4% above the low of the year it made on 12 October.
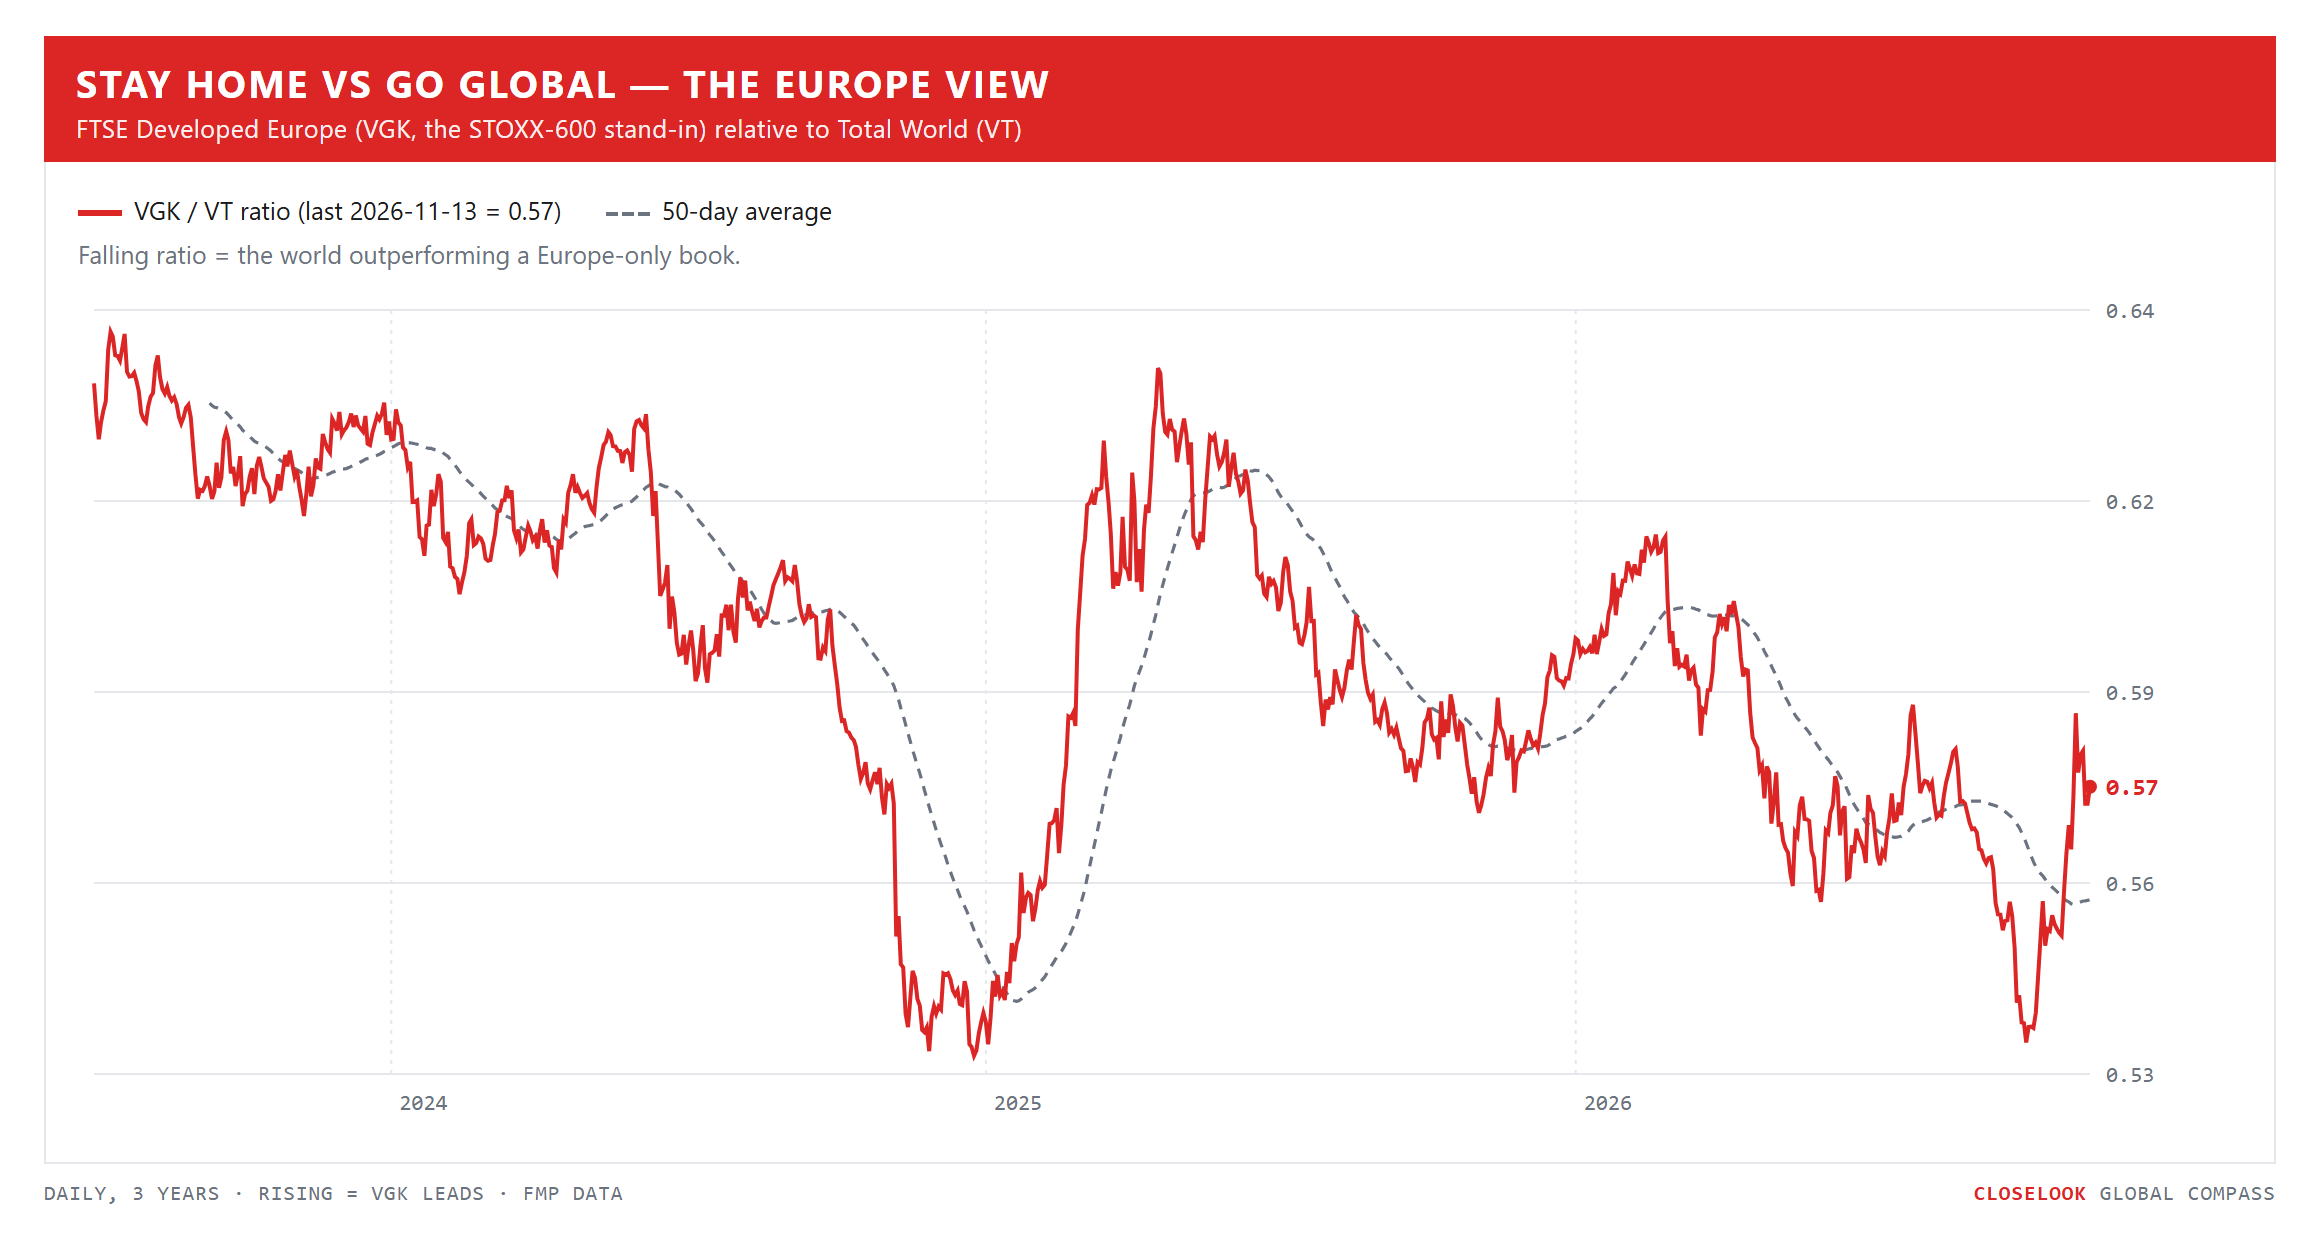
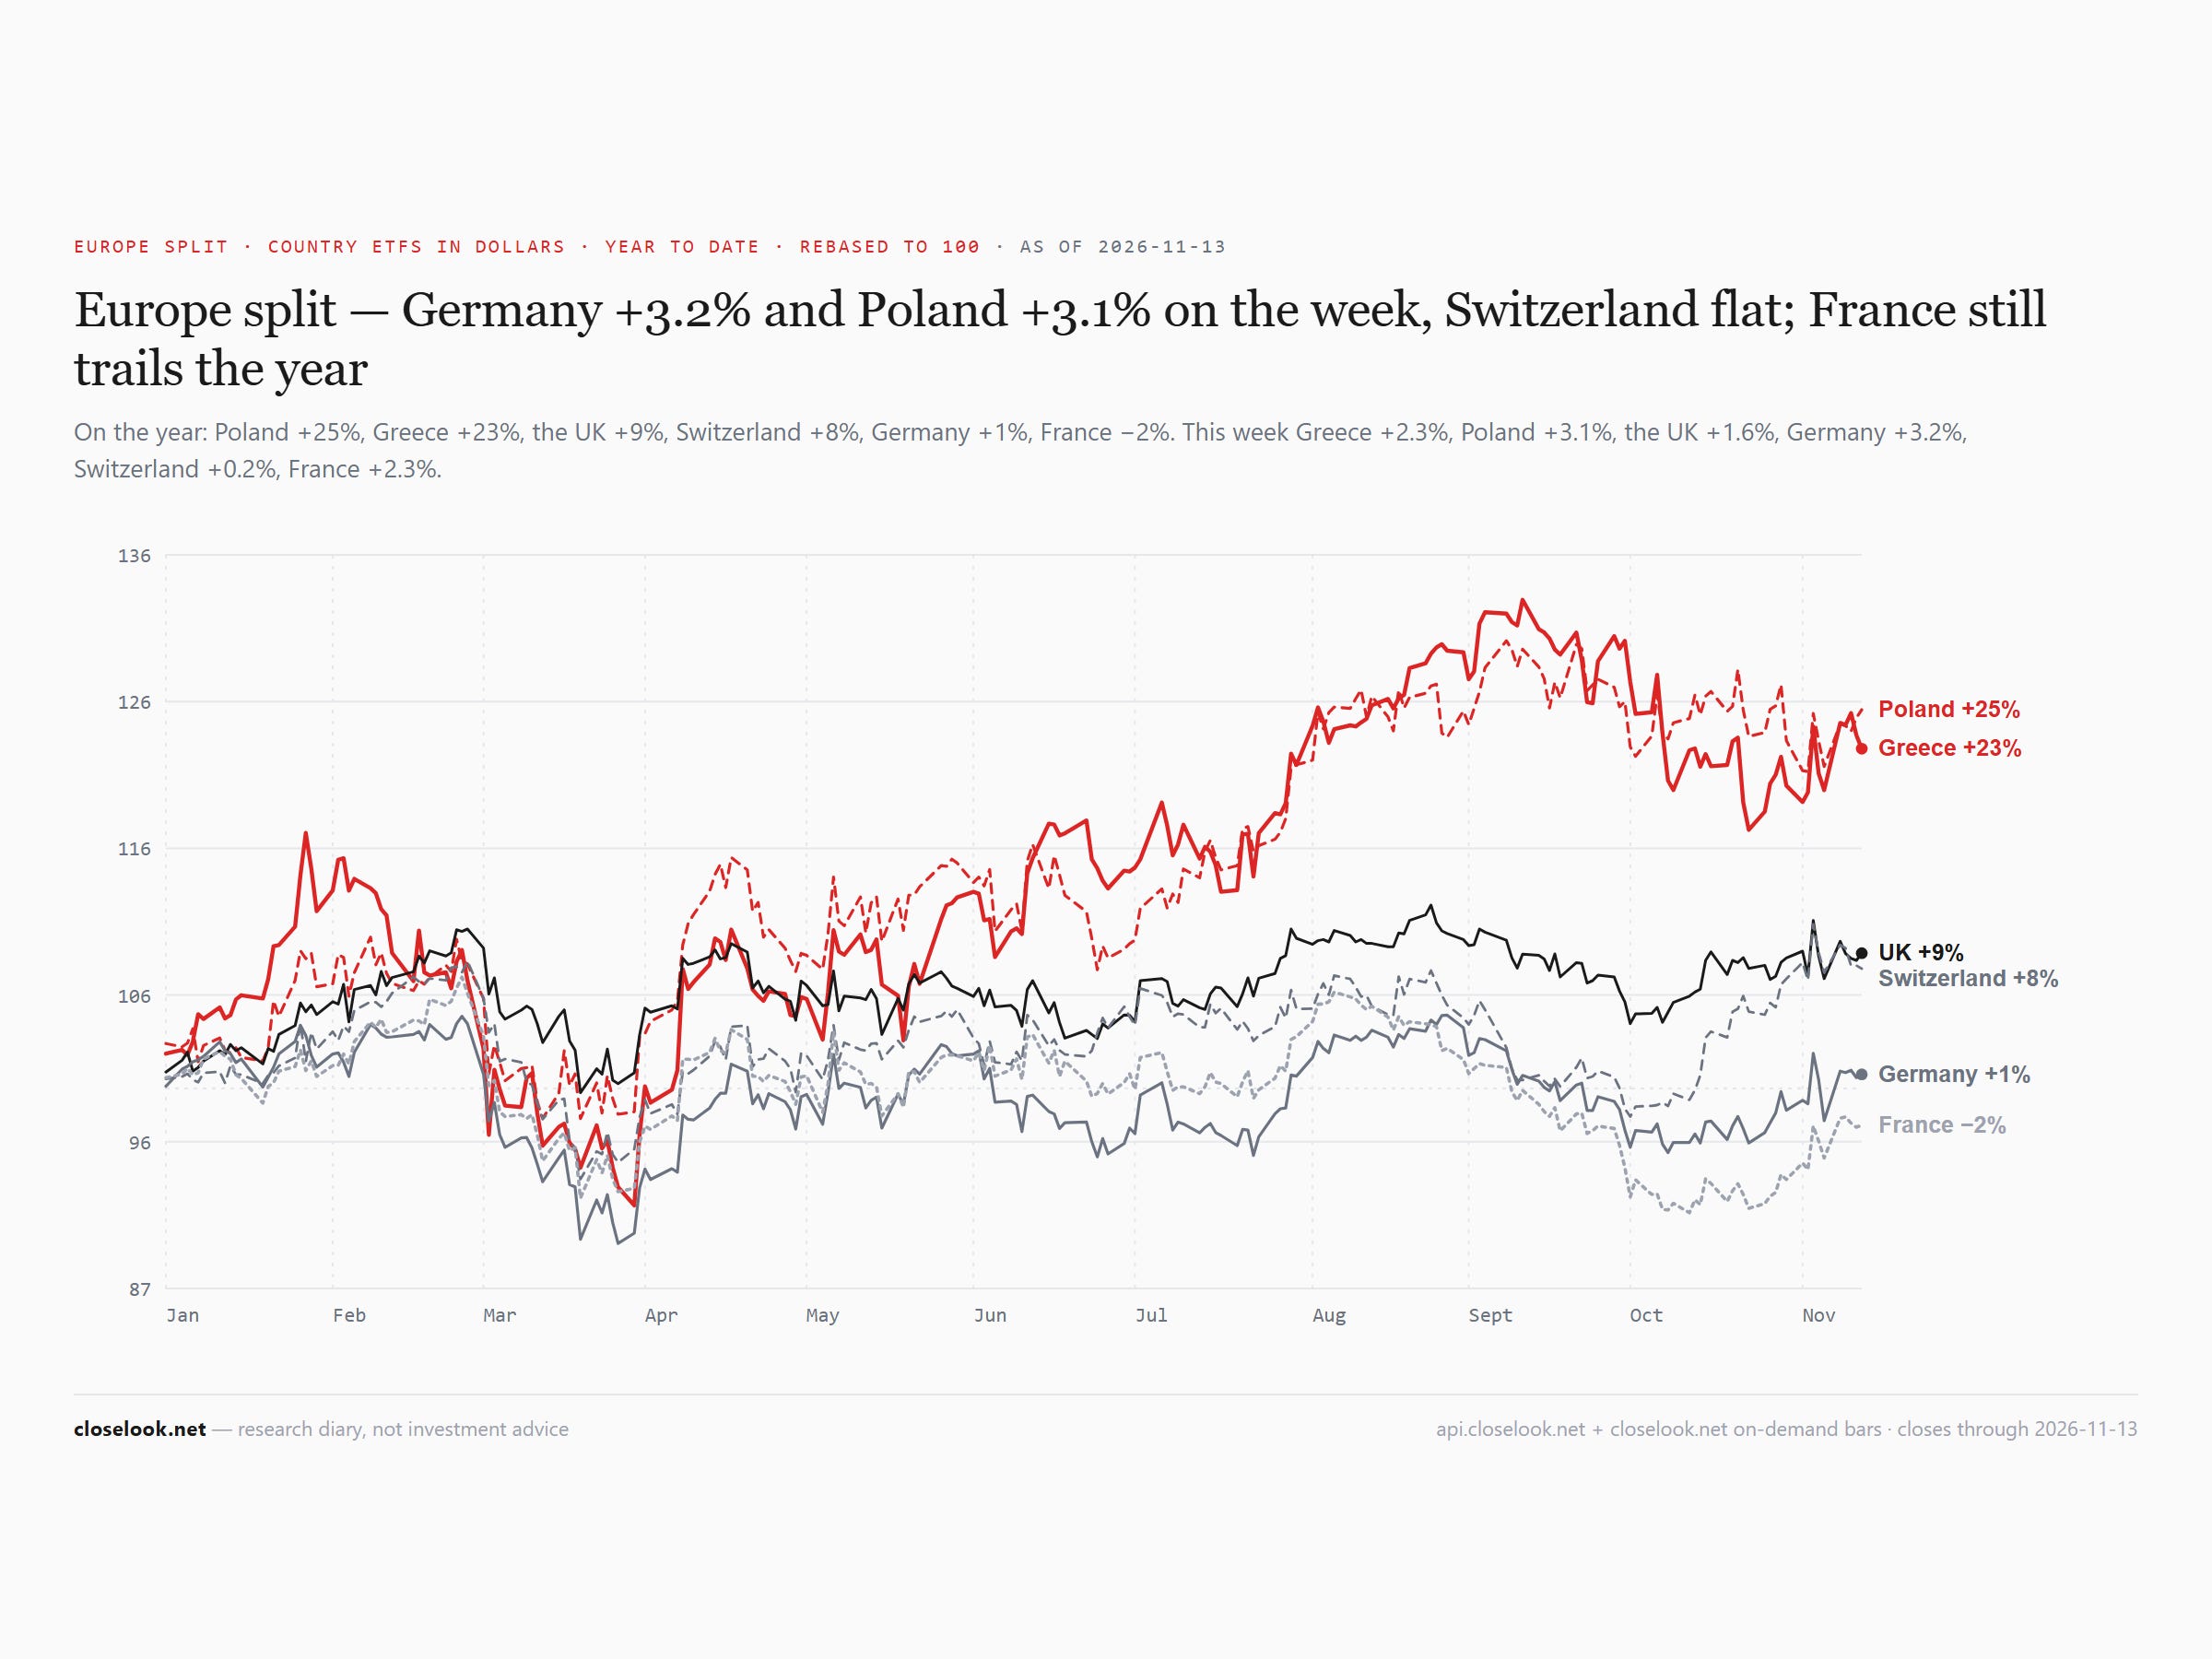
Europe split — everyone up, Switzerland barely. Spain +3.4%, Germany +3.2%, Poland +3.1%, Austria +2.9%, France and Greece +2.3%, the Netherlands +2.2%, Norway +2.1%, Britain +1.6%, Switzerland +0.3%. Last week the Netherlands and Norway fell with the chips and oil; this week the Netherlands rose with the chips, and Norway rose too, even as the oil fund fell. On the year France still trails the six markets on the chart.
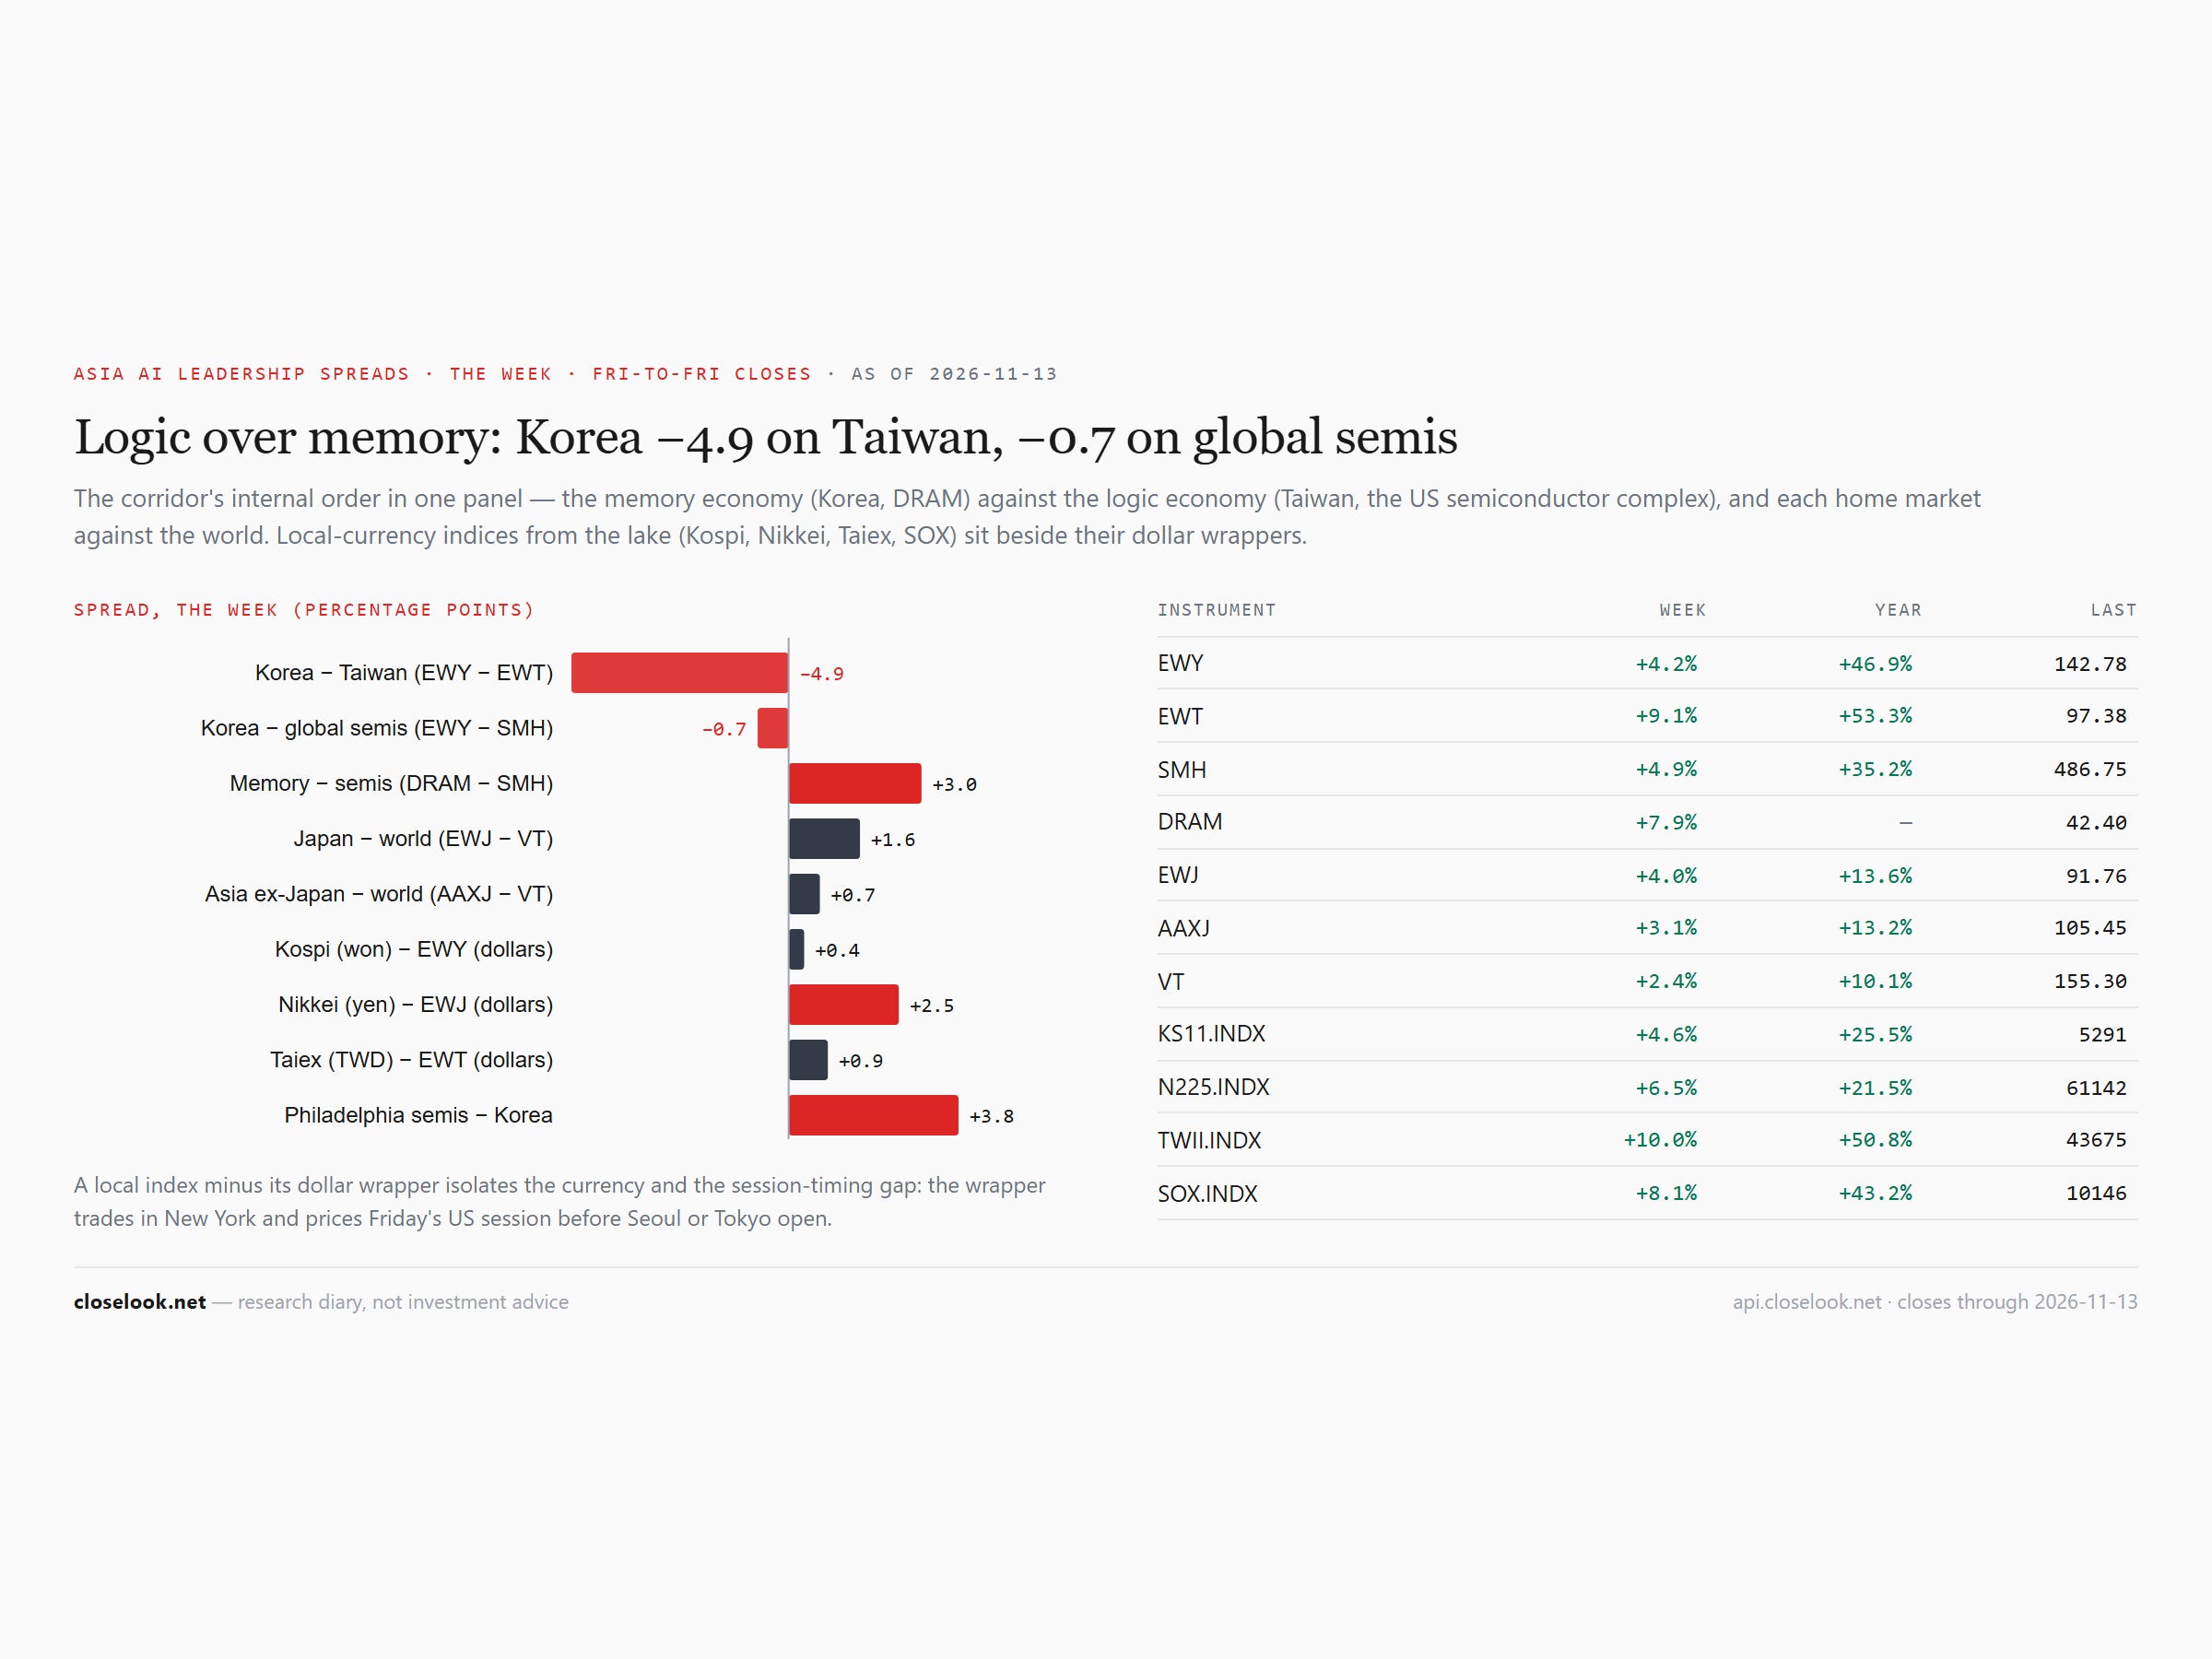
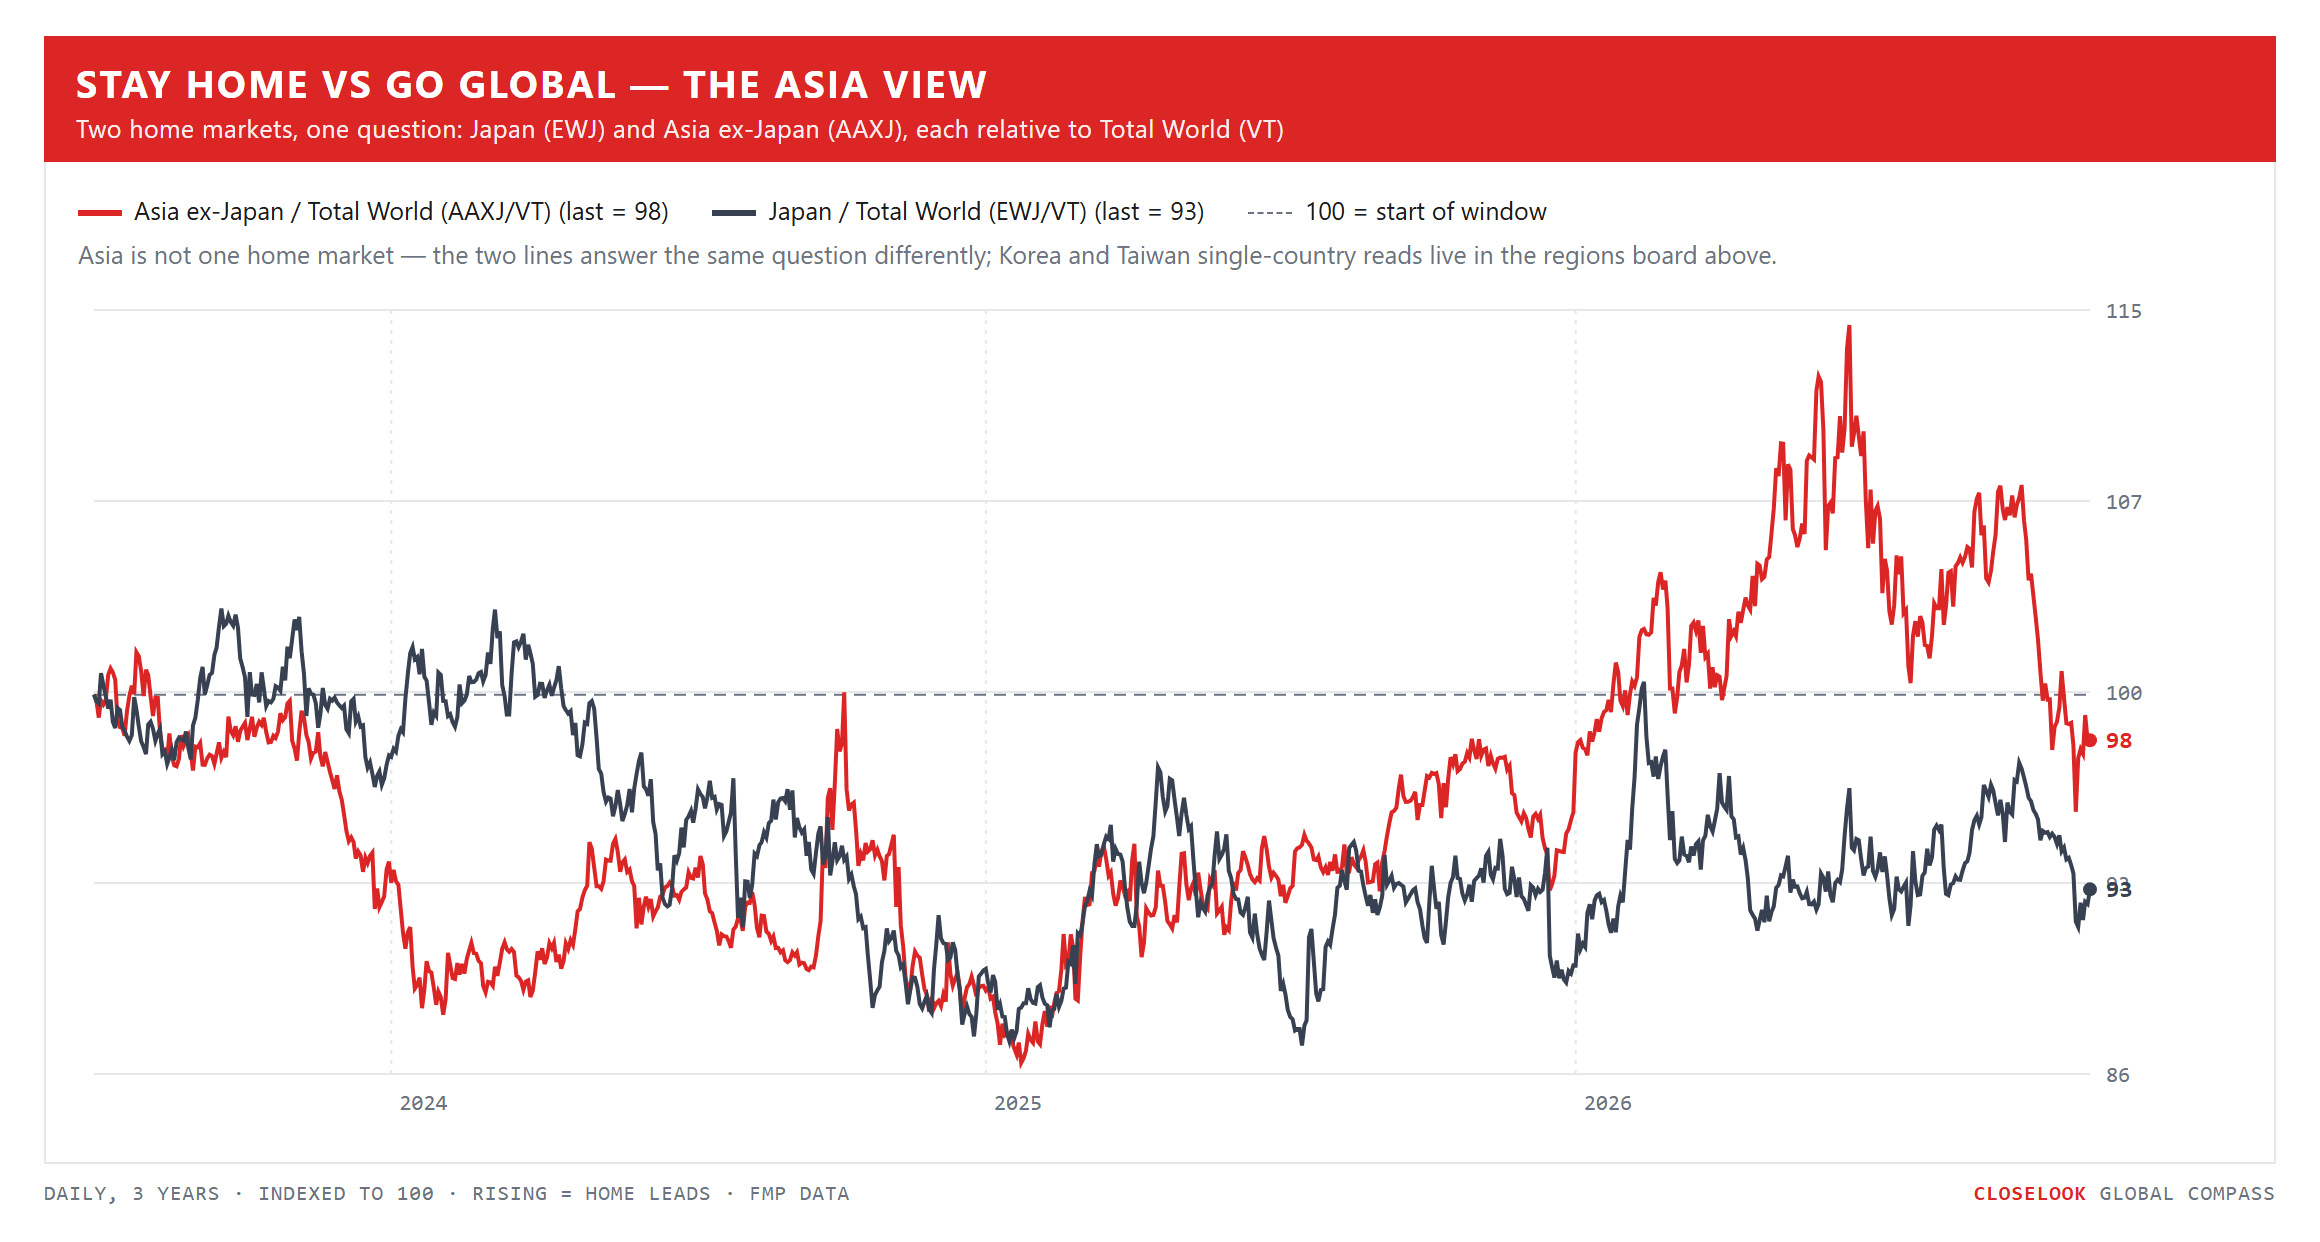
Stay home vs go global — the Asia view: the chip markets against China. Taiwan: EWT +9.12%, the Taiex +10.0%. Korea: EWY +4.21%, the Kospi +4.6%. Japan: the dollar fund +3.97%, the Nikkei +6.5%. China and Hong Kong −0.9% to −4.2%. India: the dollar fund +1.10%. Asia ex-Japan as a whole rose 3.06%. Last week the markets that own the AI hardware fell and the ones that own almost none rose. This week it went back the other way — and the local indices rose more than their dollar funds; in Japan’s case because the yen weakened.
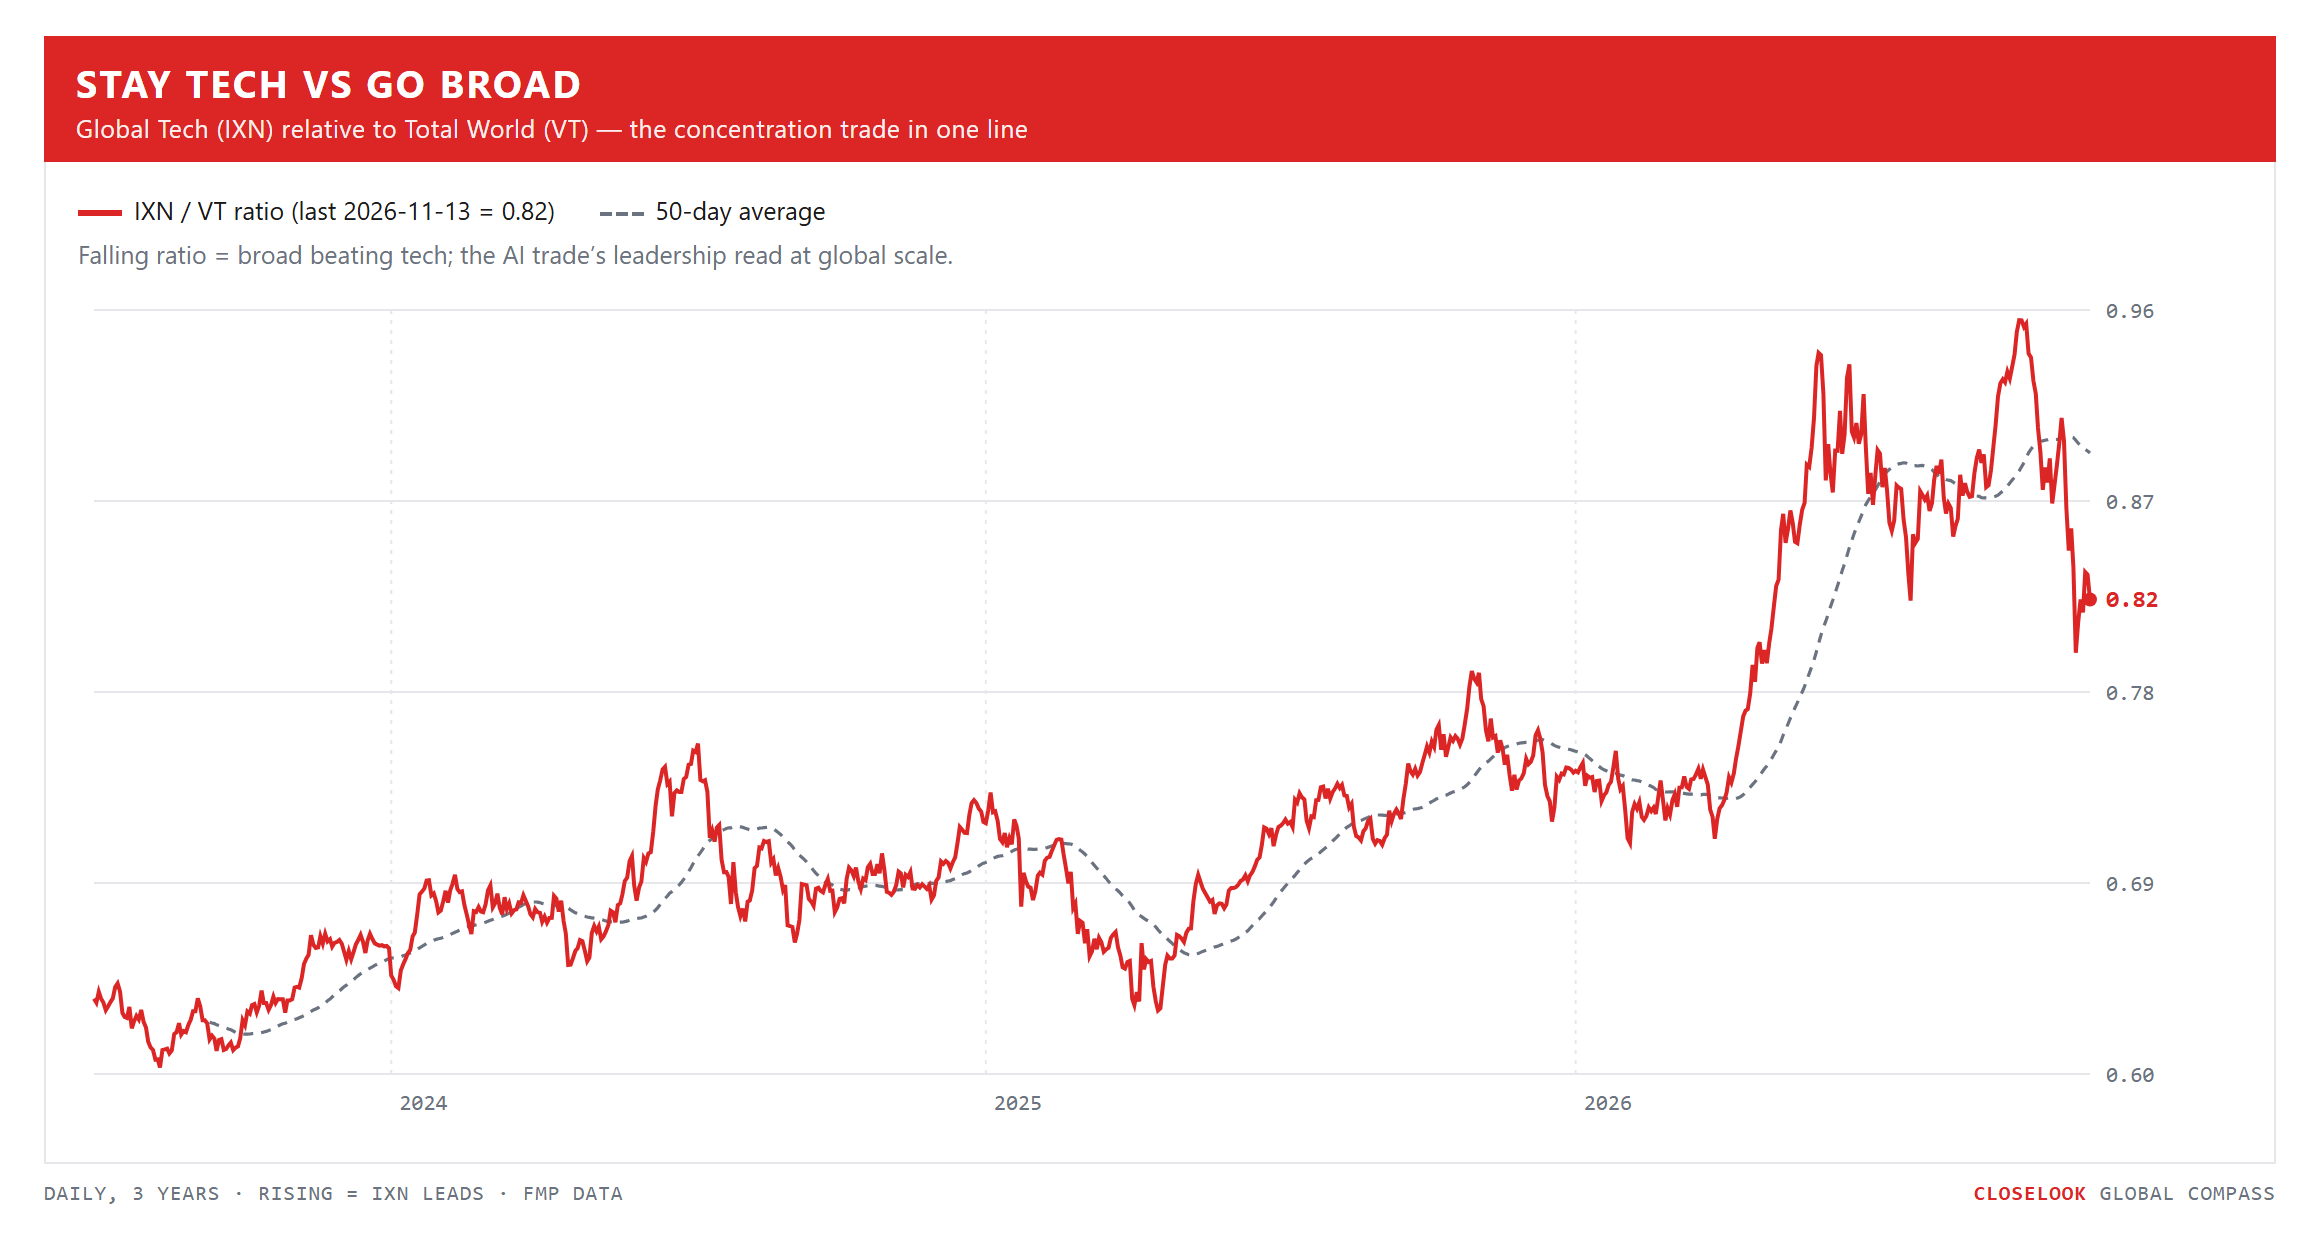
Stay tech vs go broad — tech won, by less than it lost. The Nasdaq 100 +3.63% against the S&P’s +2.59% and the equal-weight S&P’s +2.37%; global tech +3.67% against the world’s +2.35%. Small caps rose 1.41%. On the year tech still leads: global tech +22.0% against the world’s +10.1% — a week ago it was +17.7% against +7.6%.
Momentum vs defensive — both up, momentum more. International min-vol rose 1.87% to 96.91, under its November 4 record of 97.61; global min-vol rose 2.21% to 131.06, under its own record of 131.37 the same day. International momentum rose 3.00% to 50.17. On the year min-vol still leads, +12.4% against +4.6%.
The Closelook letters — where this one sits. The house thesis, compressed: the stock market is a growing system at the aggregate level in which most constituents slowly fade while a small group massively outperforms — and that group changes; it never stays static. Own the aggregate, know the current winner group, watch for the rotation. For most of 2026 the winner group sat in the chip corridor. Last week it broke; this week it won back part of the fall. On one week the builders still lead; on the month the companies that use AI have held better than the companies that build it — and this week the house books started to move in that direction. This letter reads the map; Sunday’s US letter reads the tape and the AI indices’ patterns; Sunday evening’s Hypergrowth letter reads the names.
2 · The State
The mechanism, named: the bounce came from the chips, the pressure from rates. Put the week in order. Monday: Jensen Huang had told Nvidia staff on Sunday of an affair with a woman who, the New York Times reported, US intelligence had concluded was a Chinese spy, and the board opened an investigation; Taiwan rose 4.9% anyway; in New York the S&P rose 2.35%, its best day since April, chips 7.5%, AMD 13% — and Nvidia fell 4.3%. Oil fell on hopes for US–Iran talks. Tuesday: October consumer prices rose 0.4% on the month and 0.3% without food and energy, each a tenth above forecasts; the ten-year touched 5%, the S&P closed 0.4% lower, gold fell almost 3%, and SoftBank’s $3.7 billion loss on power equipment took GE Vernova down 7%. Wednesday: CoreWeave beat and raised its outlook and rose 24%; the chip index rose 5.7% and the S&P 1.3%, back above its level before the sell-off of the week before; US bonds were closed for Veterans Day; the yen neared 160. Thursday: a report that Nvidia’s board was preparing to remove Huang, then his resignation; Nvidia cut a 14% fall to about 4% by the close, AMD and Broadcom rose 6%, Nebius fell 15% after moving its year forecast to the low end of its range; the ten-year rose to 5.07% and gold to its lowest close in a year. Friday: Seoul turned a 3% gain into a 1% loss; October producer prices rose 0.3% on the month, less than forecast, but 6.5% on the year, the most since 2022; the chip index fell 3.4%.
The pattern under the dates. Last week the companies that build AI were sold for three reasons that had nothing to do with their results. This week their results came back to the front: CoreWeave’s beat lifted them on Wednesday, and on Friday Cisco and Applied Materials both beat their own forecasts and both fell. What did not hold all week: the hedges. Gold, silver, the long bond and bitcoin all fell, and the dollar rose — the shape of a market that expects higher US rates, not lower ones.
The rate peak, tested. The US ten-year closed the week at 5.15% on the house sovereign board, up 28 basis points from 4.87% and back above 5%, 16 basis points under the 5.31% close of 5 October. Last week this letter wrote that a close back above 5.0% would say the bond market had changed its mind about the Fed. That is this close — after a hot inflation report rather than a strong jobs one. The long bond fell 3.10% to 79.38 and lost the 81.2 line it had held for three weeks, on Tuesday; IEF closed at 90.04, further under 93.17.
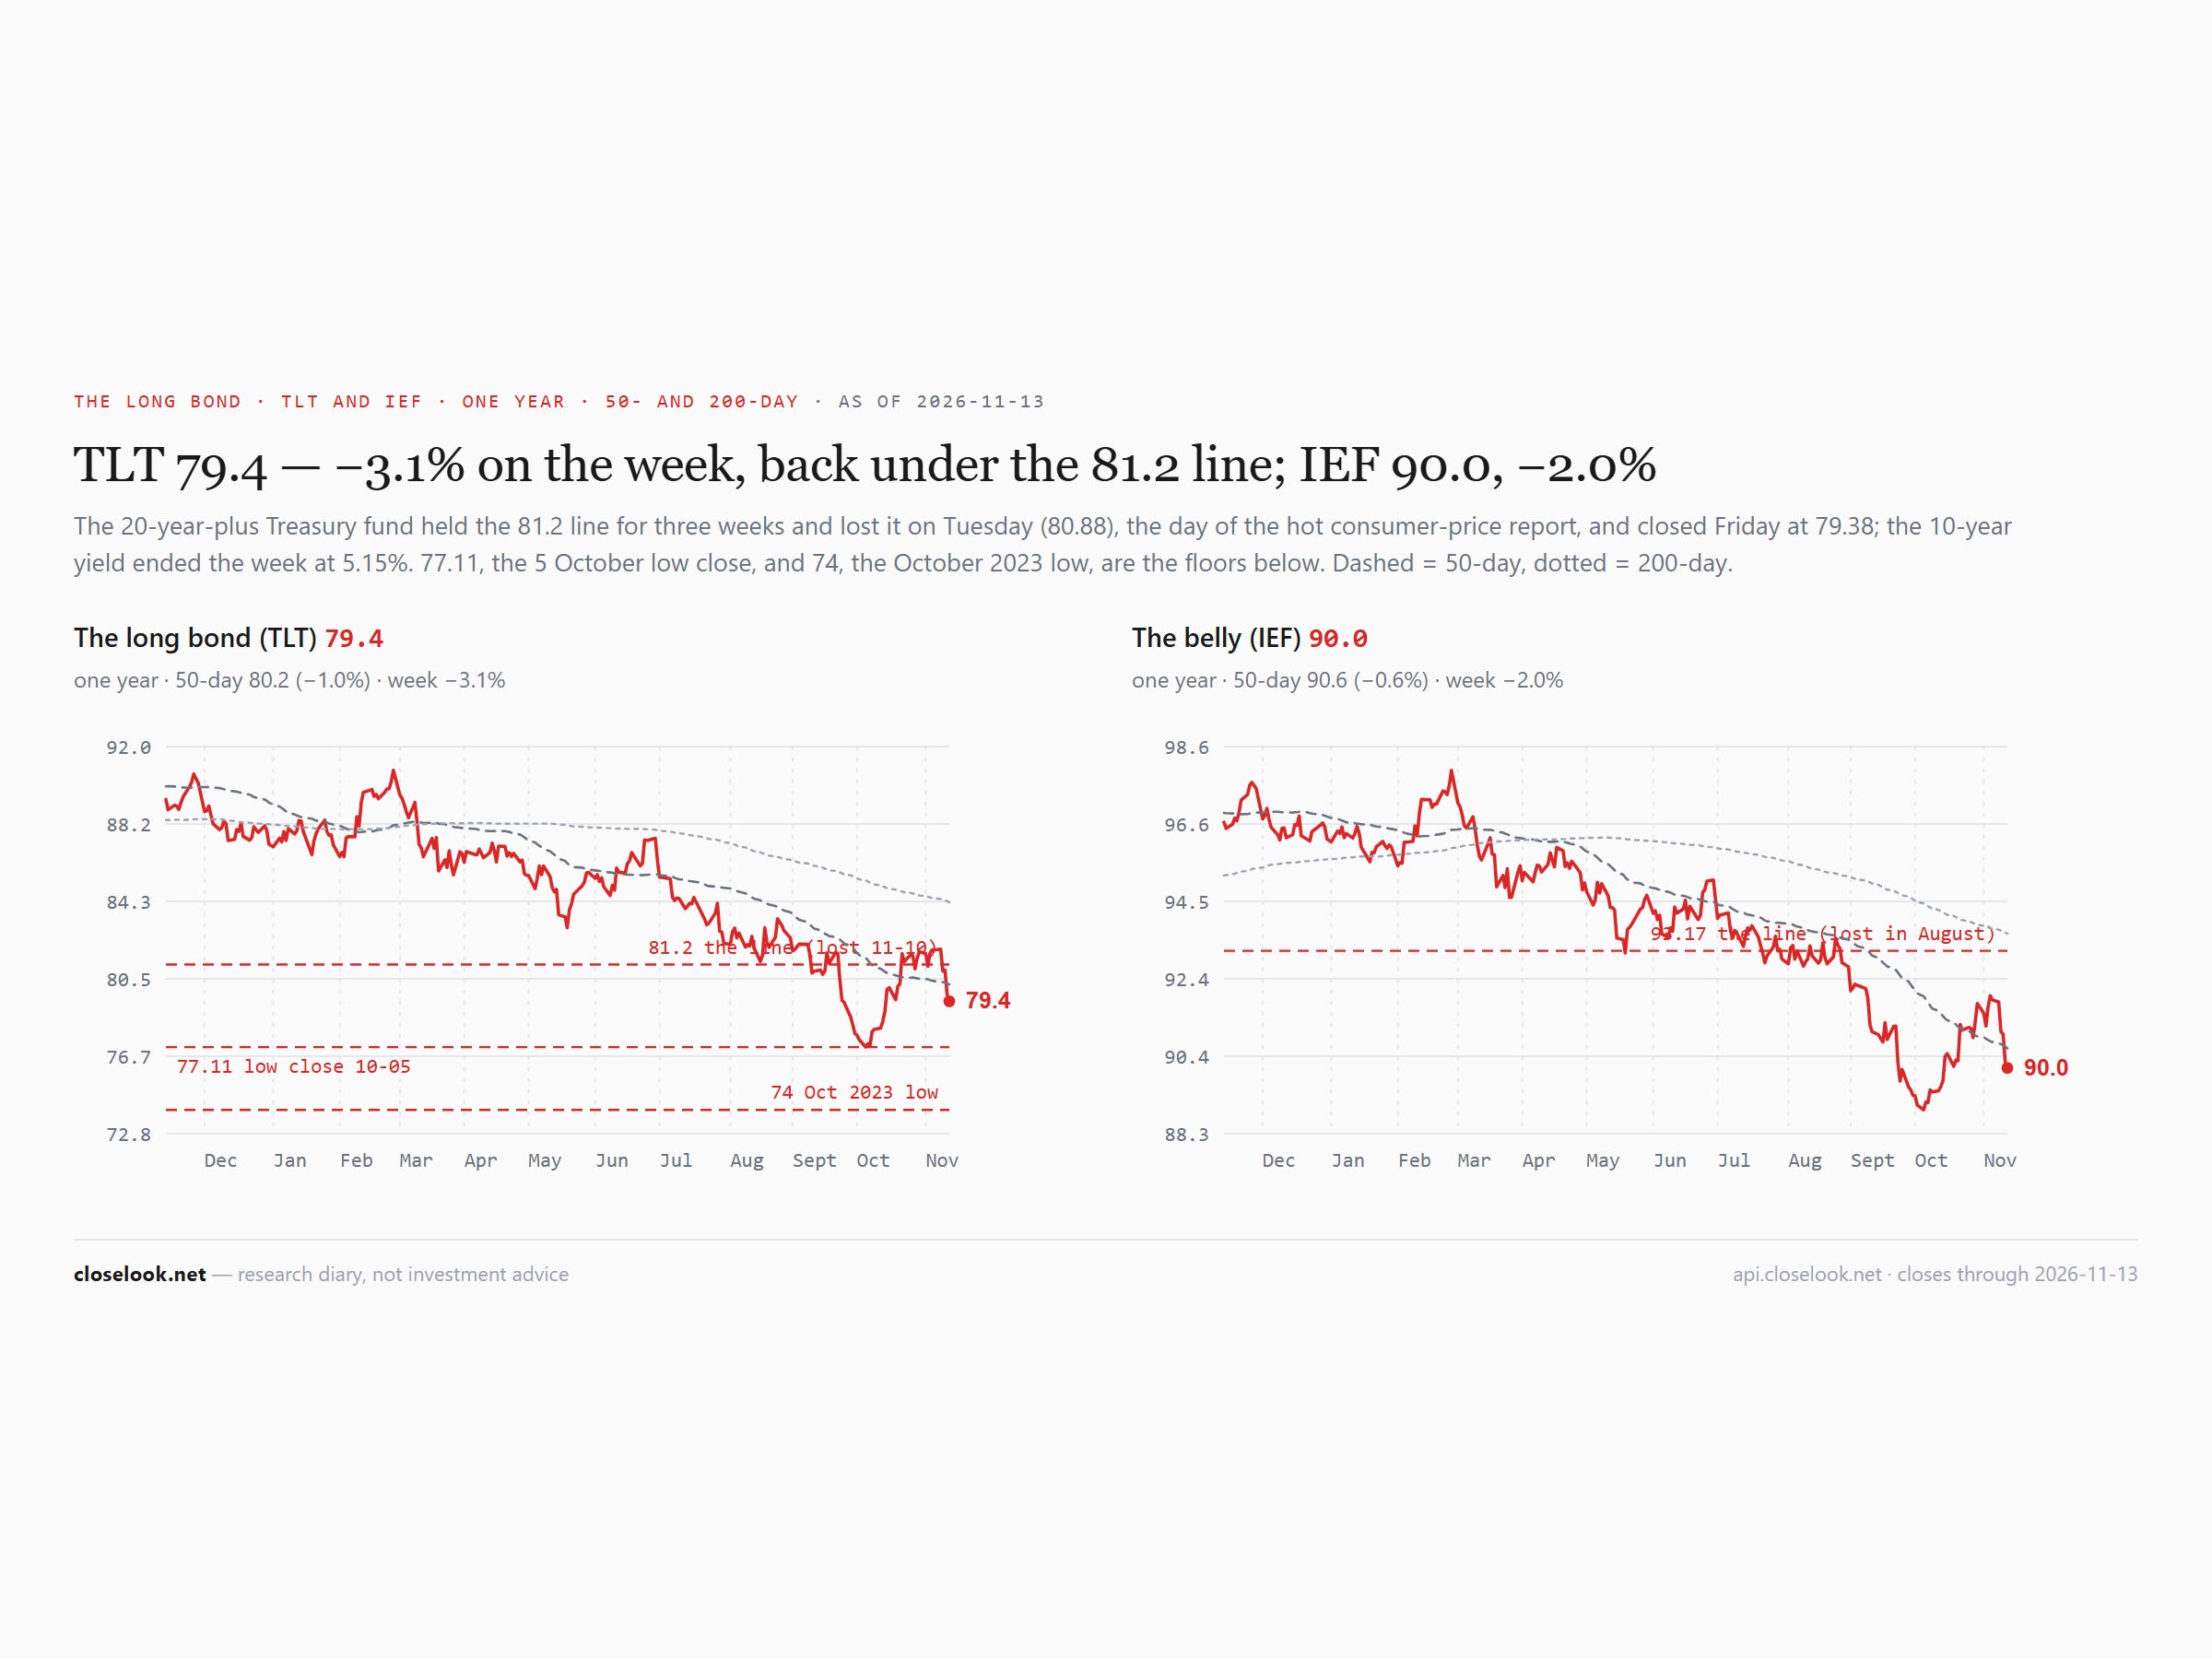
The Fed, in the record. The Fed’s range is 3.75–4.00% after a hike in September; it held on 28 October and meets next on 9 December, with new projections. After Tuesday’s inflation report the futures price a quarter-point hike in December as all but certain, and a half-point move at about one chance in eight. A hike priced as certain and a ten-year back above 5% are the same message: this week the bond market priced the Fed, not the AI sell-off.
France still yields less than America — by more. The French ten-year closed at 4.92%, under the US ten-year’s 5.15% — a week ago the gap was 10 basis points, now 22. France’s premium over Germany widened by about 3 basis points to 153; Italy pays 105, Greece 88. The German ten-year closed at 3.40%.
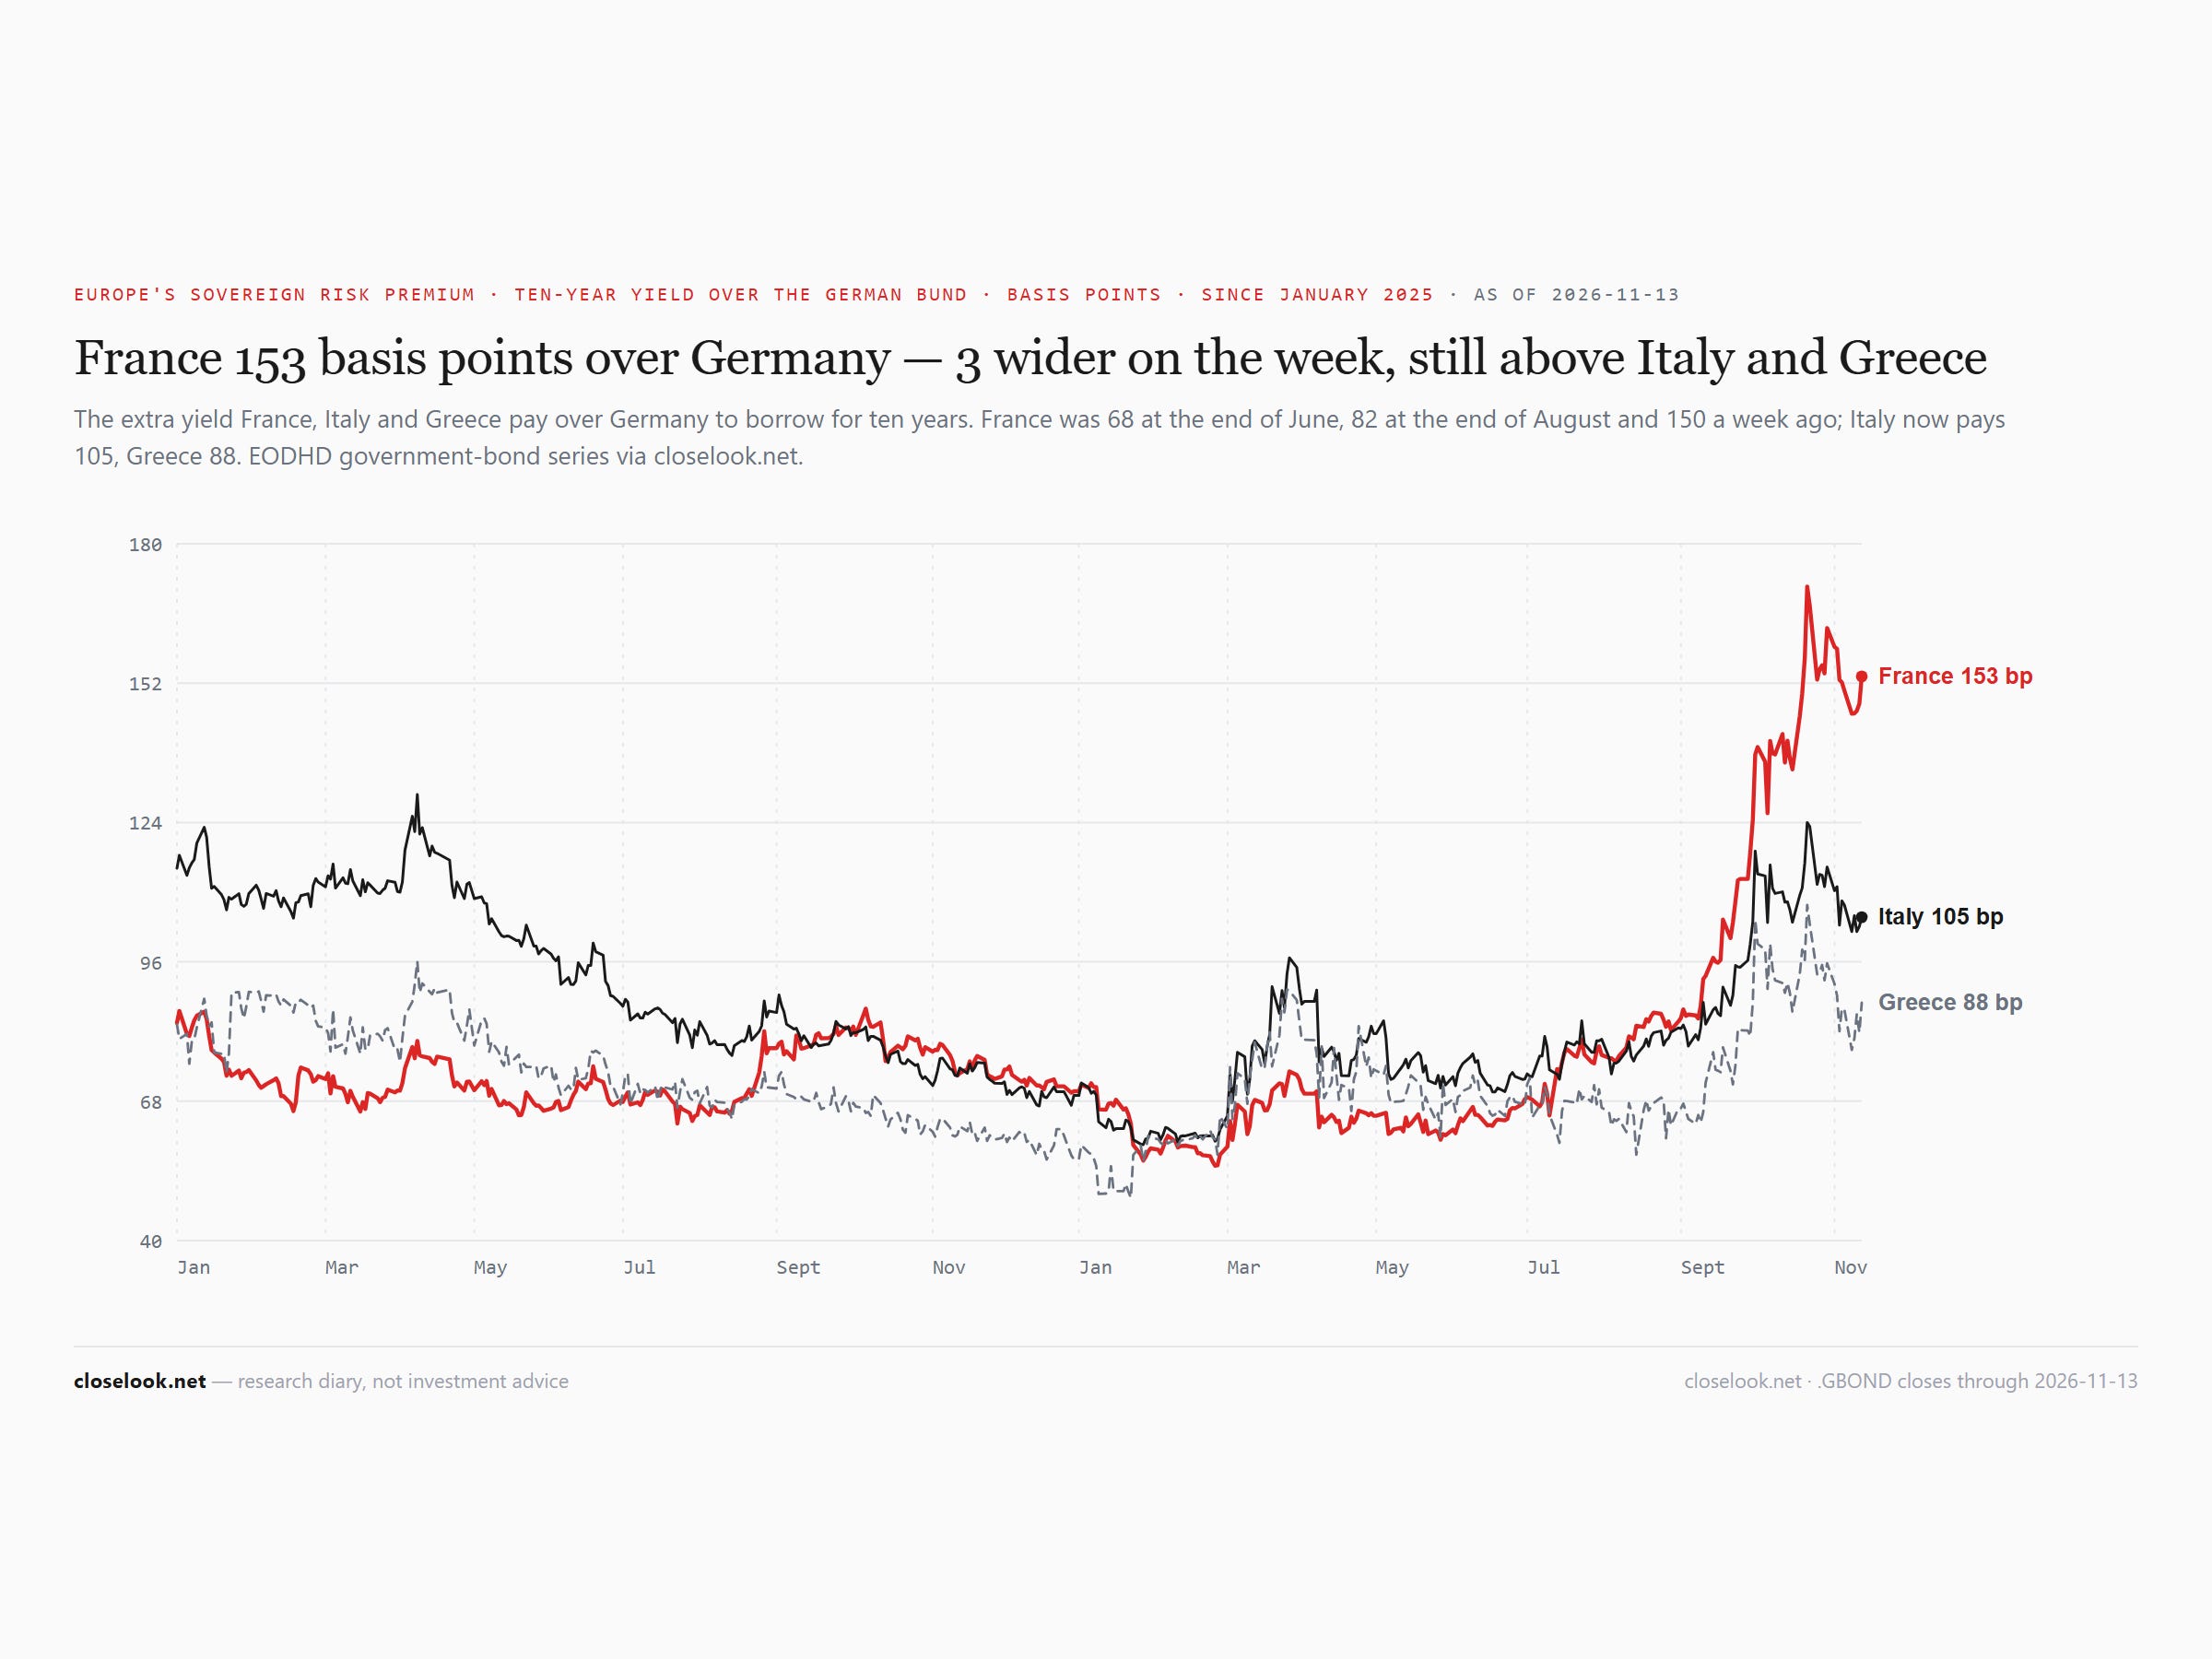
The rate map — one sentence each. America: 5.15% on the ten-year, up 28 basis points on the week. Britain: 5.34%, and 5.79% on the thirty-year — still the highest long yield on the board. Japan: 2.86%, from 2.64%. Canada: 3.86%, from 3.66%. France: 4.92%. Italy: 4.44%. Germany: 3.40%. Every ten-year on the board rose. The equal-weight ten-year stands at 4.28%, from 4.10%; the house sovereign pressure index rose to −0.34 from −1.91 — more pressure, after two weeks of less.
The consequence — the map, restated. This letter’s positioning: this diary stays away from mainland Europe’s core, and from France in particular; Greece and Poland stay the exceptions. This week the French spread widened a little and its fund rose with the rest of Europe. The map stays as it is until the spread holds under the 135 line named below. This is a diary’s positioning, not advice.
Oil — the fund down, the producers up. The oil fund fell 1.91% to 145.58, 14.1% under its October 23 high close, after a 3.9% fall on Monday on the hopes for talks. The energy stocks went the other way: US energy +5.42% to 64.96, global energy +4.05% to 59.34 — 7.2% and 7.6% under their record closes of 30 October. A week ago the barrel and the producers fell together; this week the producers rose while the barrel slipped.
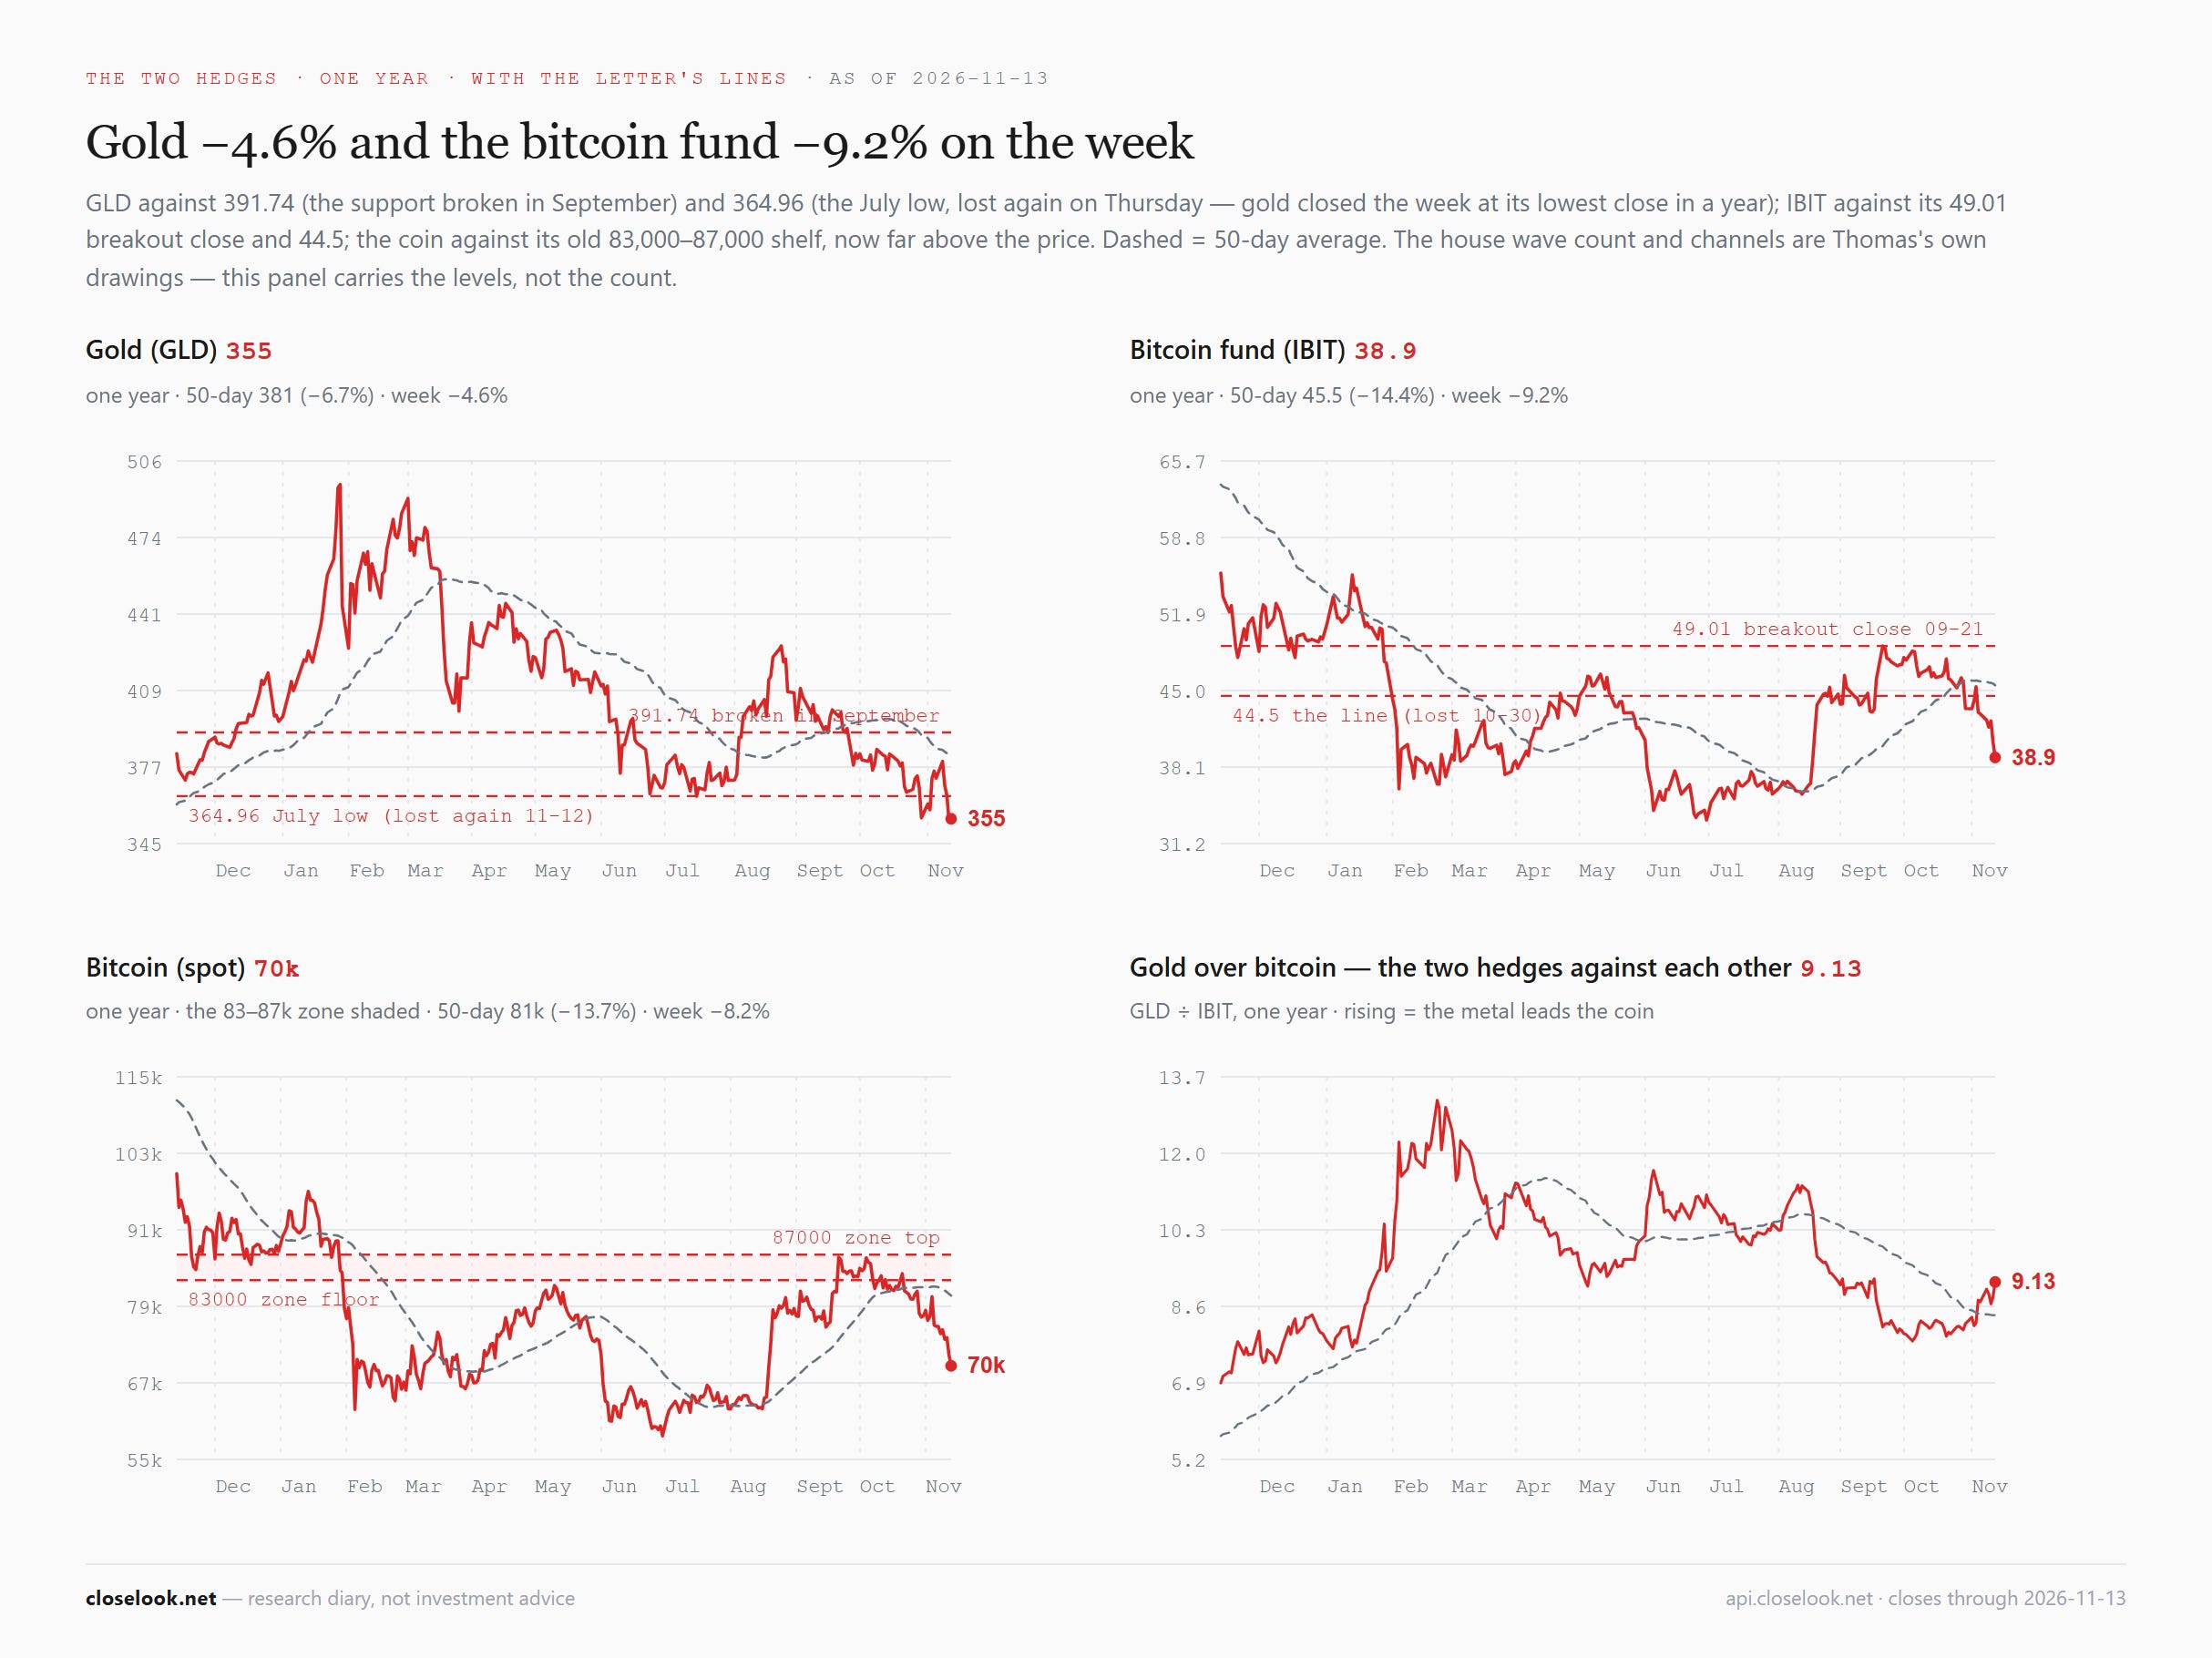
The hard assets — gold under the line, at a one-year low. Gold fell 4.58% to 355.45 — back under its July low close of 364.96, after 354.89 on Thursday, its lowest close in a year; it is 28.3% under its January 29 record of 495.90. Last week this letter wrote that a close back under 364.96 would make the week before a bounce. That is this close. Silver fell 5.85% to 44.13, its lowest close of the past year, 58.2% under its January high. Copper miners fell 2.84%. Bitcoin closed Friday at 69,556, −8.2% on the week, under 70,000; the fund fell 9.19% to 38.94. The metals and the coin fell together, with the dollar at its high.
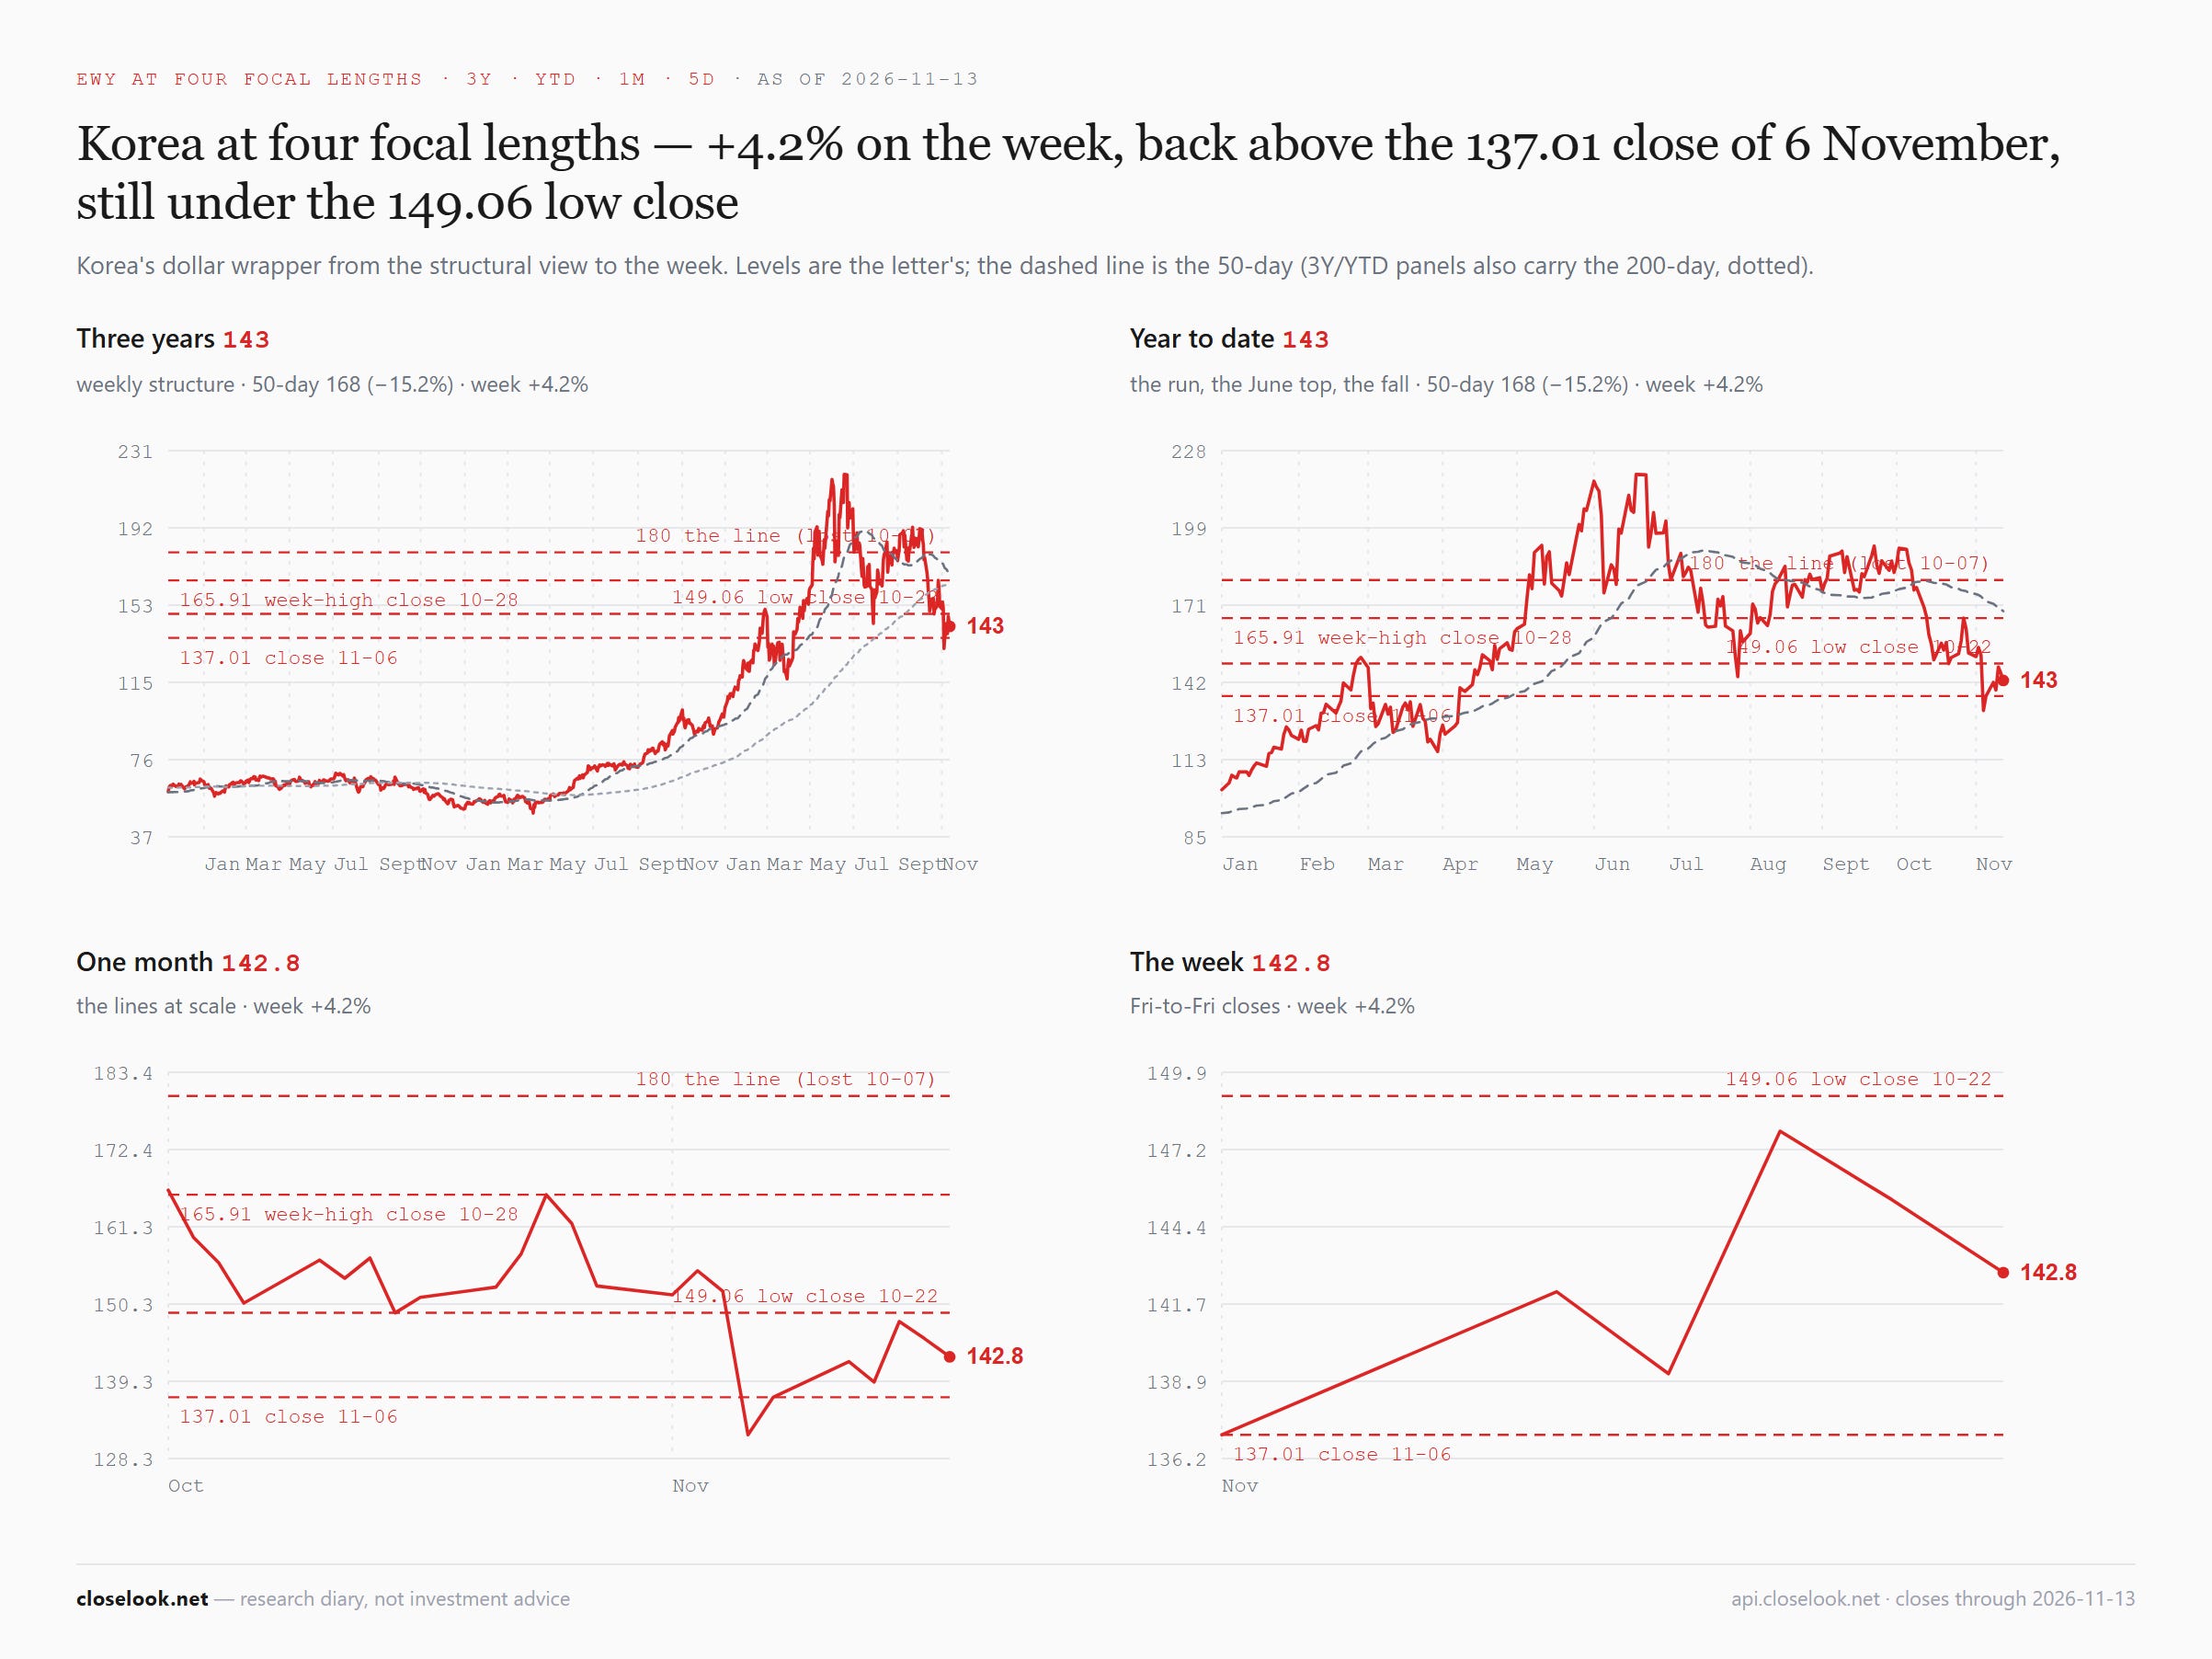
Seoul: up on the week, down from Wednesday. The fund walked 142.10 → 139.18 → 147.81 → 145.38 → 142.78. Wednesday’s close was the high of the week; Thursday and Friday gave back 3.4% of it. EWY is 34.9% under its June high and +46.9% on the year. In won the Kospi rose 4.6% to 5,291 — a dollar investor gained a little less, 4.2%.
Taiwan: one close above 100. EWT closed 95.65, 94.68, 100.19, 97.25, 97.38. Wednesday’s close was the only one above 100 since the line broke a week ago. The fund is 17.5% under its October 5 record and +53.3% on the year.
Europe, the voting machine and the weighing machine. Euro-AI rose 2.68% to 1,233.09, six of seven sleeves green: semi equipment +6.59%, power, grid and cooling +3.68%, enterprise AI and data +1.55%, chip architecture +1.47%, defence +1.42%, industrial AI +0.33%. Medtech was the one red sleeve, −1.04%. Last week Europe’s chip names fell with Asia’s; this week they rose with them.
The macro print. Three numbers: 0.4% on consumer prices in October, 6.5% on producer prices over the year, and a 5.15% ten-year. The first two say inflation is not done. The third says the bond market believes them.
The structural read — both floors back under the price. VEU’s Friday close of 80.91 sits back above the horizontal support near 80.3 — the summer lows: 79.83 on 4 May and 80.38 on 29 July. Last week this letter wrote that a weekly close back above 80.3 would say the fall under it was a test from below. That is this close. The editor’s preferred count still reads the world ex-US as forming wave 4, a complex consolidation, and this week did not decide it. VT closed at 155.30, back above its July low close of 152.22, under the 156.82 floor of its August–October range. On the editor’s alternative count the all-world advance since April 2025 is a fifth wave; the 2022 channel line remains the one that decides whether it has ended.
3 · The Outlook
The three-index read — the builders bounced, the applications did not move. We read the three together because they are three stages of one spend: capex (Rubin Build-Out, what gets built), opex (Agentic Ecosystem, what it costs to run), applications (Agentic Winners, what gets sold on top).
Capex +8.20% on the week to 1,607.60, all thirty-six sub-indices green, +56.4% on the year. Opex +4.10% to 1,435.64, ten of fourteen green, +45.5%. Applications +0.03% to 916.18, six of nine green, −6.4%. Last week the builders and the runners fell 10 to 13 points and the applications held. This week the builders and the runners won back part of it, and the applications held again.
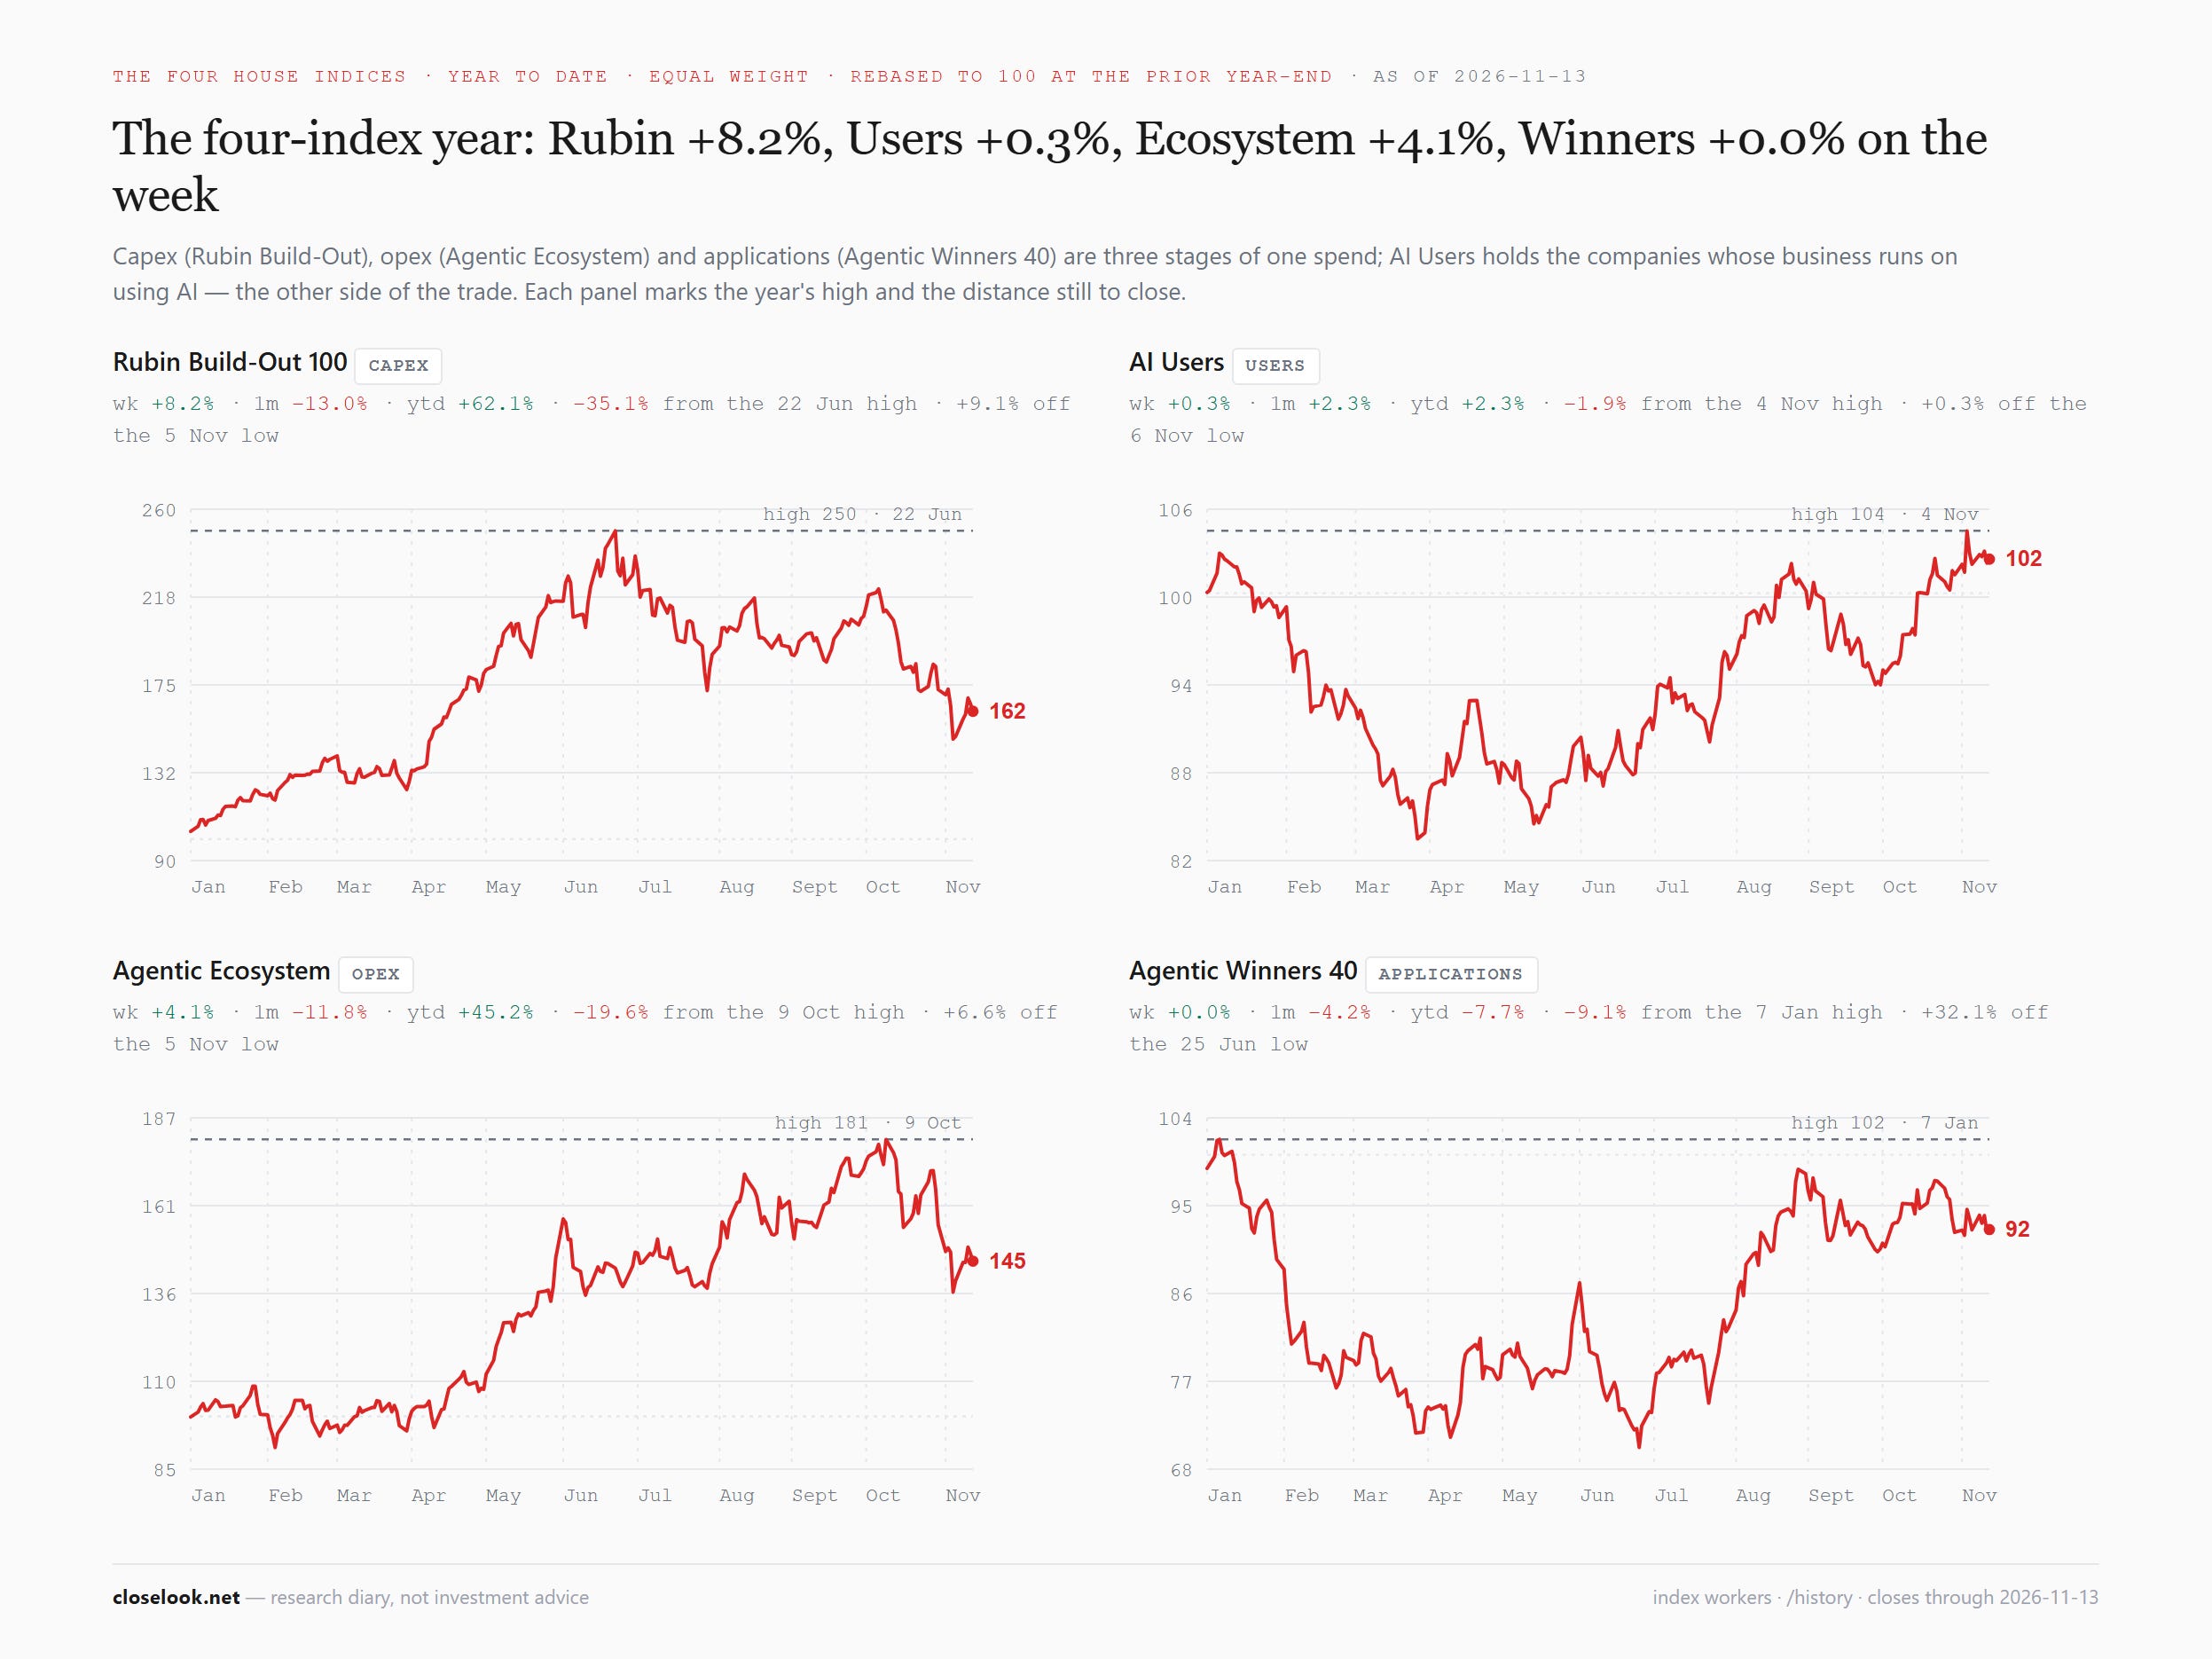
The order of the fall, one week later. Through 2026 the three rose in sequence: the builders first, the runners next, the applications last. The falls arrived in the same order. Capex is now 35.1% under its June 22 high and 9.1% above its November 5 low; opex 19.6% under its October 9 record and 6.6% above its own November 5 low; applications 9.1% under a January high. One week up does not change the order. On the month: capex −13.0%, opex −11.9%, applications −4.2%, HALO +0.7%.
The control group, flat — and the AI Users index beside it. HALO — our growth index carrying no AI thesis — rose 0.13%, −1.8% on the year, twelve of twenty-three sleeves green. Inside it, grid, industrial and specialty materials +3.89%, space and satellites +3.39%, payments +2.85%, longevity +2.49% — while energy transition and clean power fell 13.71%, a week after rising 24.12%. AI Users rose 0.35% on the week and 2.3% on the month: the companies that use AI moved like the control group, not like the builders.
Inside capex: everything up, the cooling most. The best: thermal management +15.04%, advanced materials +13.57%, chip design +12.86%, wafer processing +12.13%, the Asia-Pacific ex-Japan constituents +11.47%. The least: gases and chemicals +0.70%, AI factory systems +1.77%, chip design software +2.88%, photomasks +3.92%, machine vision +4.05%.
Inside opex: identity and data up, the models and the compute renters down. Identity, trust and governance +8.31%, data and memory +7.11%, execution +7.06%, runtime and API gateways +6.95%, operations and observability +6.56%. The red: foundation models −4.24% (one name), the Europe constituents −1.81%, compute operators −1.23%, the Asia constituents −0.39%.
Inside applications: the control plane up, Asia down. Control plane +2.68%, the Europe constituents +1.60%, consumer +0.78%; the red was the Asia constituents −3.48%, the application leaders −1.19% and enterprise −0.33%.
Euro-AI, for the ladder’s sake. The sovereign-Europe index rose 2.68% to 1,233.09, +23.3% on the year, 11.4% under its June high, six of seven sleeves green. On the ladder, Europe’s AI index rose less than America’s builders and runners and more than its applications.
The regime gauge. The Money Temperature board closed the week at 50, from 47 — still mixed and transitional, by its own construction not a signal, though its label moved to “risk-on rally” on Thursday. The week ran 49, 48, 51, 53, 50. The instruments: the dollar 75, the S&P 64, the Nasdaq 100 60, the world ex-US 52, emerging markets 46, gold 39, bitcoin 35, the long bond 30. A week ago the Nasdaq read 43 and gold 47; they have swapped places. The house cointegration monitor now shows bitcoin against the Nasdaq as the widest gap, 2.94 standard deviations from its mean; last week’s widest, the S&P against gold, closed to 0.7.
