

Gold's Missing Haven Bid
Gold printed its all-time high a month before the Iran war opened. Eight weeks in, it's down 14%. The tape is telling a story about who actually owned the rally — and where that money is going next.

Gold printed its all-time high of **$5,594.82 on 29 January** — a full month *before* US–Israeli strikes on Iran opened the current conflict. Eight weeks into a shooting war that should have been the safe-haven trade of the decade, spot gold trades near **$4,796**, roughly 14% below that January peak, with the Strait of Hormuz closed, oil back above $100, and a US naval blockade in place.
This is not what flight-to-safety looks like. This is what the unwind of a crowded momentum trade looks like.
The historical reference makes the point harder. Across ten major conflicts over the past fifty years, gold has never performed this badly in the first four weeks of fighting as it has in 2026. If the parabolic leg into January were driven by sovereigns and family offices hedging a breakdown, this price action would be structurally impossible. Central banks do not sell into a war they are supposedly front-running.
The only reading that reconciles the tape: the late-2025 rally was momentum capital riding a trend, not capital positioning for tail risk. The stress test arrived. The bid wasn’t there.
The mirror trade
While gold has bled, Bitcoin has quietly reclaimed the high-$74,000s from its **5 February crash to $60,000**. Ether is back above $2,200. More interesting than price: Santiment reports BTC open interest **+59%** over seven weeks, ETH OI **+45%**. Open interest rebuilding *into* strength is the signature of a market that has finished being force-fed supply.
This is the same pool of risk-on capital we watched rotate **into** gold through Q4 2025 and **out of** crypto during the October–February drawdown. Same money, same momentum book, opposite direction.
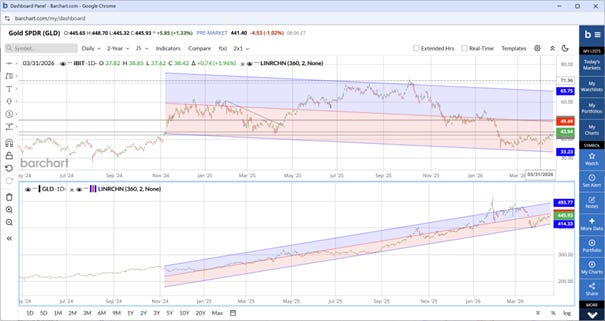
*Two mean reversions, mirror-imaged. GLD (lower panel) broke above its upward regression channel into January — a statistical overextension — and is now unwinding back toward the midline. IBIT (upper panel) has spent the quarter pressed against the lower band of its downward channel and is now lifting toward the mean.*
The regression channels make the point quantitatively. Gold printed its January high **outside** its own 360-bar channel — a statistical overextension, not a haven bid. IBIT spent the same quarter pinned to the **lower** band of its channel, force-fed supply by the symmetric flow. Both instruments are now reverting toward their respective means. The tape is telling one story in two languages.
Three takeaways
**One — The gold unwind may not be finished.** If the flow that pushed gold from ~$3,200 to $5,594 was momentum rather than conviction, the symmetric retracement still has runway. We watch the $4,500 shelf closely; a clean break opens a gap back toward the $4,000 round number.
**Two — The Bitcoin liquidation phase may be.** BTC’s drawdown from the October ATH reached ~53% — painful, but well short of the 77% purges of prior cycles. That is the bear case. The bull case is structural: the people who had to sell, sold. Open interest rebuilding into higher highs is a late-stage bottoming signature, not a blow-off.
**Three — “Safe haven” gold needs new labels.** Gold has been trading as a risk asset with a geopolitical ticker in the background — the asset you bought because it was going up, the oldest reason in markets, dressed up in haven clothing. The Iran war stripped the costume.
Skin-in-the-game read
The 2026 Iran War has handed us something more valuable than a directional call: a behavioural X-ray of who actually owns what, and why. Gold’s failure and Bitcoin’s quiet bid are the same sentence, read in different languages. The positioning reveal is the trade.