

Hypergrowth Portfolio Shines: Five Stocks Beat Expectations
Impressive Beat and Raise, Surpassing Forecasts

(1) What's the buzz?
The first five stocks from my hypergrowth portfolio—Taiwan Semiconductor Manufacturing Co. (TSM), MakeMyTrip (MMYT), ServiceNow (NOW), Vertiv Holdings Co. (VRT), and KKR & Co. Inc. (KKR)—have reported their quarterly earnings, each delivering a "beat and raise" that exceeded market expectations.
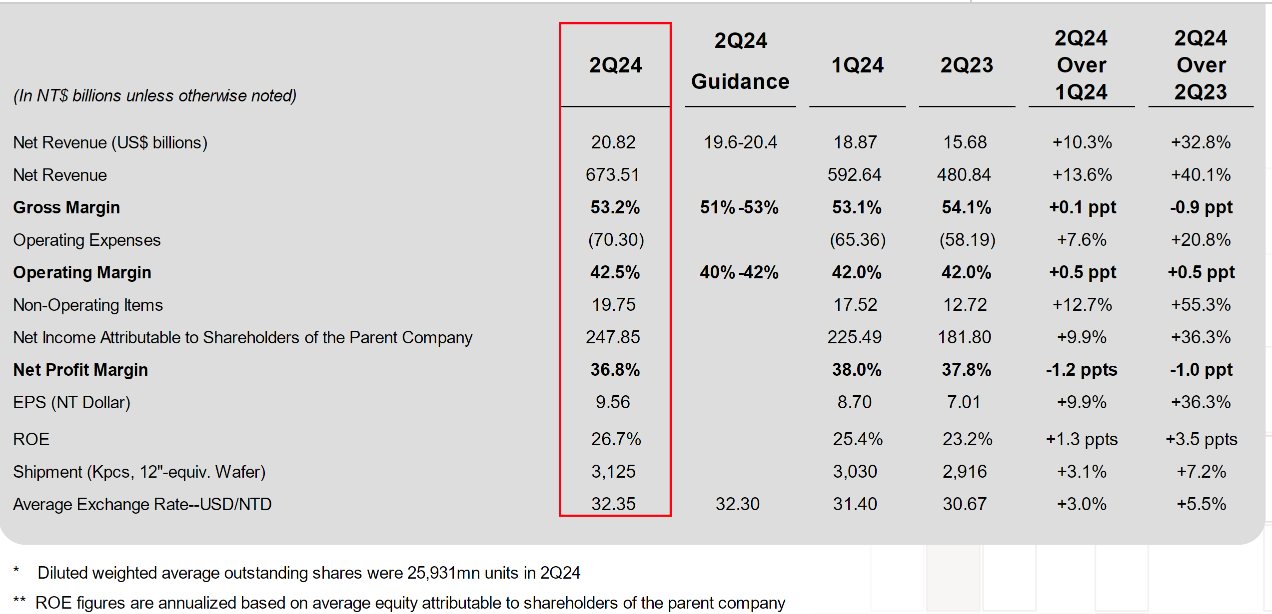
Taiwan Semiconductor Manufacturing Co. (TSM) reported a revenue of $23.5 billion, driven by strong demand for advanced technologies, marking a 12.8% sequential increase.
MakeMyTrip (MMYT) achieved a 21.7% increase in gross bookings, reaching a record $2.1 billion for the quarter, with revenue growing by 26.9% year-on-year.
ServiceNow (NOW) delivered earnings per share of $3.72, surpassing estimates by 7.51%, and continued its trend of outperforming revenue expectations.
Vertiv Holdings Co. (VRT) reported a 19% rise in revenue to $2.07 billion, with net income increasing by 88% compared to the previous year.
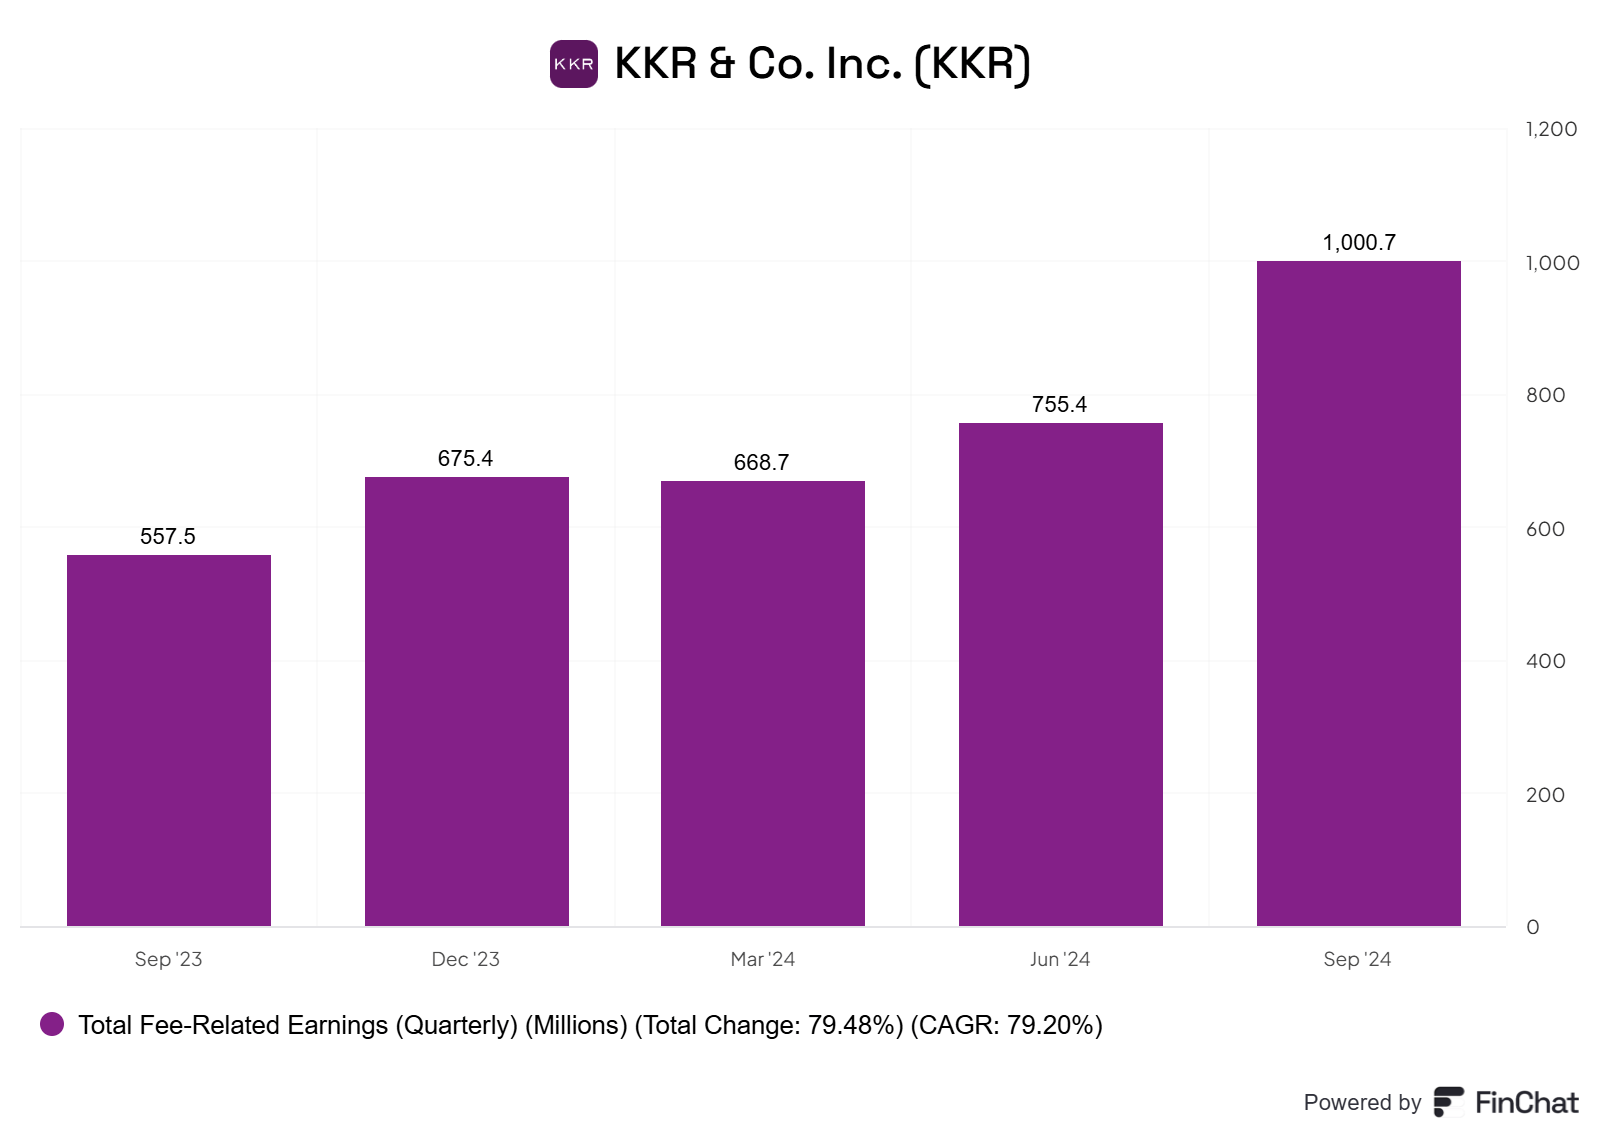
KKR & Co. Inc. (KKR) saw its EPS grow 27% sequentially and 57% annually, with fee-related earnings surging 79.5% YoY, significantly outpacing Blackstone, which only grew at FRE 4.5%.
Each company's robust performance underscores the strength and growth potential within the hypergrowth portfolio, setting a positive tone for future earnings reports.
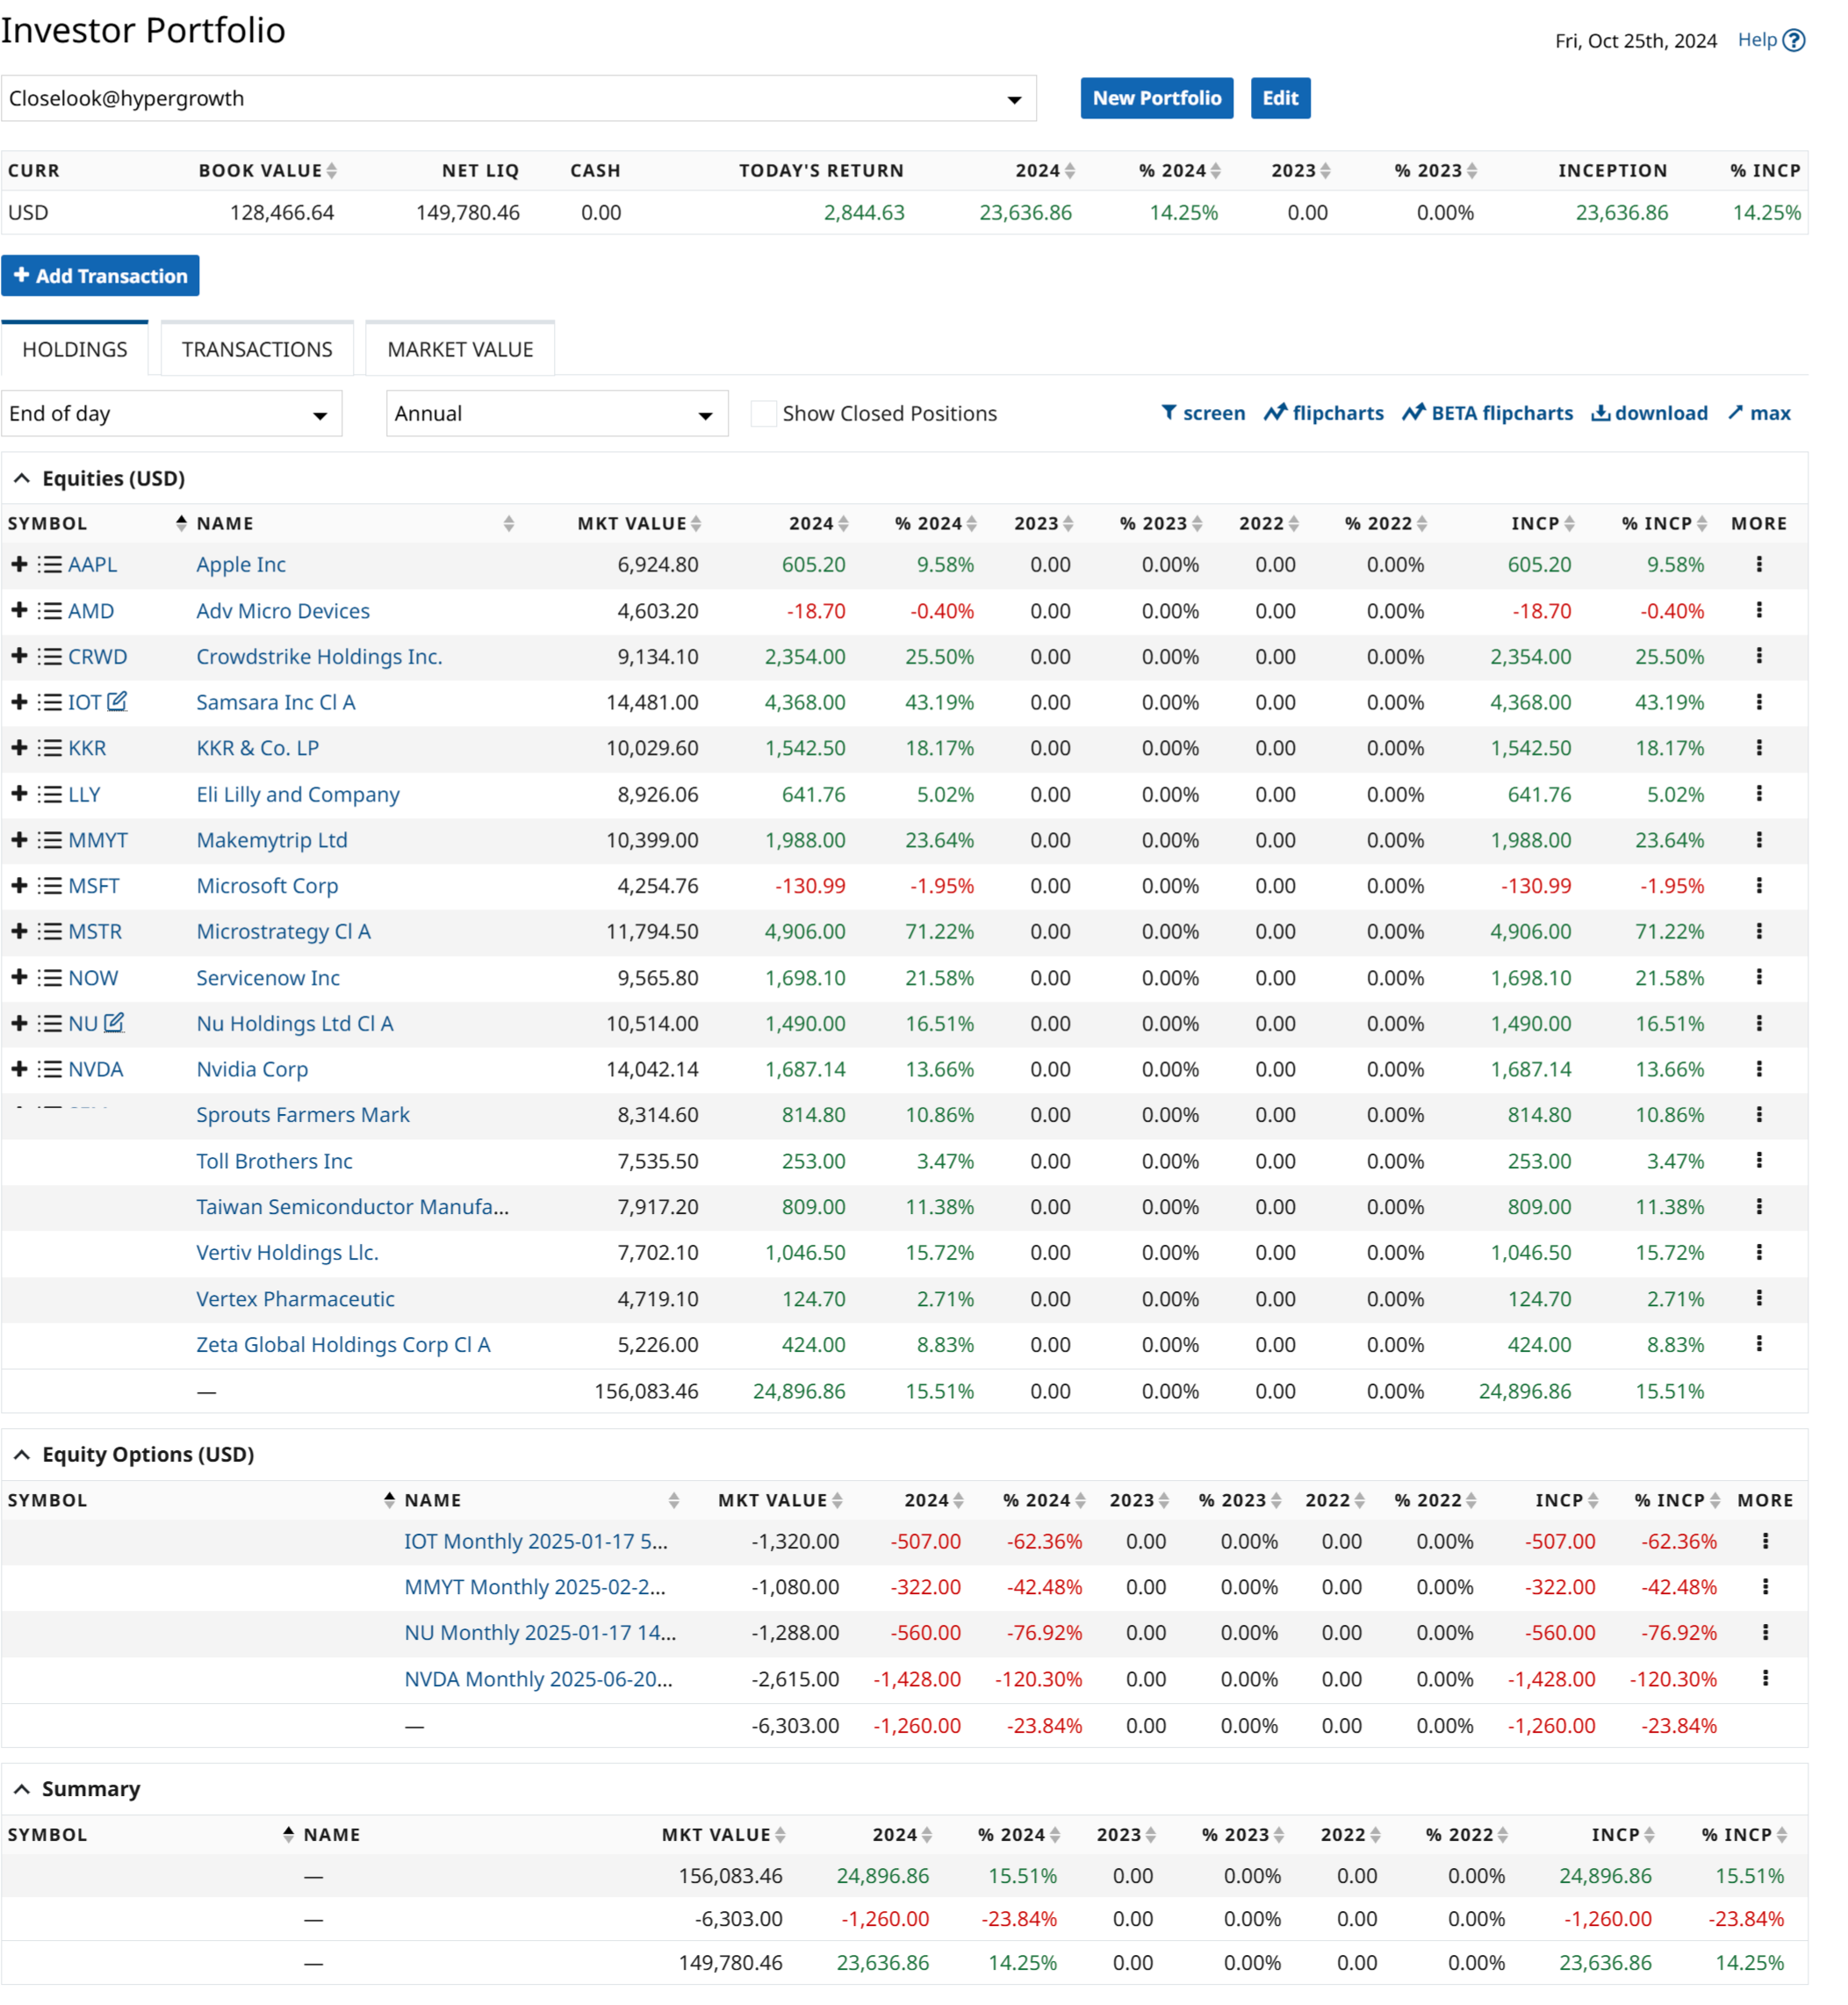
The growth stories for all five companies remain intact, and I am happy to buy on any significant dip to add to my current positions.
(2) Taiwan Semiconductor
TSMC reported a significant increase in net revenue for the third quarter of 2024, rising by 36.0% year-over-year to $23.5 billion, exceeding expectations by $210 million.
This growth is primarily driven by sustained demand for advanced semiconductor technologies, particularly in the High Performance Computing (HPC) segment and artificial intelligence (AI) applications.
Beating Earnings Expectations
TSMC's GAAP EPS for the third quarter was $1.94, beating analysts' estimates by $0.15
Stable Operating Margin
Despite increased operating expenses, TSMC maintained a stable operating margin.
For the third quarter, the operating margin is expected to be between 42.5% and 44.5%, consistent with previous guidance.
High Investments
TSMC continued to invest heavily in expanding its production capacities and developing new technologies.
The company is investing billions in constructing new facilities, including a significant $65 billion earmarked for three plants in Arizona, USA
Demand for Advanced Technologies
In the third quarter, shipments of advanced technologies were significant:
3-nanometer technology: Accounted for 20% of total wafer revenue.
5-nanometer technology: Accounted for 32% of total wafer revenue.
7-nanometer technology: Accounted for 17% of total wafer revenue.
Advanced technologies (7nm and below): Collectively accounted for 69% of total wafer revenue

And next?
“Based on the current business outlook, we expect for our fourth-quarter revenue to be between $26.1 billion and $26.9 billion, which represents a 13% sequential increase or a 35% year-over-year increase at the midpoint,” TSMC Chief Financial Officer Wendell Huang said during an earnings call following the results release, according to a call transcript produced by FactSet.
(3) Vertiv Holdings
Vertiv Holdings Co Q3 2024 Earnings: EPS of $0.76 Beats Estimates, Revenue Surpasses Expectations at $2.074 Billion.

Vertiv Holdings Co. specializes in providing critical digital infrastructure and continuity solutions.
The company offers a comprehensive portfolio of power, cooling, and IT infrastructure solutions and services, catering to data centers, communication networks, and industrial facilities. Vertiv operates through three business segments: the Americas, Asia Pacific, Europe, Middle East & Africa.
Summary
Net Sales: Achieved $2,074 million in Q3 2024, surpassing analyst estimates of $1,977.35 million and marking a 19% increase year-over-year.
Operating Profit: Reached $372 million, a 48% rise from Q3 2023, with an adjusted operating profit of $417 million, up 41% year-over-year.
EPS: Reported diluted EPS of $0.46, with adjusted diluted EPS at $0.76, exceeding the high-end of prior guidance.
Free Cash Flow: Generated $336 million in adjusted free cash flow, an increase of $115 million compared to Q3 2023.
Operating Margin: Adjusted operating margin expanded by 310 basis points to 20.1%, driven by increased volume and favorable commercial execution.
Guidance Update: Raised full-year 2024 guidance across all financial metrics, with expectations for accelerated organic sales growth in 2025.
Vertiv will be a prime beneficiary of the data center’s need to implement liquid cooling on a larger scale when buying Nvidia’s Blackwell chips.
(4) ServiceNow
ServiceNow has delivered a strong performance in the third quarter of 2024, surpassing its guidance across all critical growth and profitability metrics.

Beat and Raise
Impressive Subscription Revenue Growth: ServiceNow reported subscription revenues of $2,715 million for Q3 2024, marking a 23% increase year-over-year (22.5% in constant currency).
Total Revenue Increase: The total revenues for Q3 2024 reached $2,797 million, showcasing a 22% year-over-year growth (22% in constant currency).
Strong Performance Obligations: The current remaining performance obligations stood at $9.36 billion as of Q3 2024, experiencing a 26% year-over-year increase (23.5% in constant currency). The total remaining performance obligations were reported at $19.5 billion, up by an impressive 36% year-over-year (33% in constant currency).
Significant Large Transactions: ServiceNow completed 15 transactions, each exceeding $5 million in net new Annual Contract Value (ACV) during Q3 2024. This represents a substantial 50% increase compared to the previous year, highlighting the company's success in securing large-scale deals.
(5) Makemytrip
MakeMyTrip Ltd (MMYT) reported robust year-on-year growth in international sectors while navigating weather-related disruptions and market challenges.

Summary
Gross Booking Value: $2.3 billion, 24.3% year-on-year growth in constant currency.
Adjusted Operating Profit: $37.5 million, 32.9% year-on-year growth.
Revenue Growth: 26.5% year-on-year in constant currency.
International Air Ticketing Revenue Growth: Over 39% year-on-year in constant currency.
International Hotels Outbound Revenue Growth: 62% year-on-year in constant currency.
Total Air Ticketing Adjusted Margin: 21.1% year-on-year growth in constant currency.
Hotels and Packages Gross Bookings: $517.2 million, 21.2% year-on-year growth in constant currency.
Hotels and Packages Adjusted Margin: 21.4% year-on-year growth in constant currency, $90.7 million.
Bus Ticketing Gross Bookings: $263 million, 21.5% year-on-year growth in constant currency.
Bus Ticketing Adjusted Margin: 25.6% year-on-year growth in constant currency, $27.1 million.
Cash and Cash Equivalents: Over $700 million.
Customer Acquisition Costs: 4.6% of gross bookings, slightly lower than 4.8% in the previous quarter.
Positive Points
MakeMyTrip Ltd (MMYT, Financial) reported year-on-year solid growth with gross booking value reaching $2.3 billion, a 24.3% increase in constant currency terms.
The company achieved a 33% year-on-year growth in adjusted operating profit, amounting to $37.5 million.
International air ticketing and hotel businesses showed significant growth, with international air ticketing revenue increasing by over 39% and international hotel business revenue growing by 62% year-on-year in constant currency.
MakeMyTrip Ltd (MMYT) has successfully integrated AI-driven solutions, such as the GenAI chatbot Myra, to enhance customer service and operational efficiency, resulting in a 45% decrease in customer service agent involvement.
The company maintains a strong cash position, with cash and cash equivalents exceeding $700 million, allowing for potential organic and inorganic growth opportunities.
Watchpoints
The company faced short-term headwinds due to unusually heavy rainfall, impacting demand momentum in the leisure travel segment.
Despite solid growth, the domestic air ticketing market only saw a marginal increase of about 6% year-on-year, indicating potential challenges in this segment.
There is a noted consumption slowdown in certain areas, which could impact future growth, although early signs in the current quarter do not indicate a significant slowdown.
The impact of geopolitical tensions and macroeconomic factors, such as potential war situations, could affect travel demand to specific regions.
Pricing normalization in the hotel segment, particularly for international hotels, could challenge maintaining high growth rates in the near term.
(6) KKR
KKR & Co Inc reported Q3 2024 Earnings: Revenue Hits $4.79 Billion, GAAP EPS at $0.69

KKR is the second largest alternative asset manager, with $601.3 billion in total managed assets, including $487.3 billion in fee-earning AUM, as of June 2024.
The company operates through two core segments, asset management, and insurance, following its acquisition of Global Atlantic Financial Group.
Revenue: Achieved $4.79 billion in Q3 2024, a significant increase from $3.32 billion in Q3 2023.
Net Income: The reported GAAP net income attributable to common stockholders is $0.7 billion for the quarter.
GAAP EPS: Basic earnings per share stood at $0.74, with diluted EPS at $0.69 for Q3 2024.
Assets Under Management (AUM): Reached $624 billion, reflecting an 18% year-over-year growth.
Fee-Related Earnings (FRE): Recorded $1.0 billion in the quarter, up 79% year-over-year, showcasing solid operational performance.
Adjusted Net Income (ANI): Increased by 58% year-over-year to $1.2 billion, indicating robust financial health.
Dividend: Declared a regular dividend of $0.175 per share for the quarter, maintaining shareholder returns.
