


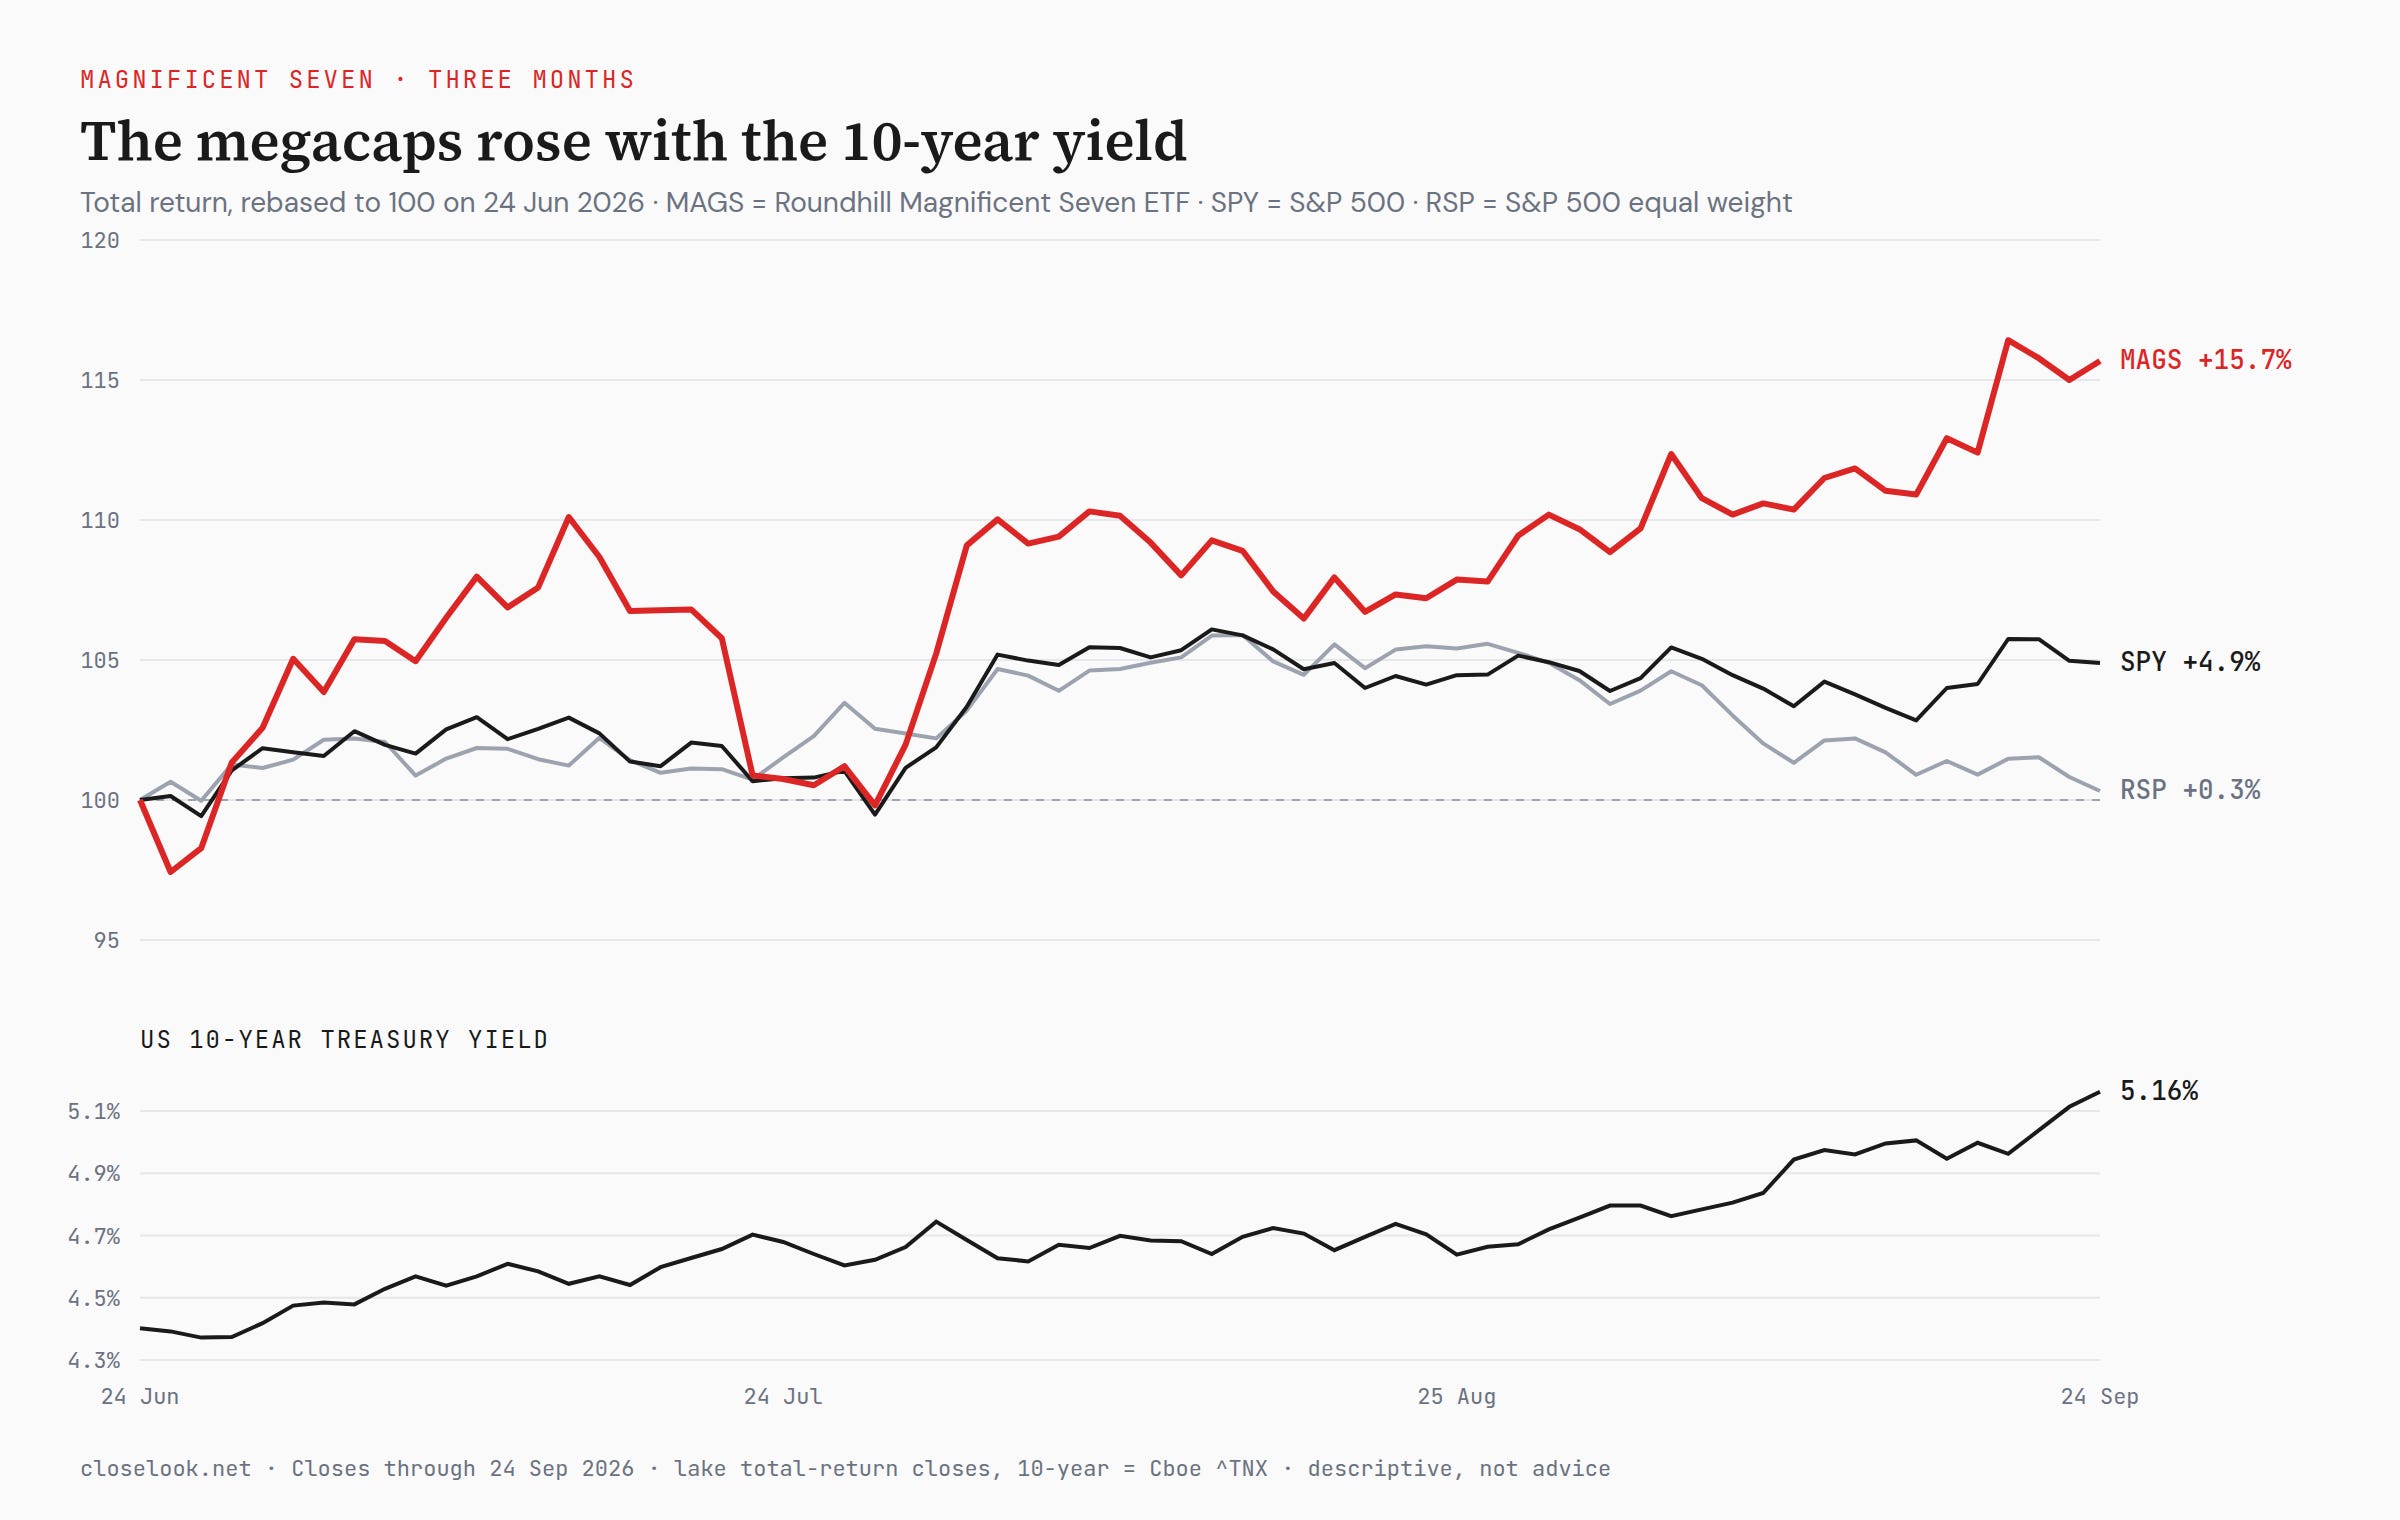
It is up 5.5% in September while the S&P 500 fund SPY is up 0.3% and the equal-weight S&P fund RSP is down 3.8%. Over three months MAGS is up 15.7% against 4.9% for SPY, and in the same three months the US 10-year Treasury yield climbed from 4.40% to 5.16%.
Tech stocks are supposed to suffer when rates rise, because their value lies far in the future and a higher discount rate shrinks it. This group is doing the opposite. CNBC framed the move on Thursday as the megacaps becoming a safe place to hide from a bond market that is punishing both stocks and bonds. Today’s diary entry tests that idea: what the seven did this month, what they did in every earlier stretch of rising yields since 2017, and what their cash flows and valuations say about why.
The month: one group, seven different stories
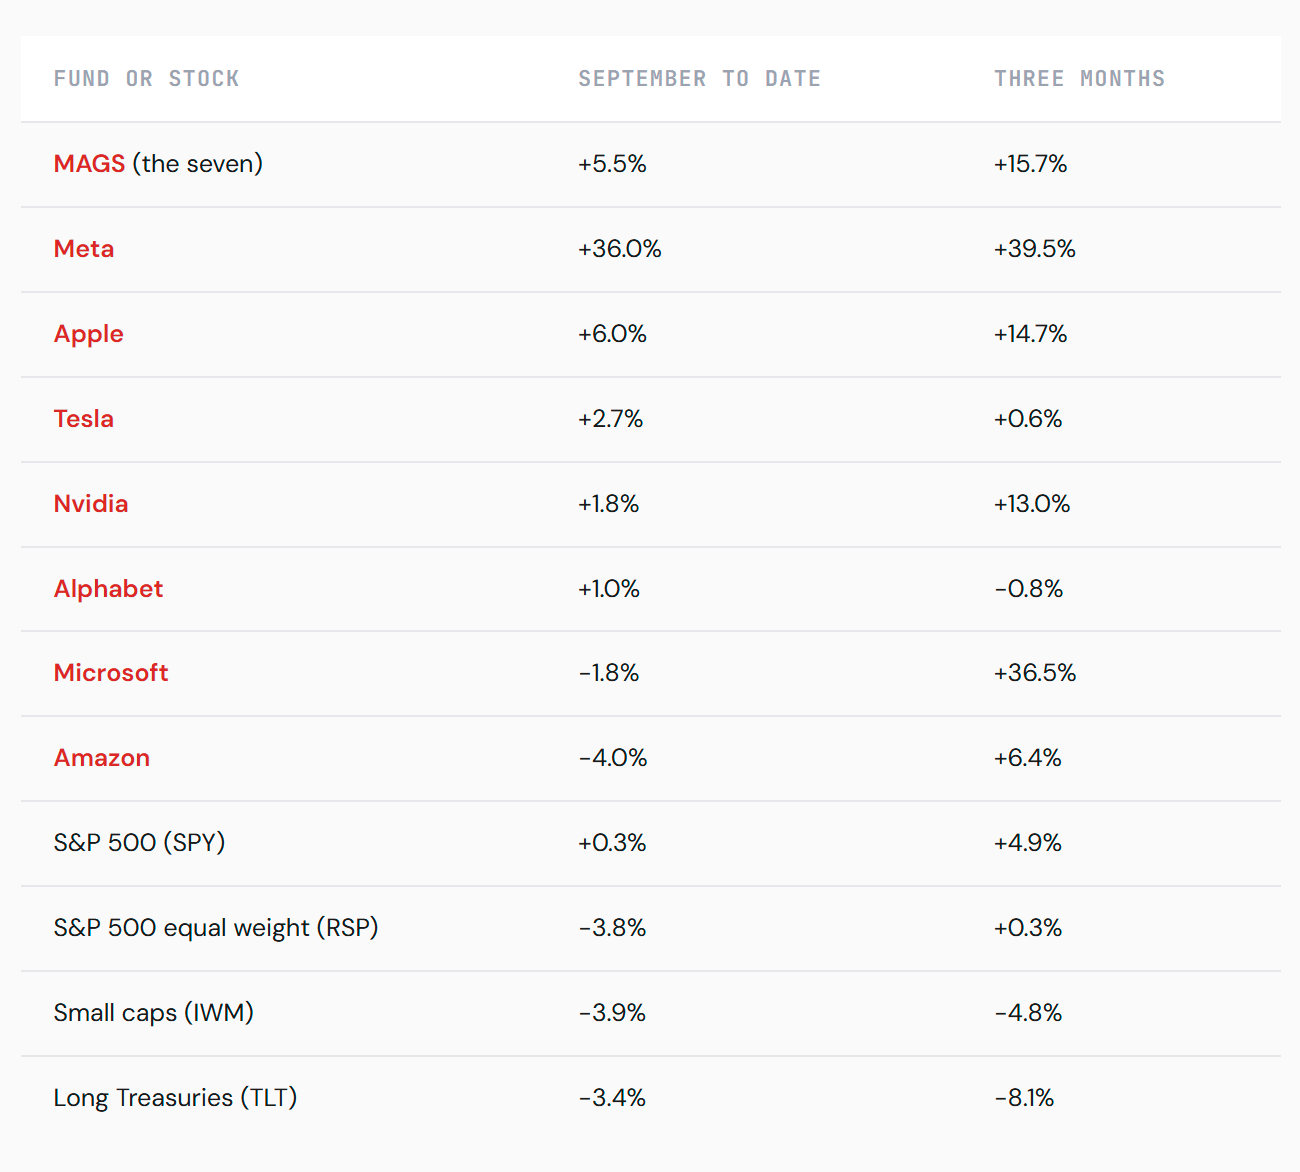
“The Magnificent Seven” sounds like one trade. The numbers show seven. In September Meta did most of the work, up 36.0% after unveiling its Muse shopping agent and naming Walmart and Best Buy as partners. Apple added 6.0%. Nvidia, Tesla and Alphabet rose between 1% and 3%. Microsoft fell 1.8% and Amazon 4.0%. Over three months the picture shifts: Microsoft is up 36.5% and Meta 39.5%, while Alphabet and Tesla are roughly flat.
Total return, closes of 24 September. The comeback is recent: from the close of 2 January to Thursday, MAGS is up 11.0% against 13.2% for SPY. For most of the year the group lagged, as the AI trade moved away from the largest companies toward chipmakers, memory and power. The gap between MAGS and the equal-weight S&P is the other side of the same story: the average stock is down this month, and the index is held up by a few of its largest members. That is what index concentration looks like in practice.
Closelooknet on Google
Get our reads first in Top Stories and AI answers. One tap, no account needed here.
History: five stretches of rising yields since 2017
Is this new? To check, we took every long stretch since 2017 in which the 10-year yield rose by more than one percentage point, or is rising now, and measured the seven stocks as an equal-weight basket against the S&P 500 from the yield’s low to its high.
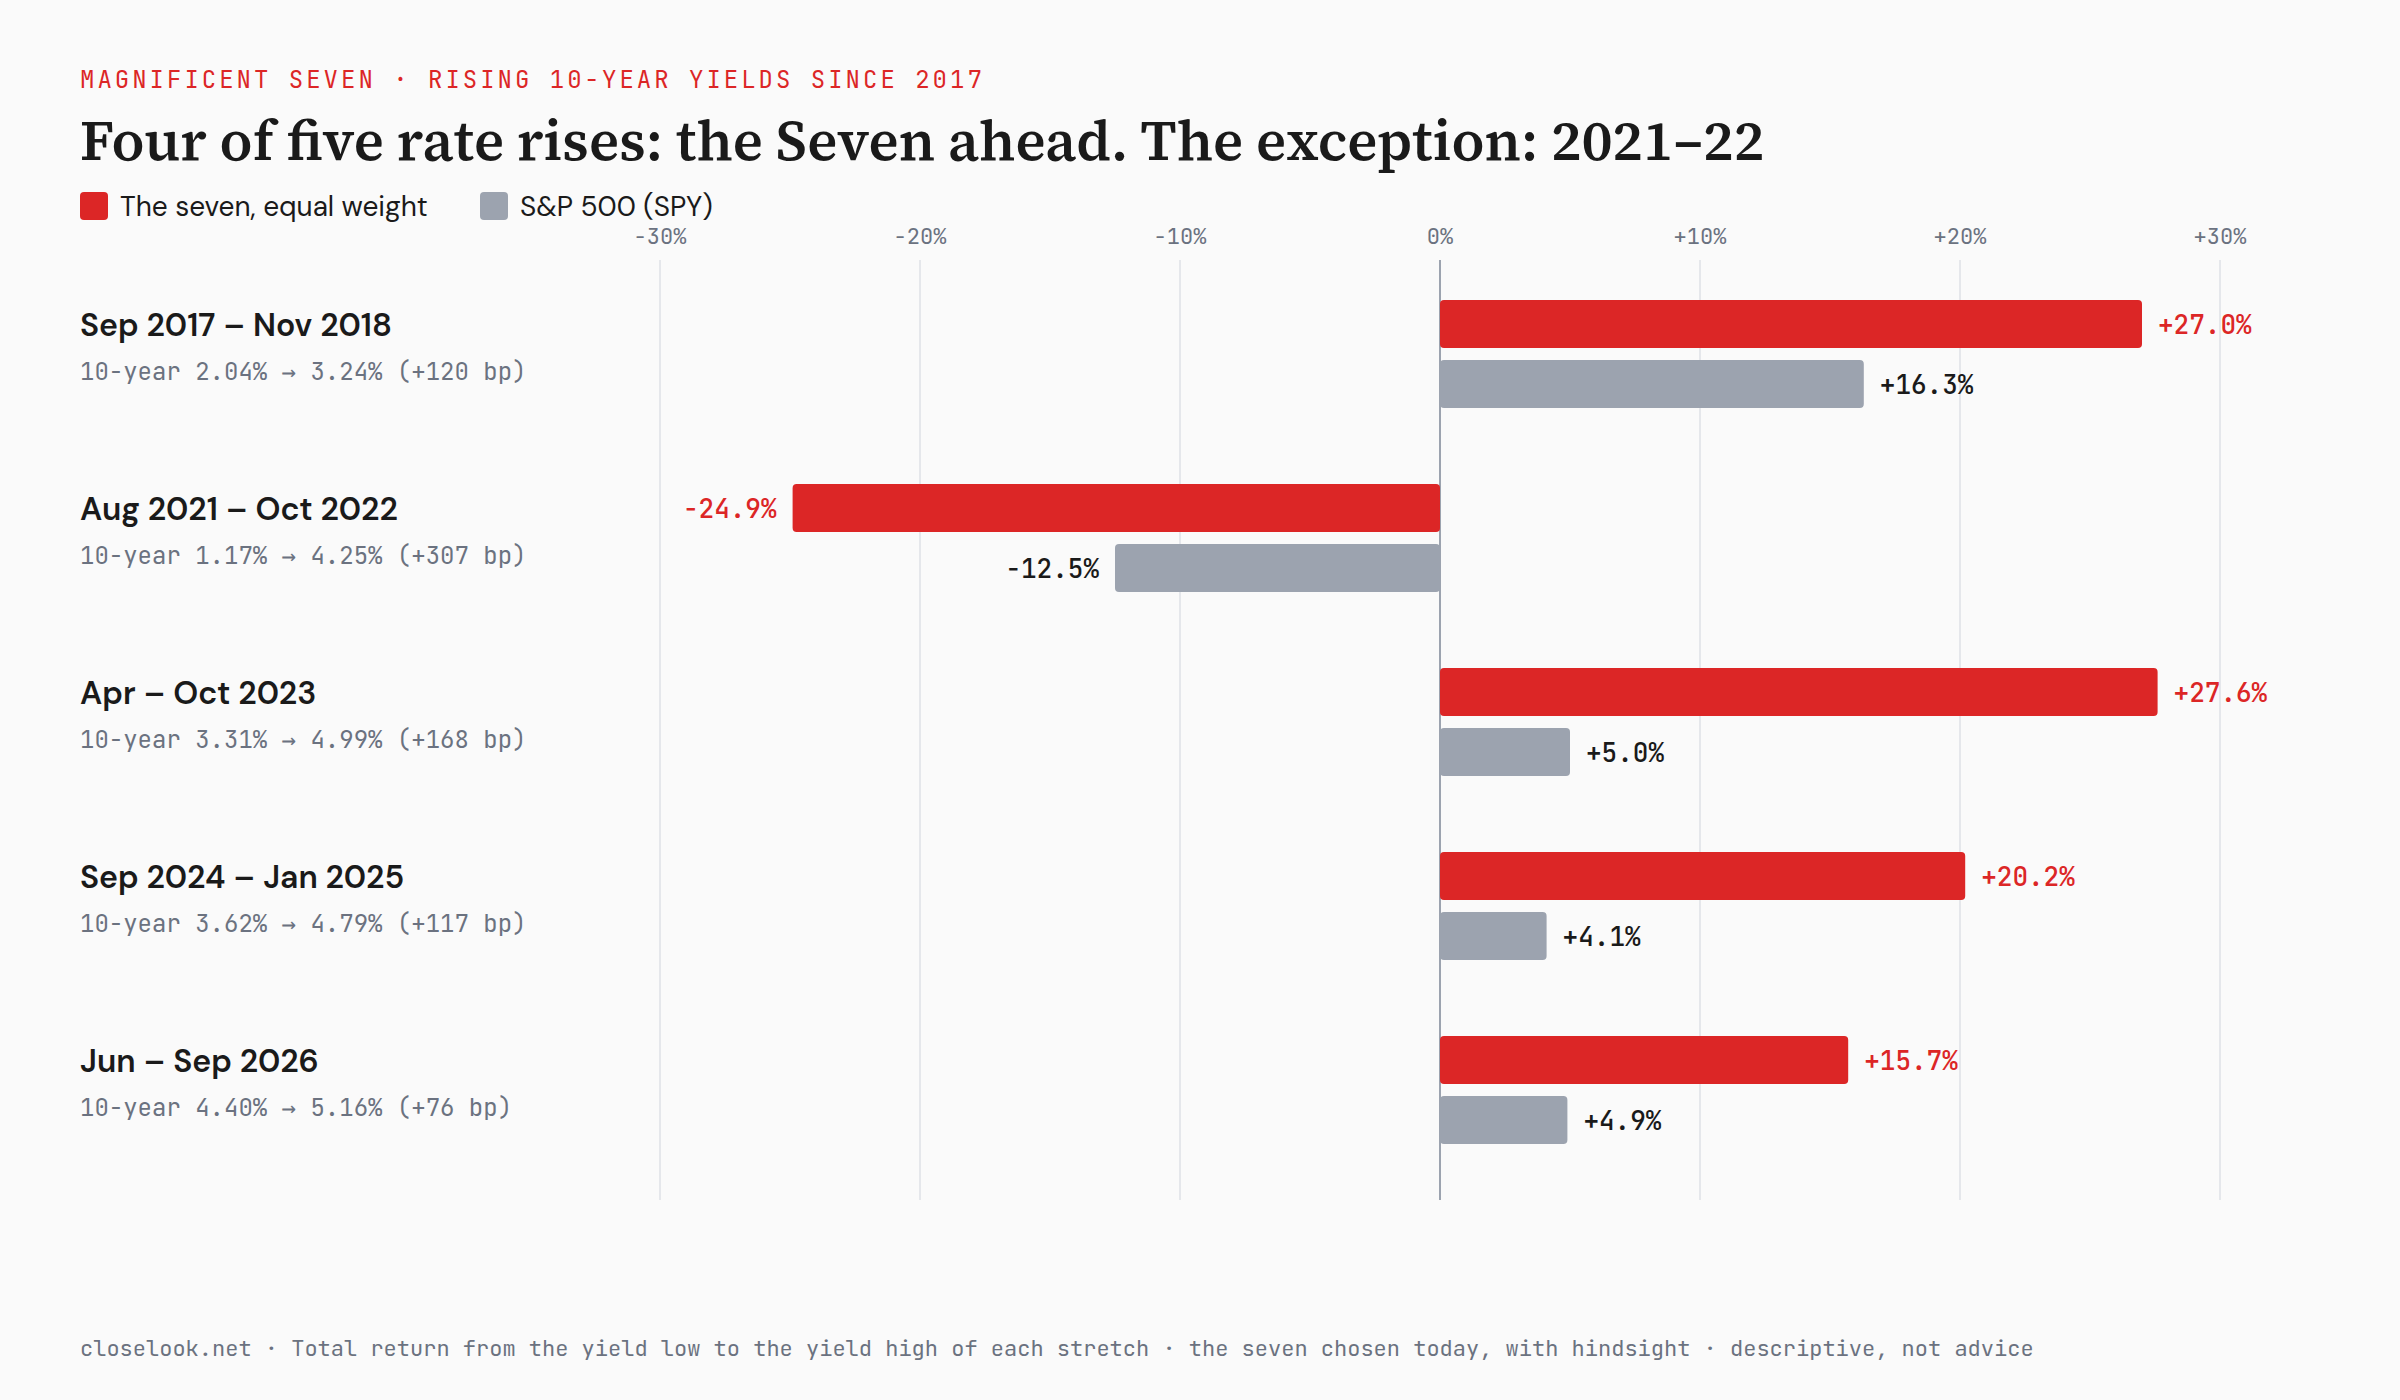
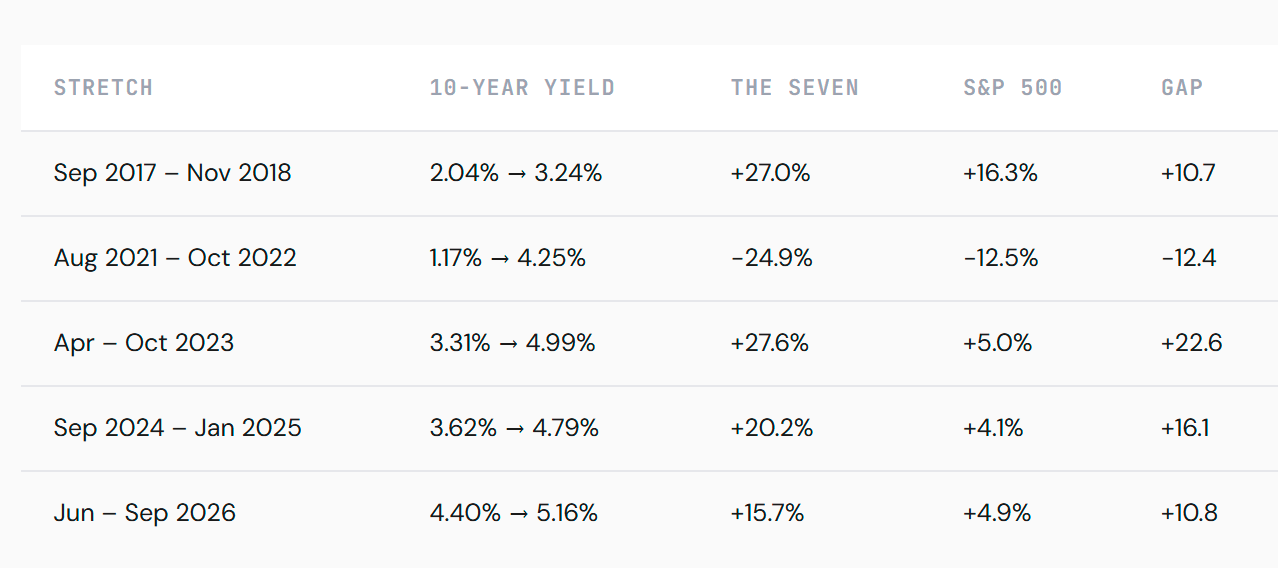
Four of five times, the seven came out ahead, by 11 to 23 percentage points. The 2023 stretch is the closest match to today: the 10-year climbed to 4.99% in October 2023, and the seven rose 27.6% while the S&P 500 managed 5.0%. Nvidia rose 55.7% and Meta 44.8% in those six months.
The exception matters more than the rule. From August 2021 to October 2022 the 10-year rose from 1.17% to 4.25%, and the seven fell 24.9%, twice as much as the S&P 500. Meta lost 63%, Nvidia 36%. Two things were different. Yields started from almost zero and more than tripled. And the seven started from very high valuations after the pandemic boom, so rising rates cut their multiples at the same time as their growth slowed. Size did not protect them.
Two caveats belong in the diary. First, these are today’s seven, picked with hindsight. In 2017 no one called them a group, and Meta fell 14.6% in the 2018 stretch. Second, each stretch is measured from the yield’s low to its high. The 2018 stretch ends on 8 November, before the sell-off of December 2018, which hit the megacaps hard. The table shows how the seven behaved while yields were rising, not what happened after.
Why: cash, growth and a cheaper price
Cash. In their latest fiscal years the seven produced about $396 billion of free cash flow between them: Apple $99 billion, Nvidia $97 billion, Alphabet $73 billion, Microsoft $67 billion, Meta $46 billion, Amazon $8 billion and Tesla $6 billion. The six that report interest expense paid about $7.8 billion in interest. A company that funds itself from its own cash does not care much what a new loan costs. A small company that borrows at a floating rate does, which is one reason the small-cap fund IWM is down 4.8% in the same three months.
Growth. Revenue is still rising fast: Nvidia 106% on the year, Meta 28%, Tesla 26%, Alphabet 24%, Amazon 20%, Microsoft 18% and Apple 16%, on the vendor’s latest year-on-year figures. David Miller, chief investment officer at Catalyst Funds, put the choice this way to CNBC: “you can own equities that have revenue growing well into the teens”, or a Treasury that he called “essentially a currency bet” on a country “deliberately running a very large deficit that it can’t afford to pay”.
A cheaper price. Five of the seven trade at 22 to 25 times next year’s expected earnings: Meta 21.8, Alphabet 22.8, Amazon 23.0, Nvidia 24.5, Microsoft 25.1. Apple is at 35.1 and Tesla at about 154. CNBC reported that the group’s multiples had fallen to historic lows earlier in the year, when investors doubted the return on AI spending. That is the key difference from 2021: then, rising rates met expensive stocks; now they meet stocks that had already been marked down.
The idea extends to credit. Asked on CNBC on Tuesday whether lending to a hyperscaler is as safe as lending to the US government, Howard Marks, co-chairman of Oaktree Capital Management, said: “I think that the hyperscaler at 8% may have a higher expected return than the Treasury at 5%, because I think it has a rather low risk of default.”
The catch: the cash is being spent
The safe-haven argument rests on cash flow, and the cash flow is shrinking relative to what these companies are building. In their latest fiscal years Amazon spent $132 billion on capital projects, Microsoft $116 billion, Alphabet $91 billion and Meta $70 billion: about $409 billion for the four, most of it on AI data centers. Amazon’s free cash flow is down to $8 billion. When the cash runs short, the rest is borrowed, and lending to a hyperscaler is exactly what Marks was describing.
Thursday showed where that chain is thinnest. Oracle, which is building data centers on borrowed money, sent a force majeure notice on its Project Jupiter campus in New Mexico and fell 3.47%; Arm fell 7.88%. The seven held up because they sit at the top of the chain, with the cash. The further down the chain a company sits, the more a 5% Treasury yield costs it. See our capex intensity entry and the Credit Stress board for where the borrowing is.
And the 2021–22 lesson stays open. The seven hold up when rates rise because growth is strong. If yields keep rising while growth slows, or if the market decides the AI spending will not pay back, the same stocks can fall faster than the index, as they did then.
What would change the read
The pairing breaks. For three months MAGS and the 10-year have risen together. A week in which yields rise and MAGS falls would be the first sign that rates have started to bite, as in 2022. Breadth. MAGS up and RSP down is a narrow market. If the equal-weight index catches up, the rally broadens; if the seven start to fall while RSP is already down, there is nothing underneath. Meta. Up 36% in a month on one product event, it carries more of September than any other name. Levels. The record close for MAGS is $72.97 from 21 September. The 10-year closed Thursday at 5.162%, and the 30-year touched 5.501%, its highest since 2004. Our Mag Pulse board tracks the cohorts every day. This is an investment diary, not advice.
Into tomorrow
MAGS: the record close is $72.97 (21 September); Thursday $72.51. The pairing: a day with the 10-year up and MAGS down is the first 2022-style signal. Breadth: RSP −3.8% in September against MAGS +5.5% — watch whether the gap closes from below or above. Data: durable goods today at 12:30 UTC; next Wednesday the Fed’s preferred inflation gauge (PCE) and Micron’s results.
The signals behind thisEach line links to the tool it comes from
LabMag Pulse — the cohorts of the seven every day, and the hyperscaler vs consumer-AI regime line→LabCredit Stress — who is borrowing to build the data centers; Oracle the only second-tier name→GlossaryEqual weight vs cap weight — why RSP falls while the S&P 500 holds→GlossaryDuration — why higher rates usually hit growth stocks hardest→PulseRates — the 5-year hits 5%: growth story or debt story? (24 September)→Morning 10The 30-year hits its highest since 2004; Oracle and Arm sold, Meta and Intel bought