


The Nasdaq 100 went through the worst stretch of the calendar and came out higher. Since 1986, September has been the only month in which the index loses on average, and August is the second-weakest. This year it rose 4.2% in August and 3.2% in September, closed Wednesday at 30,408.50 and sits 1.05% below its record close of 30,732.40 from 22 September. Futures point to a gain of about 1.5% at Thursday’s open: enough for a new high. It did that while long-term bonds fell to their lowest close in a year.

The weak window is behind us
We counted every month since 1986. On average the Nasdaq 100 rose in eleven of twelve months; only September lost, by 0.5%, and it rose in just 21 of 40 years. October, November and December together added 6.1% on average, and the final quarter was positive in 28 of 40 years.
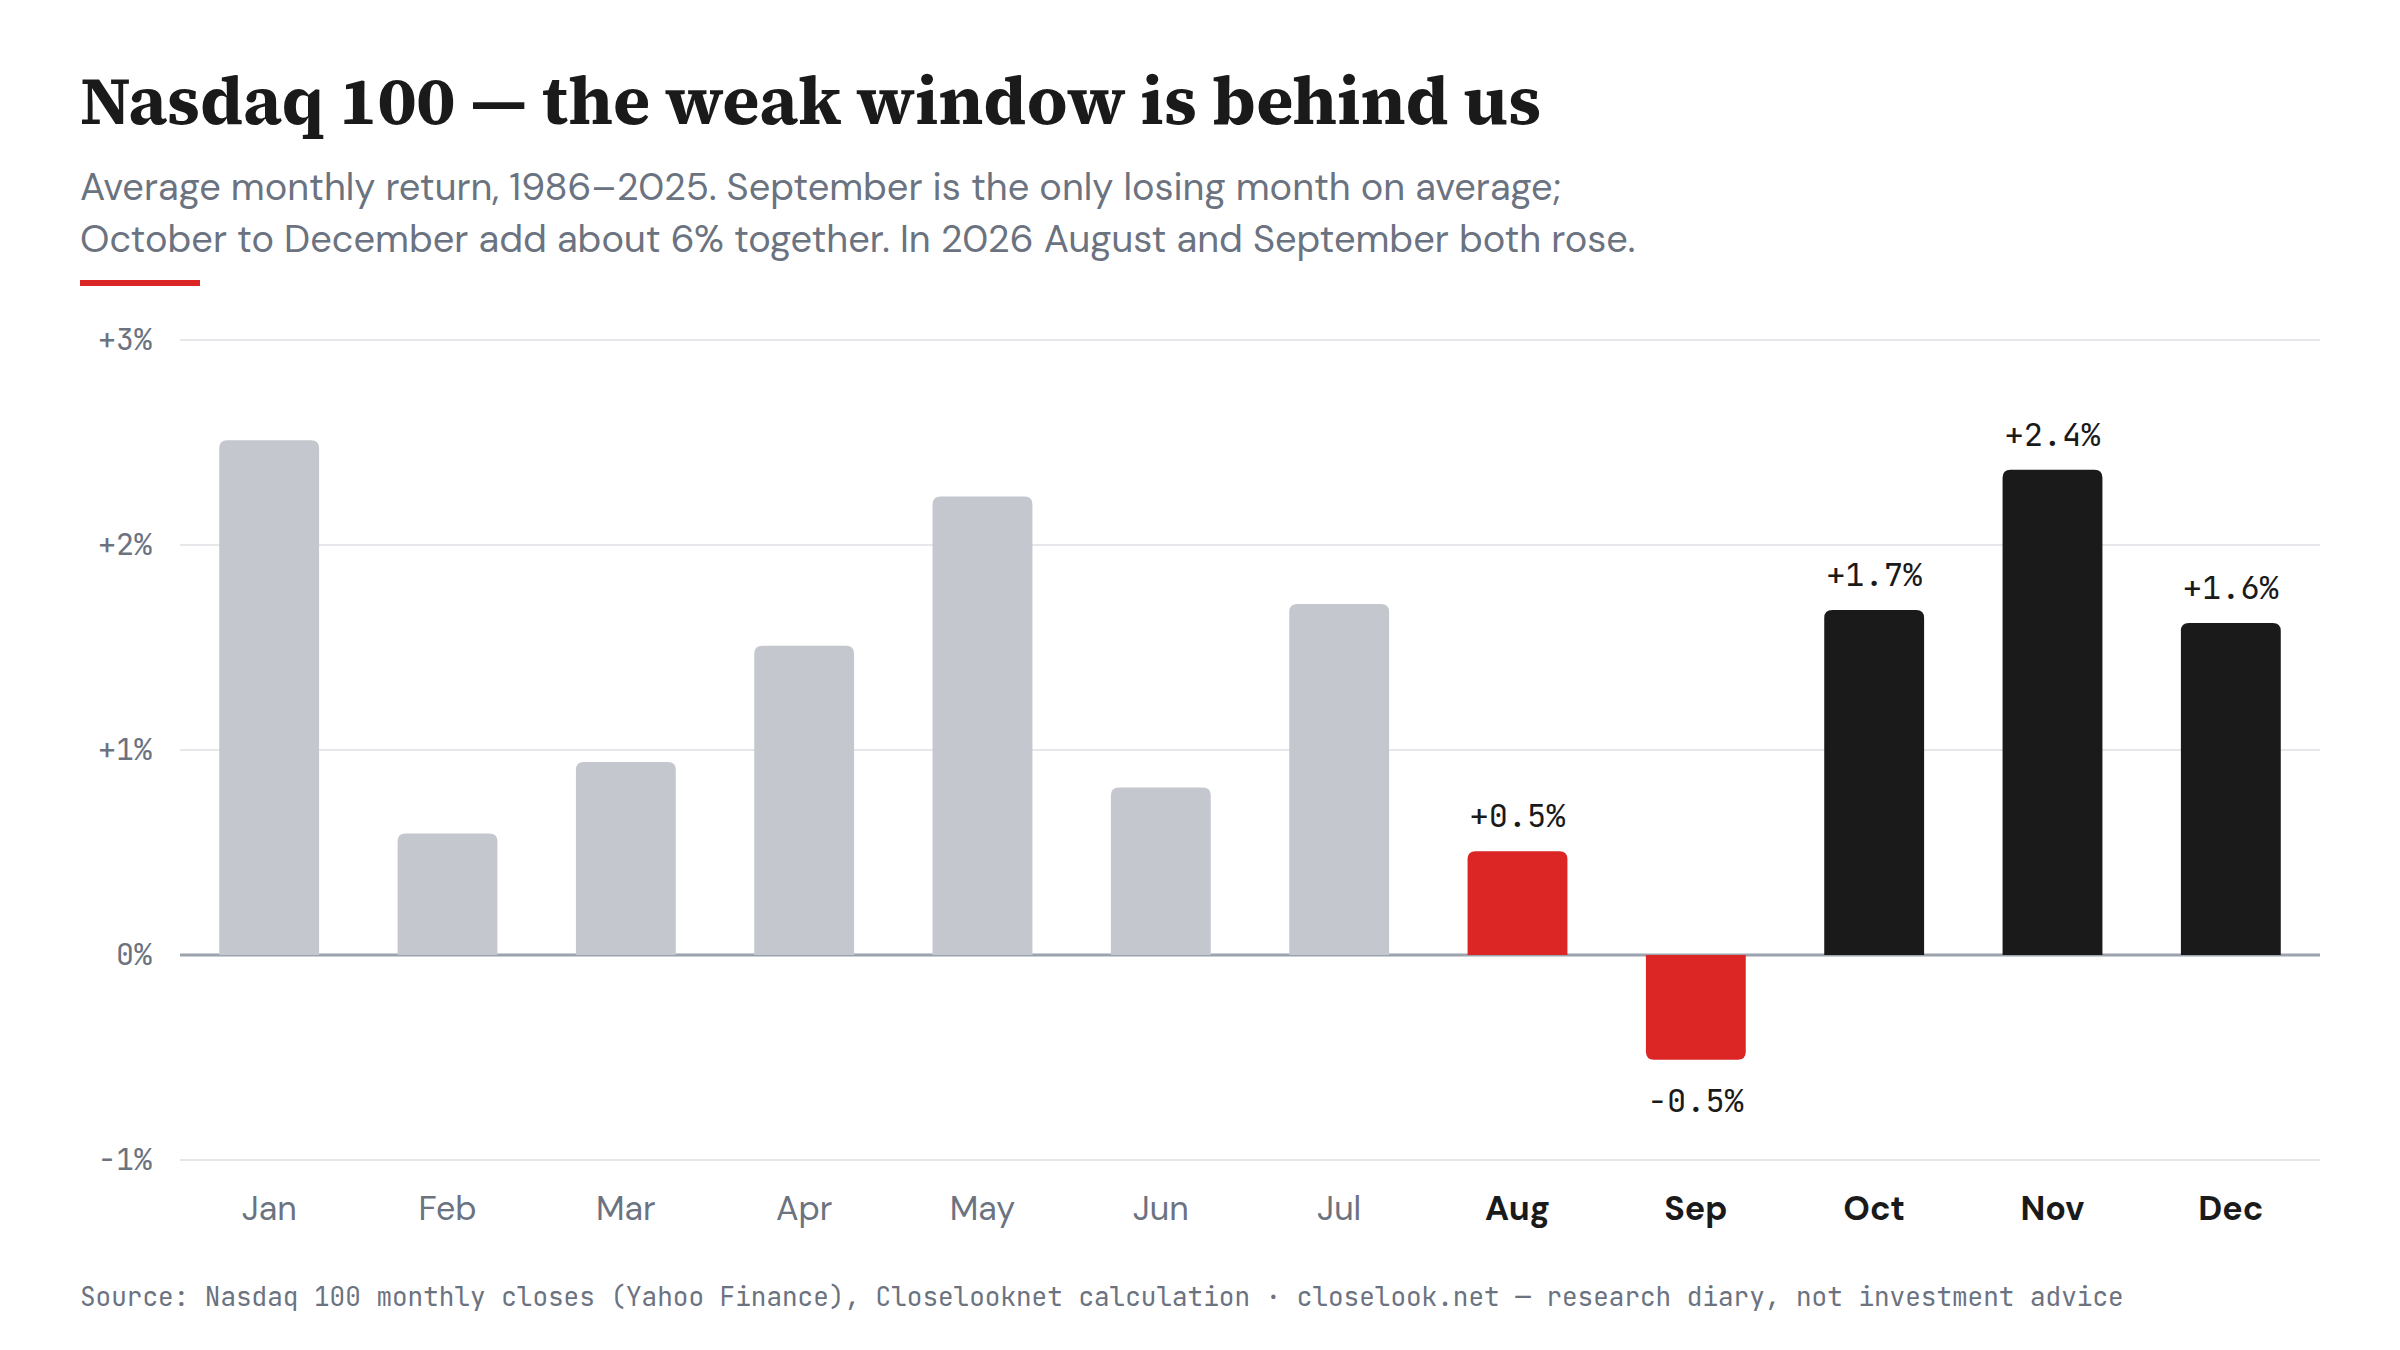
October’s average hides its worst days: the crash of 1987 (−26.8% in the month) and 2008 (−16.3%). But neither was a midterm year. In the ten midterm years since 1986, October rose eight times, by 3.9% on average. The folklore says the first weeks of October stay choppy before the rally starts; the midterm data is kinder than the folklore. The vote is on 3 November.
Closelooknet on Google
Get our reads first in Top Stories and AI answers. One tap, no account needed here.
The midterm pattern: ten out of ten
Midterm years are the weak half of the four-year presidential cycle, and they tend to end well. From the end of September of a midterm year to the following June, the Nasdaq 100 rose in all ten cases since 1986, by 31.4% on average. In all other years the same nine months returned 14.8% on average and rose in 31 of 39 cases. The final quarter alone rose in eight of ten midterm years.
Nasdaq 100 in midterm years — the final quarter and the nine months after September
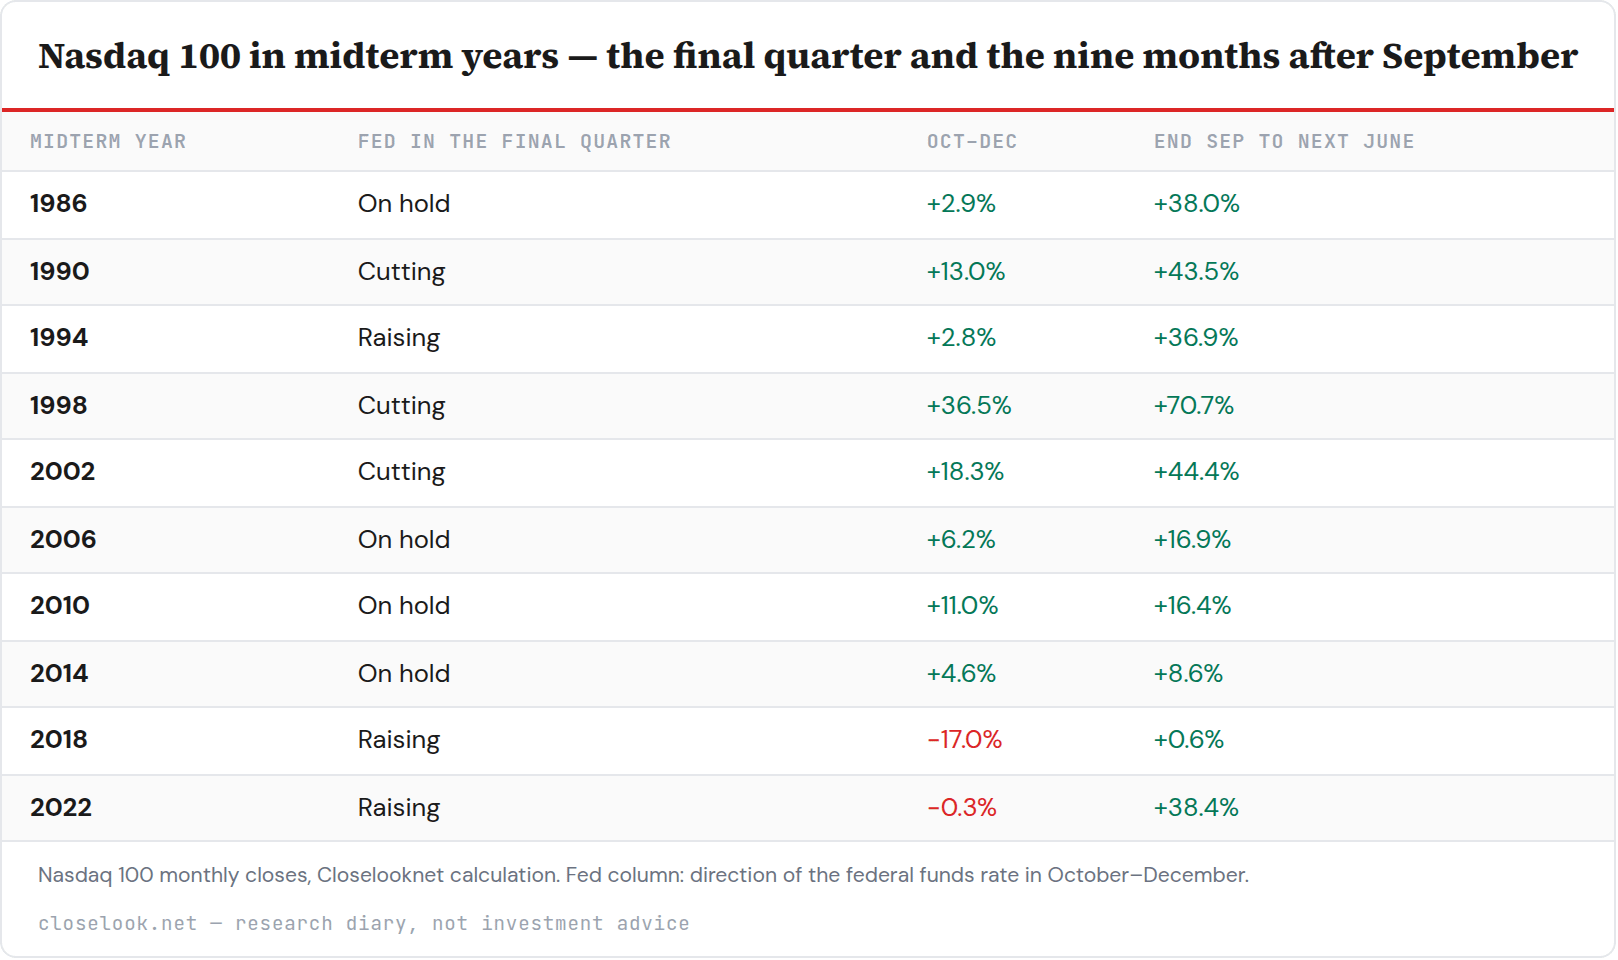
Table as text
Nasdaq 100 monthly closes, Closelooknet calculation. Fed column: direction of the federal funds rate in October–December.
The table also shows where the pattern breaks. The three midterm years in which the Fed was raising rates into the vote — 1994, 2018 and 2022 — gave the weakest final quarters: +2.8%, −17.0% and −0.3%. In the seven others the final quarter added 13.2% on average. Even in the hiking years the following June was higher, but in 2018 only by 0.6%.
Is this time different? The case for a normal midterm
Earnings are rising fast. FactSet’s consensus expects S&P 500 earnings to grow 29.1% in the third quarter, which would be the third quarter in a row above 25%, with 25.2% pencilled in for the fourth. Analysts raised their third-quarter estimates during the quarter, from 26.7% at the end of June, which is rare. The forward price-earnings ratio of 19.2 sits below its five-year average of 19.8: prices have risen, but profits have risen faster.
Labour costs are not the problem. Unit labour costs, the wage bill per unit of output, rose at an annual rate of 1.2% in the second quarter and just 1.4% from a year earlier, as productivity grew 2.2%. Ed Yardeni points to that figure as the good news inside a hot economy: companies are paying more per hour, but each hour produces more.
Core inflation is softer than the headlines. The Fed’s preferred gauge, core PCE, rose 0.2% in August and 3.0% from a year earlier, below the 3.3% expected. The Minneapolis Fed puts the tariff contribution to core inflation at 0.2 to 0.4 percentage points; without energy, food and tariffs, the underlying pace is closer to 2.6–2.8%. Above the 2% target, but not running away.
The case for 2018 and 2022
The Fed is talking about hikes again. New York Fed President John Williams said one further increase “may be appropriate late this year”; Governor Michael Barr said further adjustments are “likely to be needed”. Yardeni goes further and argues the Fed should reverse last year’s three insurance cuts with two more hikes. The economy is strong: job openings, consumer spending and factory surveys all point up, and the Atlanta Fed’s wage tracker rose to 4.1% in August, its fastest pace since September 2025.
The long-bond fund TLT closed at 77.78 on Wednesday, below 78 for the first time in this slide and at its lowest close in a year, with the 30-year Treasury yield near 5.6%. That is the setting of 2018: strong earnings, a Fed that kept raising, and a fourth quarter that lost 17%.
Our read
Two things are different from 2018. First, stocks are not falling with bonds: the Nasdaq is a step from a record on the morning after TLT broke 78. Second, the bond market may already price more tightening than the Fed delivers. One or two hikes from here are in the open; if the long end has priced the worst case, the next surprise for bonds is a friendly one, and that would remove the one thing that broke the midterm pattern before. The test comes quickly: Friday’s jobs report, then the start of the earnings season in mid-October. If earnings keep beating and TLT stops falling, the calendar is on the side of the Nasdaq. This is a diary of what we watch, not advice.
C · members block
Into tomorrow
Today: Accenture before the open, jobless claims at 12:30 UTC, the ISM factory survey at 14:00 UTC; Nike after the close. Does the Nasdaq 100 close above its 30,732.40 record? Friday: the September jobs report — the next test for TLT below 78. The lines: Nasdaq 100 record 30,732.40 (22 Sep); TLT 78 from above, 74 below.
The signals behind thisEach line links to the tool it comes from
Morning 10 Markets — Nasdaq +1.5% before the open even as TLT breaks 78→
Lab Rates — the long end, TLT and the 30-year every day→
IndexAI Board — which AI names are gaining and losing strength→