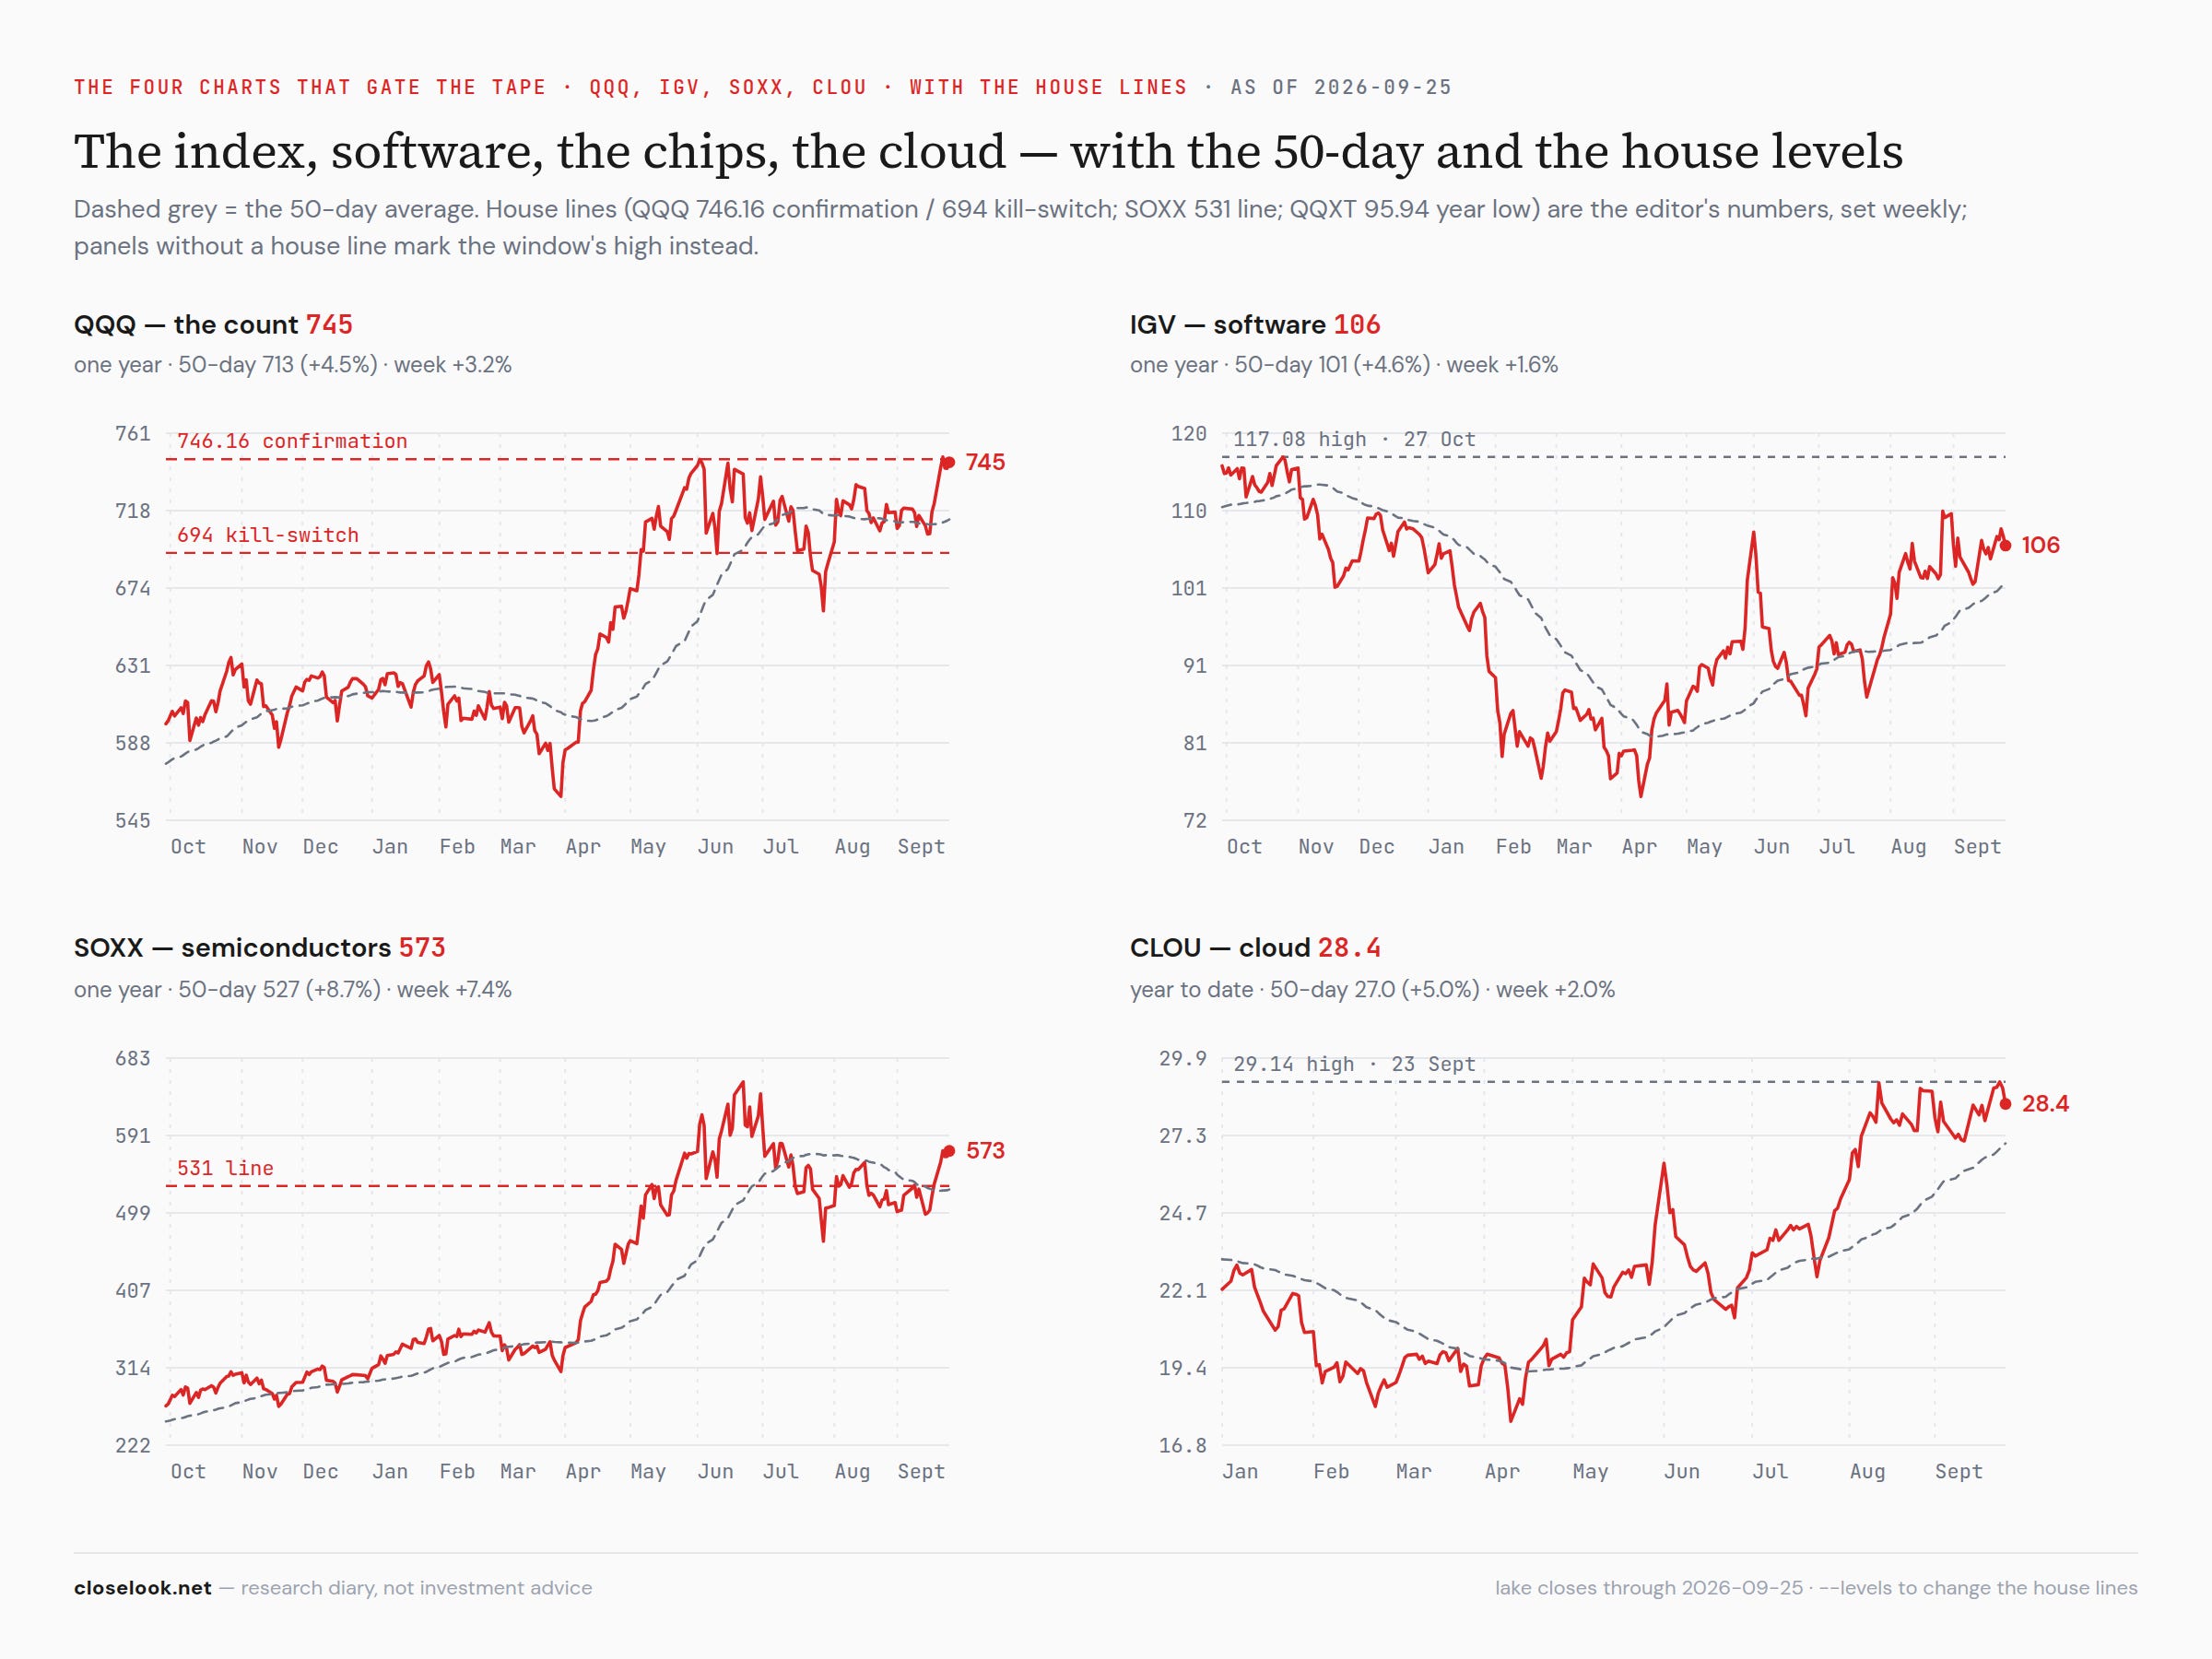
The chip index rose 7.4%, software turned positive on the year, and the Magnificent Seven broke out of a ten-month box. Underneath, the Nasdaq 100 without its tech stocks has fallen from its 2026 high to within one percent of its low in five weeks, the equal-weight S&P and the small caps fell, and the whole Treasury curve moved up — the thirty-year to its highest since 2004. The uncertain window runs to the midterm elections; the year-end rally comes after it.

1 · This Week’s Action
The tape, day by day. Five sessions: two up, two down, one up, and the index finished higher. Monday: the S&P +1.55% to 773.50 and the Nasdaq 100 fund +2.77% to 741.47 — Korea’s chip exports up 259% in twenty days, Meta +11.3% on its agent’s app-store rank, Arm +14% and Intel +13% at midday, bitcoin through 86,000. Tuesday: the Nasdaq 100 at 747.46, its highest close of the year, the Composite at a second record close, AMD into the trillion-dollar club; the S&P flat. Wednesday: −0.72% on the S&P and −0.84% on the Nasdaq — a flash business survey showing the fastest US output growth in more than five years, Fed Governor Barr saying more increases are likely needed, the ten-year back above five percent. Thursday: flat — the thirty-year to 5.45%, Oracle’s force-majeure notice, Arm −7.9%, Meta +4.5% after its Connect event. Friday: +0.54% and +0.46% — Microsoft +3.6% on Copilot, Meta −3.3%, oil −3.5% on US–Iran talk. The week: the S&P +1.27% to 771.35, the Nasdaq 100 +3.19% to 744.50, the equal-weight S&P −0.56%, small caps −0.75%.
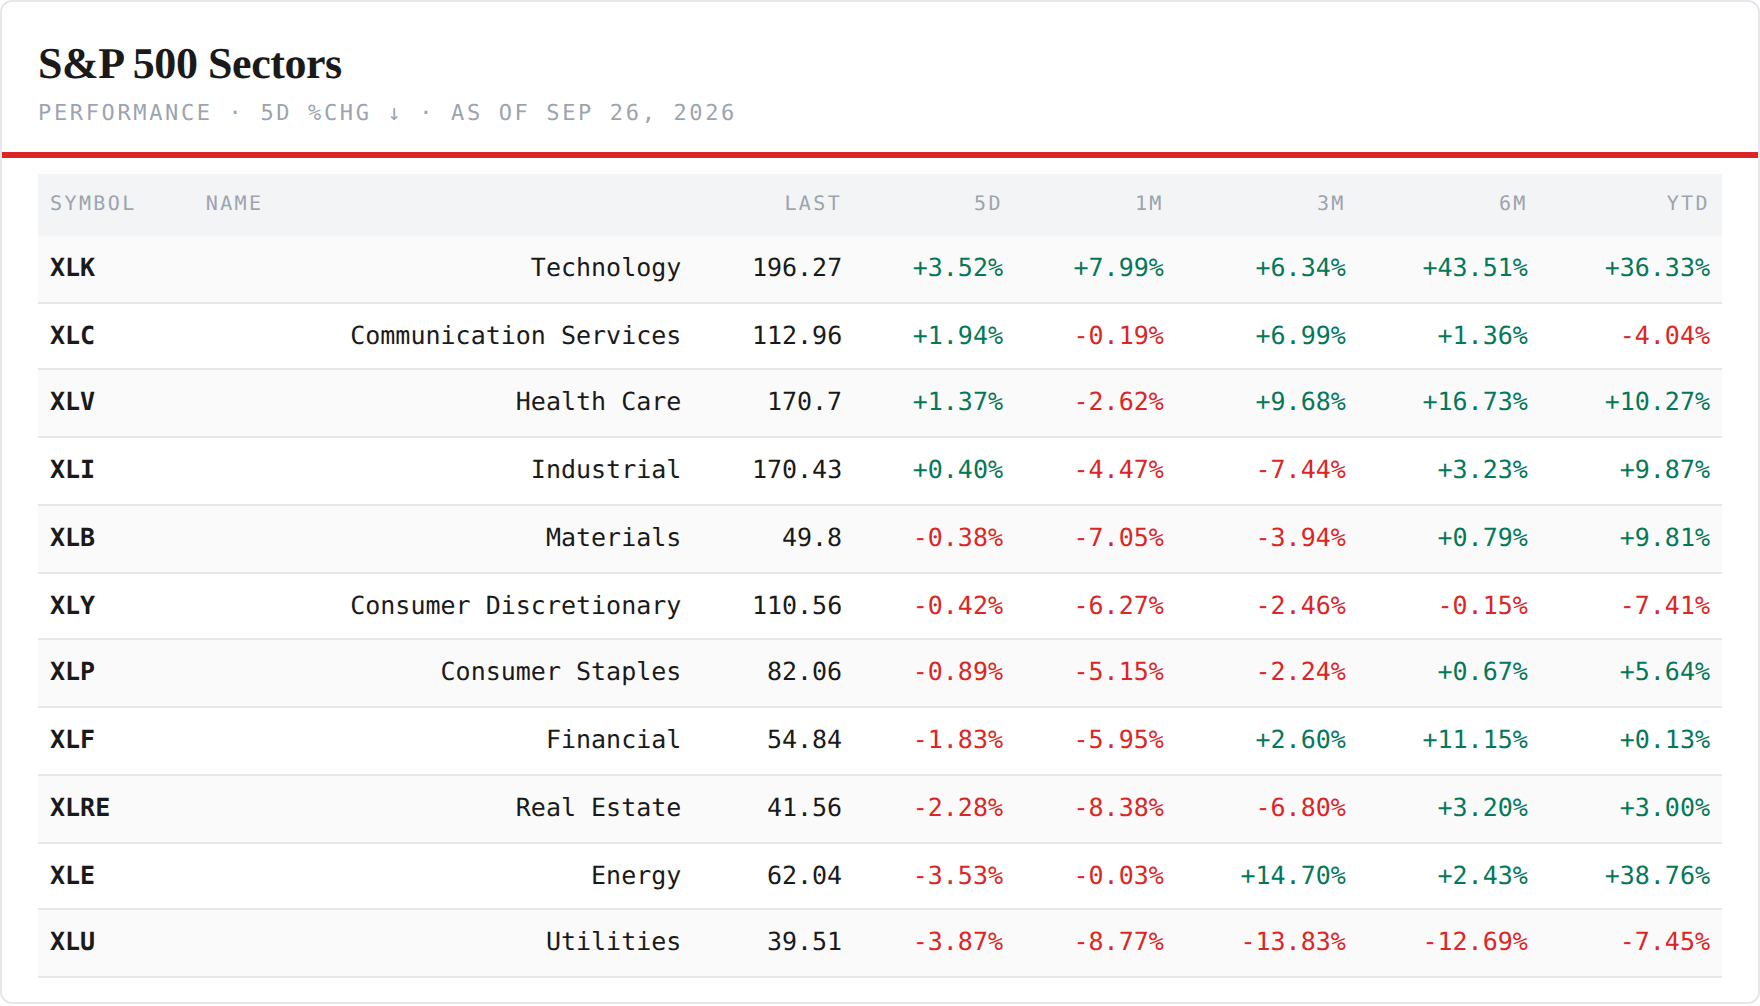
The eleven S&P 500 sectors
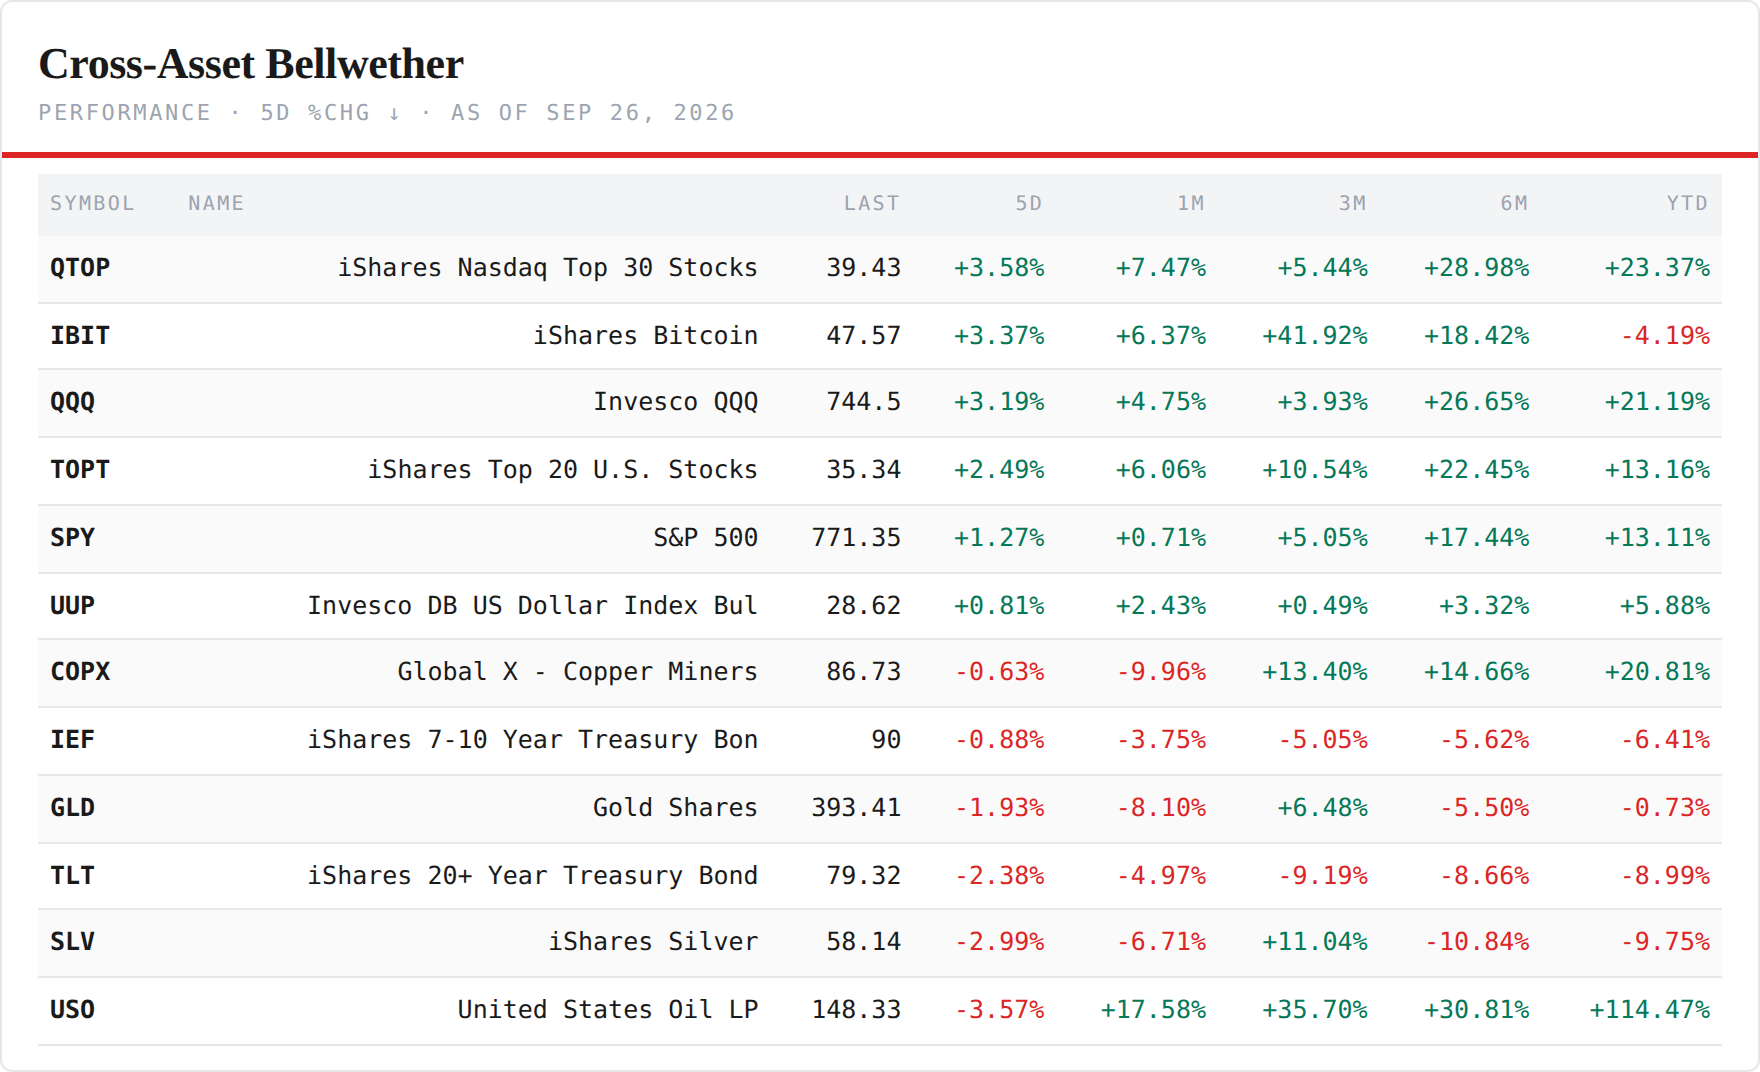
Four green, seven red — technology on top, the rate-sensitive groups at the bottom. Technology +3.52%, communications +1.94% (Meta’s week), health care +1.37%, industrials +0.40%. Then materials −0.38%, discretionary −0.42%, staples −0.89%, financials −1.83%, real estate −2.28%, energy −3.53%, utilities −3.87%. A week with the ten-year up 18 basis points sorted the sectors by one question: does the business grow faster than its discount rate rises? Technology does; utilities, real estate and financials pay for rates rather than earn from them; energy fell with its barrel.
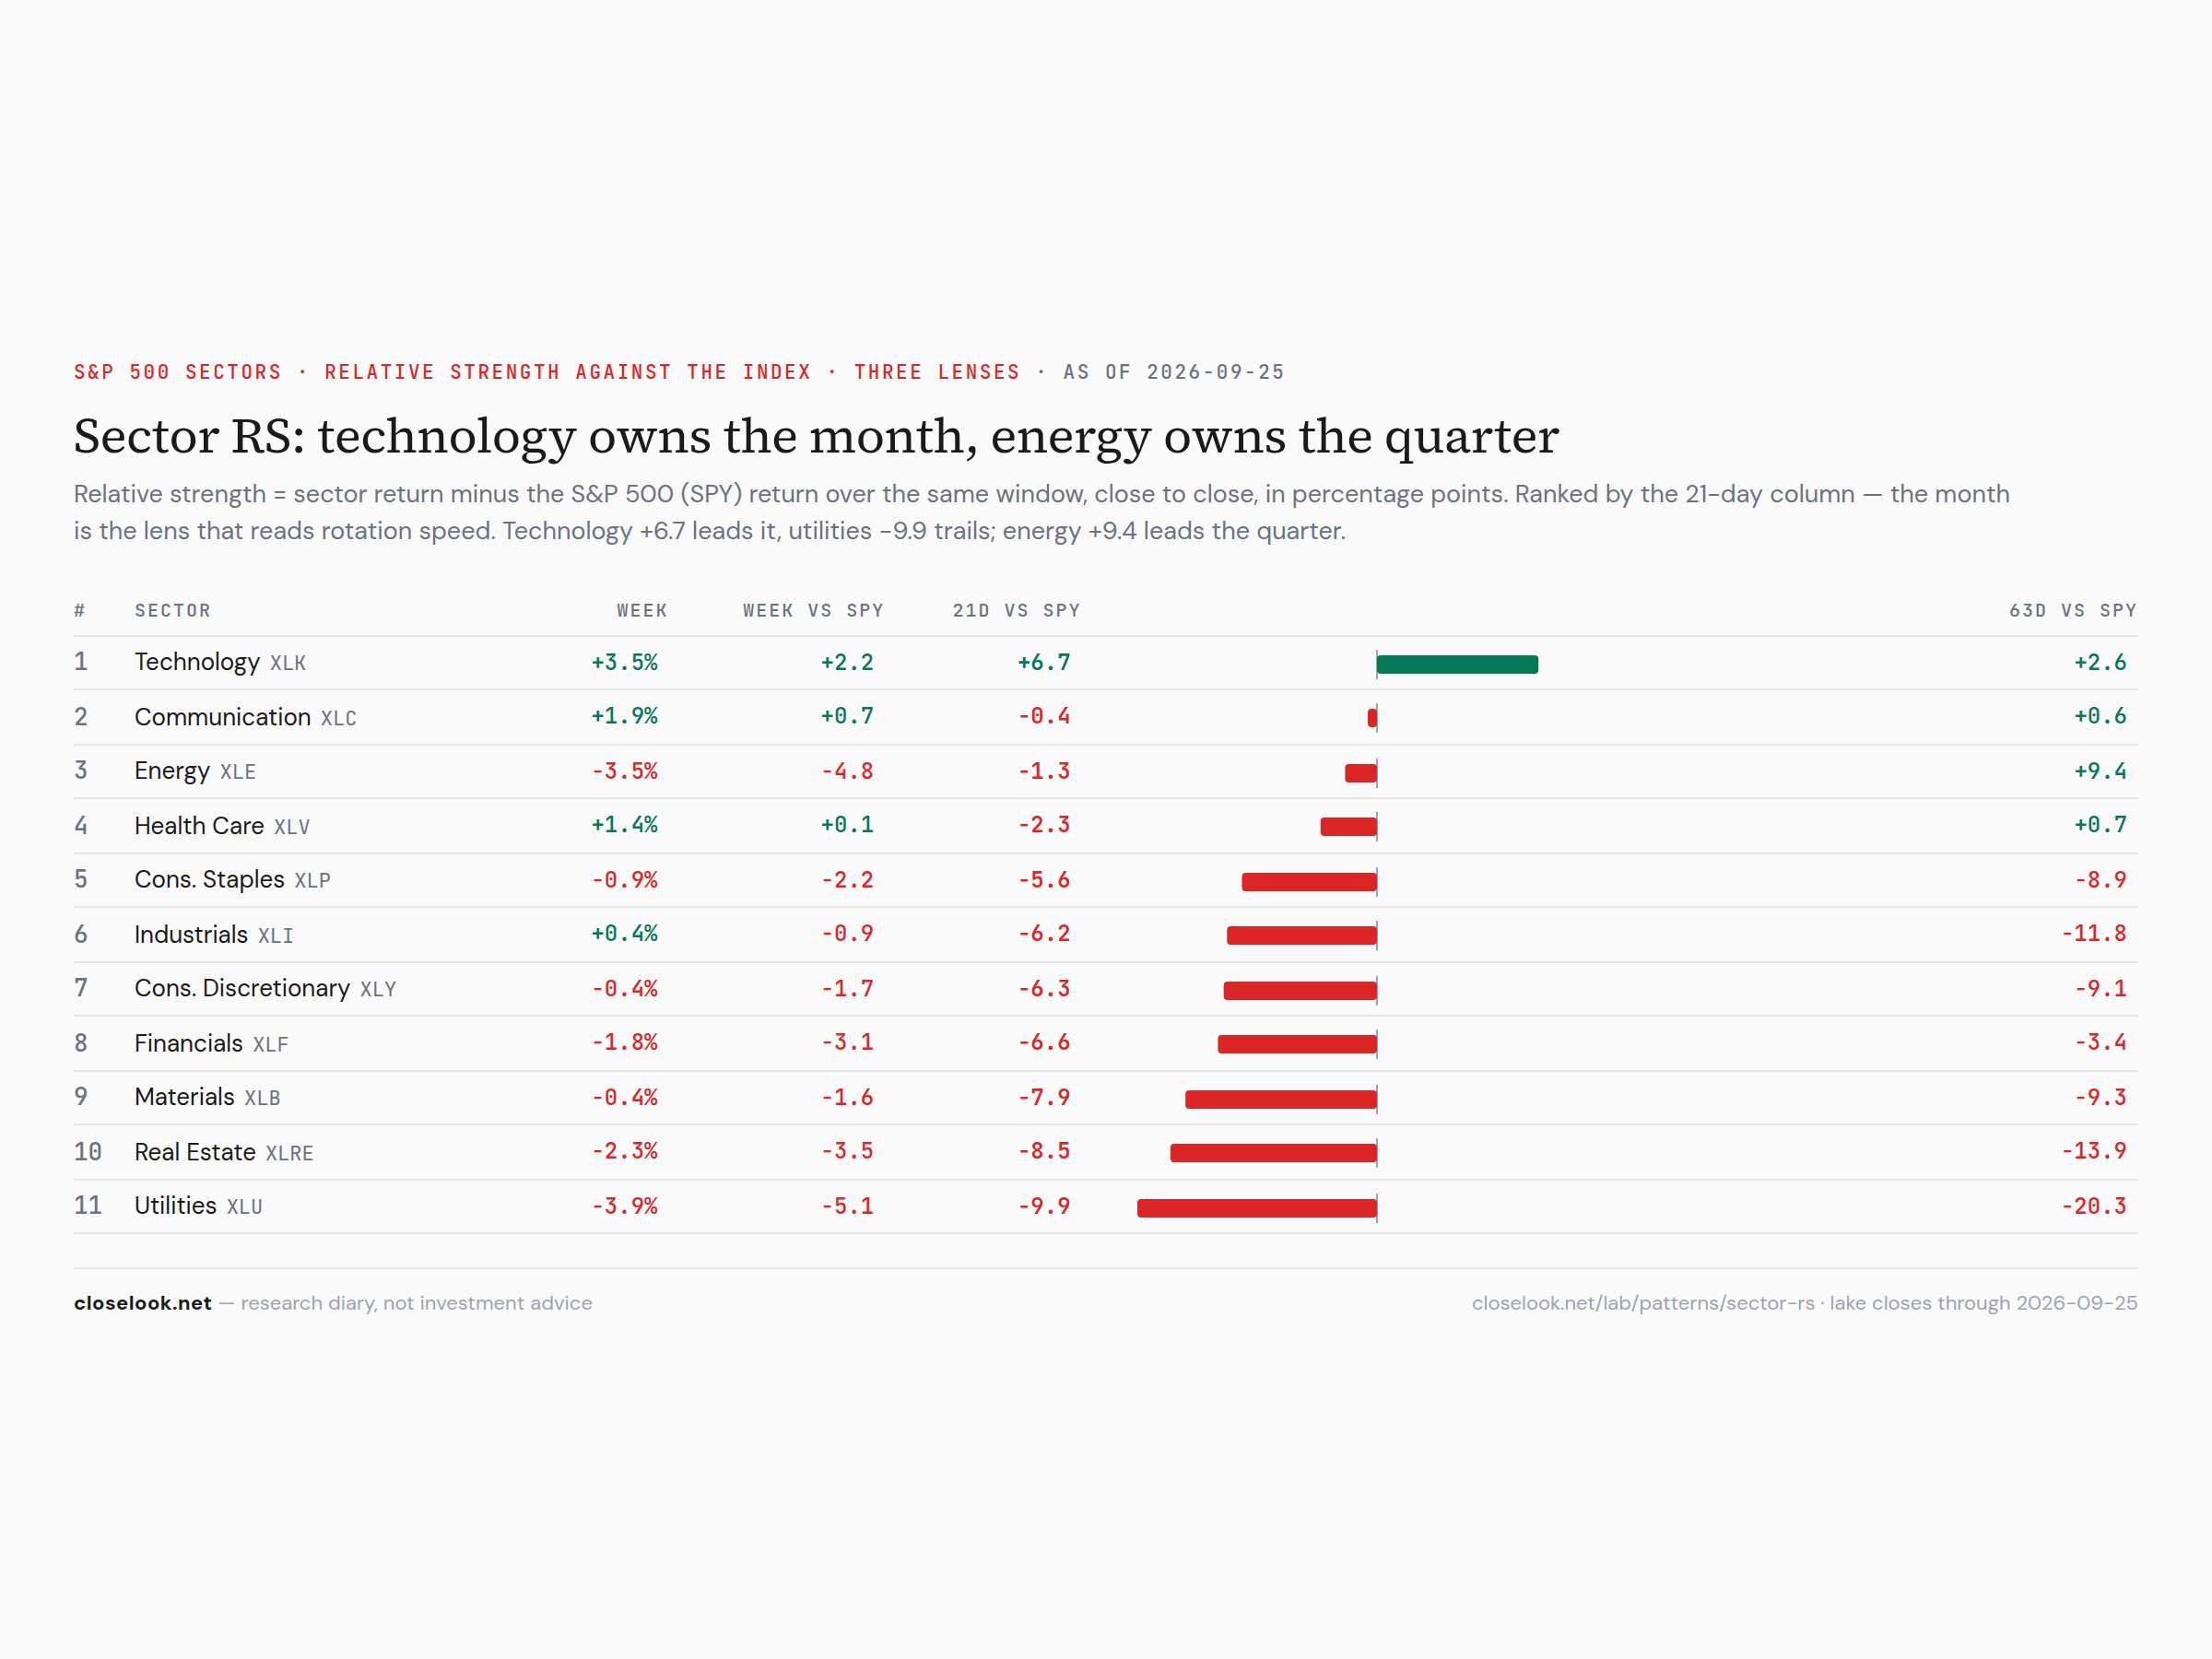
The sector rankings — three lenses. Against the S&P over the week, technology led by 2.2 points and communications by 0.7; utilities lagged by 5.1, energy by 4.8, real estate by 3.5 and financials by 3.1. Over twenty-one sessions technology is the only sector clearly ahead of the index, by 6.7 points — health care −2.3, communications −0.4, energy −1.3, and everything else five to ten points behind: utilities −9.9, real estate −8.5, materials −7.9, financials −6.6, discretionary −6.3, industrials −6.2, staples −5.6. Over sixty-three sessions energy still leads, by 9.4 points, then technology +2.6 and health care +0.7; utilities trail by 20.3. The month belongs to technology outright; the quarter still belongs to energy, and energy’s week was its worst relative week in the table.
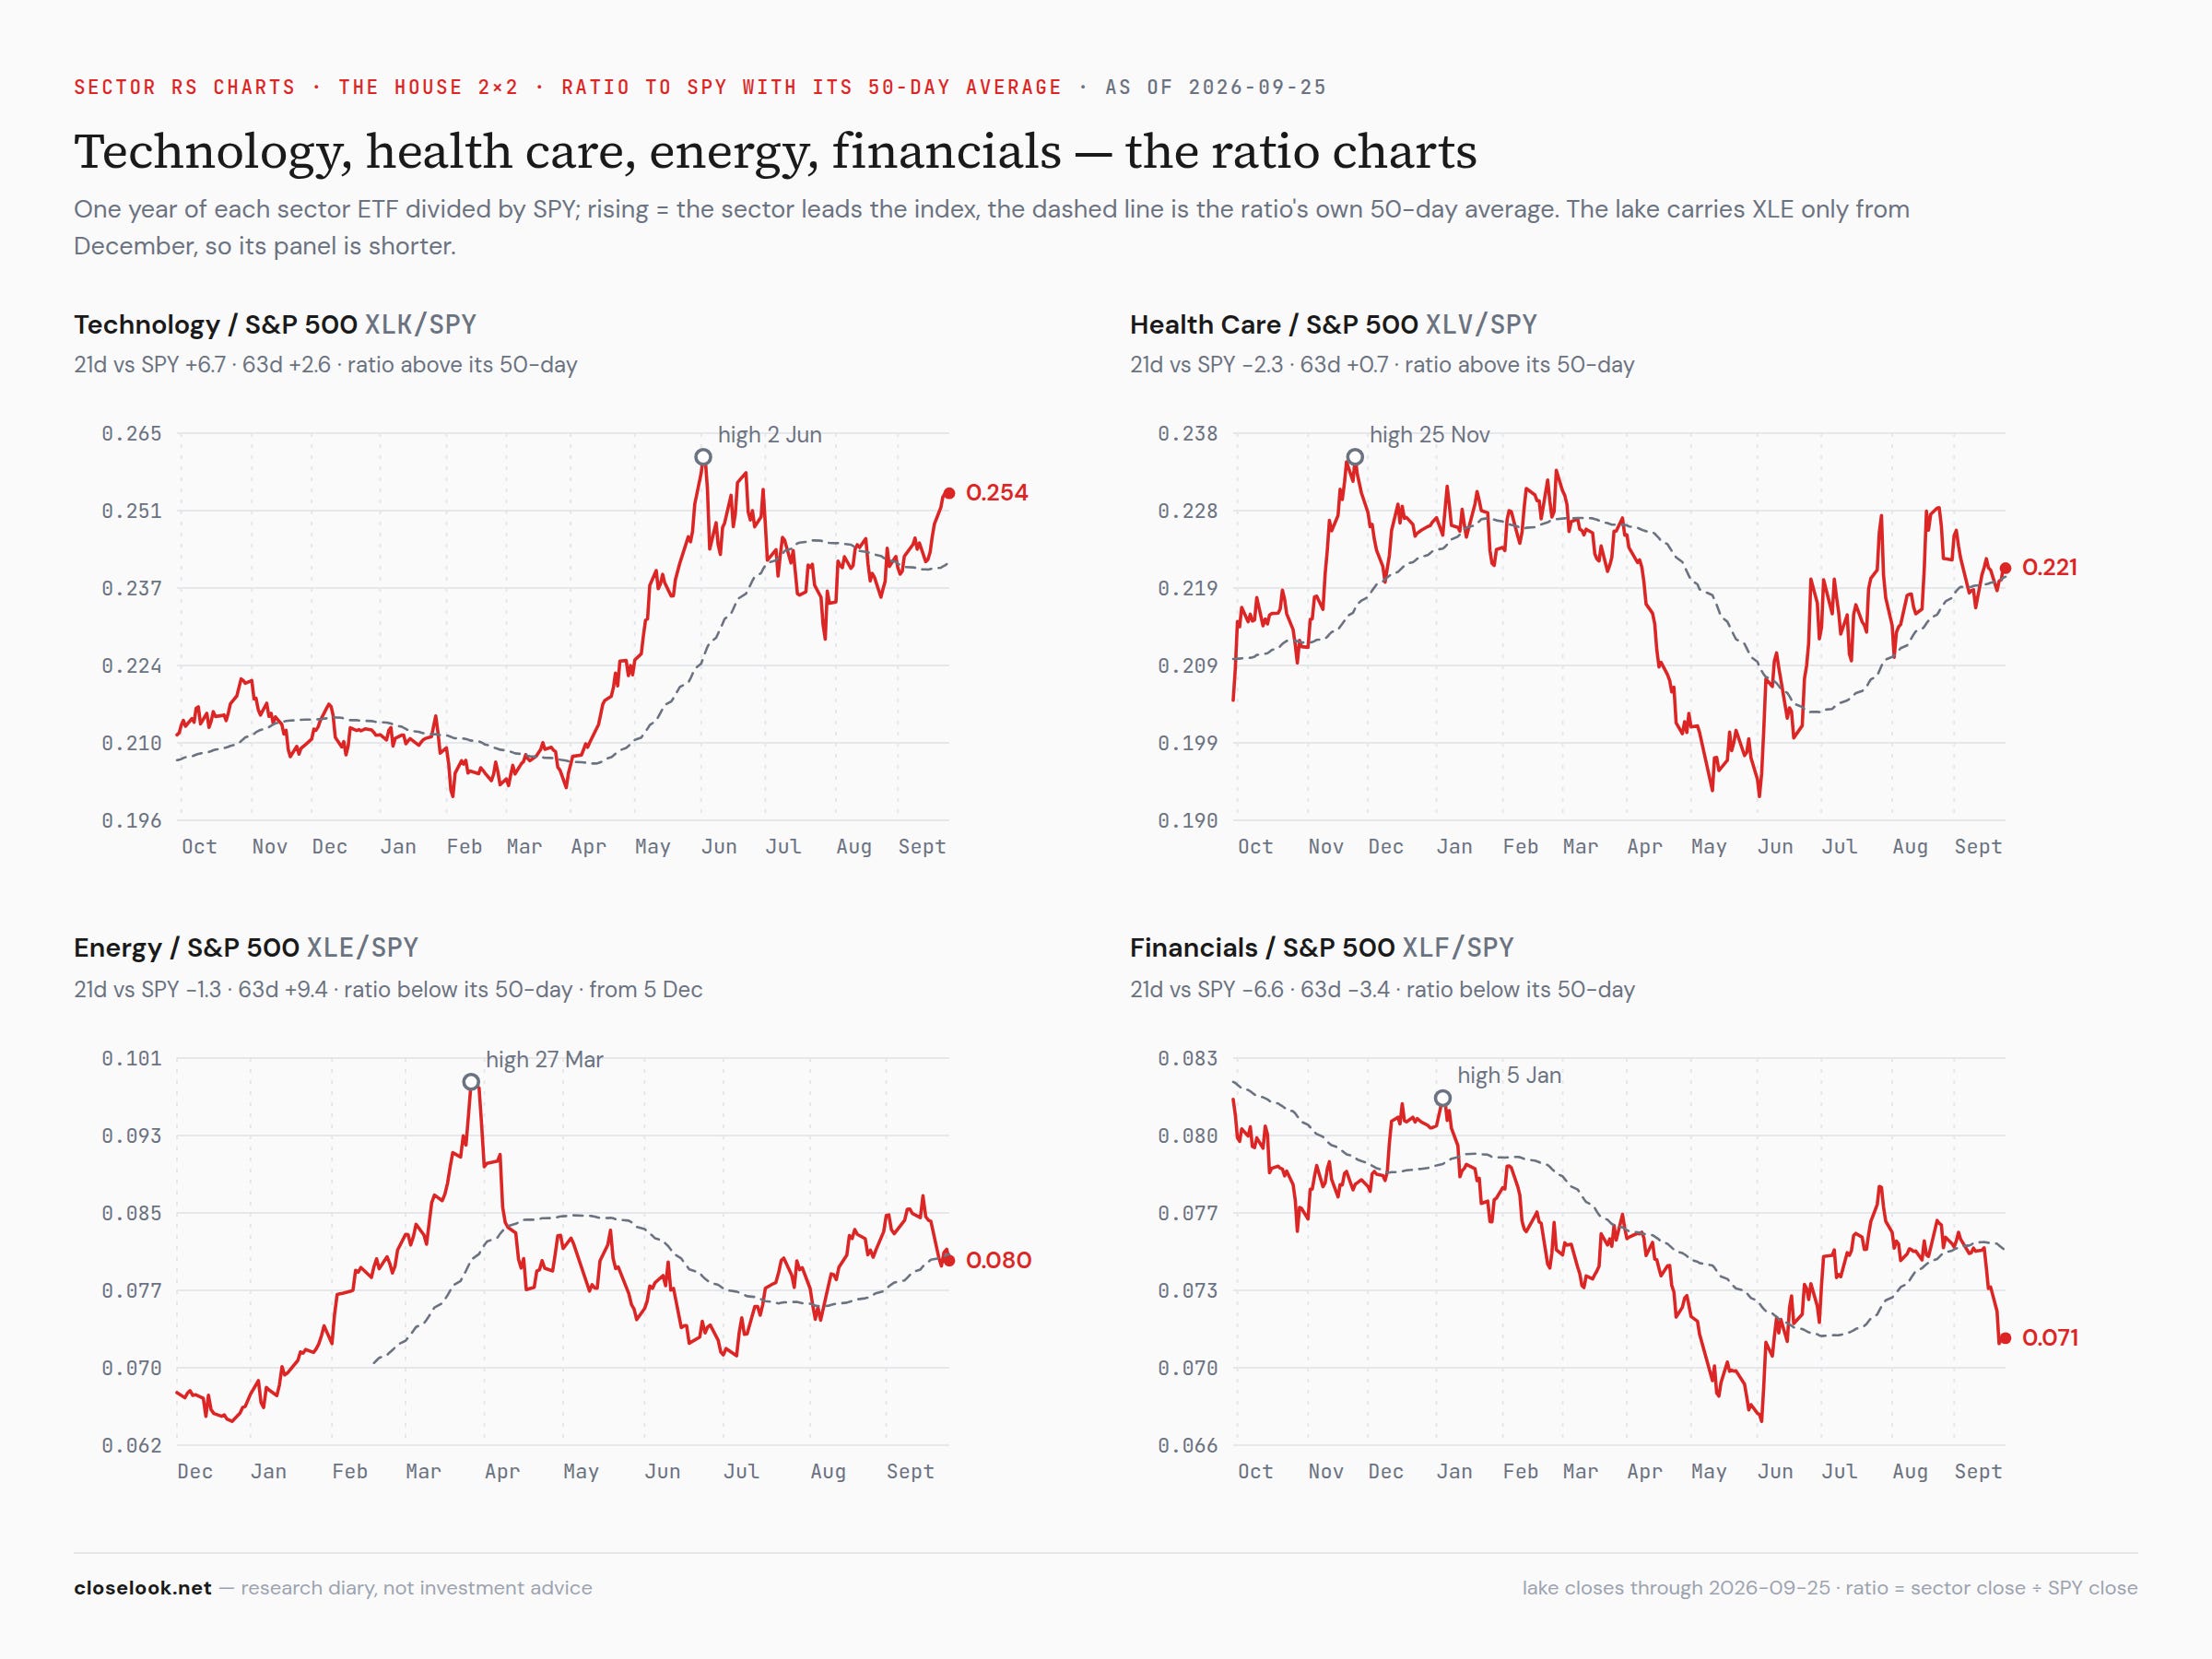
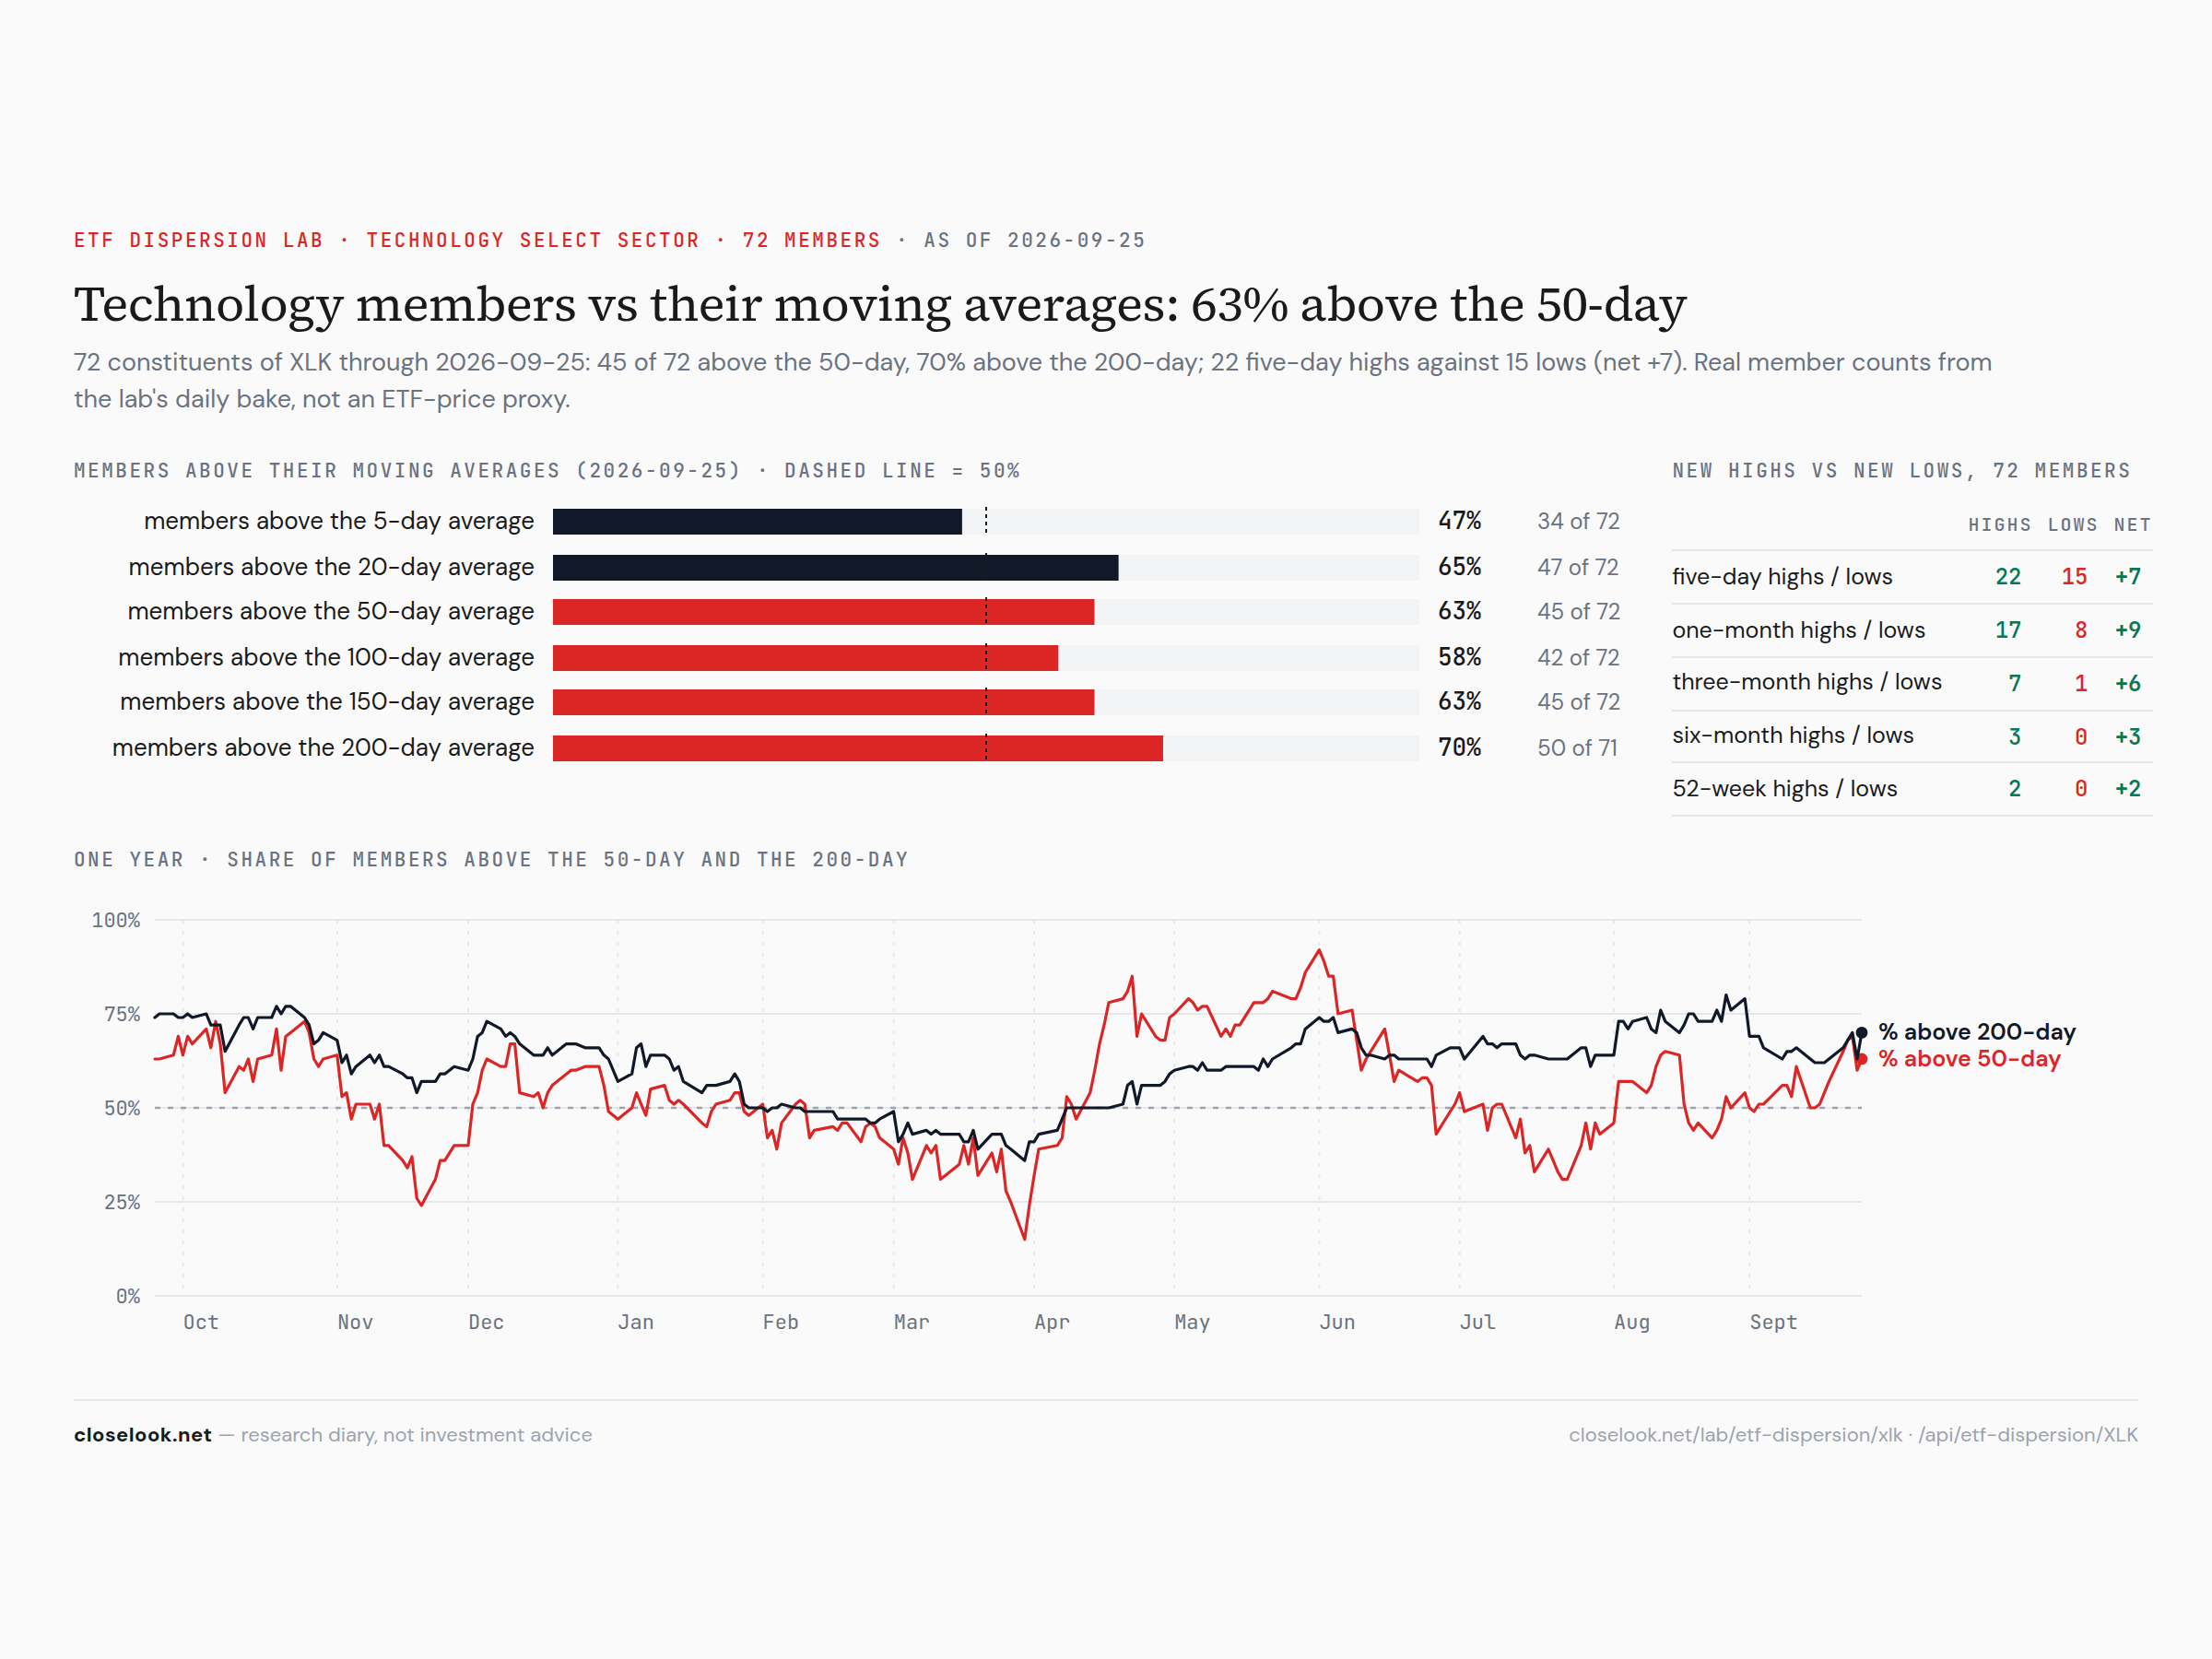
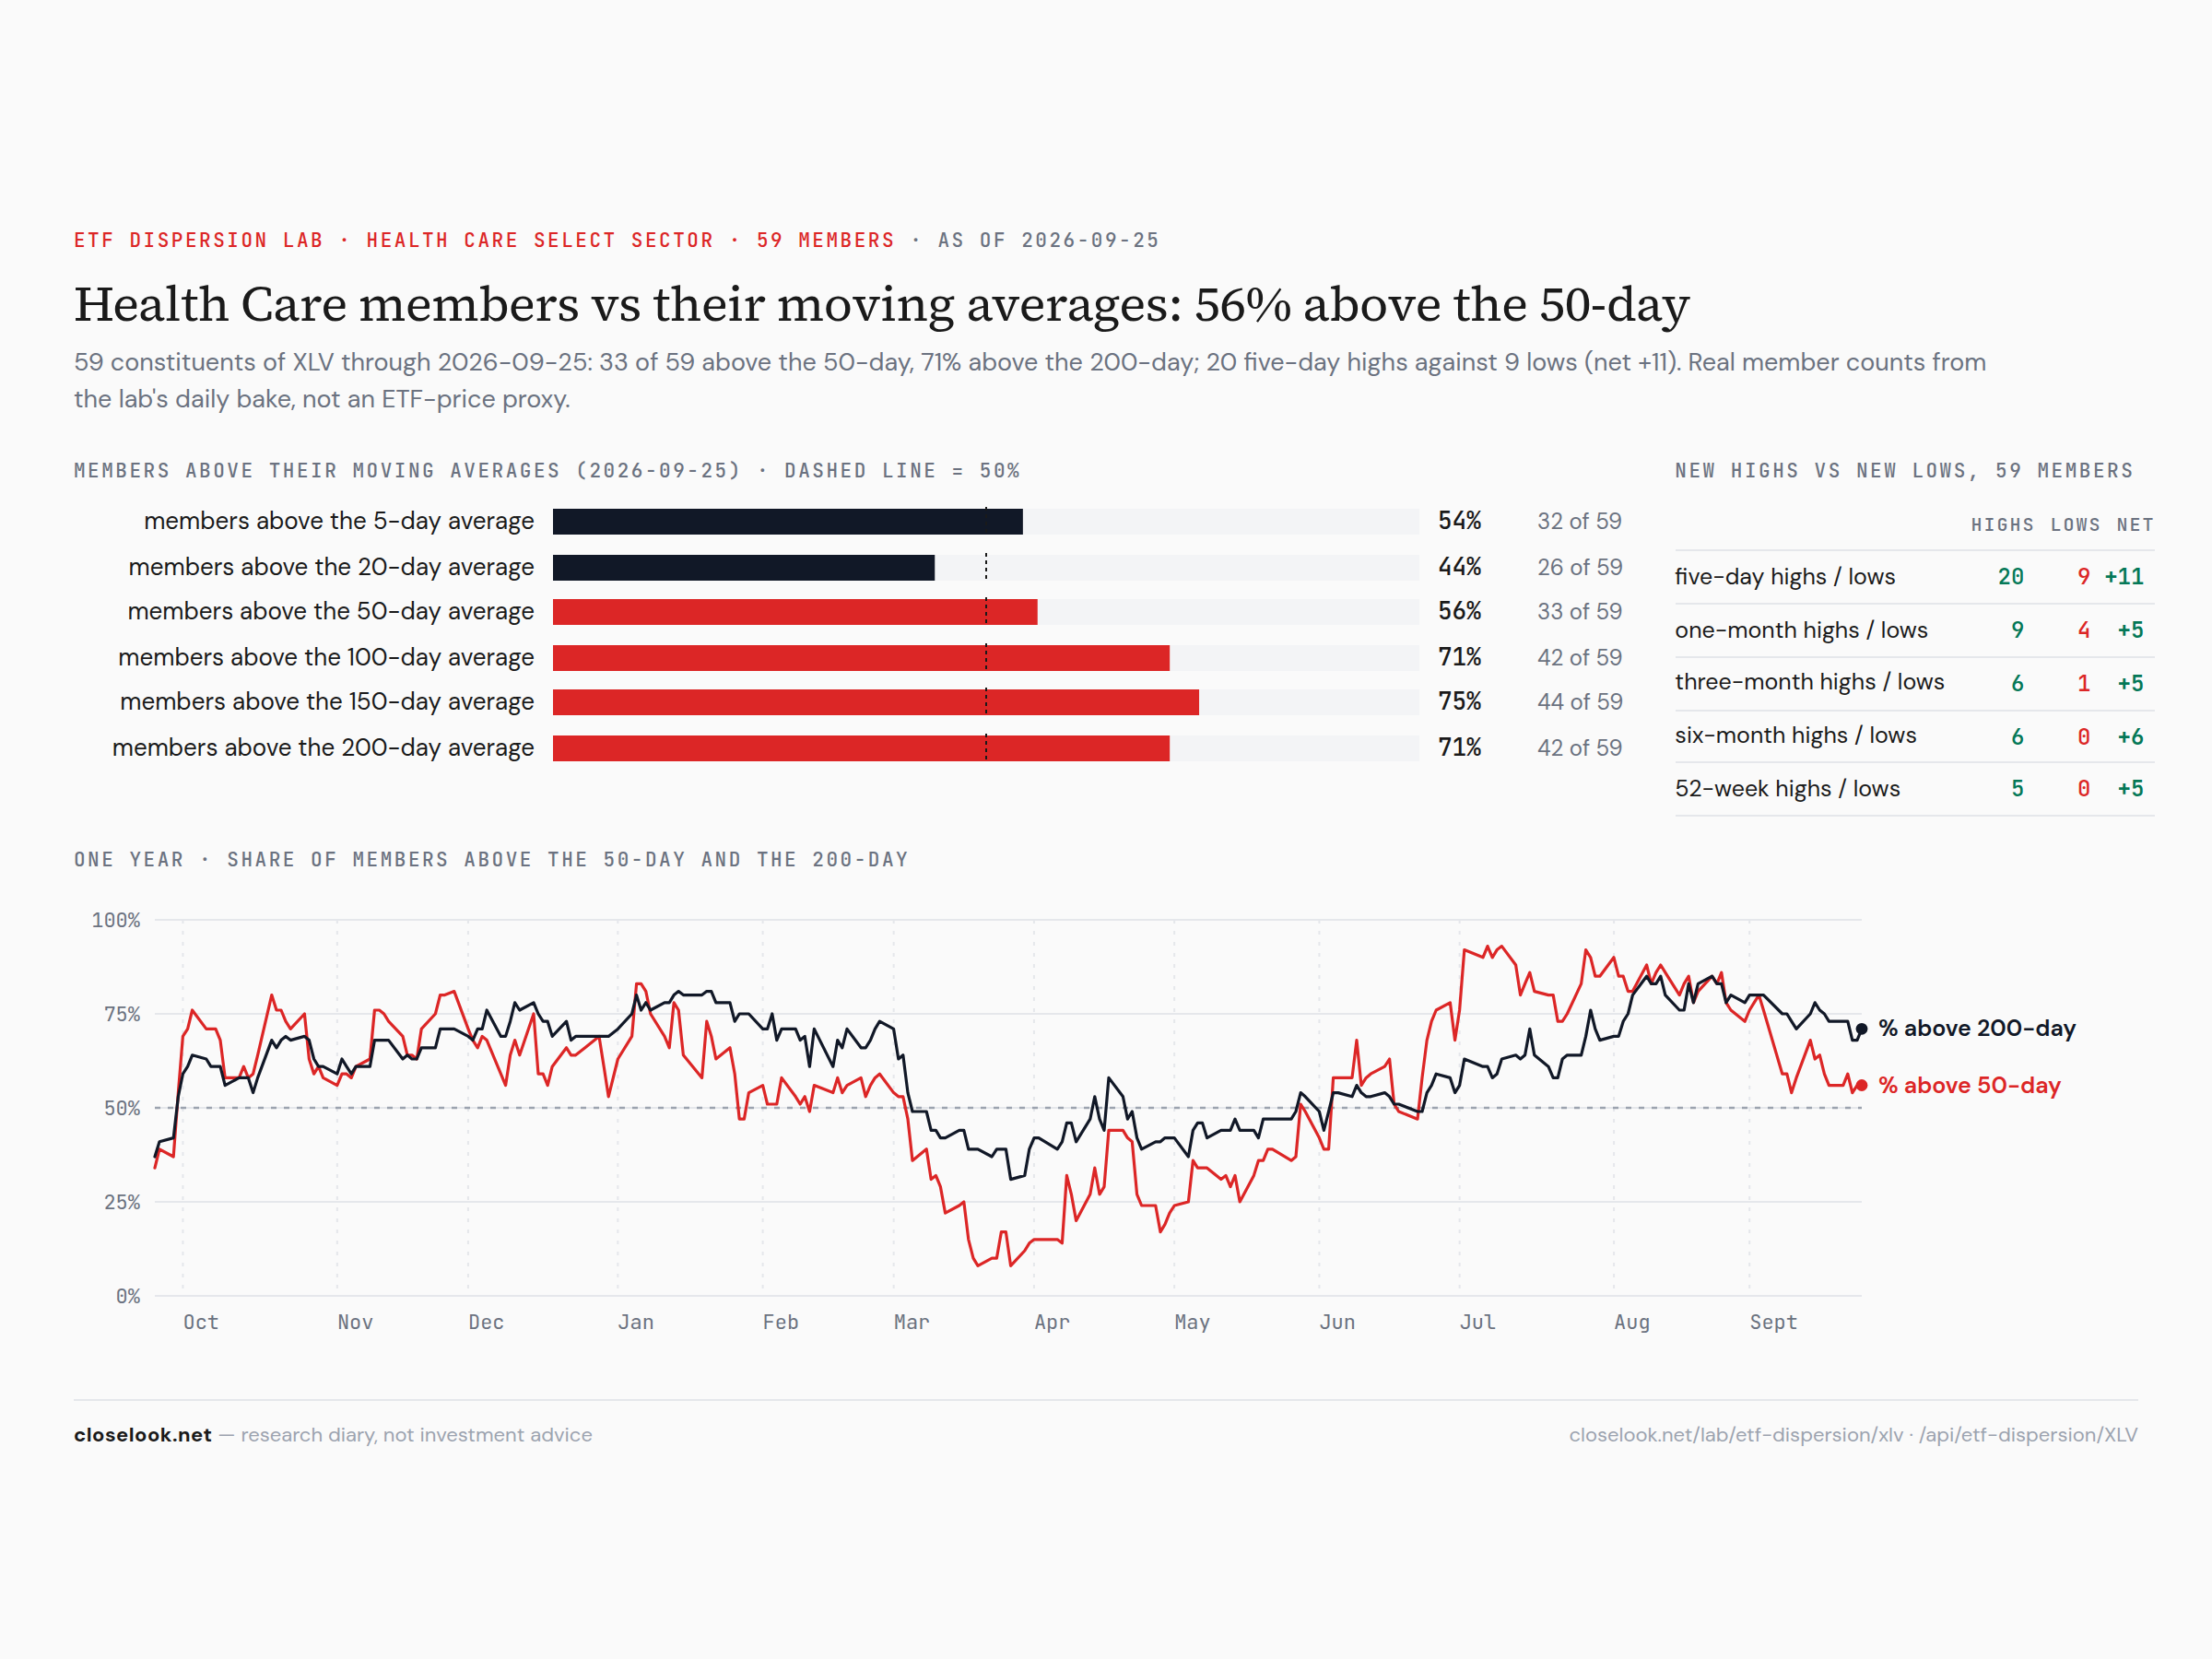
Underneath the focus sectors — technology held its breadth, financials did not. The dispersion pages count members against their averages. Technology: 62.5% of its 72 members above their 50-day average, 70% above the 200-day, 22 five-day highs against 15 lows. Health care: 56% above the 50-day, 71% above the 100-day, 20 highs against 9 lows. Financials: only 6 of 76 members — 7.9% — above their 50-day average, and 16 five-day lows against 8 highs; no new highs on any window longer than a week. Industrials: 16% above the 50-day. Energy: 1 of 21 above the 20-day. The index rose on technology; the financial sector underneath it is as washed out as it has been this year.
The Nasdaq 100, cut six ways
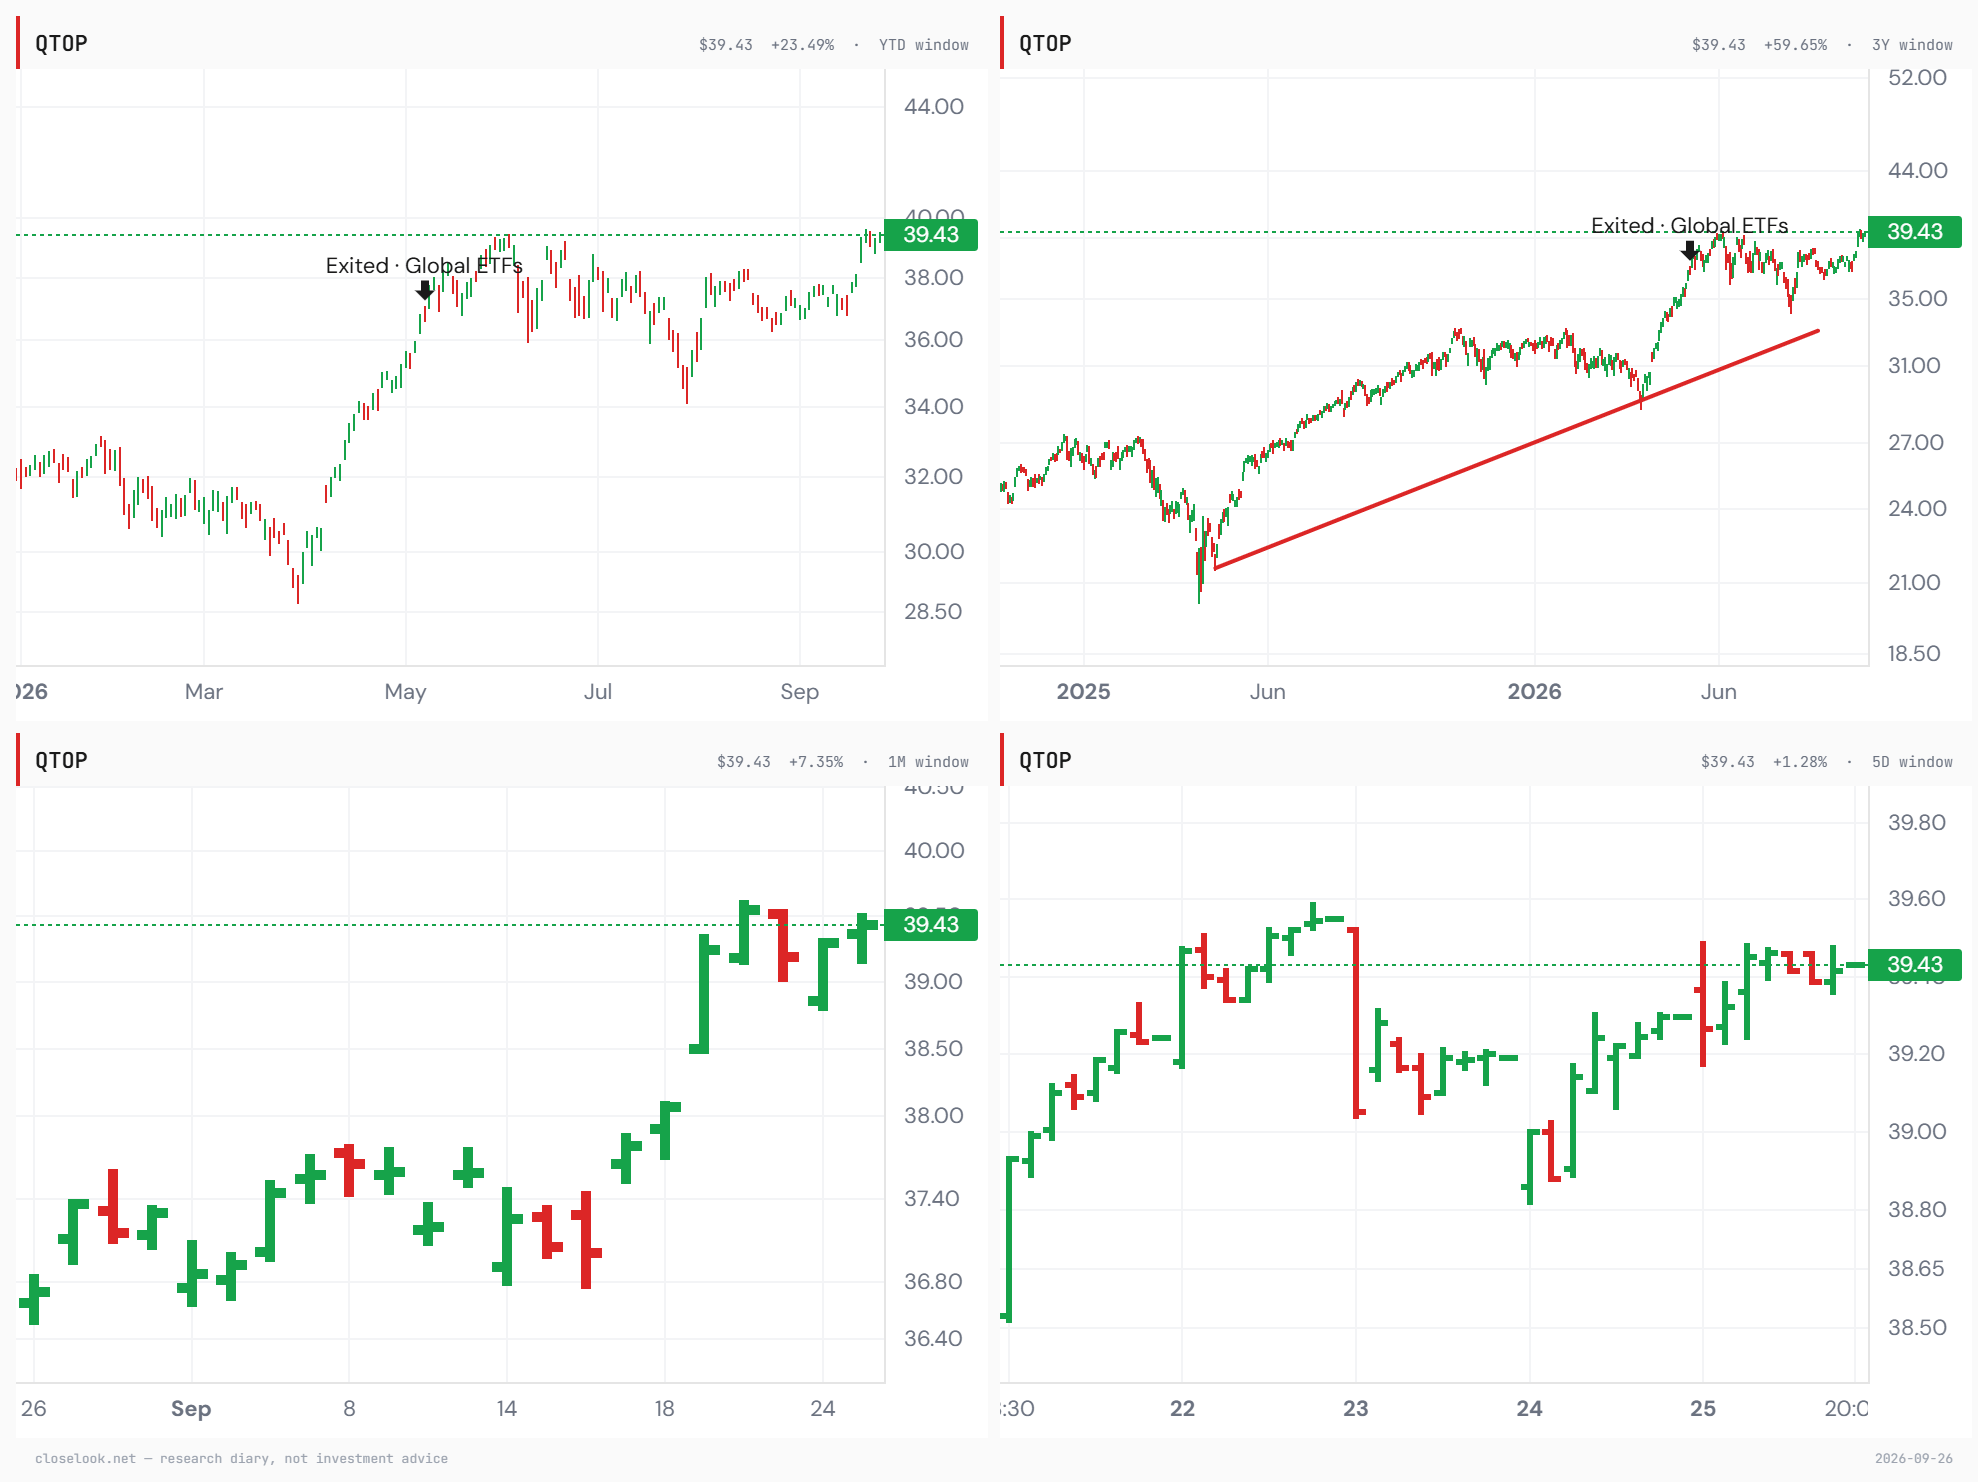
The top made new highs; the rest did not; the non-tech part fell to its low. The Nasdaq 100 can be bought in cuts, and this week the cuts told the story better than the index. Nasdaq 100 technology (QTEC) +5.64% on the week and +43.6% on the year. The thirty largest Nasdaq stocks (QTOP) +3.58% and +23.4% — a new high for the year on Tuesday at 39.55. America’s twenty largest companies (TOPT) +2.49% and +13.2% — closing Friday at 35.34, level with its high of the year. The index itself +3.19% and +21.2%. Then the rest: the seventy smaller Nasdaq 100 members (QNXT) +2.74% and +12.8%, 4.2% under their August high; and the Nasdaq 100 without its tech stocks (QQXT) +0.19% on the week and −2.5% on the year.
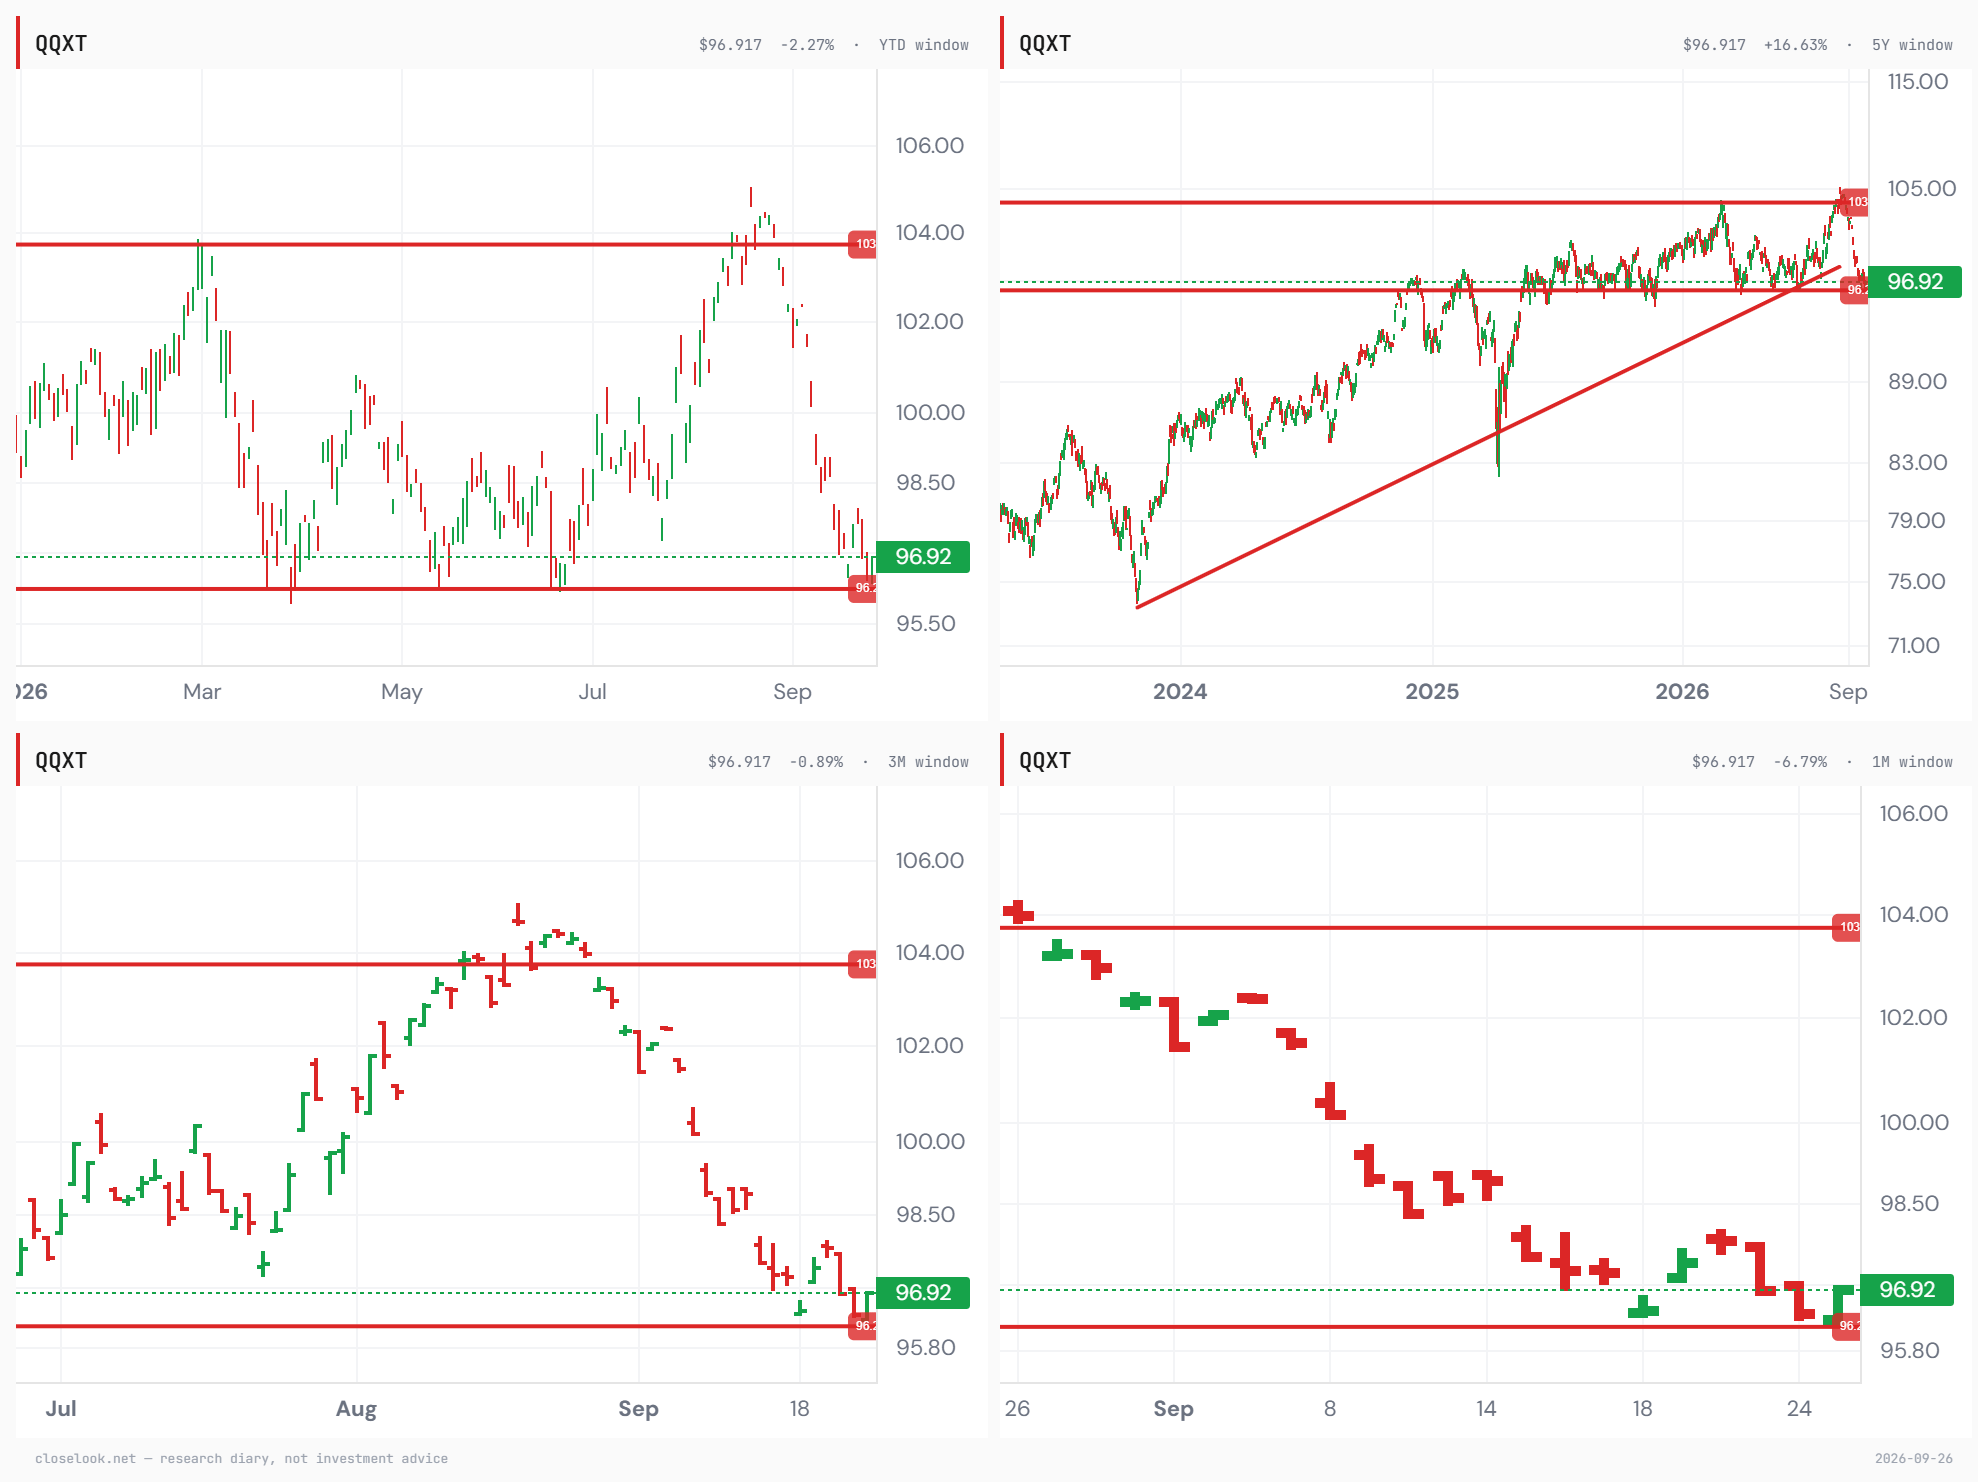
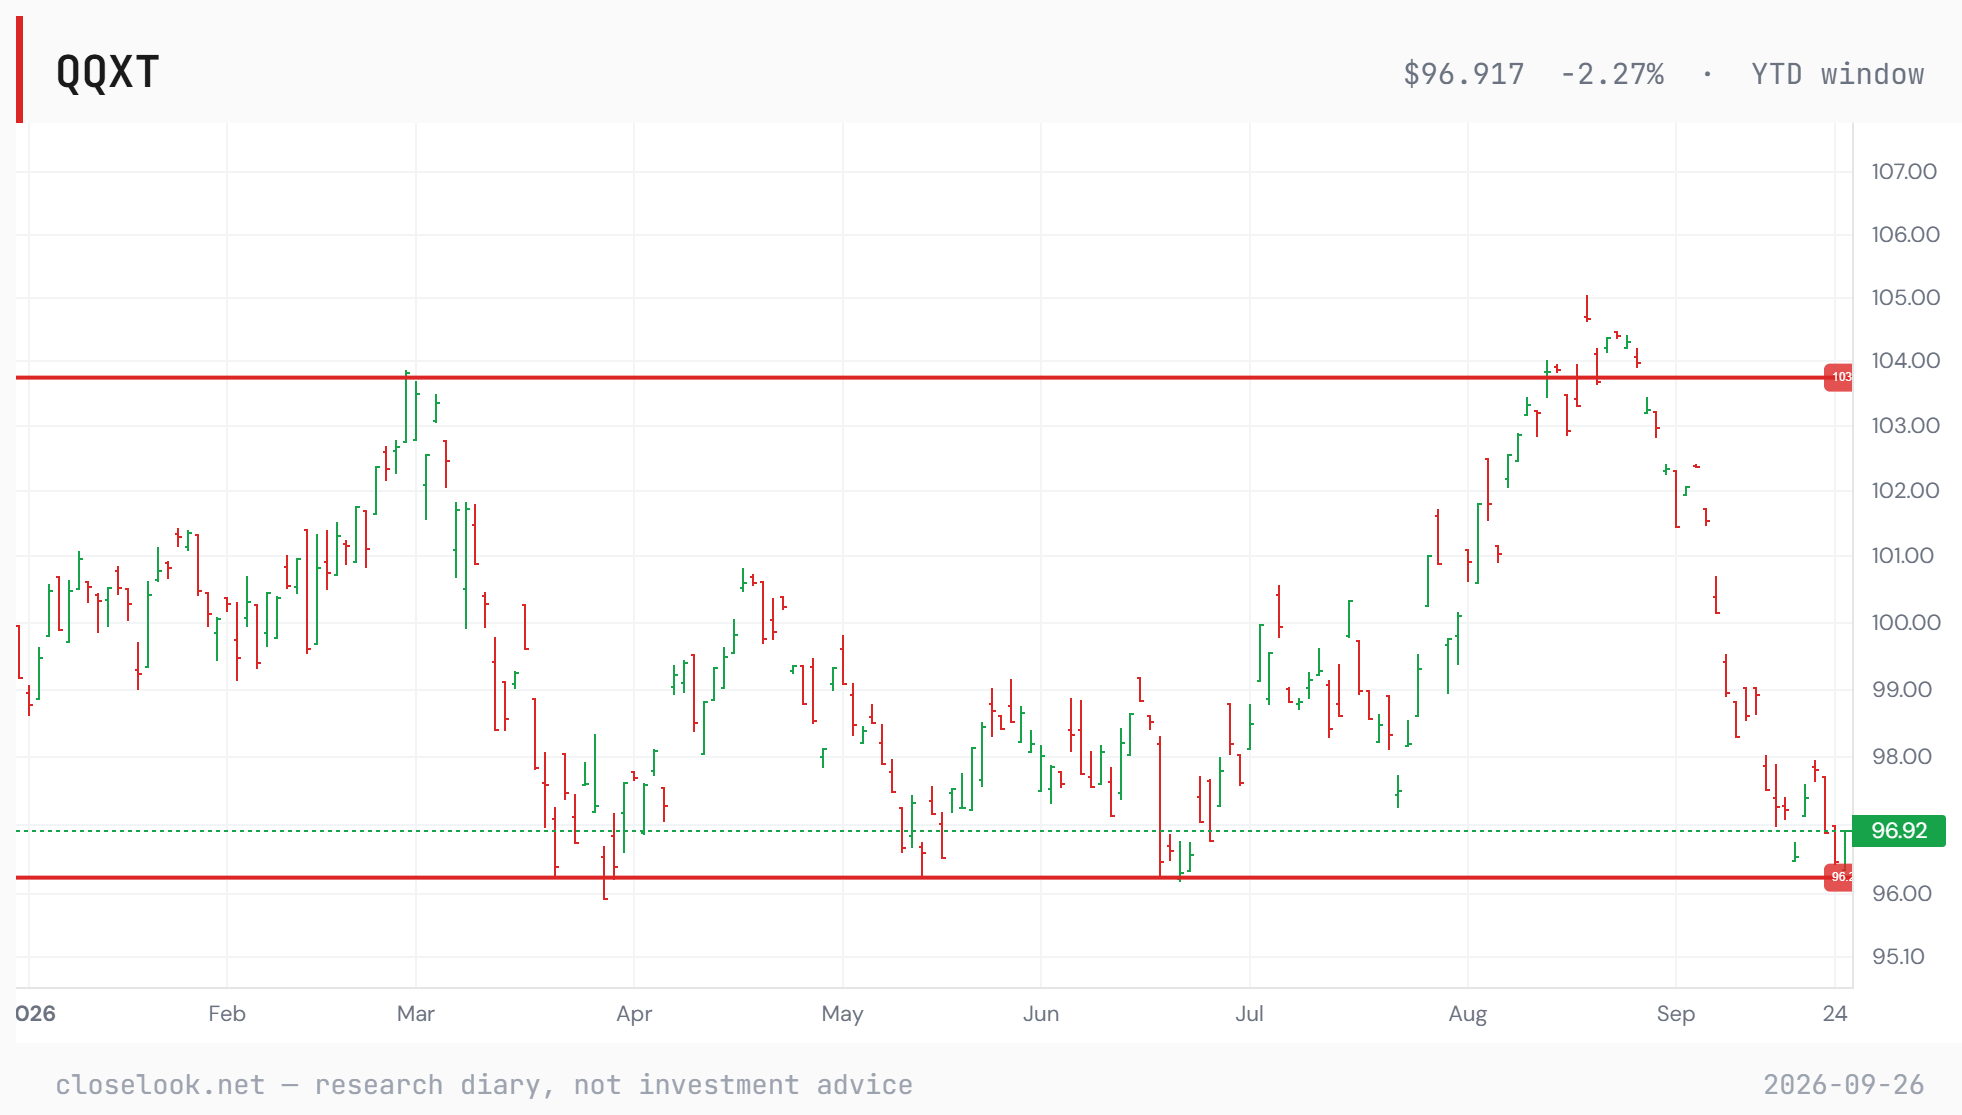
QQXT is the chart of the month. The non-tech Nasdaq — the retailers, the drug makers, the media, the travel and the utilities inside the index — made its 2026 high at 104.67 on August 19 and closed Friday at 96.92: −7.4% in five weeks, and 1.0% above its March 27 low of 95.94. From the year’s high to within a percent of the year’s low in a month, while the thirty largest members of the same index made a new high. That is what “narrow” looks like in one index: the leaders and the tech weights carry it, and the other half has given back its whole year.
The editor’s charts put the two ends side by side — the dramatic decline of non-tech growth against the top of the market. QQXT has spent all of 2026 in a box between about 96.2 and 103.8; it broke out of the top in August, failed within three weeks, and has fallen straight back to the bottom of the box — Friday’s 96.92 is seventy cents above the floor. On five years, the rising line from the 2023 low that carried the fund for three years broke in September. QTOP, the thirty largest Nasdaq stocks, closed at 39.43, a new high, on the rising line from its 2025 low. Same index, same week: the top at a new high, the non-tech half on the floor of its year.
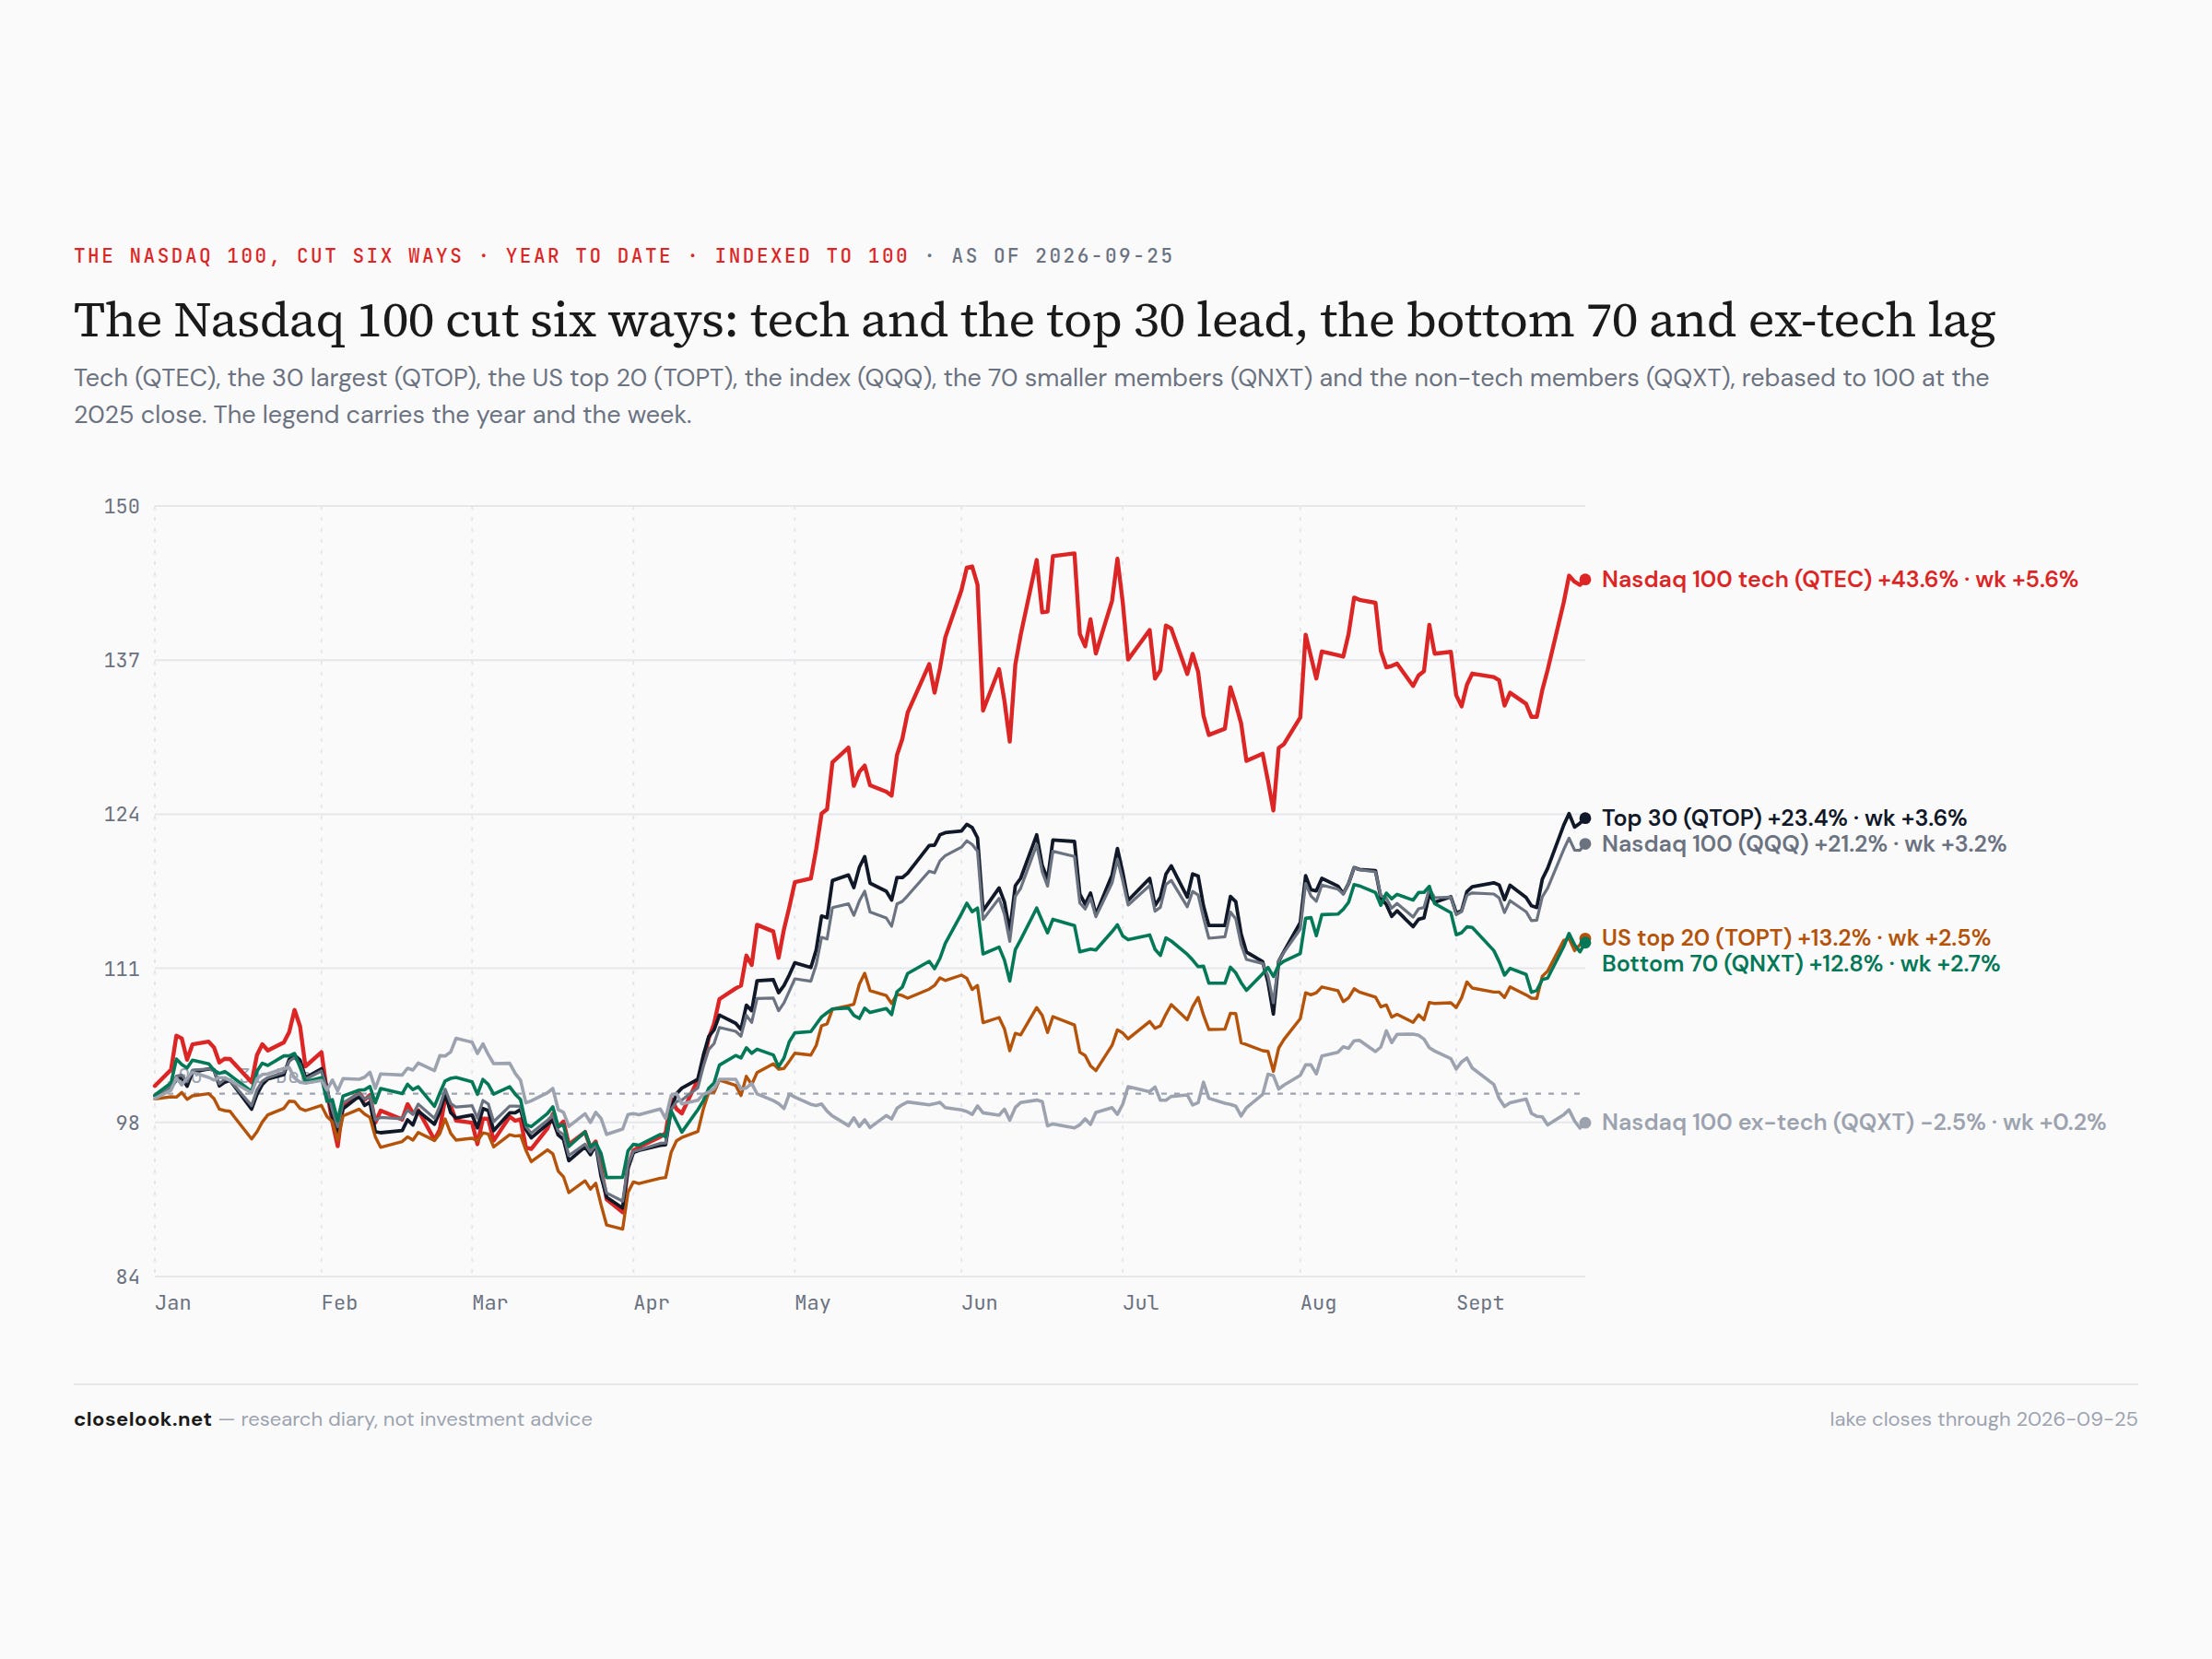
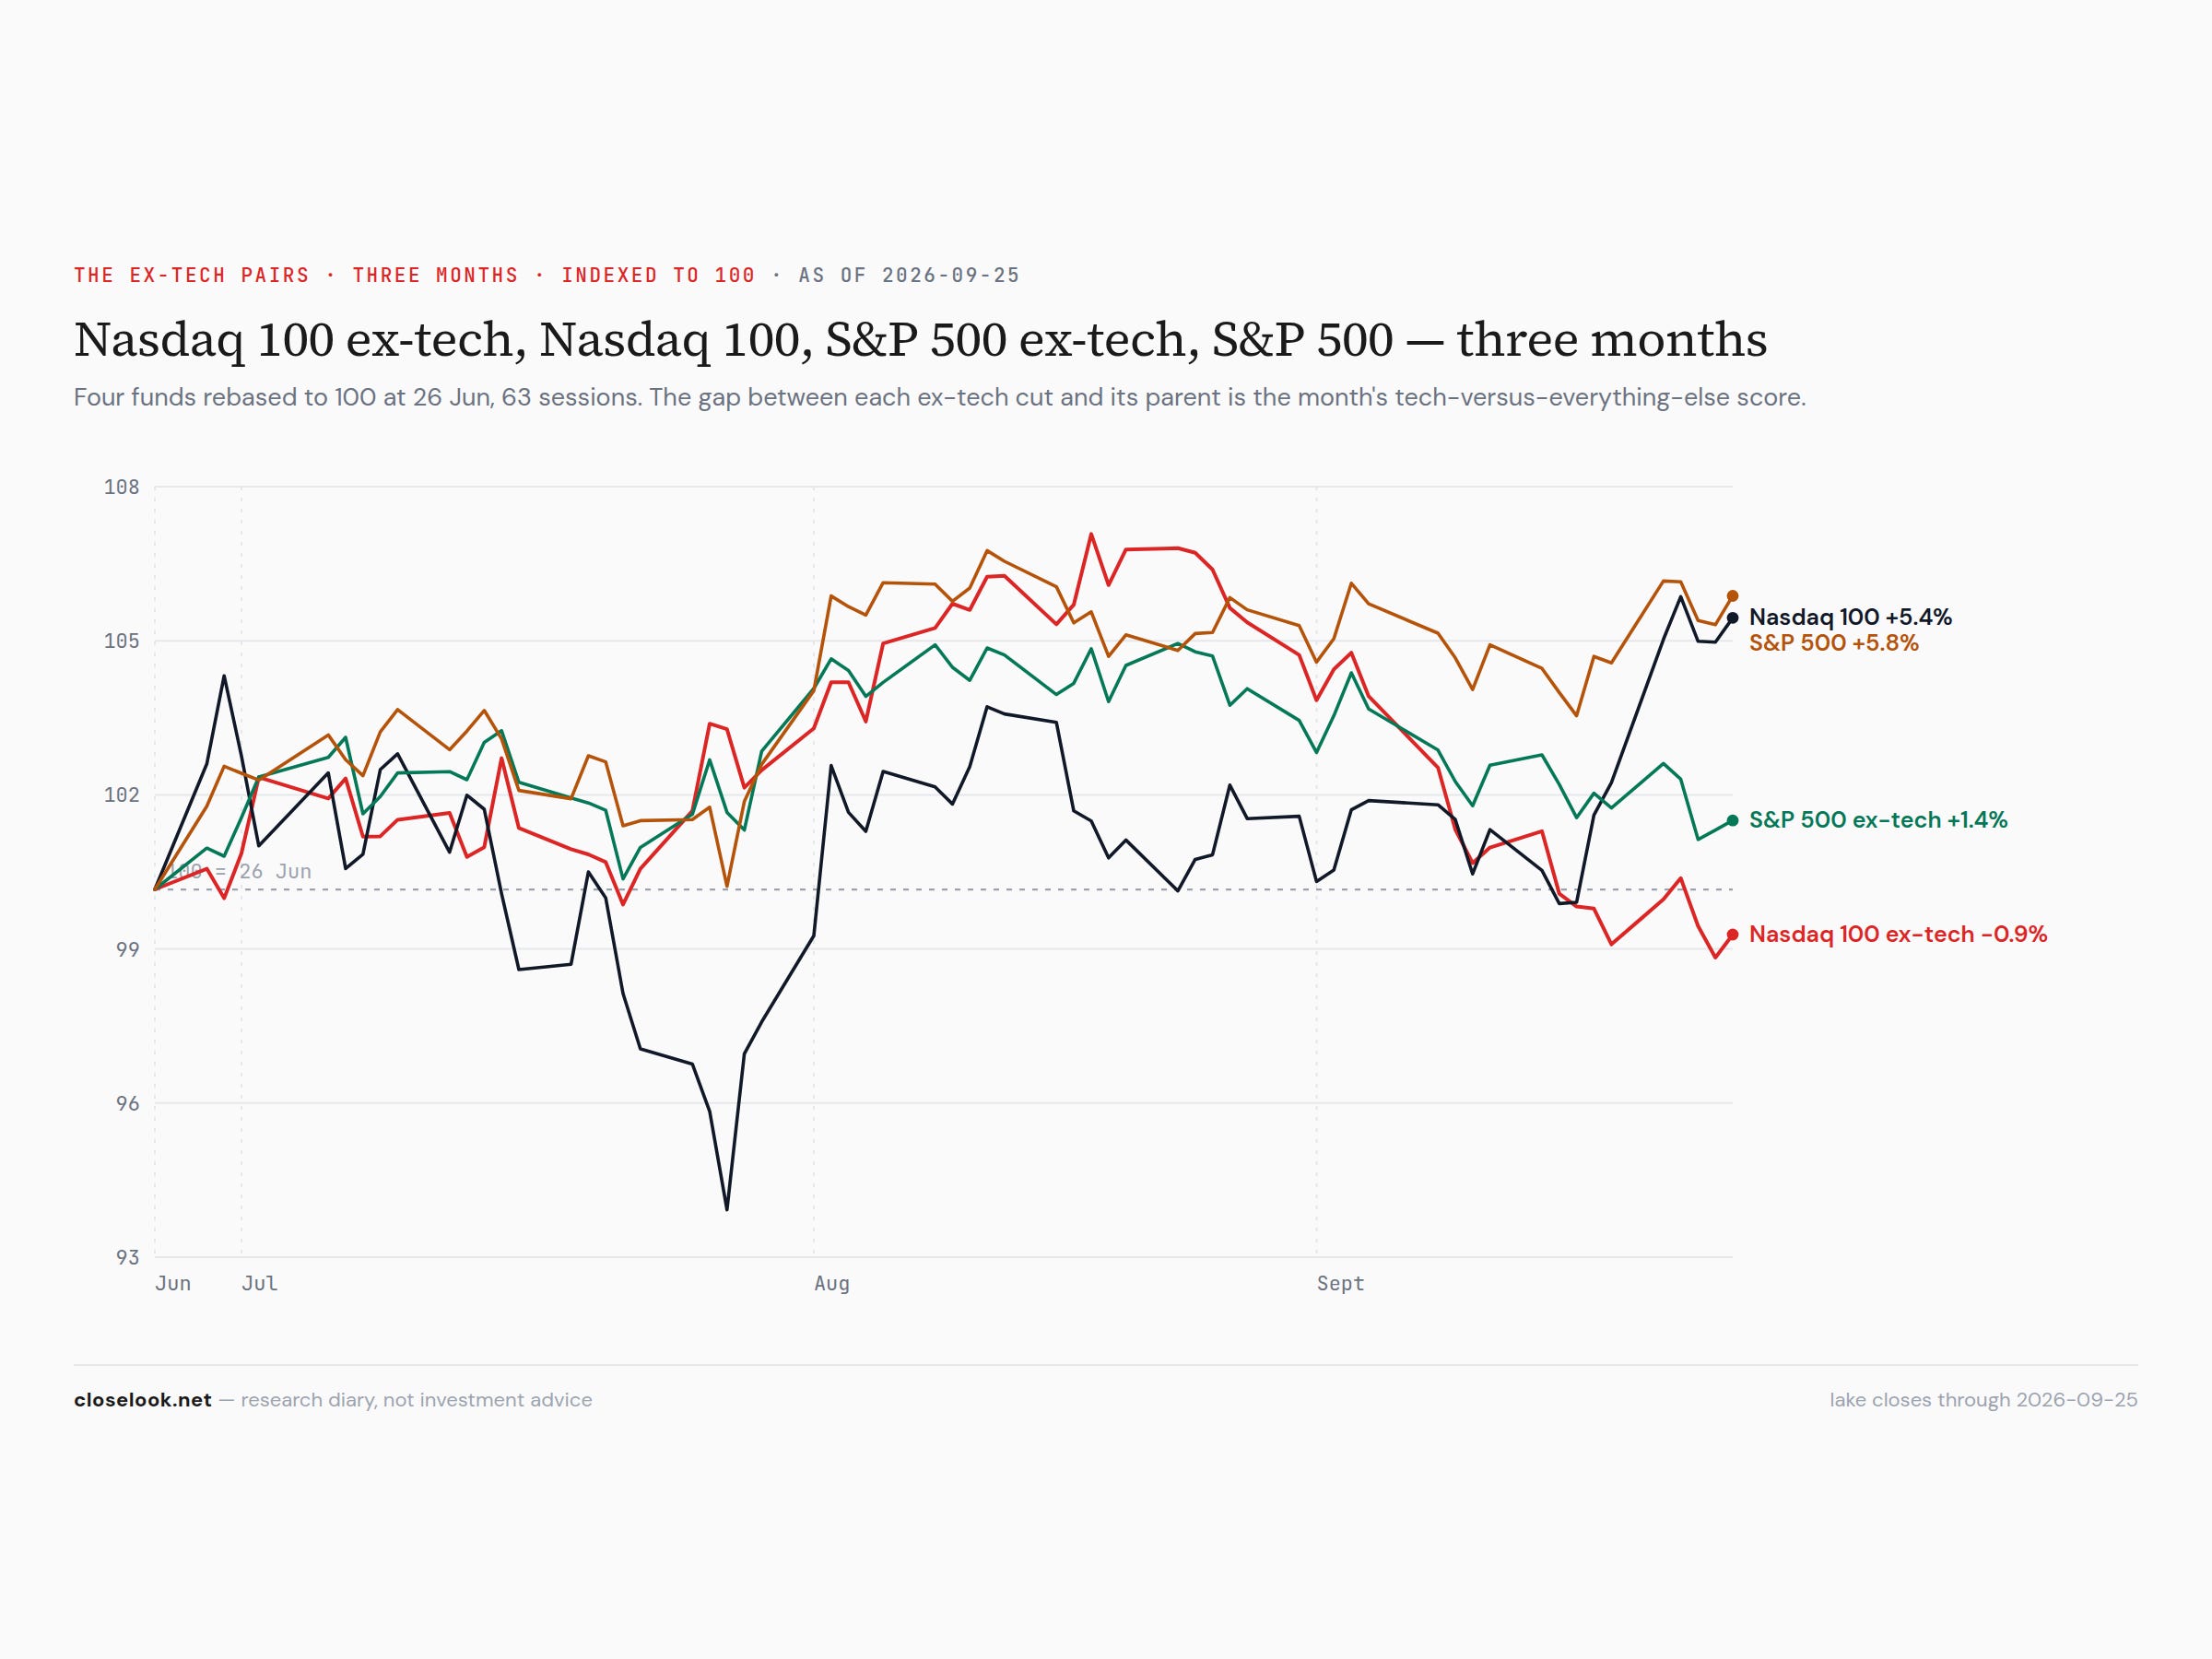
The axis, five weeks on — past the limit this letter set. Four weeks ago this letter set a rule: tech beating its ex-tech cut for more than four weeks running turns a rotation into a concentration. This is the fifth week: QTEC +5.64% against QQXT +0.19%; the S&P without tech −0.25% against the S&P +1.27%. The equal-weight Nasdaq 100 rose 2.72%, so the average Nasdaq stock did take part — it is the non-tech half that did not. The limit was stated so it could be scored, and it is scored: this is a concentration, and the letter reads the index from here as the leaders’ index, not the market’s.
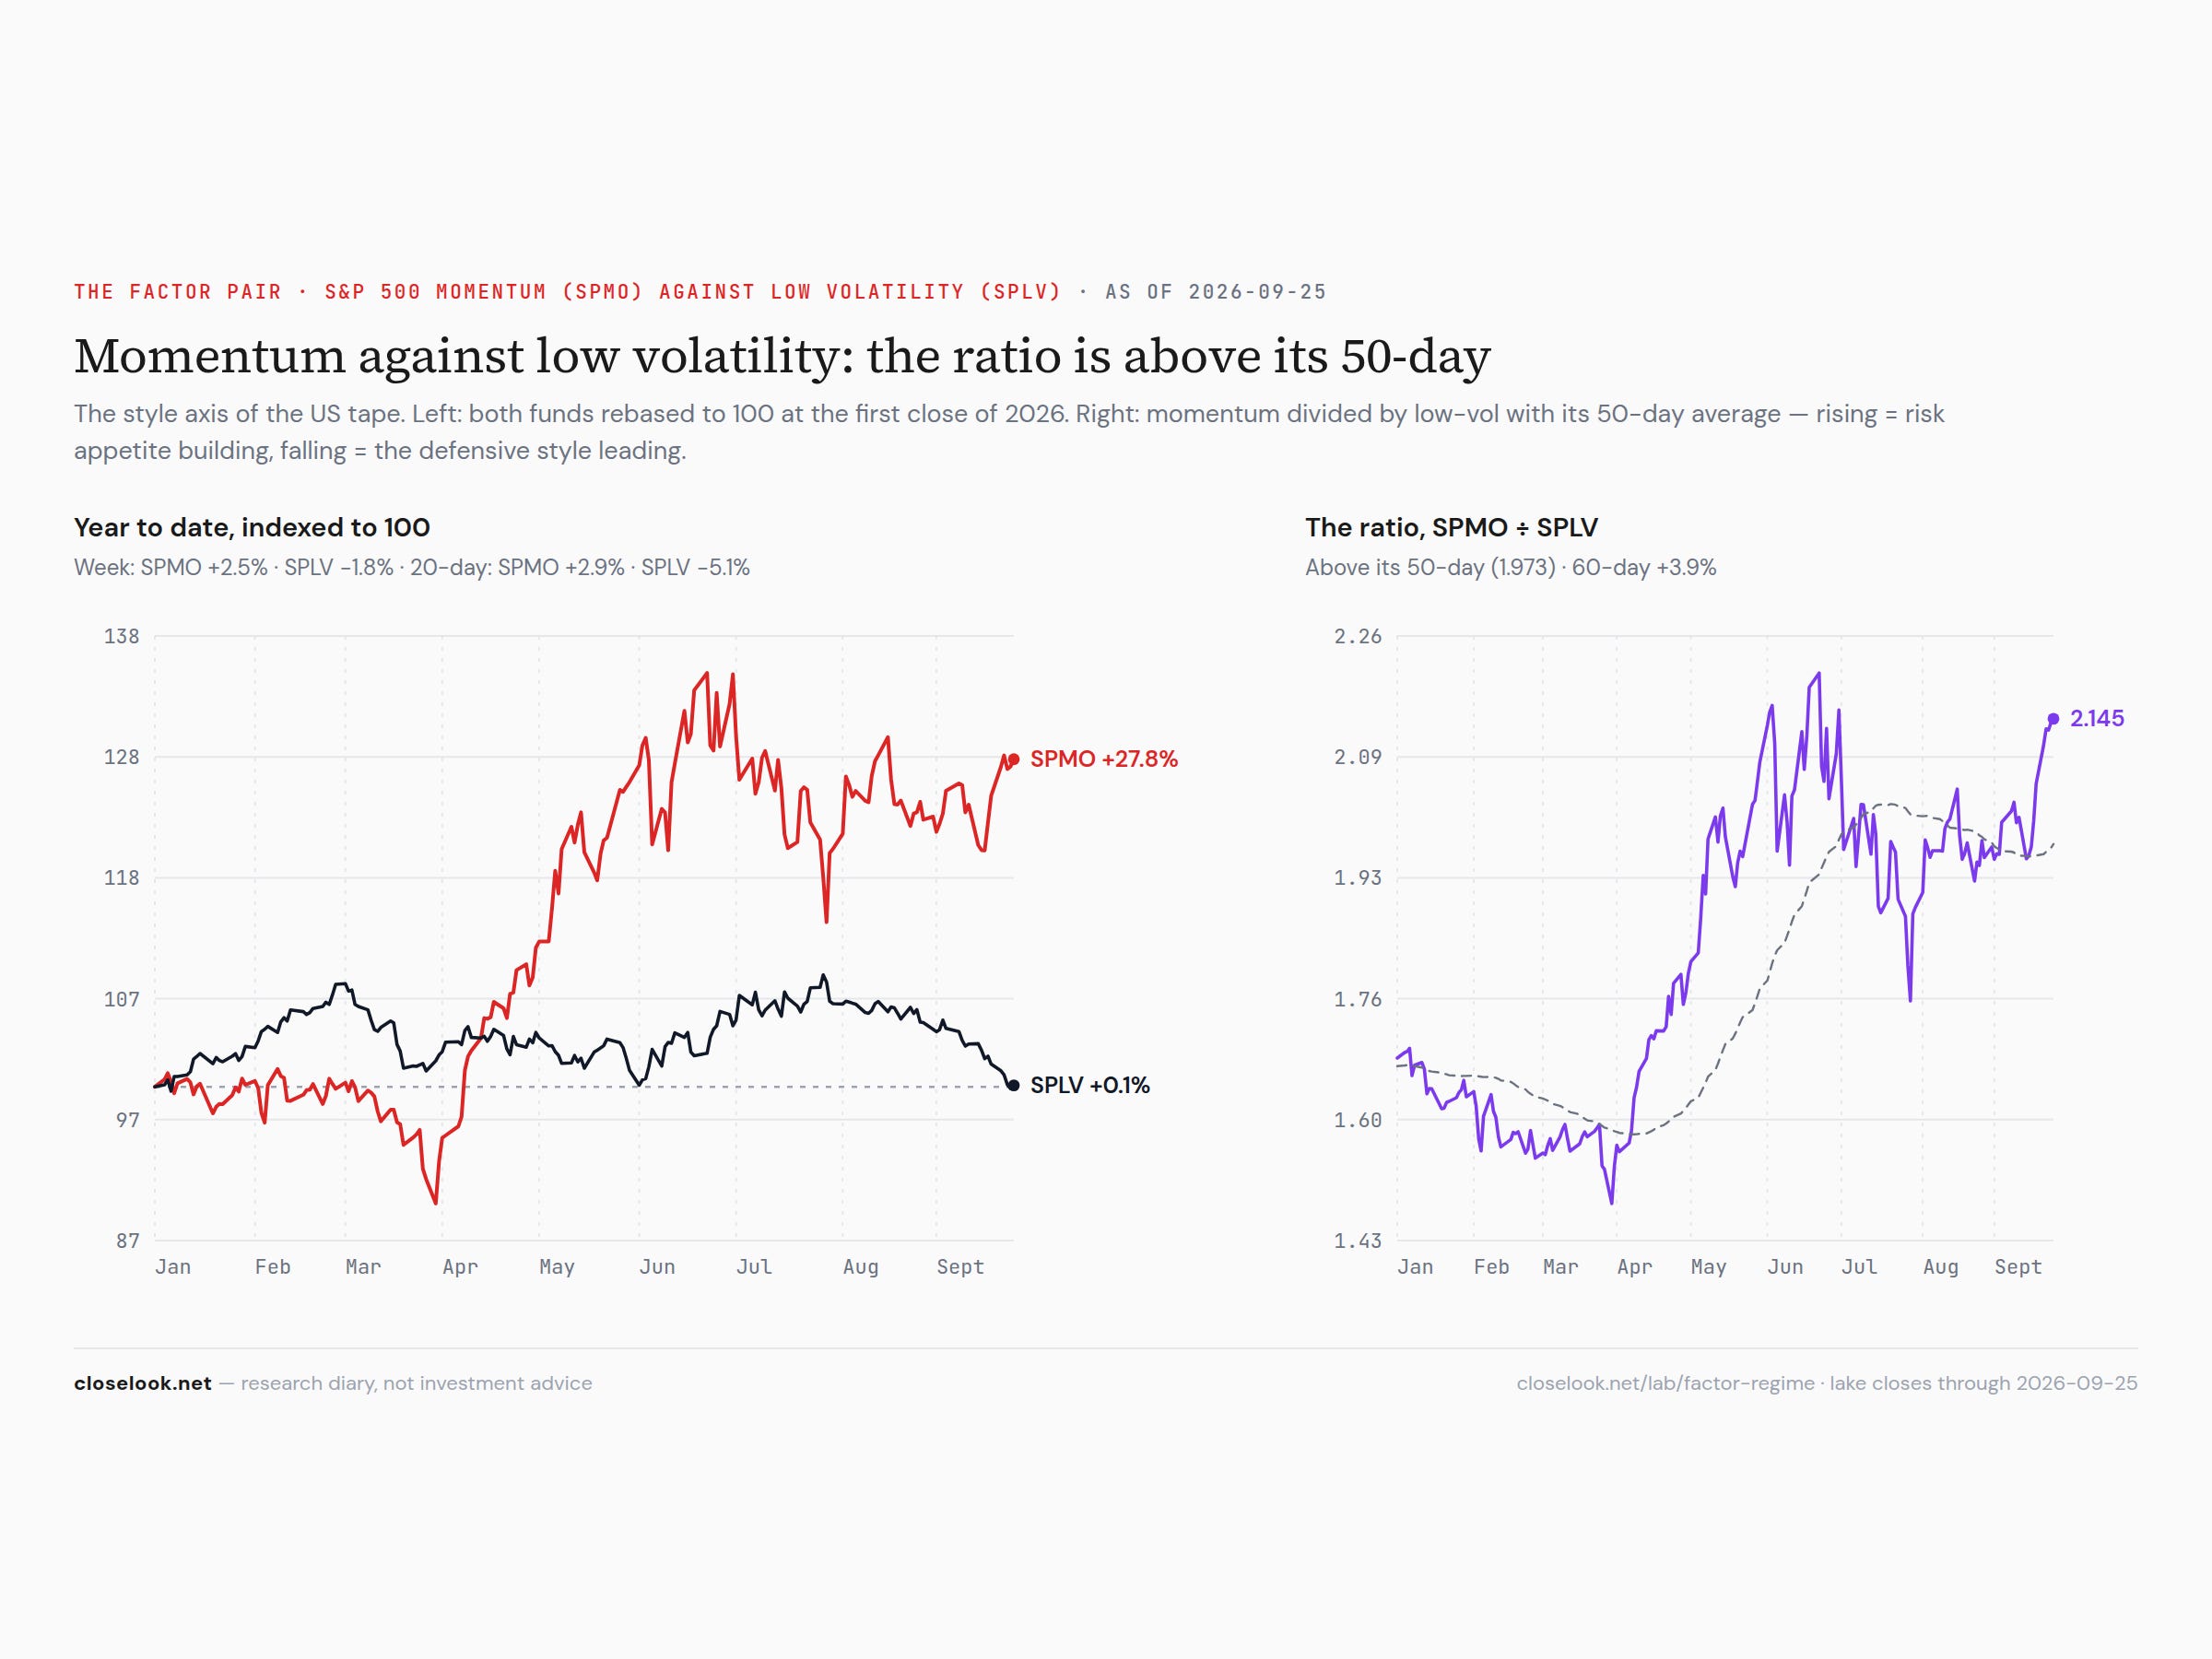
The factor read — momentum at the 99th percentile. The factor-regime gauge — US momentum (SPMO) against US low volatility (SPLV) — closed the week at 170.3 indexed, above its 50-day at 156.7, in the 99th percentile of its range: “momentum leading — risk appetite building”. The legs sorted the normal way: momentum +2.49% on the week and +28.2% on the year; low volatility −1.76% and −0.2% on the year. The defensive factor is now flat on 2026.
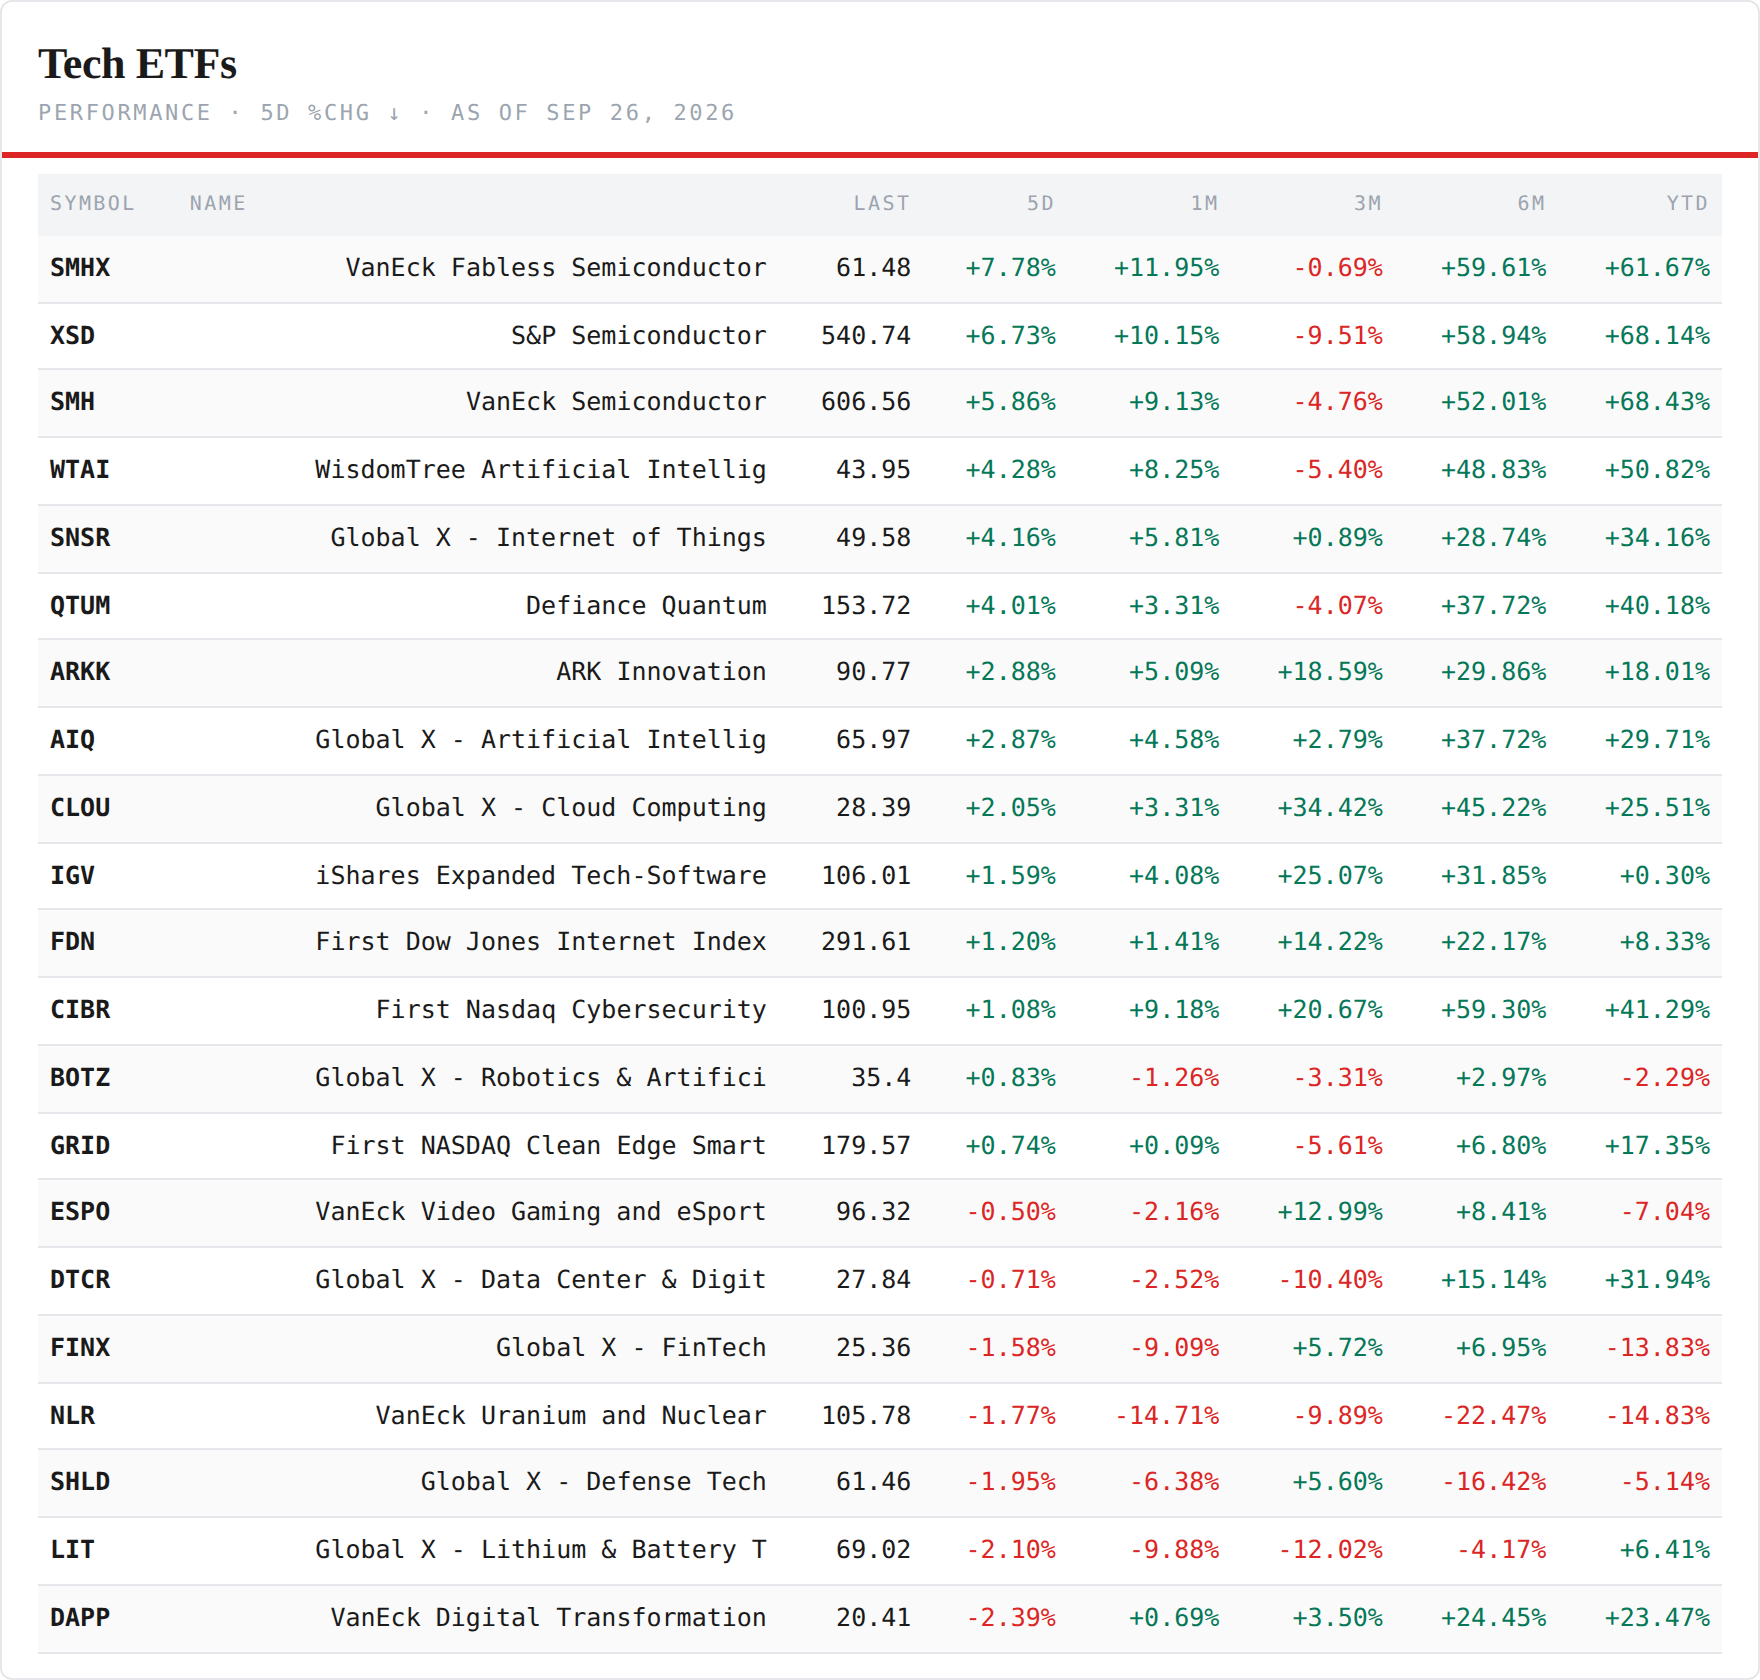
The tech ETFs we carry
Fourteen green of twenty-one — the chips first, then everything that uses them. The fabless chip fund +7.78%, the equal-weight semis +6.73%, the chip majors +5.86%, the WisdomTree AI fund +4.28%, the internet-of-things fund +4.16%, quantum +4.01%, ARK +2.88%, the Global X AI fund +2.87%, cloud +2.05%, software +1.59%, internet +1.20%, cybersecurity +1.08%, robotics +0.83%, the grid fund +0.74%. The red seven: digital transformation −2.39%, lithium −2.10%, defense tech −1.95%, uranium −1.77%, fintech −1.58%, data centers −0.71%, gaming −0.50%. Last week software beat the chips by two points; this week the chips beat software by four. On the year: the chip index +90.2%, cybersecurity +41.3%, cloud +25.5%, software +0.3% — green again, by thirty basis points.
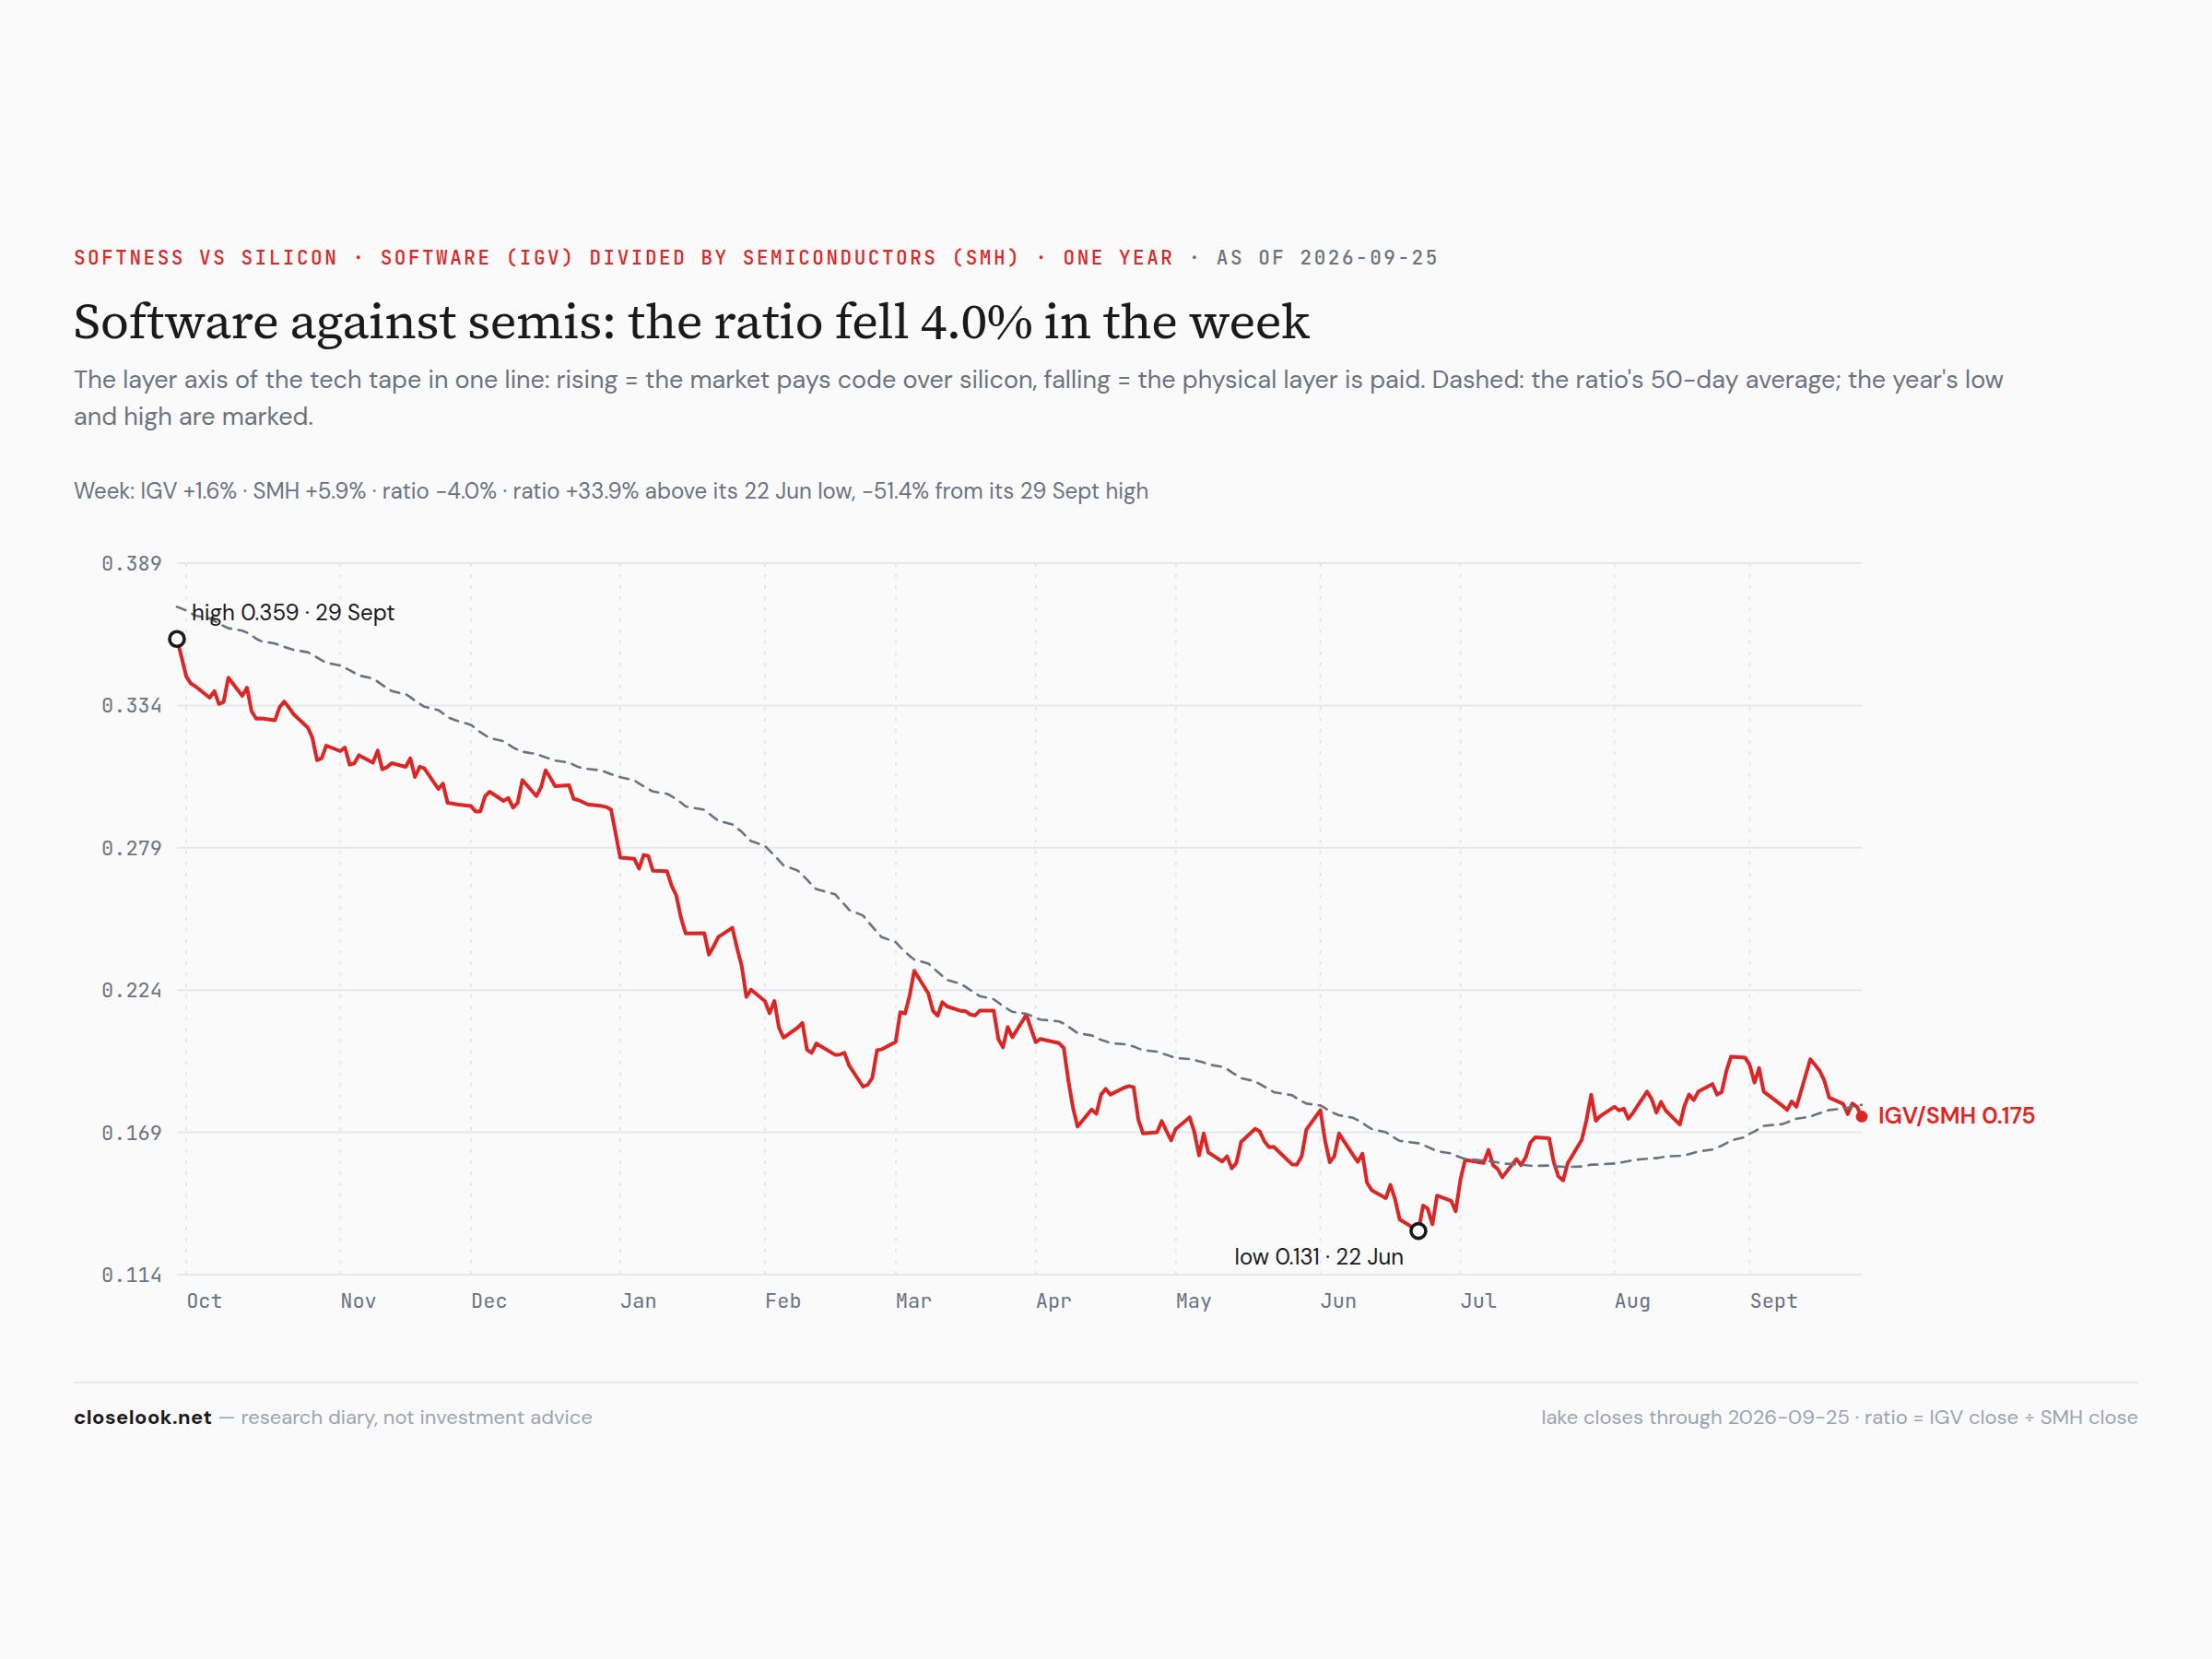
Software over silicon, as one line. The software fund divided by the chip majors fell 4.0% on the week to 0.1748 — still 33.9% above its June 22 low, but the week went to the chip.
The four indices: Dow, S&P 500, Nasdaq 100, Russell 2000
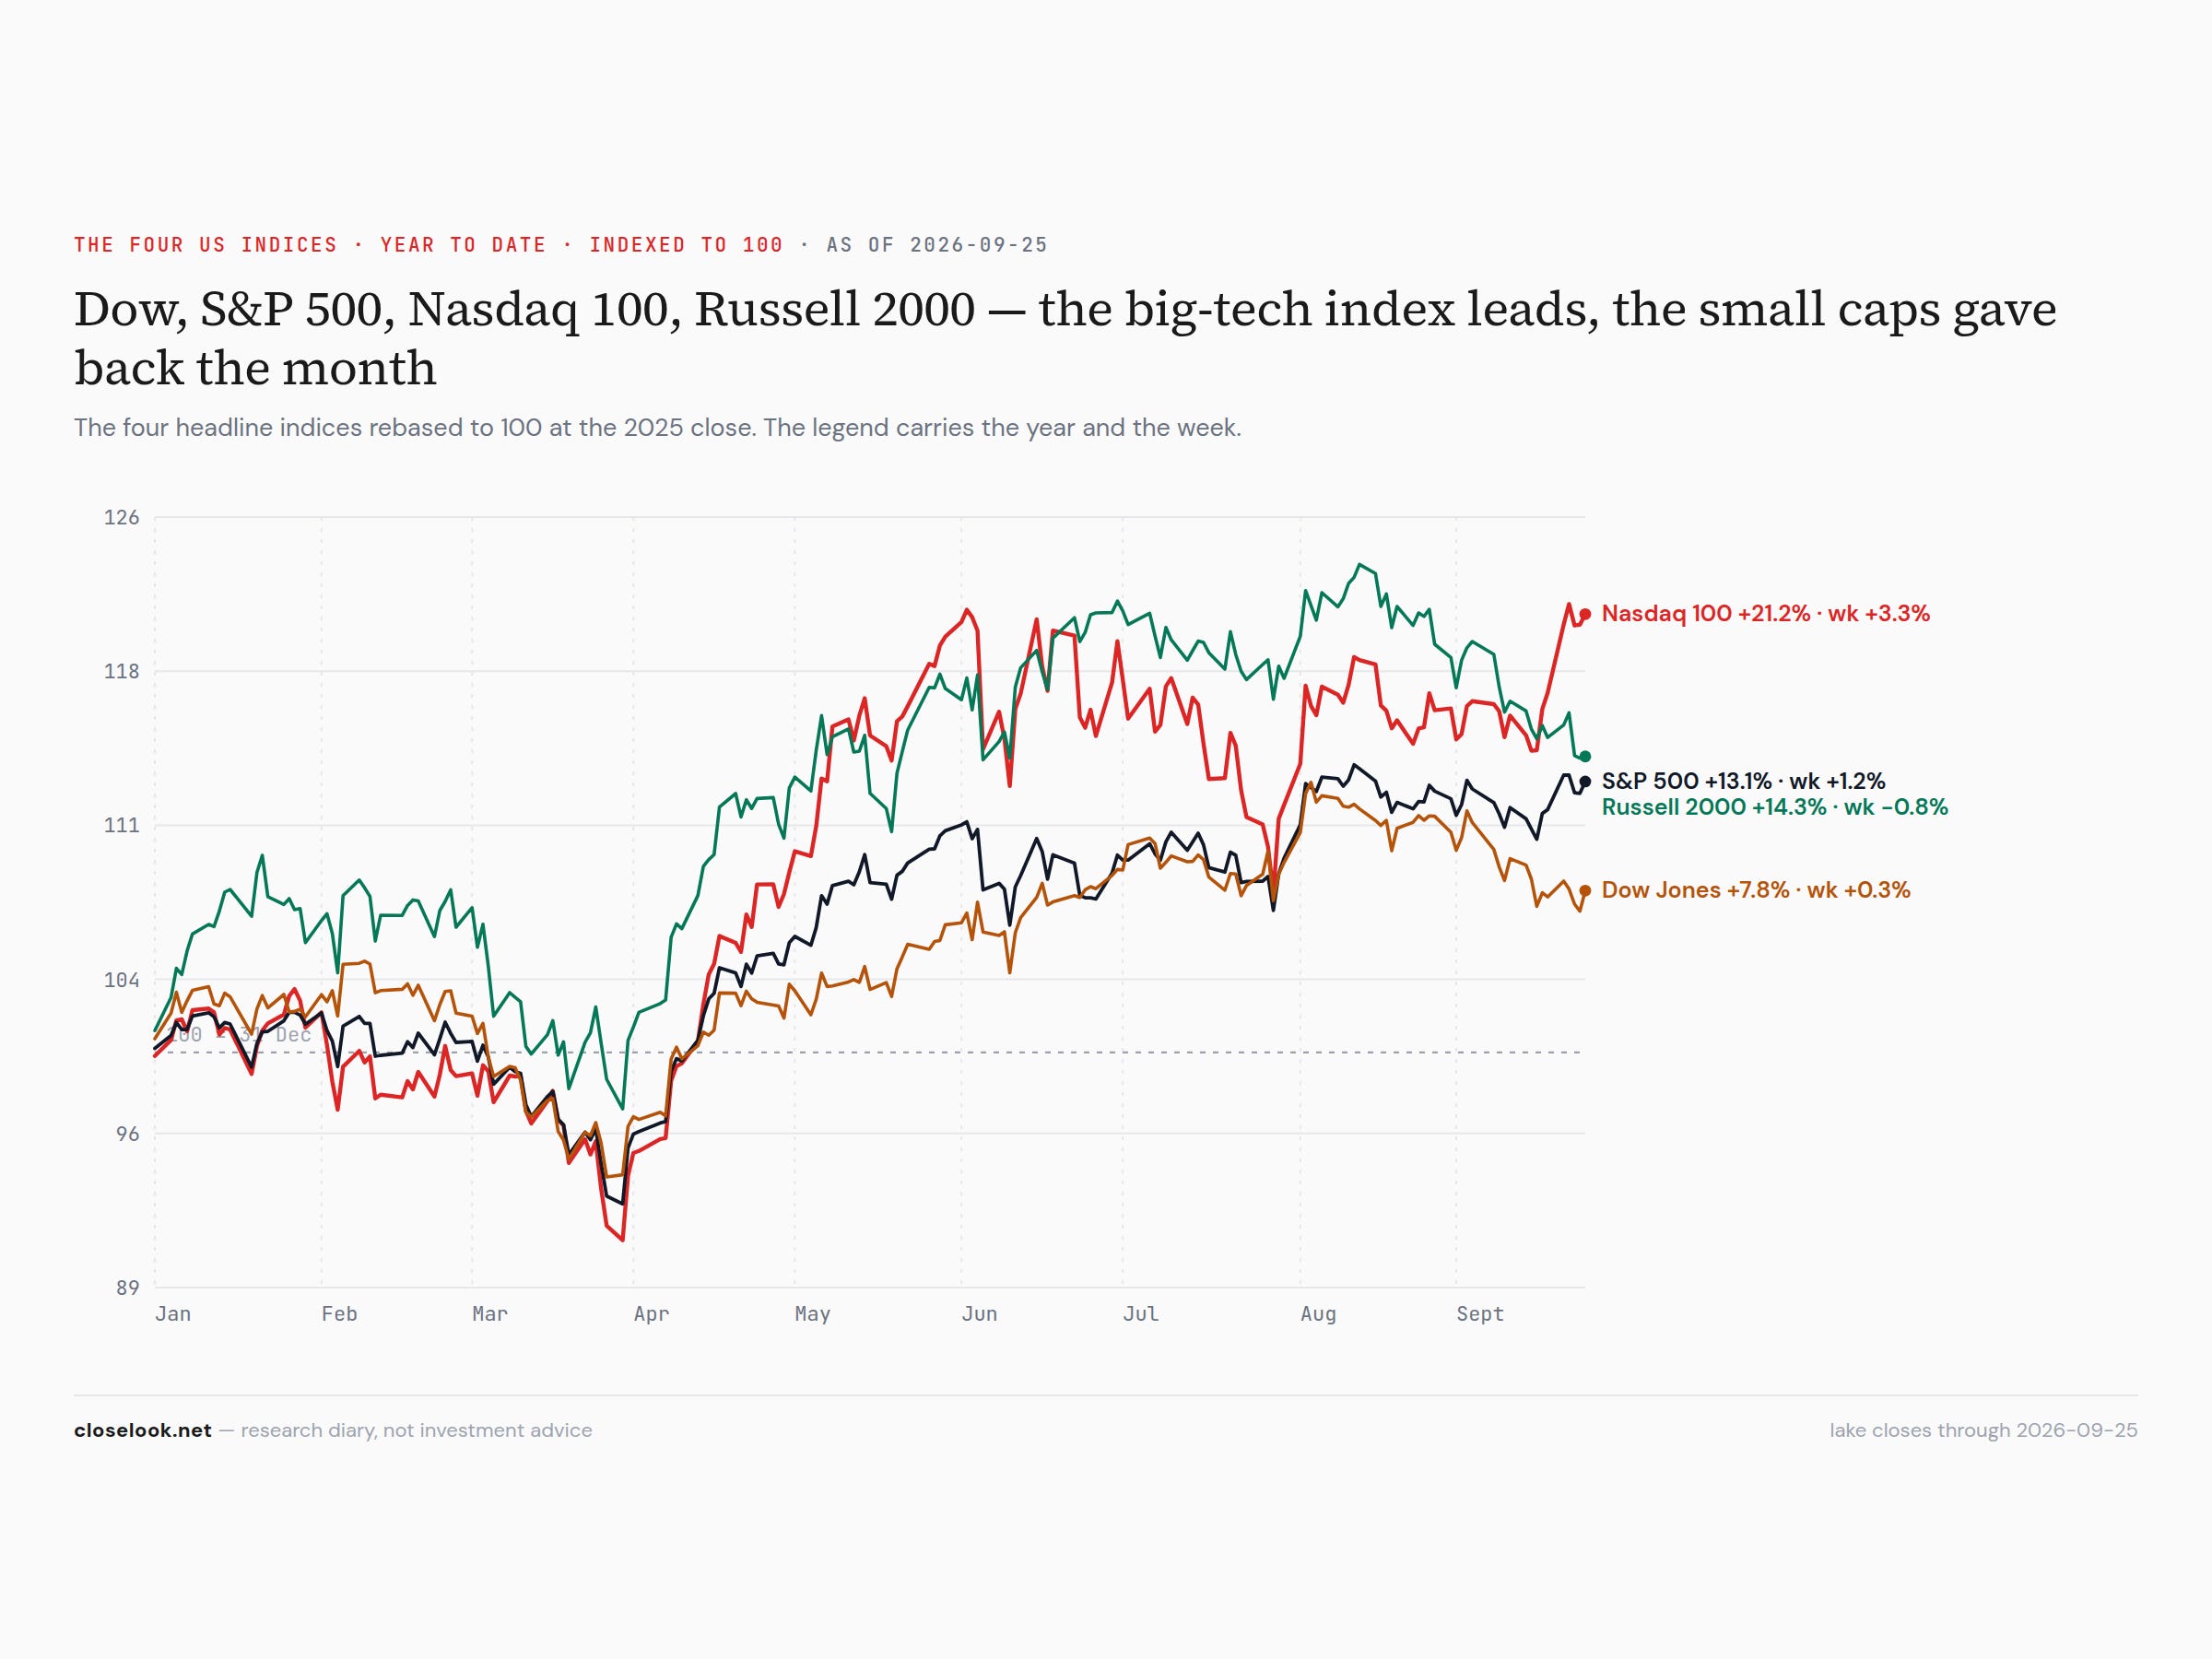
The big-tech index led, the old-economy index barely moved, the small caps fell. The Nasdaq 100 +3.25% to 30,608 — +21.2% on the year, 0.4% under Tuesday’s high of 30,732. The S&P 500 +1.21% to 7,743 — +13.1% on the year, 0.7% under its August 13 high. The Dow +0.28% to 51,829 — +7.8% on the year, 4.6% under its August 5 high. The Russell 2000 −0.80% to 2,838 — +14.3% on the year, 7.5% under its August 14 high. Two indices near their highs, two well under them, and the dividing line is the same as in the Nasdaq cuts: the companies that sell the AI economy against the companies that pay its interest rate. The small caps borrow at floating rates; the Dow carries the banks and the industrials; neither had a week in which the ten-year rose 18 basis points.
The Treasury curve, one month to thirty years
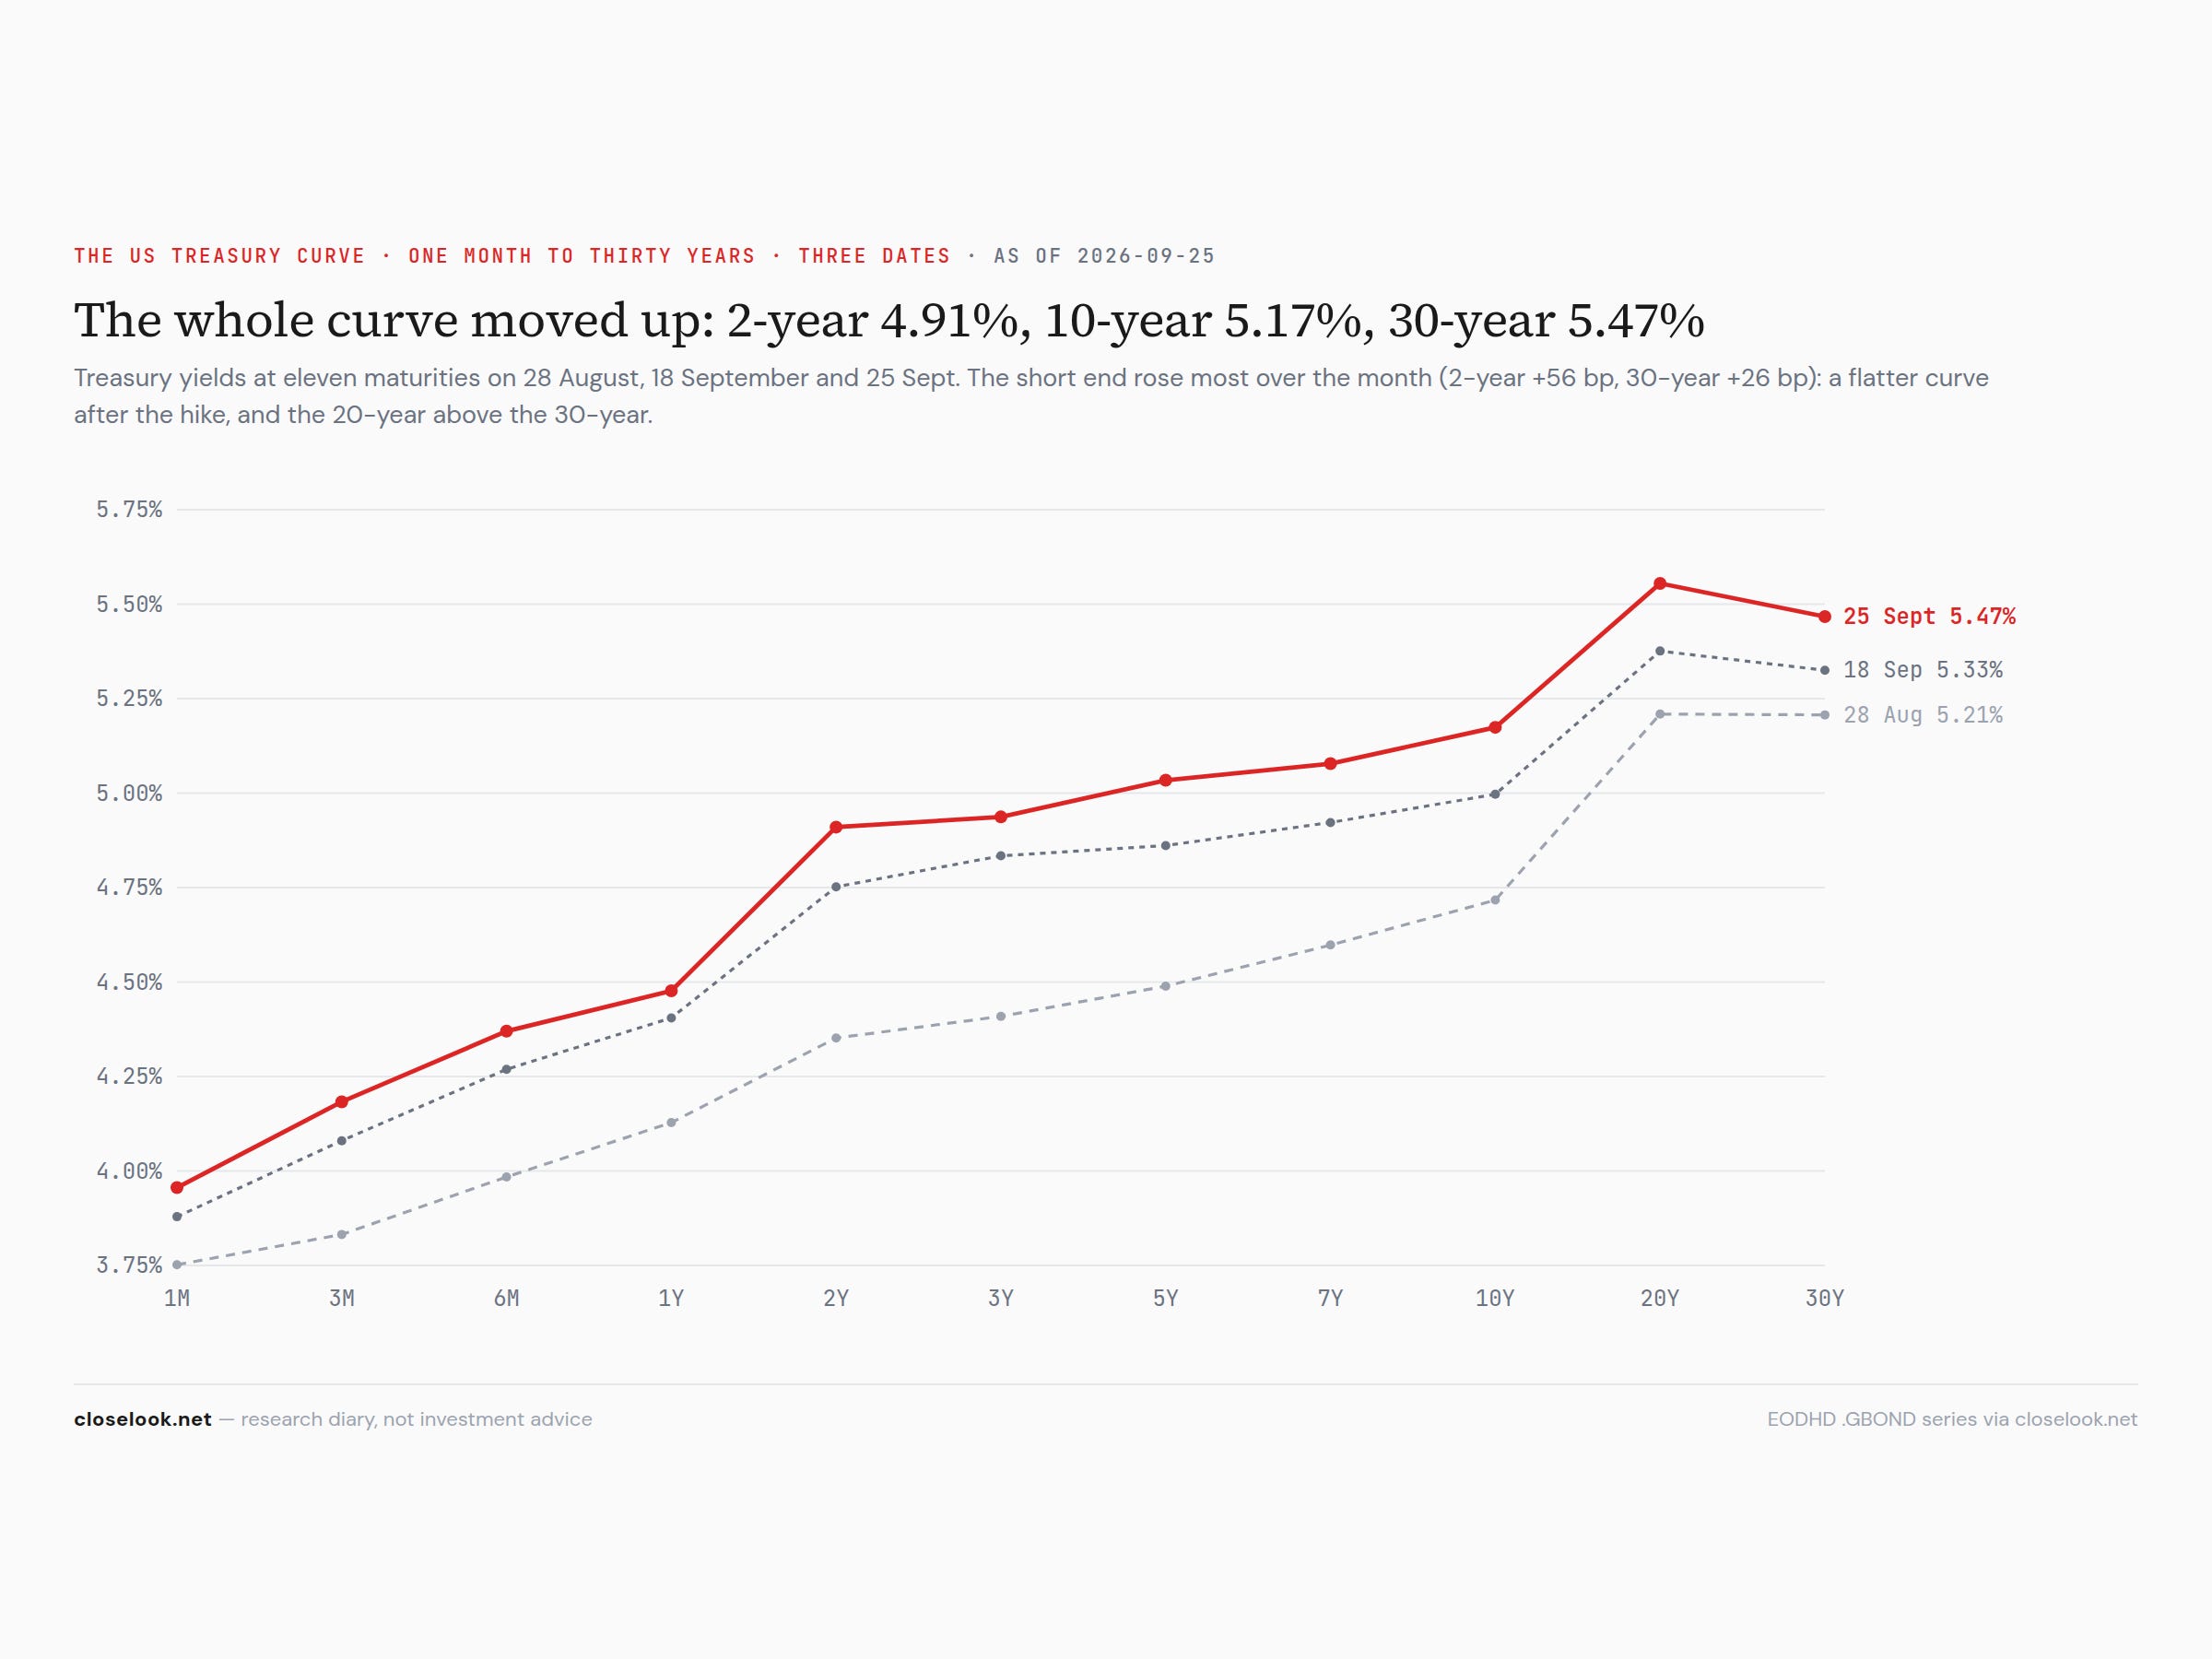
The whole curve moved up, and over the month the short end moved most. The yields at Friday’s close, with the week’s change: 1-month 3.96% (+8 bp), 3-month 4.18% (+10), 6-month 4.37% (+10), 1-year 4.48% (+7), 2-year 4.91% (+16), 3-year 4.94% (+10), 5-year 5.03% (+17), 7-year 5.08% (+16), 10-year 5.17% (+18), 20-year 5.56% (+18), 30-year 5.47% on the government-bond series, 5.50% on the CBOE index (+14). Over the four weeks since August 28: the 2-year +56 basis points, the 10-year +46, the 30-year +26 — the curve flatter after the Fed’s hike, the front end pricing the second increase Governor Barr talked about. Two shapes to note: the 20-year yields more than the 30-year, a hump that widened this month; and the 5-year crossed 5% this week, which puts every maturity from five years out above five percent.
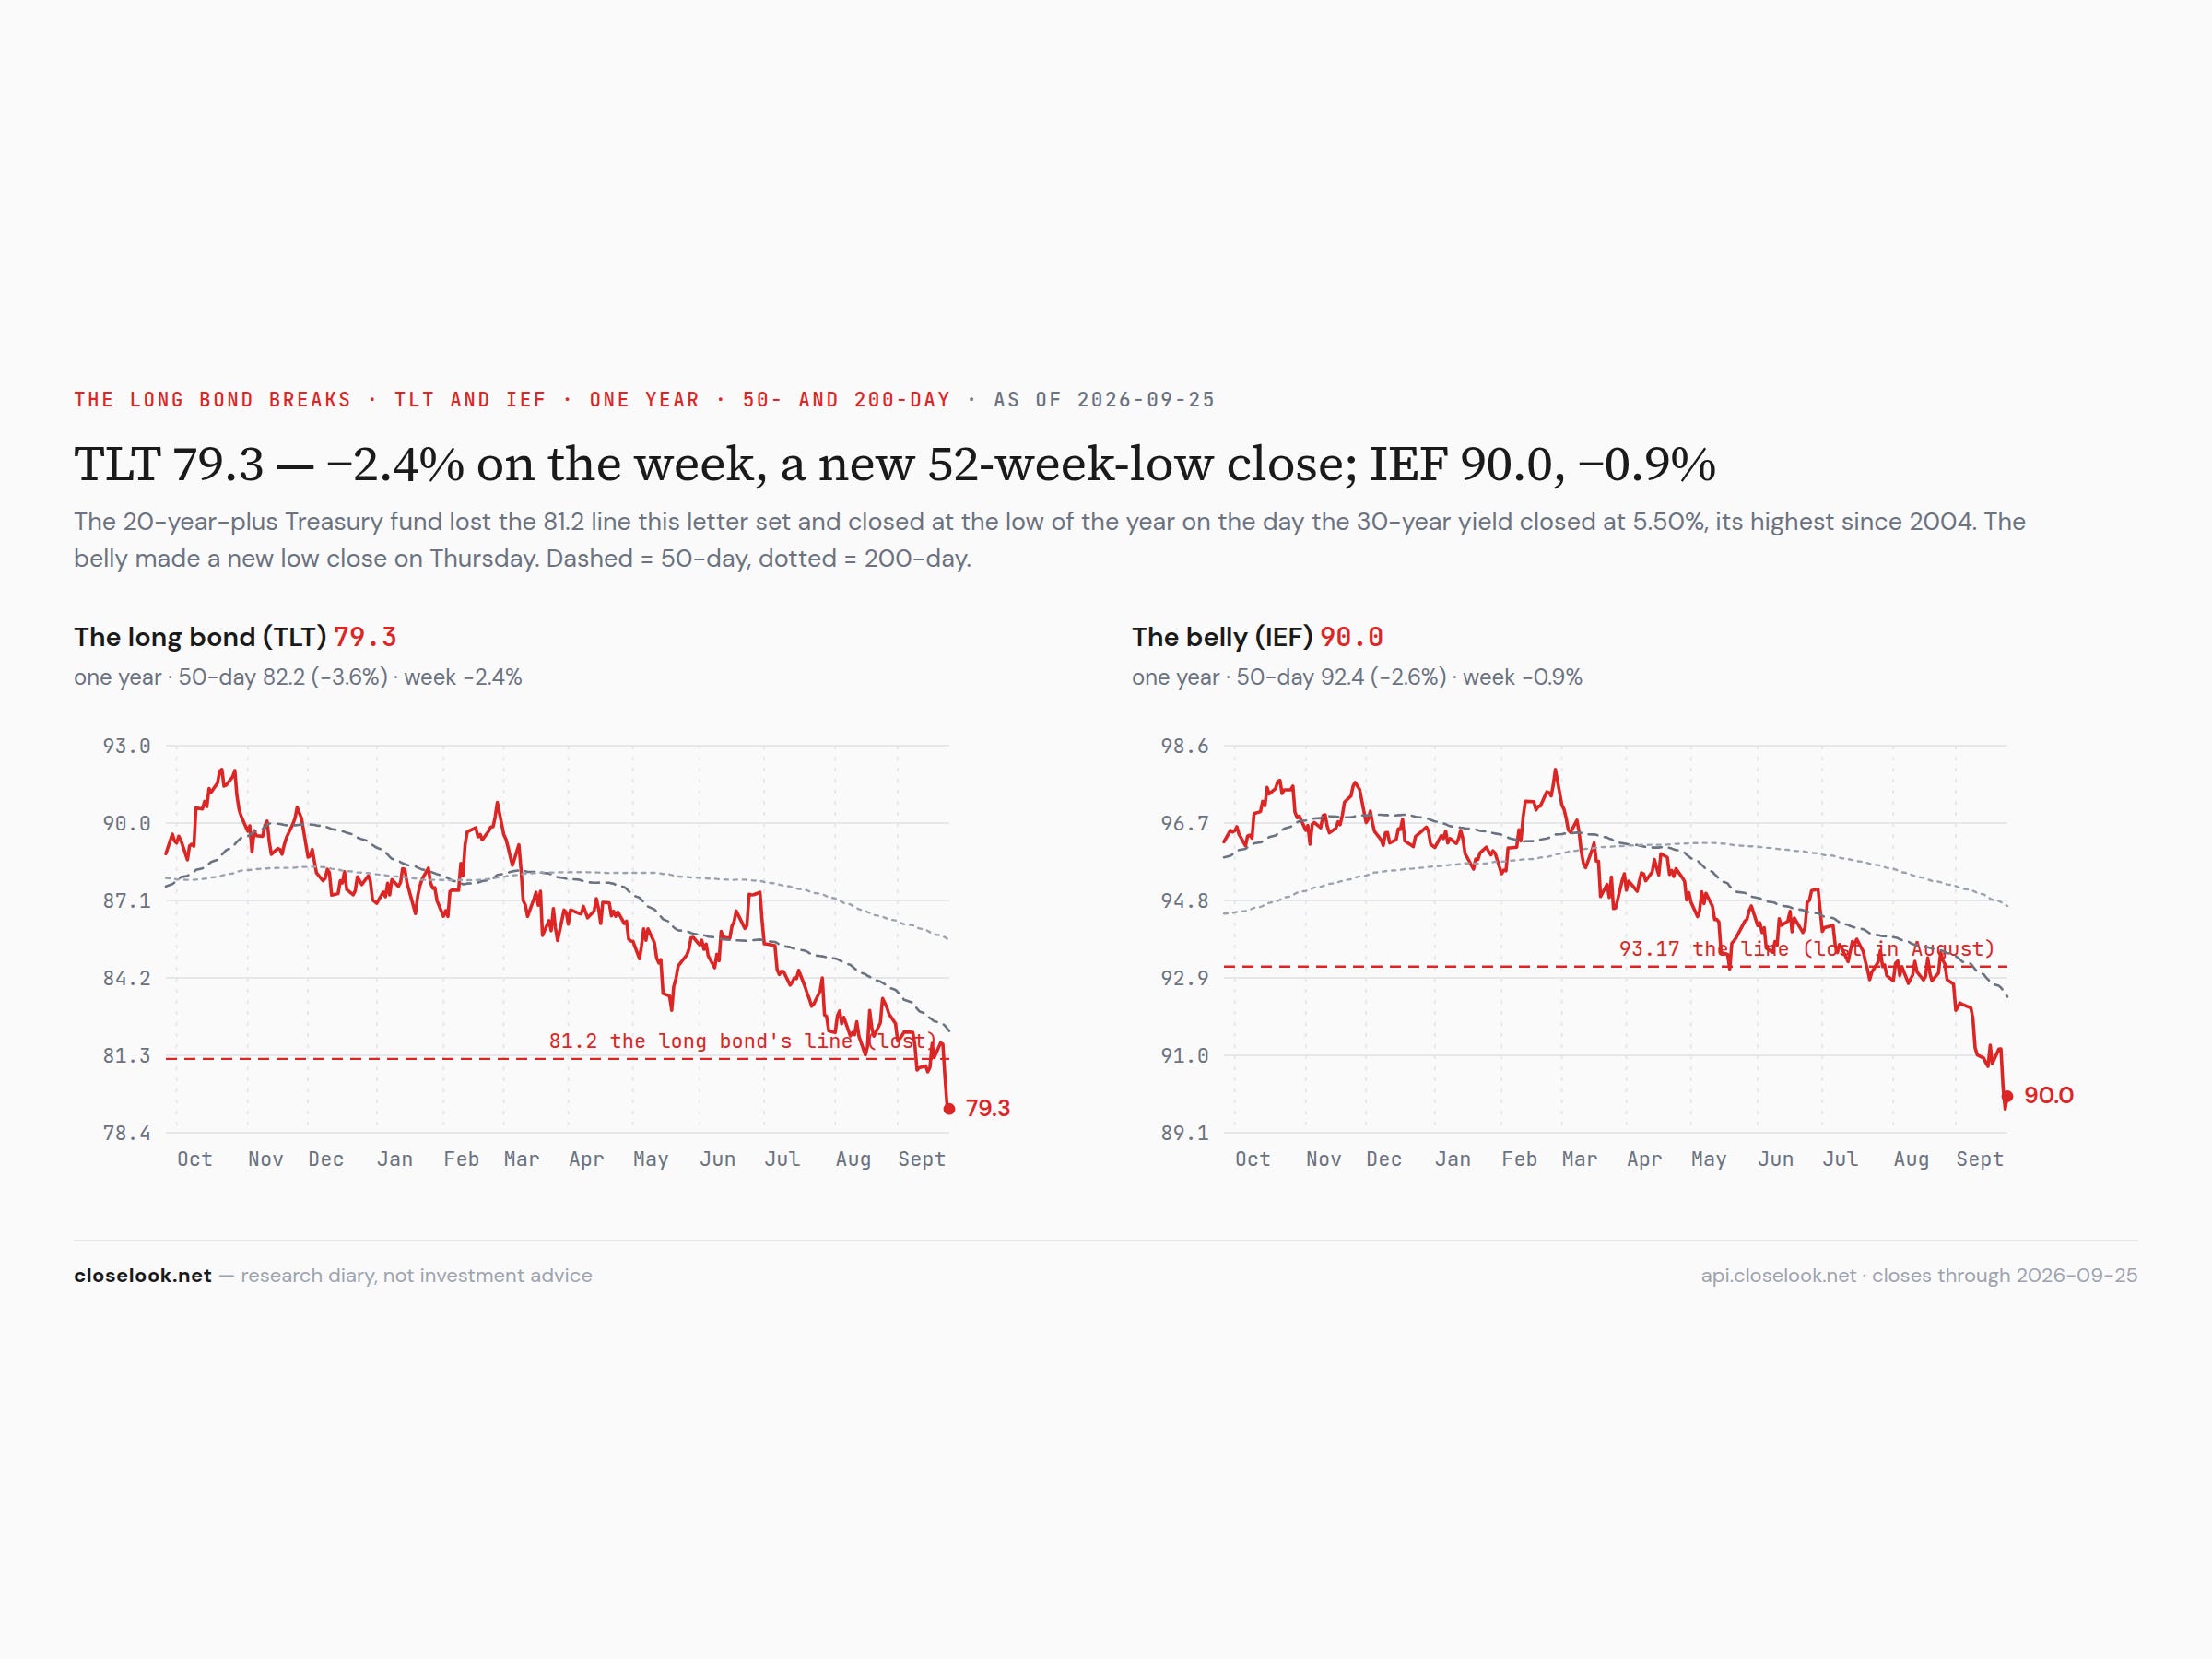
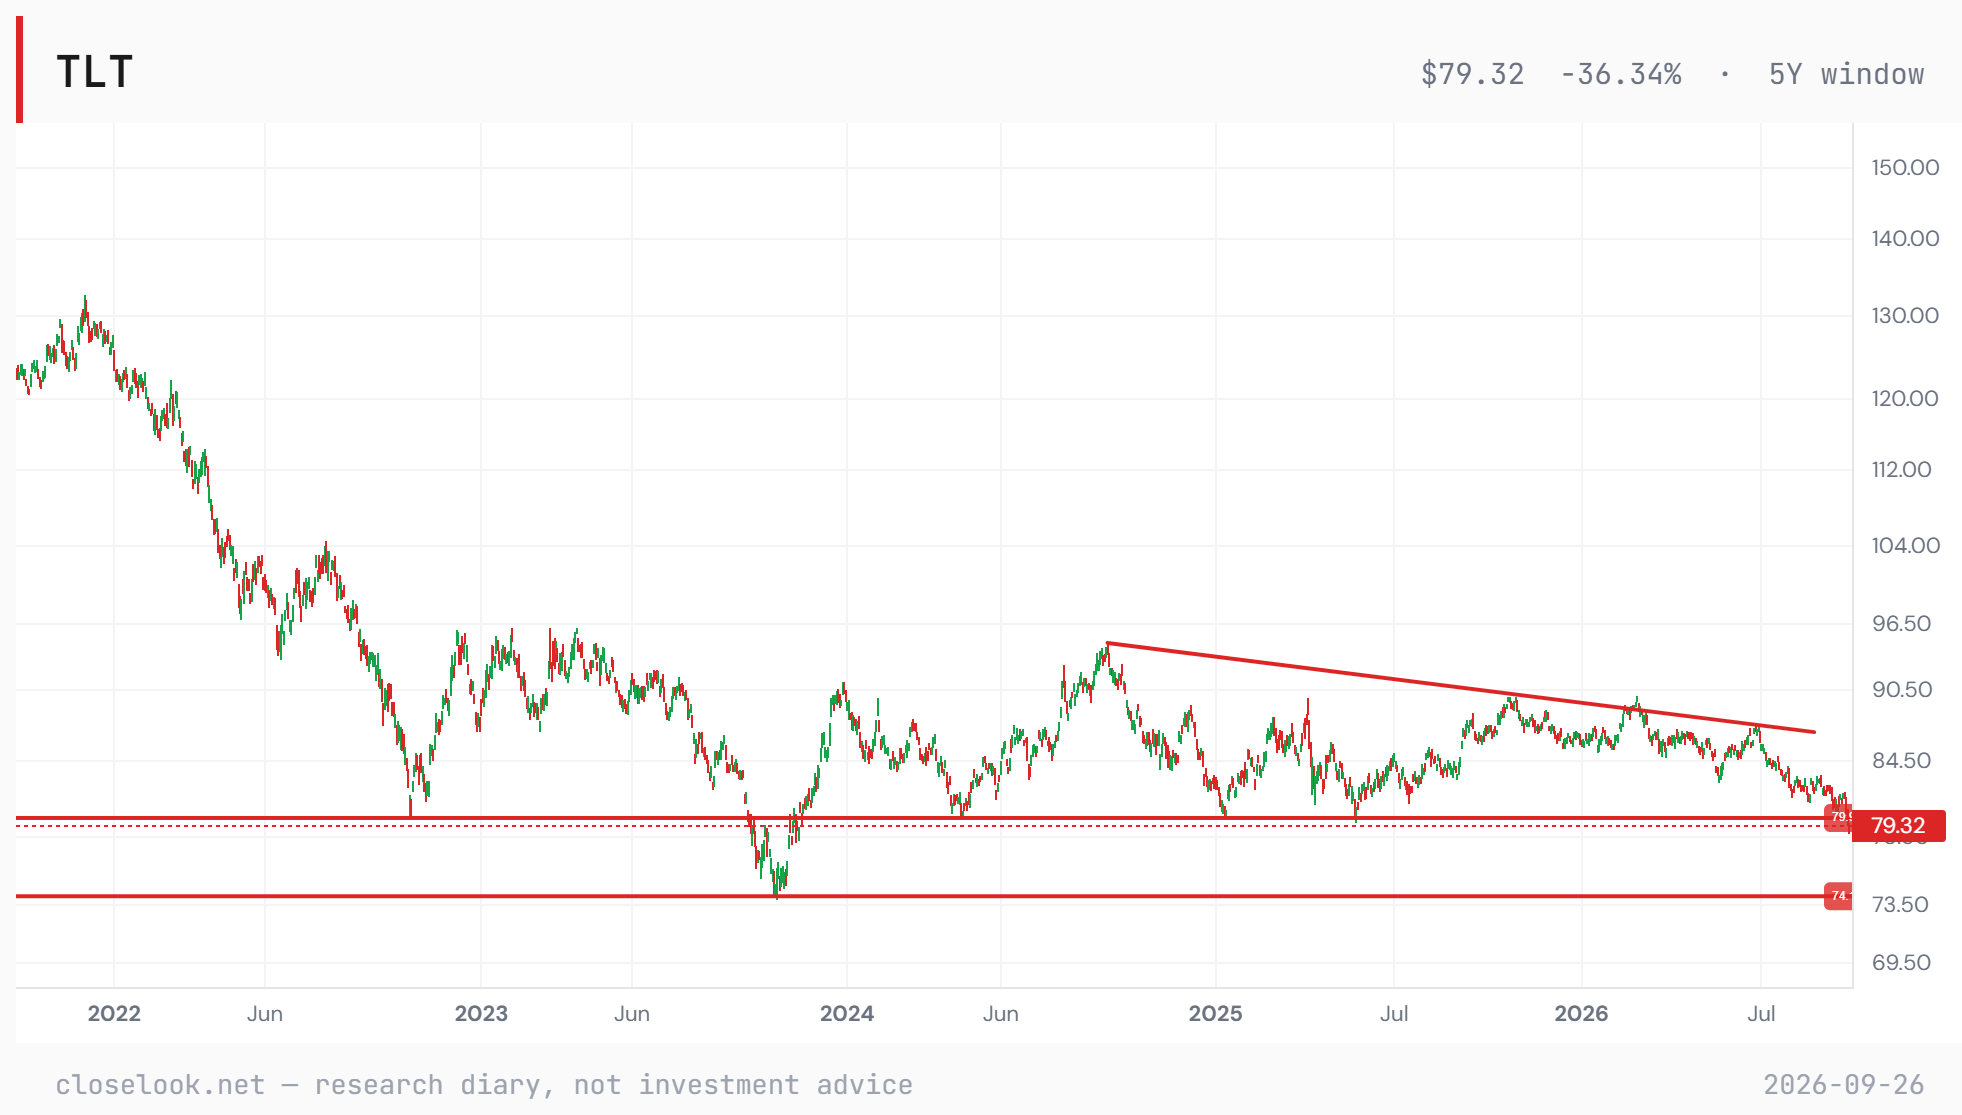
The veto, scored at the close — the seventh failure on the belly, and the long end lost its line. IEF 91.15, 91.16, 90.19, 89.69 — a new fifty-two-week-low close on Thursday — 90.00. Seventh consecutive week under the 93.17 reclaim line. TLT 81.80, 81.75, 80.46, 79.42, 79.32 — the 81.2 line it held by a nickel last Friday lost on Wednesday, two new lows to finish. The editor’s five-year chart of the long-bond fund shows the floor near 79.9 that held in 2022, 2024 and 2025 breaking for the first time since the autumn of 2023; the next level is 74, the October 2023 low, 6.7% under Friday’s close. Last week the letter called the bond veto engaged on the belly and a dissent on the long end; this week it is engaged on both, and the equity leaders rose through it.
The dollar
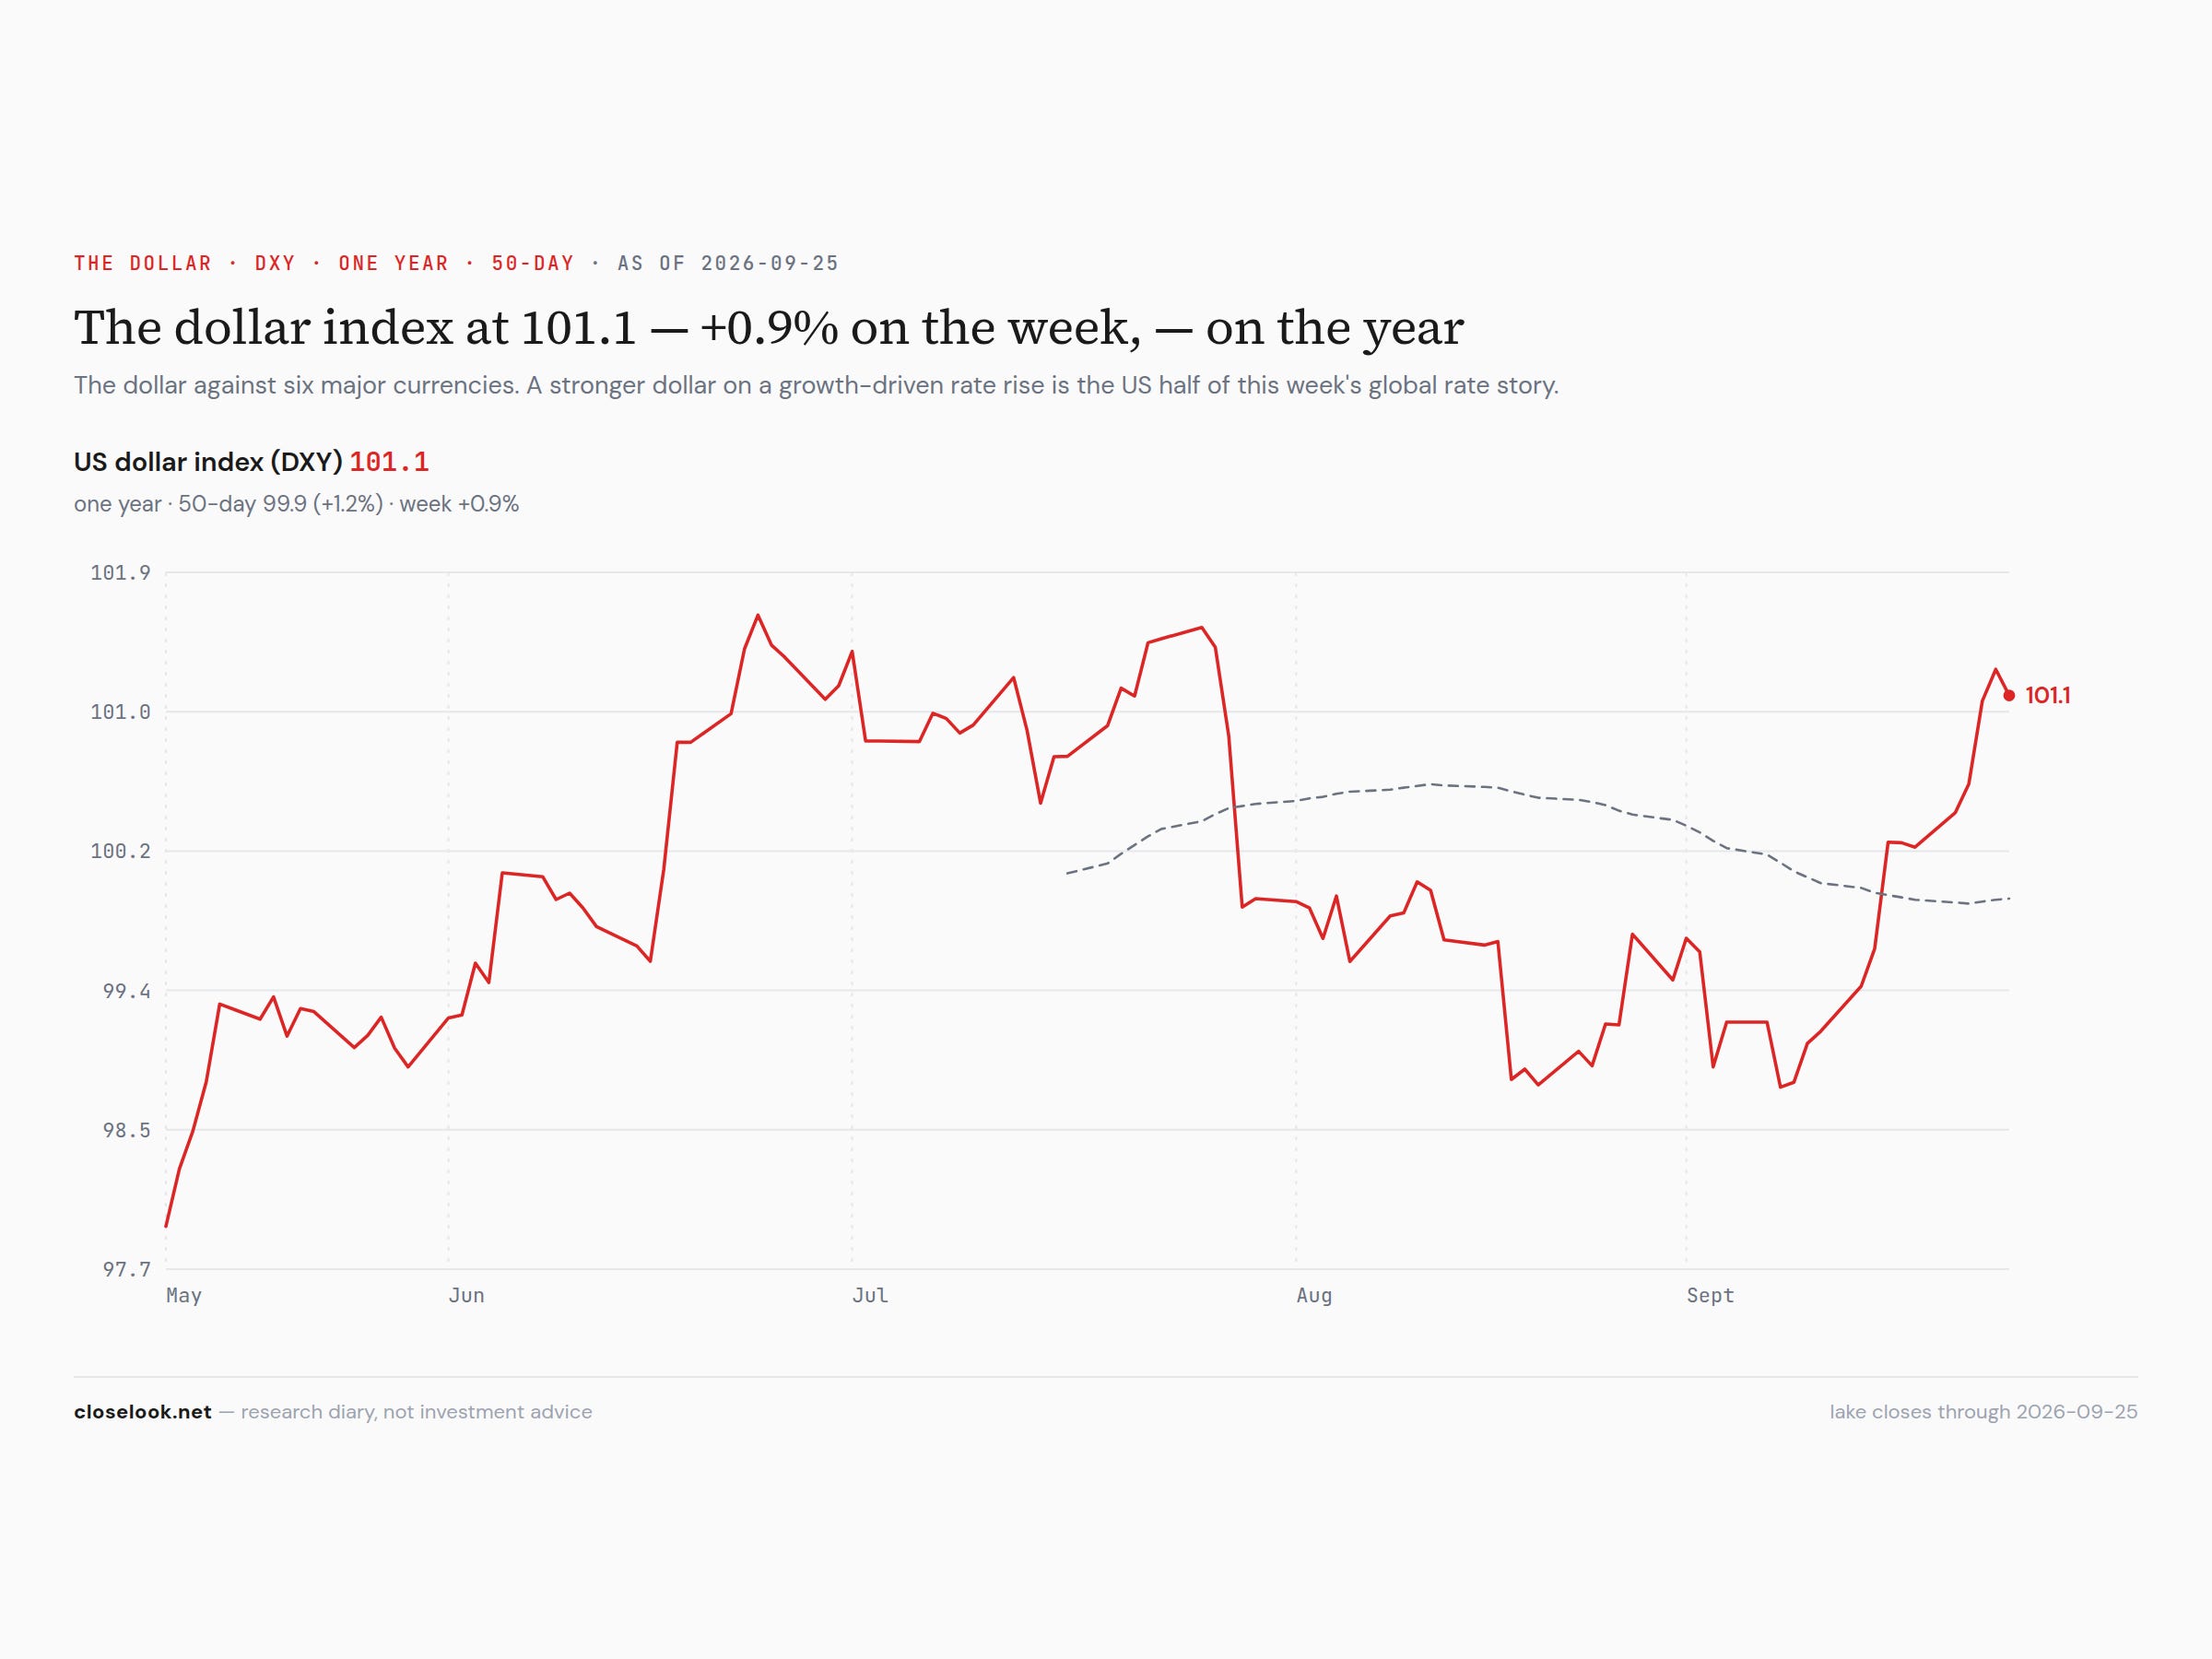
A stronger dollar, on a stronger economy. The dollar index closed at 101.13, up 0.9% on the week, and the dollar fund made its highest close of the past year on Thursday — +5.9% on 2026. In a week in which Japan’s ten-year rose to 3.07% and France’s spread over Germany widened to 113 basis points, the US paid more because it is growing and the others paid more for other reasons; the currency took the growth reading. A stronger dollar tightens conditions for everyone who borrows in it, and it is the reason the Asian chip exporters’ dollar funds and Europe’s dollar funds rose less than their home markets; Saturday’s Global letter has the geography.
The cross-asset split, at tape altitude — bitcoin with the leaders, gold with the bonds. Bitcoin closed Monday at 86,603, through the 83,000 line this letter carried last week, and finished the week near 84,000; the bitcoin fund +3.37%. Gold’s fund −1.93% to 393.41, silver −2.99%. In a rising-rate, rising-dollar week, the coin traded like a growth asset and the metal like a bond.
2 · The State
The mechanism, named: a growth rate rise, not a squeeze — and the market paid the leaders for it. The yields rose on a business survey and a Fed governor’s sentence, not on an inflation scare or a funding accident. That is the kind of rise equities can carry, and this week the ones that carried it best were the ones with the most growth to discount: the chips, the megacaps with a new product to sell, the thirty largest Nasdaq names. The ones that could not carry it were the ones that owe the rate rather than out-grow it: the small caps, the banks, the utilities, the non-tech Nasdaq.
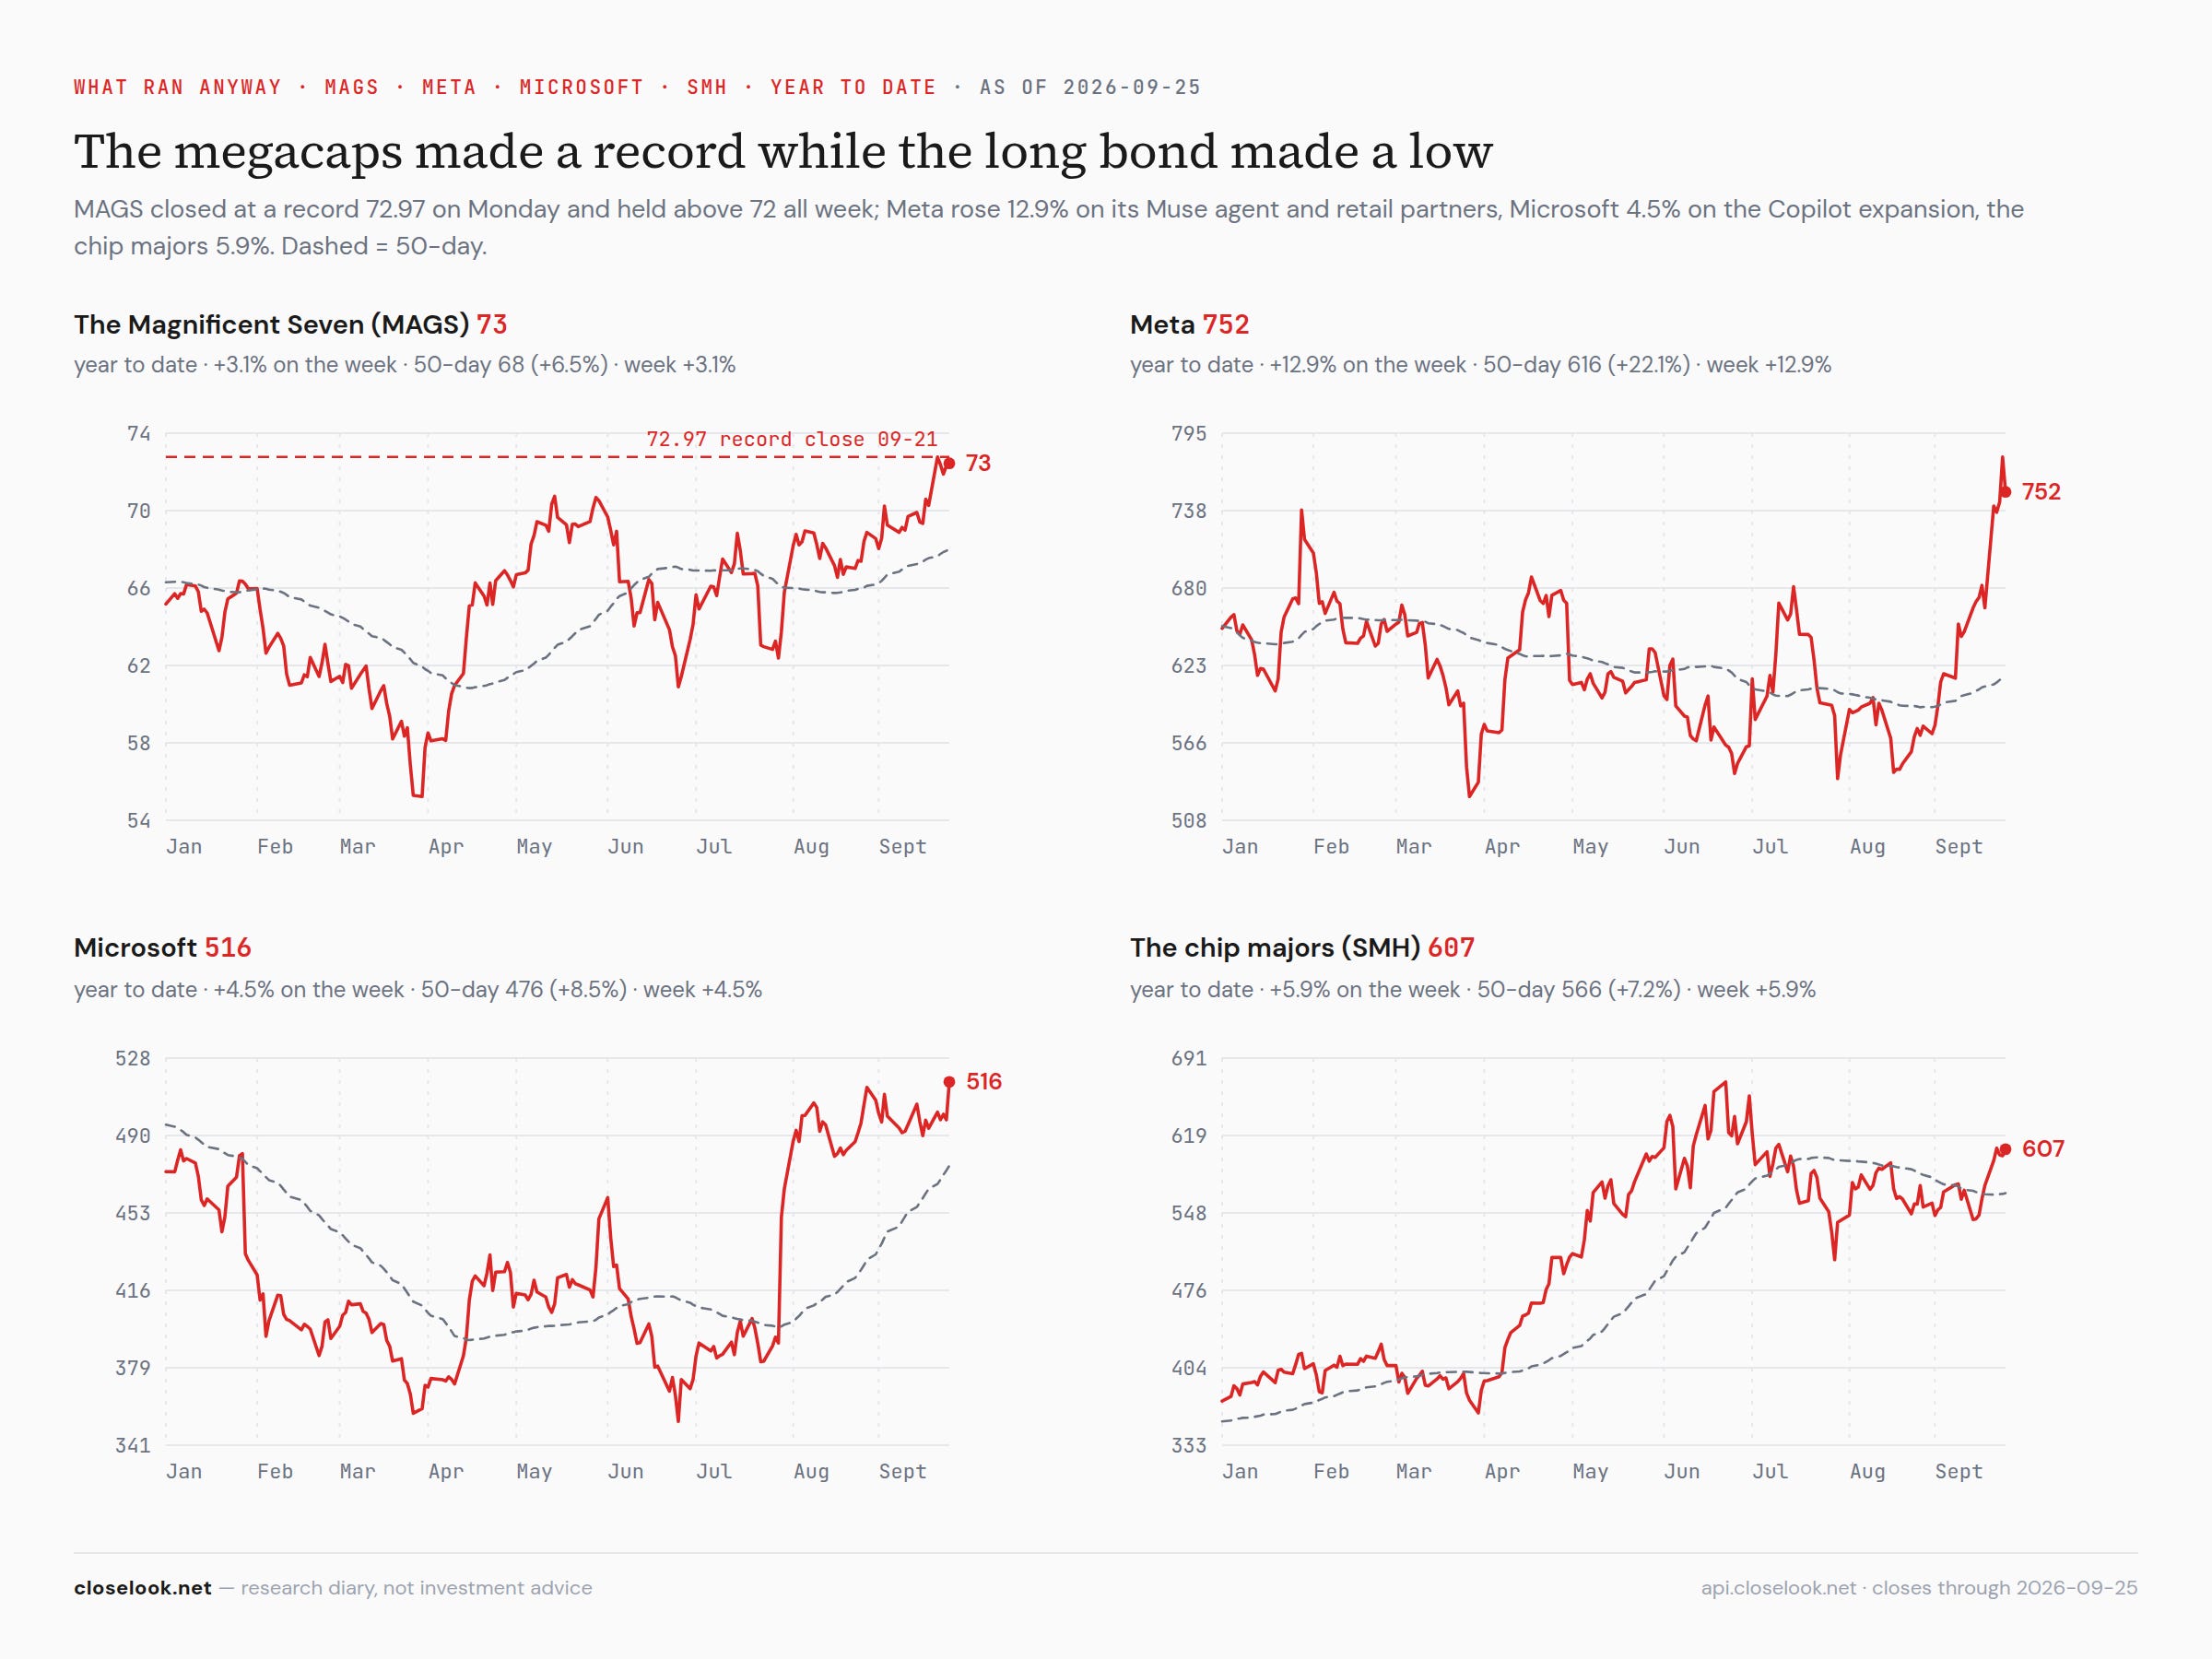
The applications turned up in the prices — Meta and Microsoft. Meta +12.9% on the week — +11.3% on Monday when its Muse agent reached No. 1 on Apple’s US App Store, then its Connect event on Wednesday naming Walmart, Best Buy, Gap, Sephora and Wayfair as shopping partners for the agent after Instacart on Monday, with new glasses at $449, $349 and $249 and a $1,299 headset; Amazon has blocked the agent from its store. Microsoft +4.5% — +3.6% on Friday on reports of a large Copilot expansion: coding tools, autonomous agents and direct access to Word, Excel and Outlook, after Stifel’s upgrade to Buy on Wednesday. At sector altitude, the reading is this: the first AI products the market is paying for as products, not as spending plans, belong to the platforms. The software fund rose 1.6%; the applications index that holds the companies selling seats on top of the platforms fell 0.1% on the week and 5.7% on the month. Intuit fell 9.0%, Adobe 5.4%, Salesforce 1.6%.
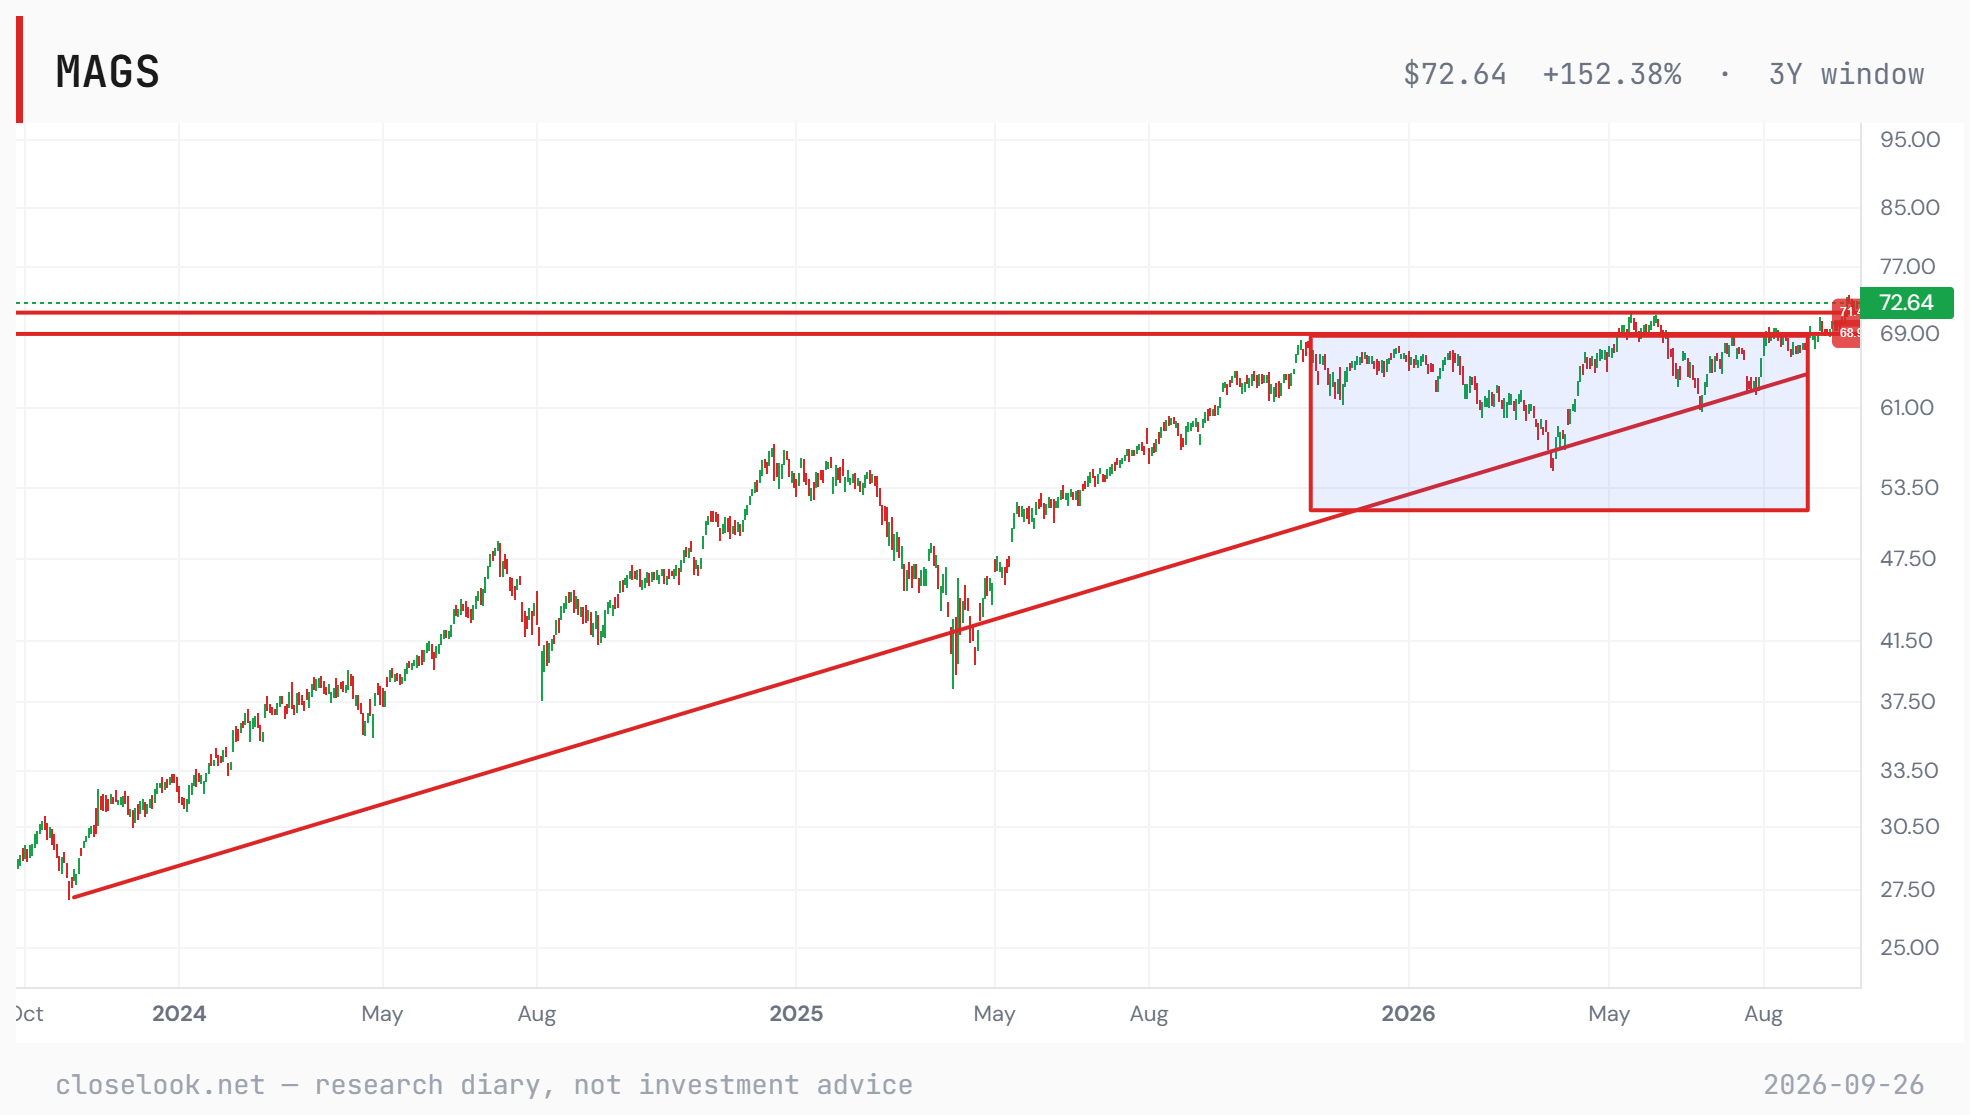
The Magnificent Seven broke out. The fund made a record close at 72.97 on Monday and held above 72 all week, 72.64 on Friday, +3.09%. The editor’s three-year chart puts it in its frame: a breakout from a ten-month box between roughly 53 and 69, through the 71.4 summer high. The seven inside it: Meta +12.9%, Microsoft +4.5%, Tesla +2.2%, Apple +1.5%, Nvidia +1.3%; Alphabet −1.6%, Amazon −1.6%. The hyperscaler cohort — Microsoft, Amazon, Alphabet — was −0.1% on the week as a group; the record was made by the consumer AI names.
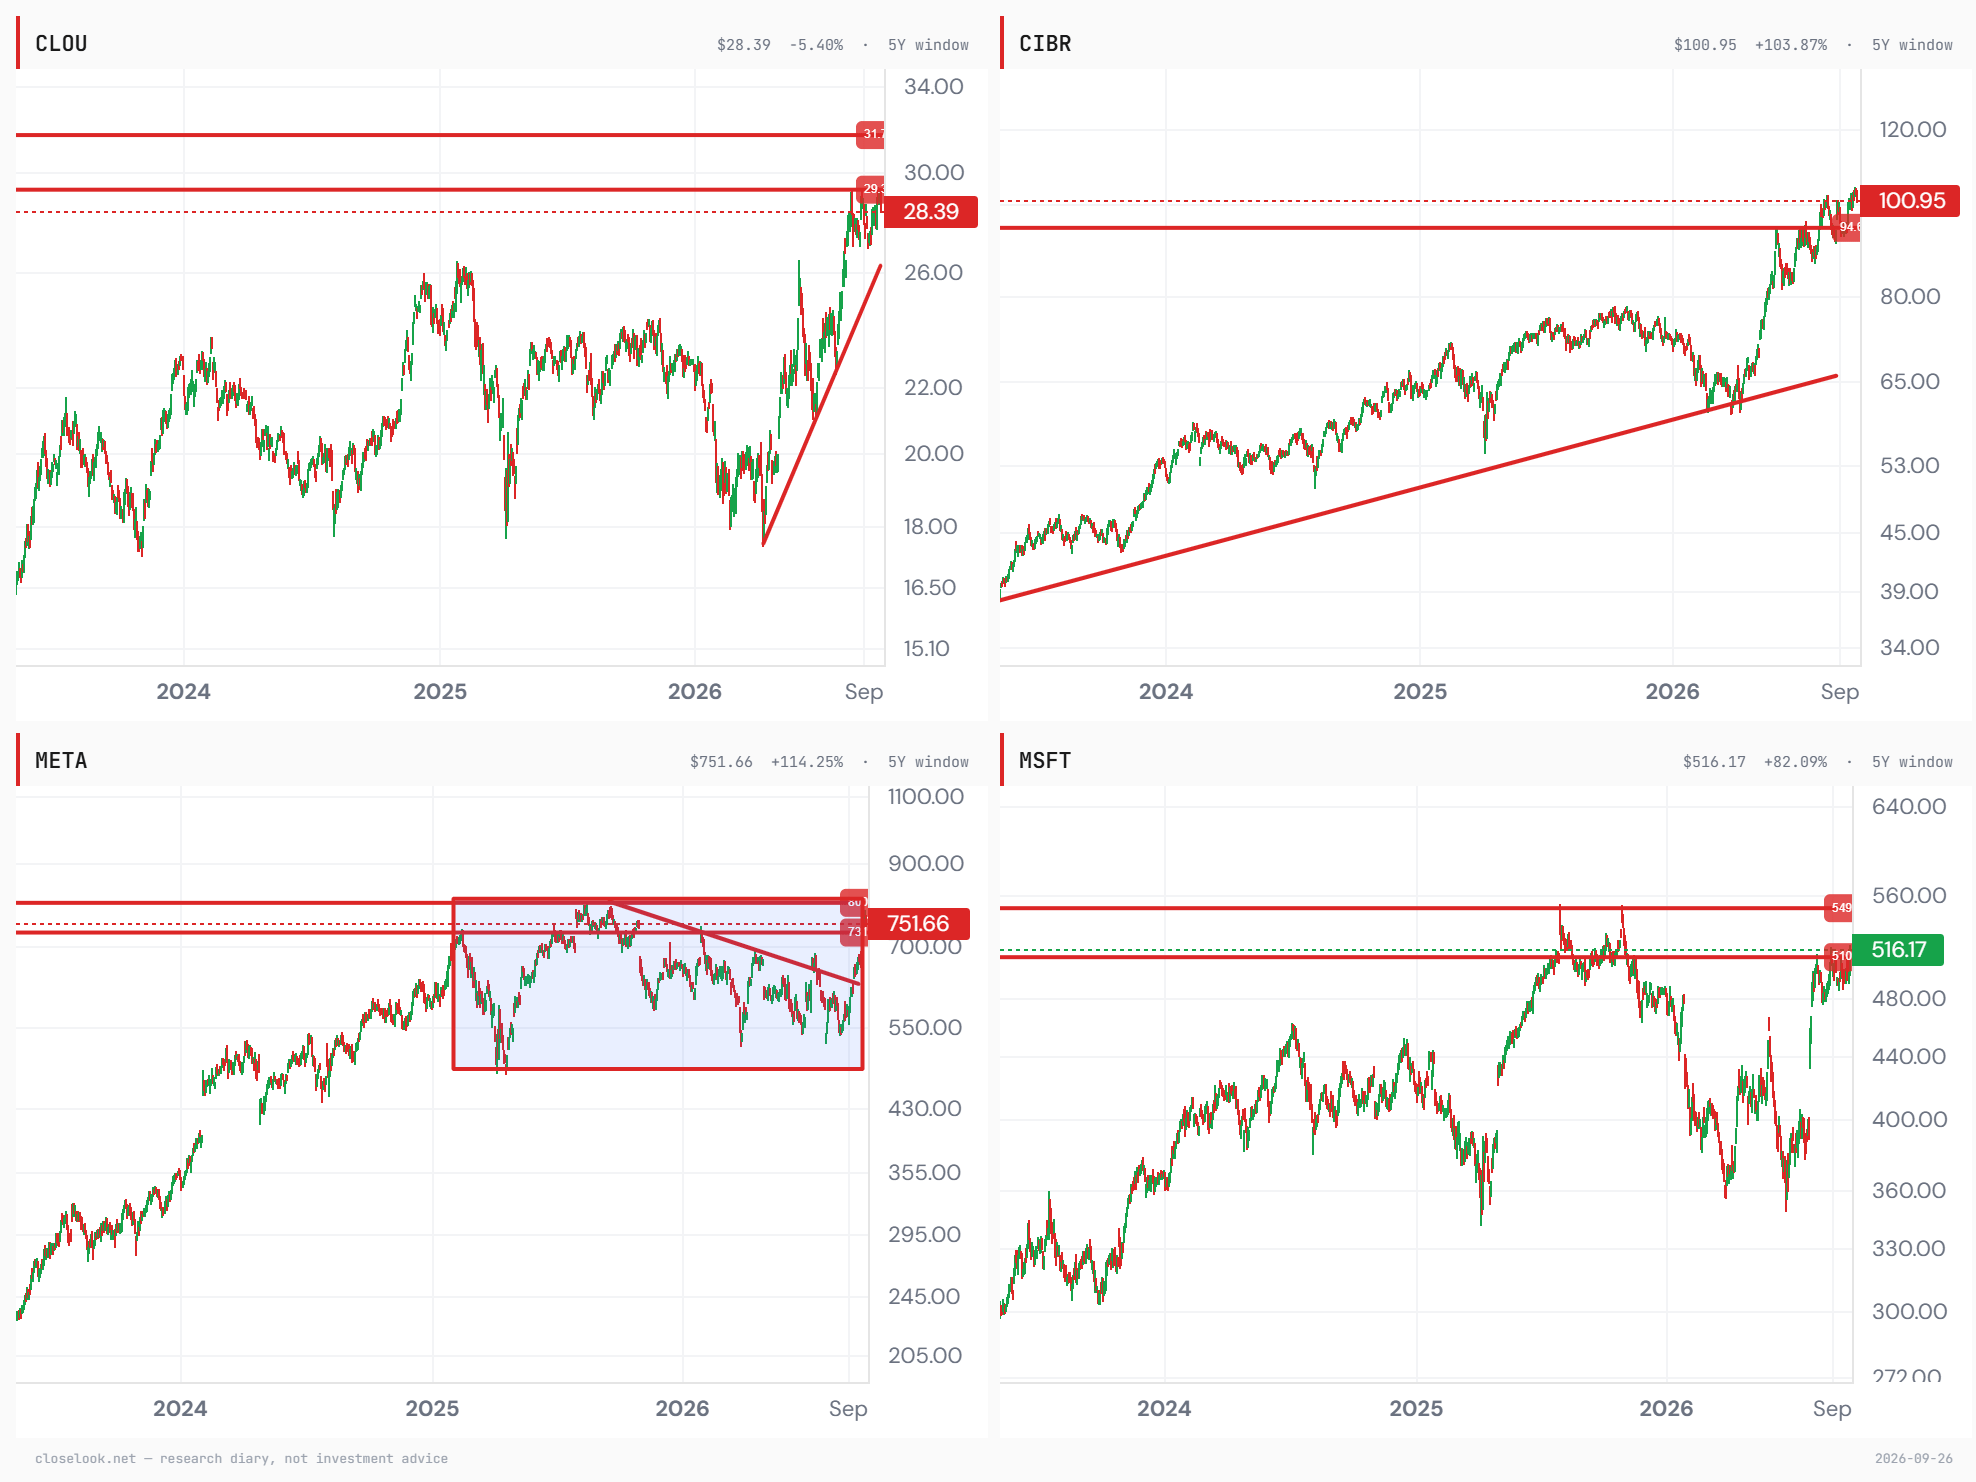
The leaders, in the editor’s 2×2 — cloud, security, Meta, Microsoft. Cloud (CLOU) at 28.39, on a steep line from its spring low, with 29.3 and 31.7 the next marks above; cybersecurity (CIBR) at 100.95, through the 94.6 line it had pressed against since July; Meta at 751.66, out of the falling line inside the box it has traded in since early 2025, with 731 now the floor and the top of the box near 800; Microsoft at 516.17, back above 510, with 549, the 2025 high, the next line. Four charts, four breakouts or near-breakouts, and every one of them a company or a fund that sells the AI economy to its users.
Oracle — the one credit fact of the week. Oracle invoked force majeure on a data-center campus in New Mexico on Thursday; the stock fell 7.1% on the week to 137.10 — three red sessions to end it — and Arm fell 7.9% on the day it was reported. Oracle is the seller of compute this letter scored “sold” in its September 15 print window, at −8.3%, on a $664 billion backlog. A force-majeure notice is a contractual statement that something outside the company’s control prevents it from performing; which party it protects, and from what, is what the market will want to know. The builders sold on it for a day; the platforms did not.
The count — through the confirmation line on a close, and back under it on the week. The Nasdaq 100 fund closed Tuesday at 747.46, through the 746.16 confirmation line this letter has carried since August, for the first time on a close. It closed the week at 744.50, 1.66 under the line and 4.5% above its 50-day average at 712.65. 694 remains the kill-switch, 6.8% below; the 704 shelf that held twice last week is now 5.4% below. One daily close through confirmation is not a weekly confirmation; the letter’s standard has always been the weekly close.