


0 · Last week, scored
Verdict: the six stood still under their records; Meta lost the floor of its box; the average stock did not join.
Last Sunday’s signal was the Magnificent Seven without Tesla, ahead of the market. The fund held above 69 all week and closed at 72.59, under Monday’s 72.97 record — neither extended nor broken. Apple came off its record by 2.2%; Nvidia closed 0.8% under its May high; Microsoft gained 0.3%. Alphabet held its 200-day by three cents on Thursday and finished just under its 50-day; Amazon stayed under its 50-day. Meta closed under 731, the floor of the editor’s box, on four days of five. The equal-weight S&P fell 0.65%: the lead stayed six names wide.
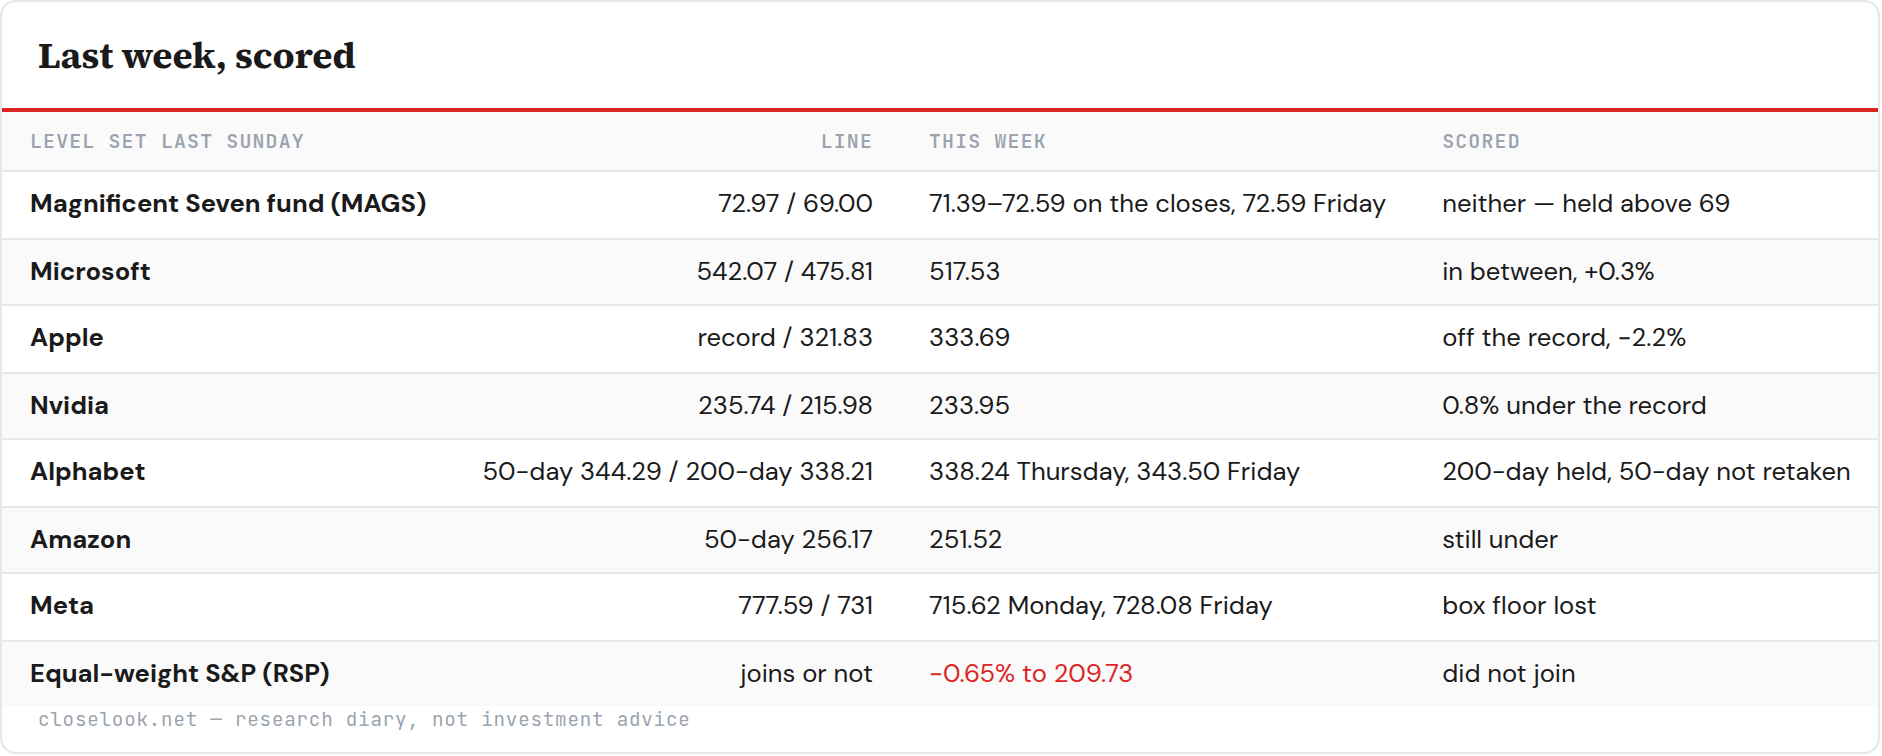
Table as text
1 · The signal — non-tech growth: two years of dead capital, and now it trades like a bond
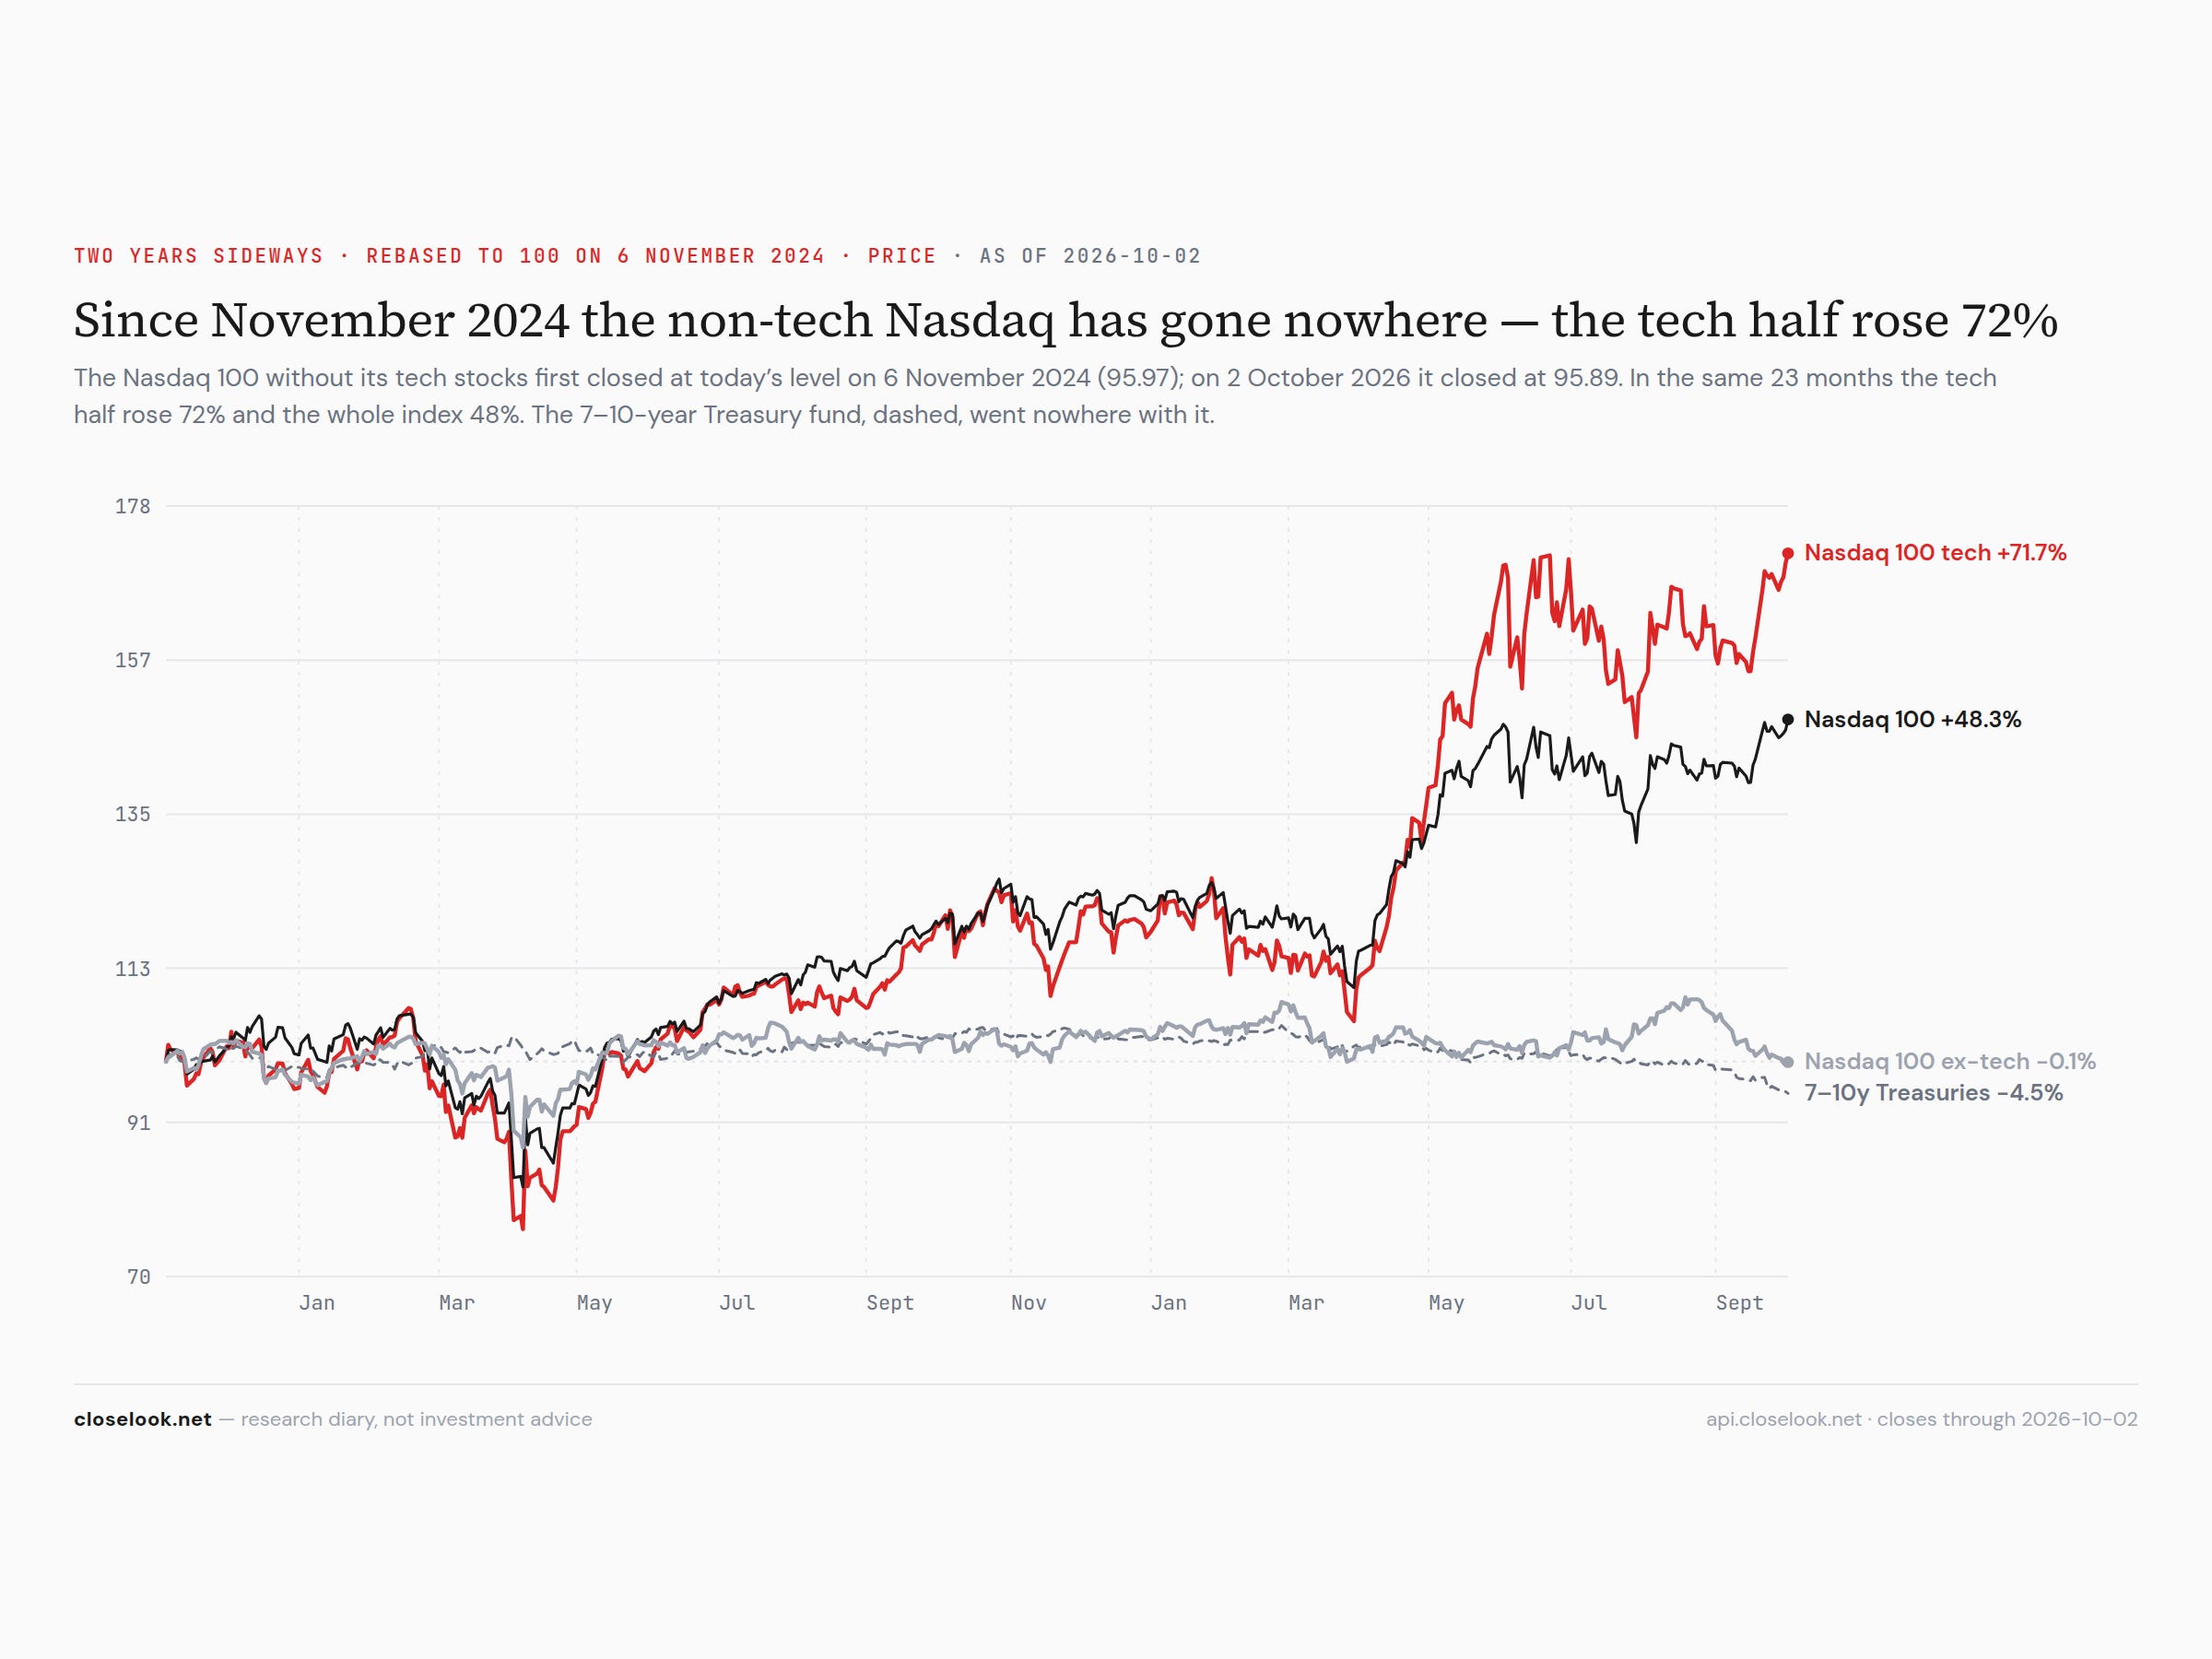
The Nasdaq 100 without its technology stocks closed Friday at 95.89. It first closed at that level on 6 November 2024, at 95.97. In the 23 months between, it has gone nowhere — −0.1% on the price, +1.6% with dividends — while the tech half of the same index rose 72% and the whole index 48%. On Thursday it closed at 95.56, its lowest close of 2026.
The non-tech half of the Nasdaq is the growth market outside the AI trade: consumer brands, health care, travel, industrial and service companies that grow, but whose profits are not accelerating with the AI build-out. For two years that market has been dead capital. This week the reason became visible in a second number: it now moves with Treasury bonds.
2 · The numbers: correlation up, cointegration only in the box
We measured how the non-tech Nasdaq moves against the 7–10-year Treasury fund (IEF), the long-bond fund (TLT) and the 10-year yield itself, over four windows. The correlation of daily returns is the share of the day-to-day moves the two have in common: zero means no link, one means lockstep.
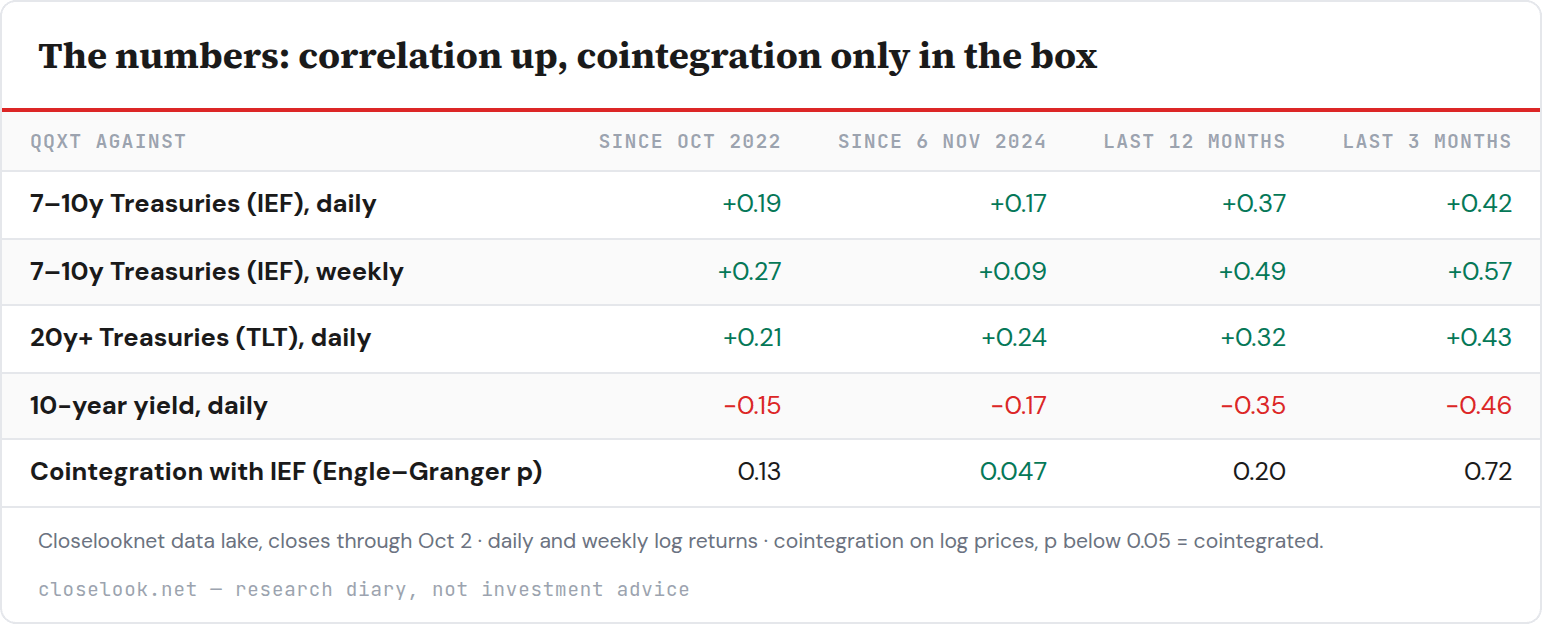
Table as text
Closelooknet data lake, closes through Oct 2 · daily and weekly log returns · cointegration on log prices, p below 0.05 = cointegrated.
Read it in two lines. The link to bonds has more than doubled: over the last three months the fund’s daily moves carry a correlation of −0.46 with the 10-year yield — up in yield, down in price — and on a weekly basis the fund and the Treasury fund move together with a correlation of +0.57. Since May the three-month reading has not dropped below +0.33. And over the two years of the box — only there — the two are cointegrated: they have moved as a pair, both flat. In every other window they are not; the link is a regime of this year, not a law of nature.
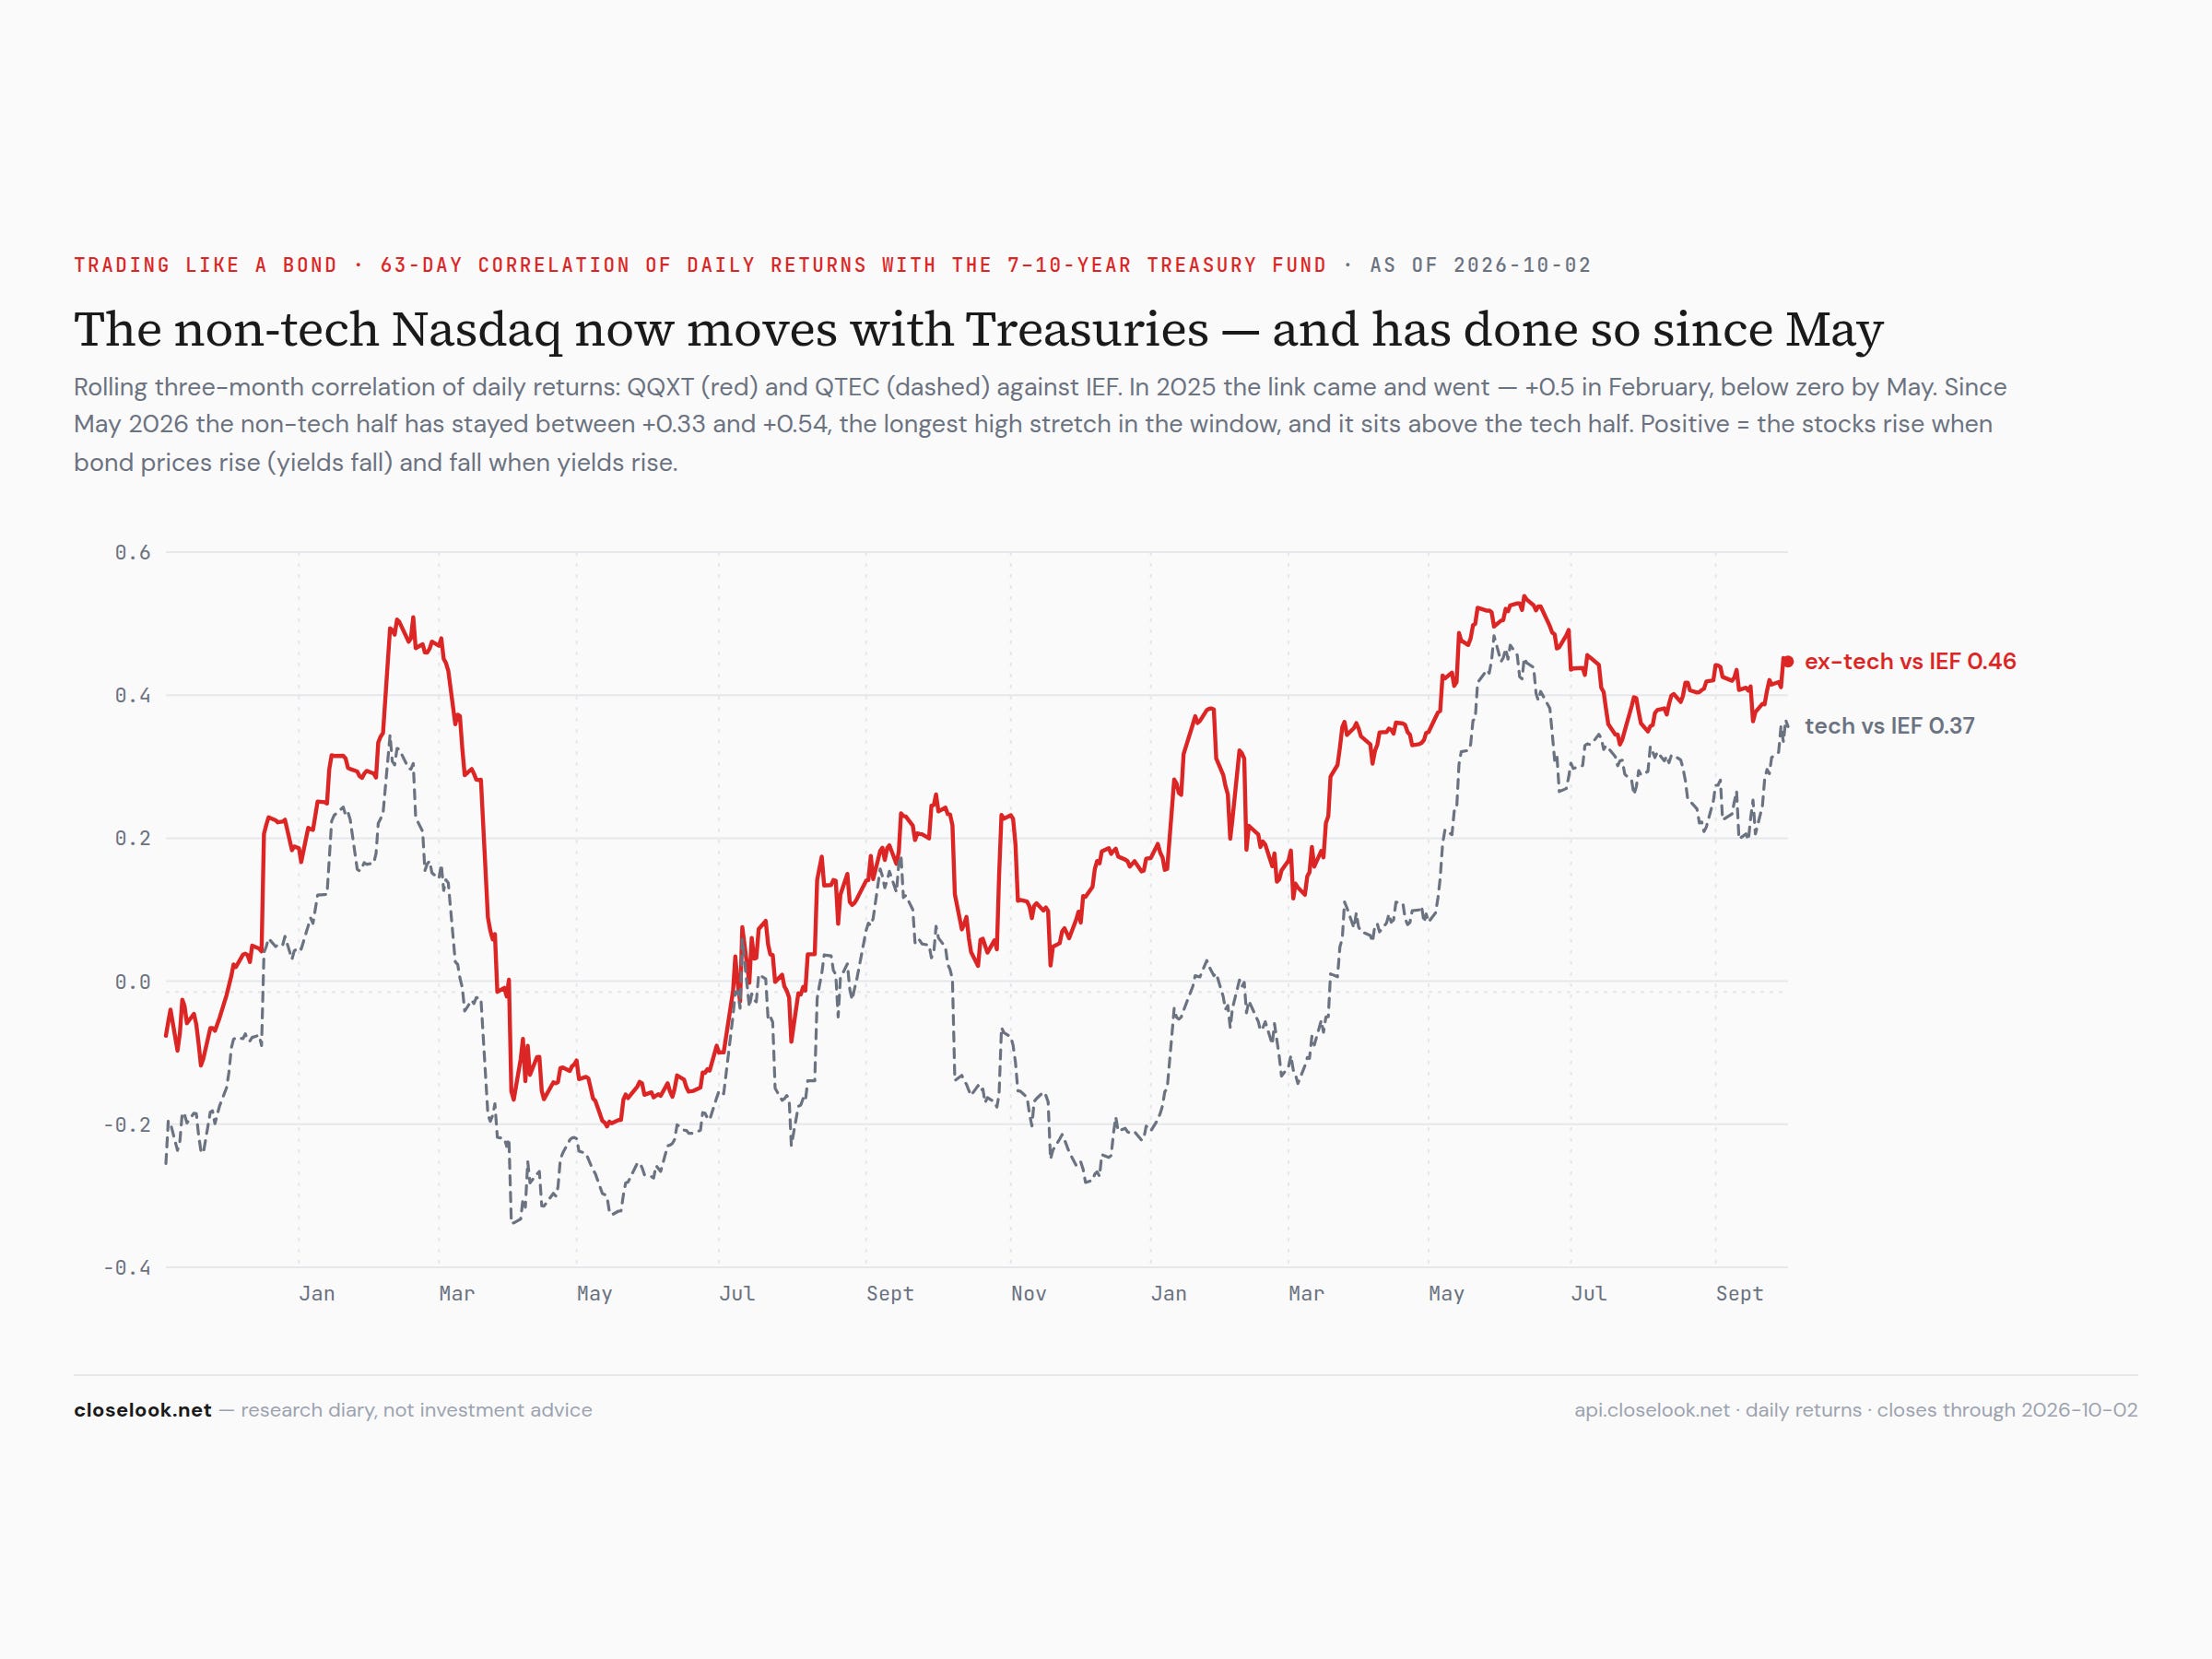
3 · Why: valuation compression
A growth stock is worth the profits it will earn, discounted back to today. When the discount rate rises, every future dollar is worth less now. A company can escape that only if its profits grow faster at the same time. The AI builders have done exactly that — their order books grew faster than the rate rose. The non-tech growth companies did not: their profits are growing, but steadily, not faster with the economy. So the rising rate went straight into a lower multiple. That is valuation compression.
An illustration, with round numbers. Take a company whose profits grow 5% a year, valued by investors who want the 10-year yield plus 5 points. With the 10-year at 4.0% the fair multiple is about 1 ÷ (9.0% − 5%) = 25 times earnings. With the 10-year at 5.25% it is 1 ÷ (10.25% − 5%) = 19 times — 24% less, with no change in the business. To keep its multiple at 25 the company would need its growth to rise to 6.25% just as fast as the rate rose. That is the arithmetic of the last seven months. (A textbook simplification, not a valuation of any company: it shows the direction and the size, not a price target.)
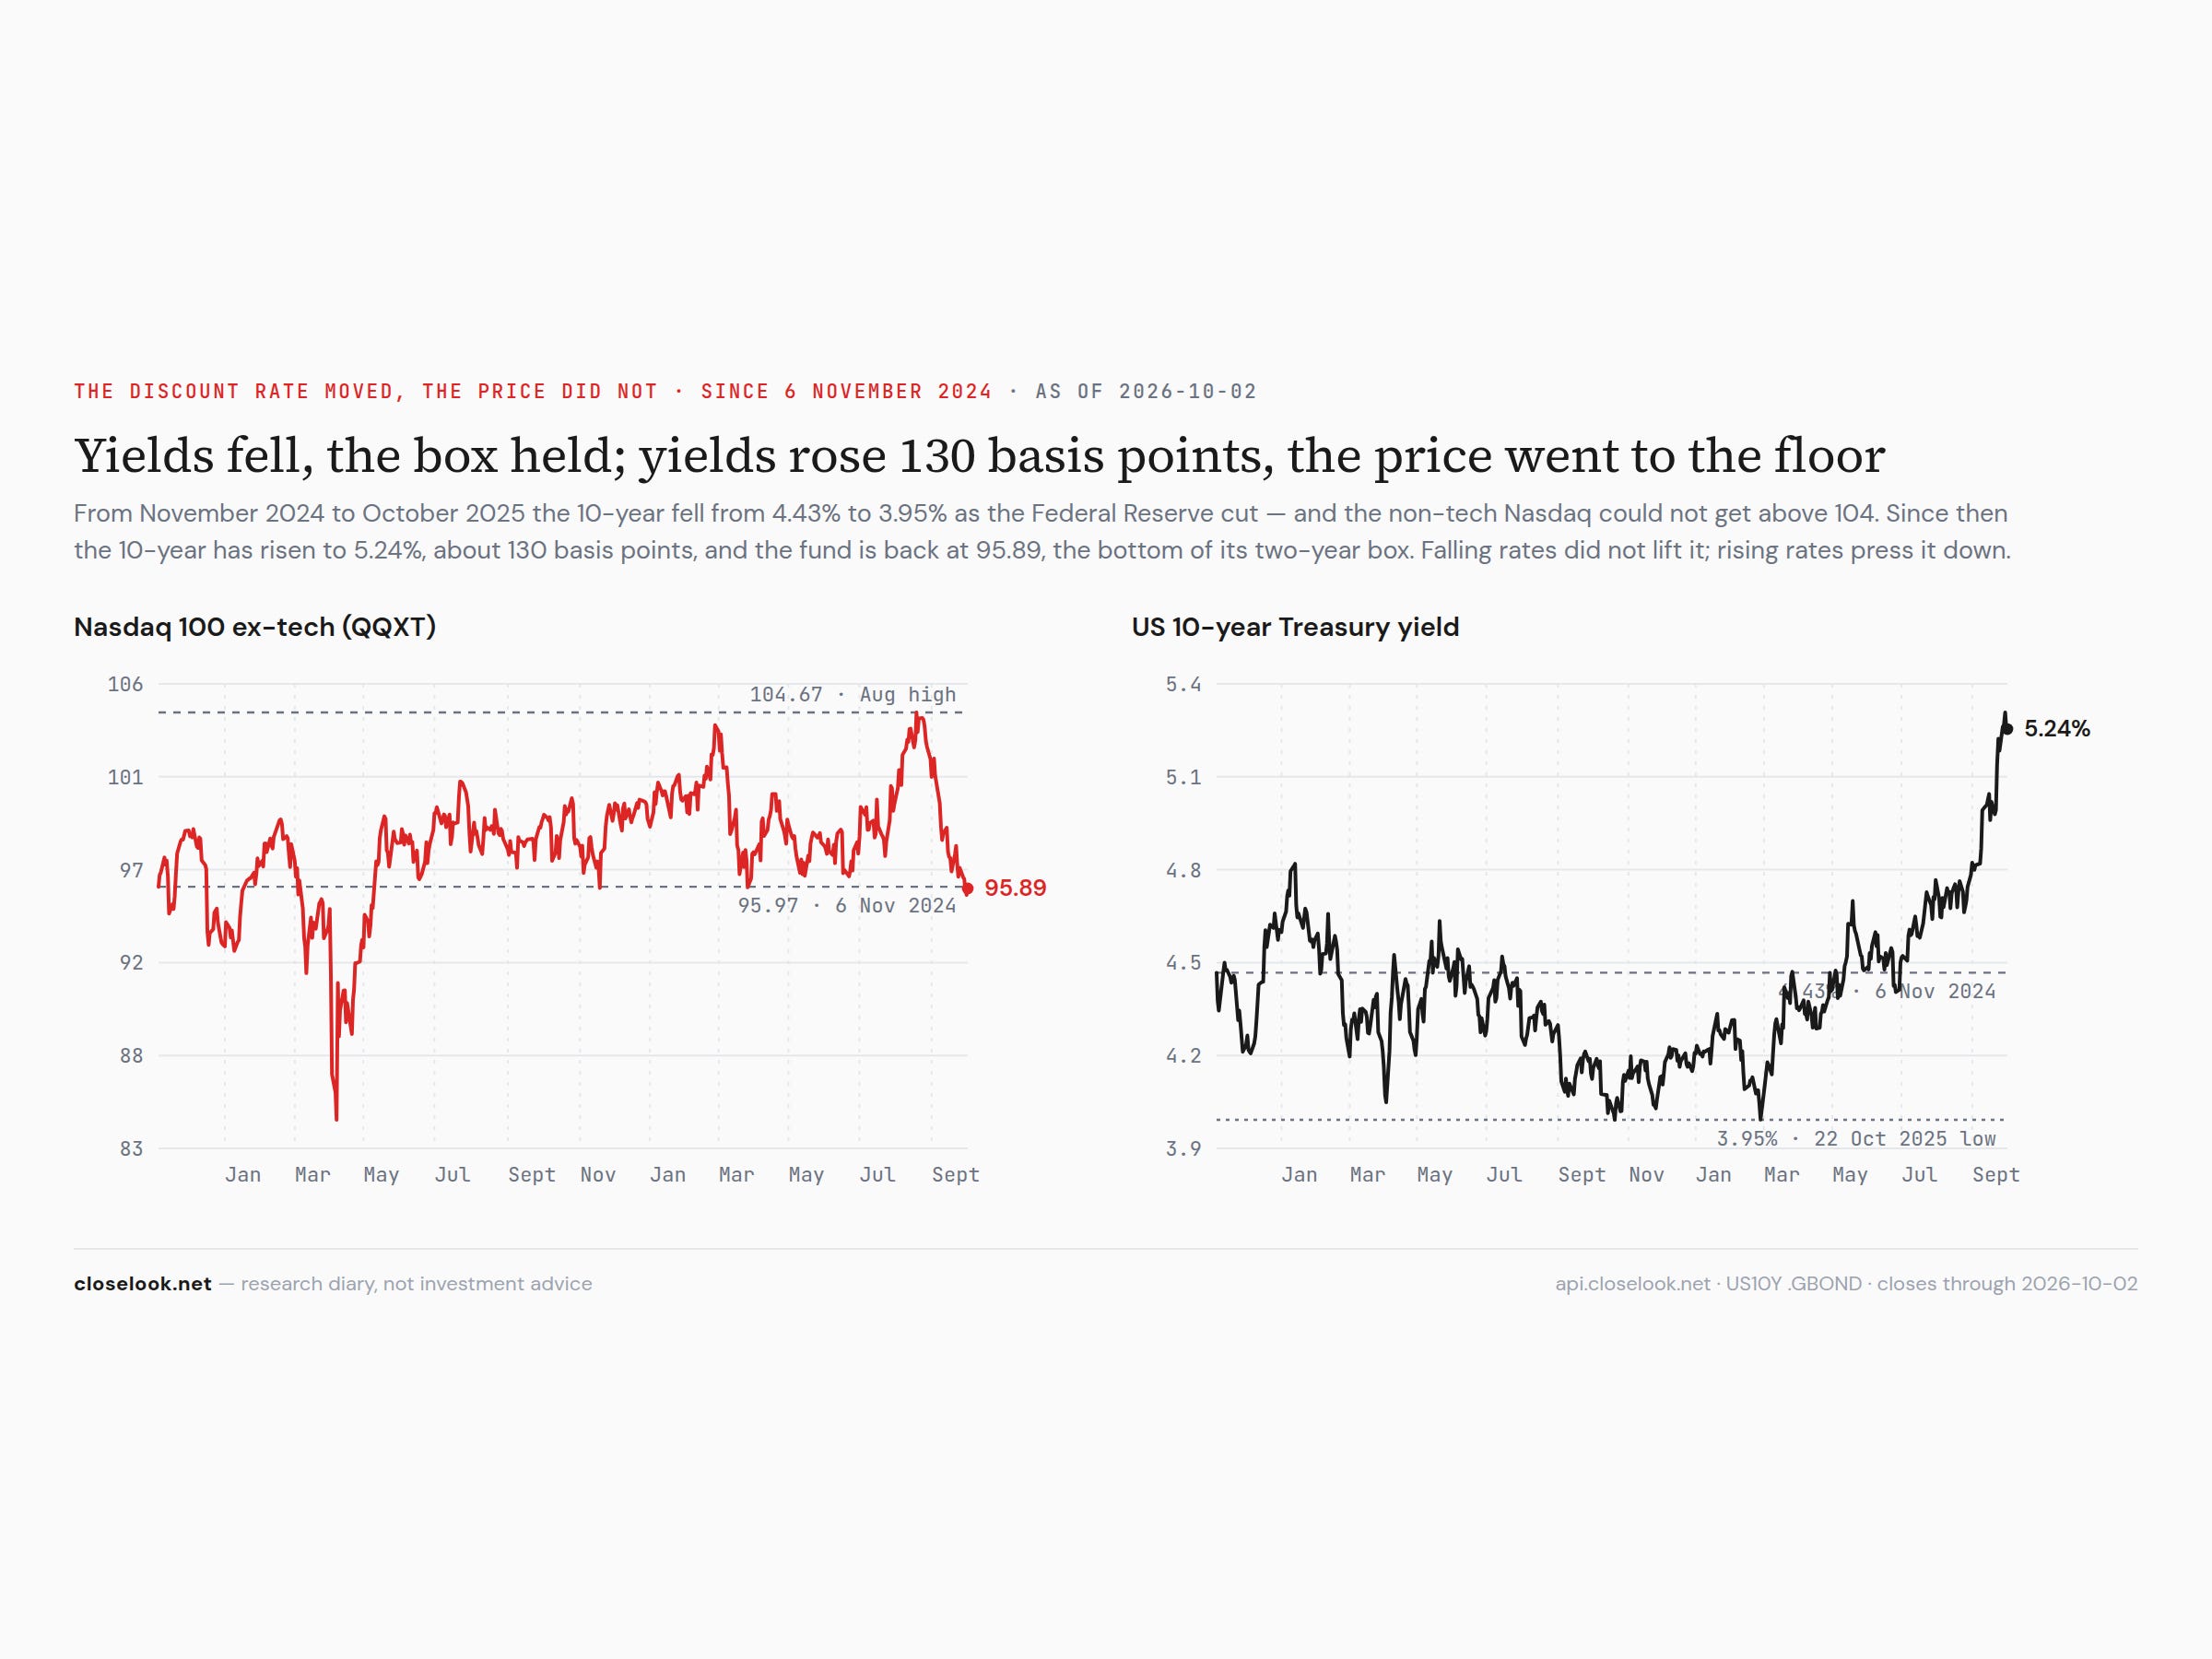
The timing fits. The 10-year yield made a double bottom — 3.95% on 22 October 2025 and 3.95% again on 27 February 2026. On that February day the non-tech Nasdaq closed at 104.03, the top of its box. Since then the 10-year has risen 129 basis points to 5.24% and the fund has fallen 7.8% to 95.89. When rates fell, the fund could not break out of the box; when they rose, it went to the floor.
4 · The Fed cut — the long end did not follow
The Federal Reserve cut its policy rate in the months after November 2024, and the short end of the curve came down with it. The long end did not: the 10-year is 80 basis points higher than in November 2024 and 129 higher than in February. The overnight rate is what the Fed sets; the 10-year is what the market sets, and the market has been asking more to lend for ten years to a government that borrows more every year. A growth stock is valued on the long rate. That is why two years of Fed easing did not lift the non-tech growth market — and why the Fed’s September hike was not the cause of its fall either. The bond market was.
5 · The chart, three ways
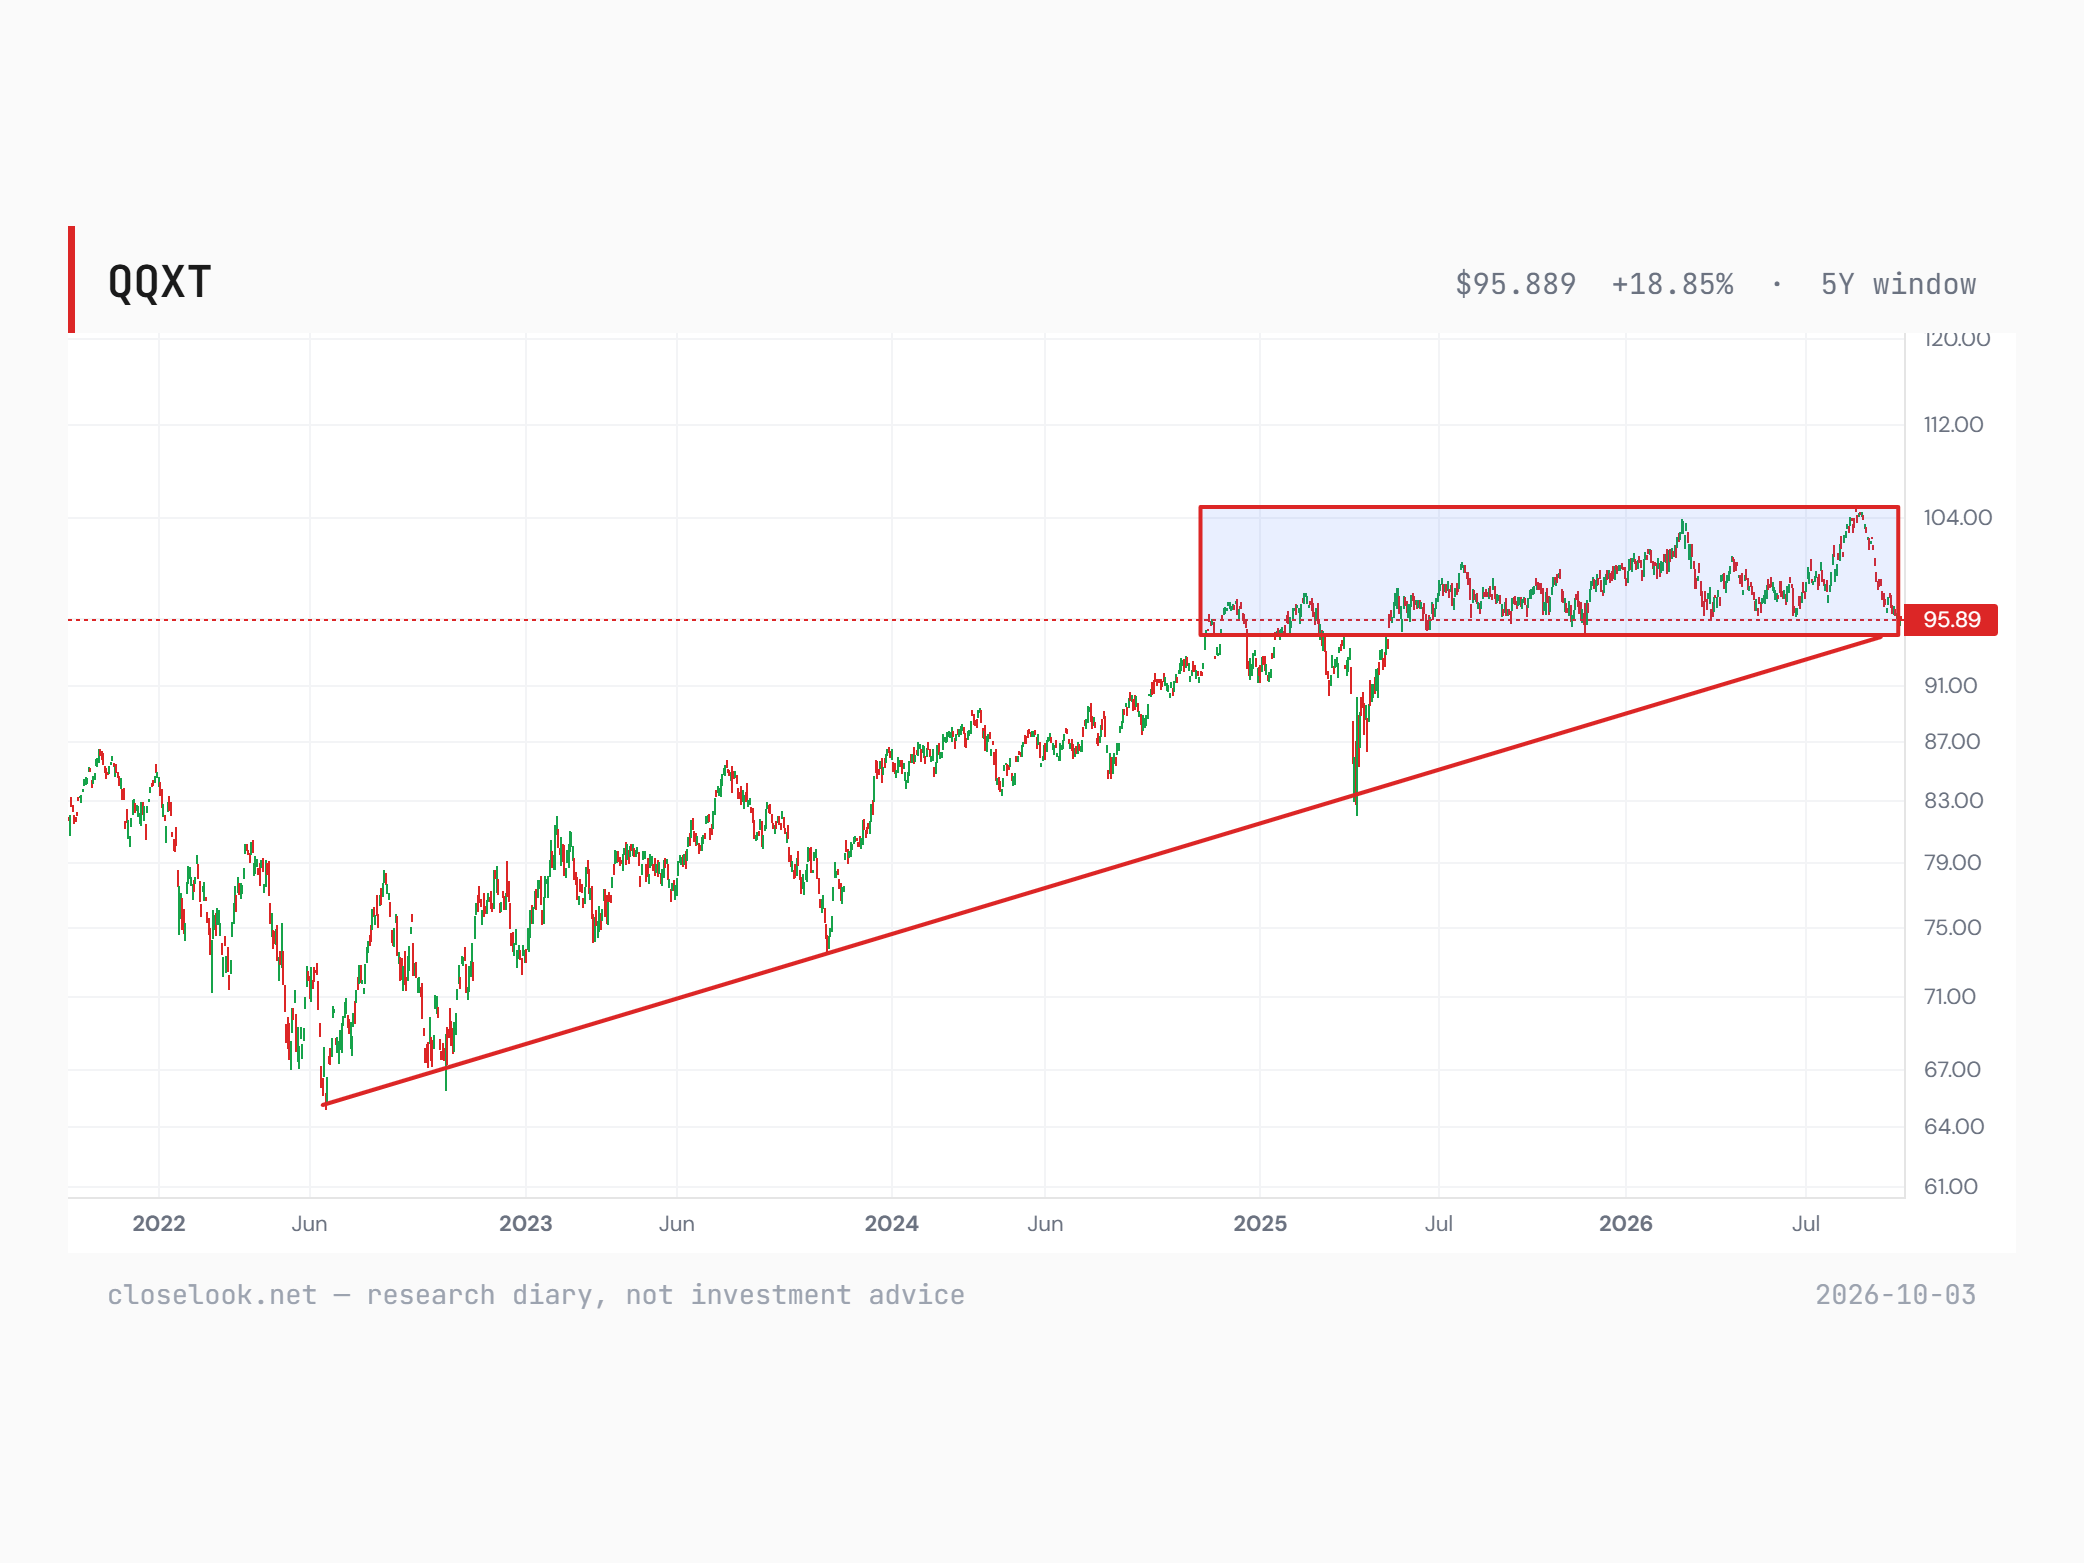
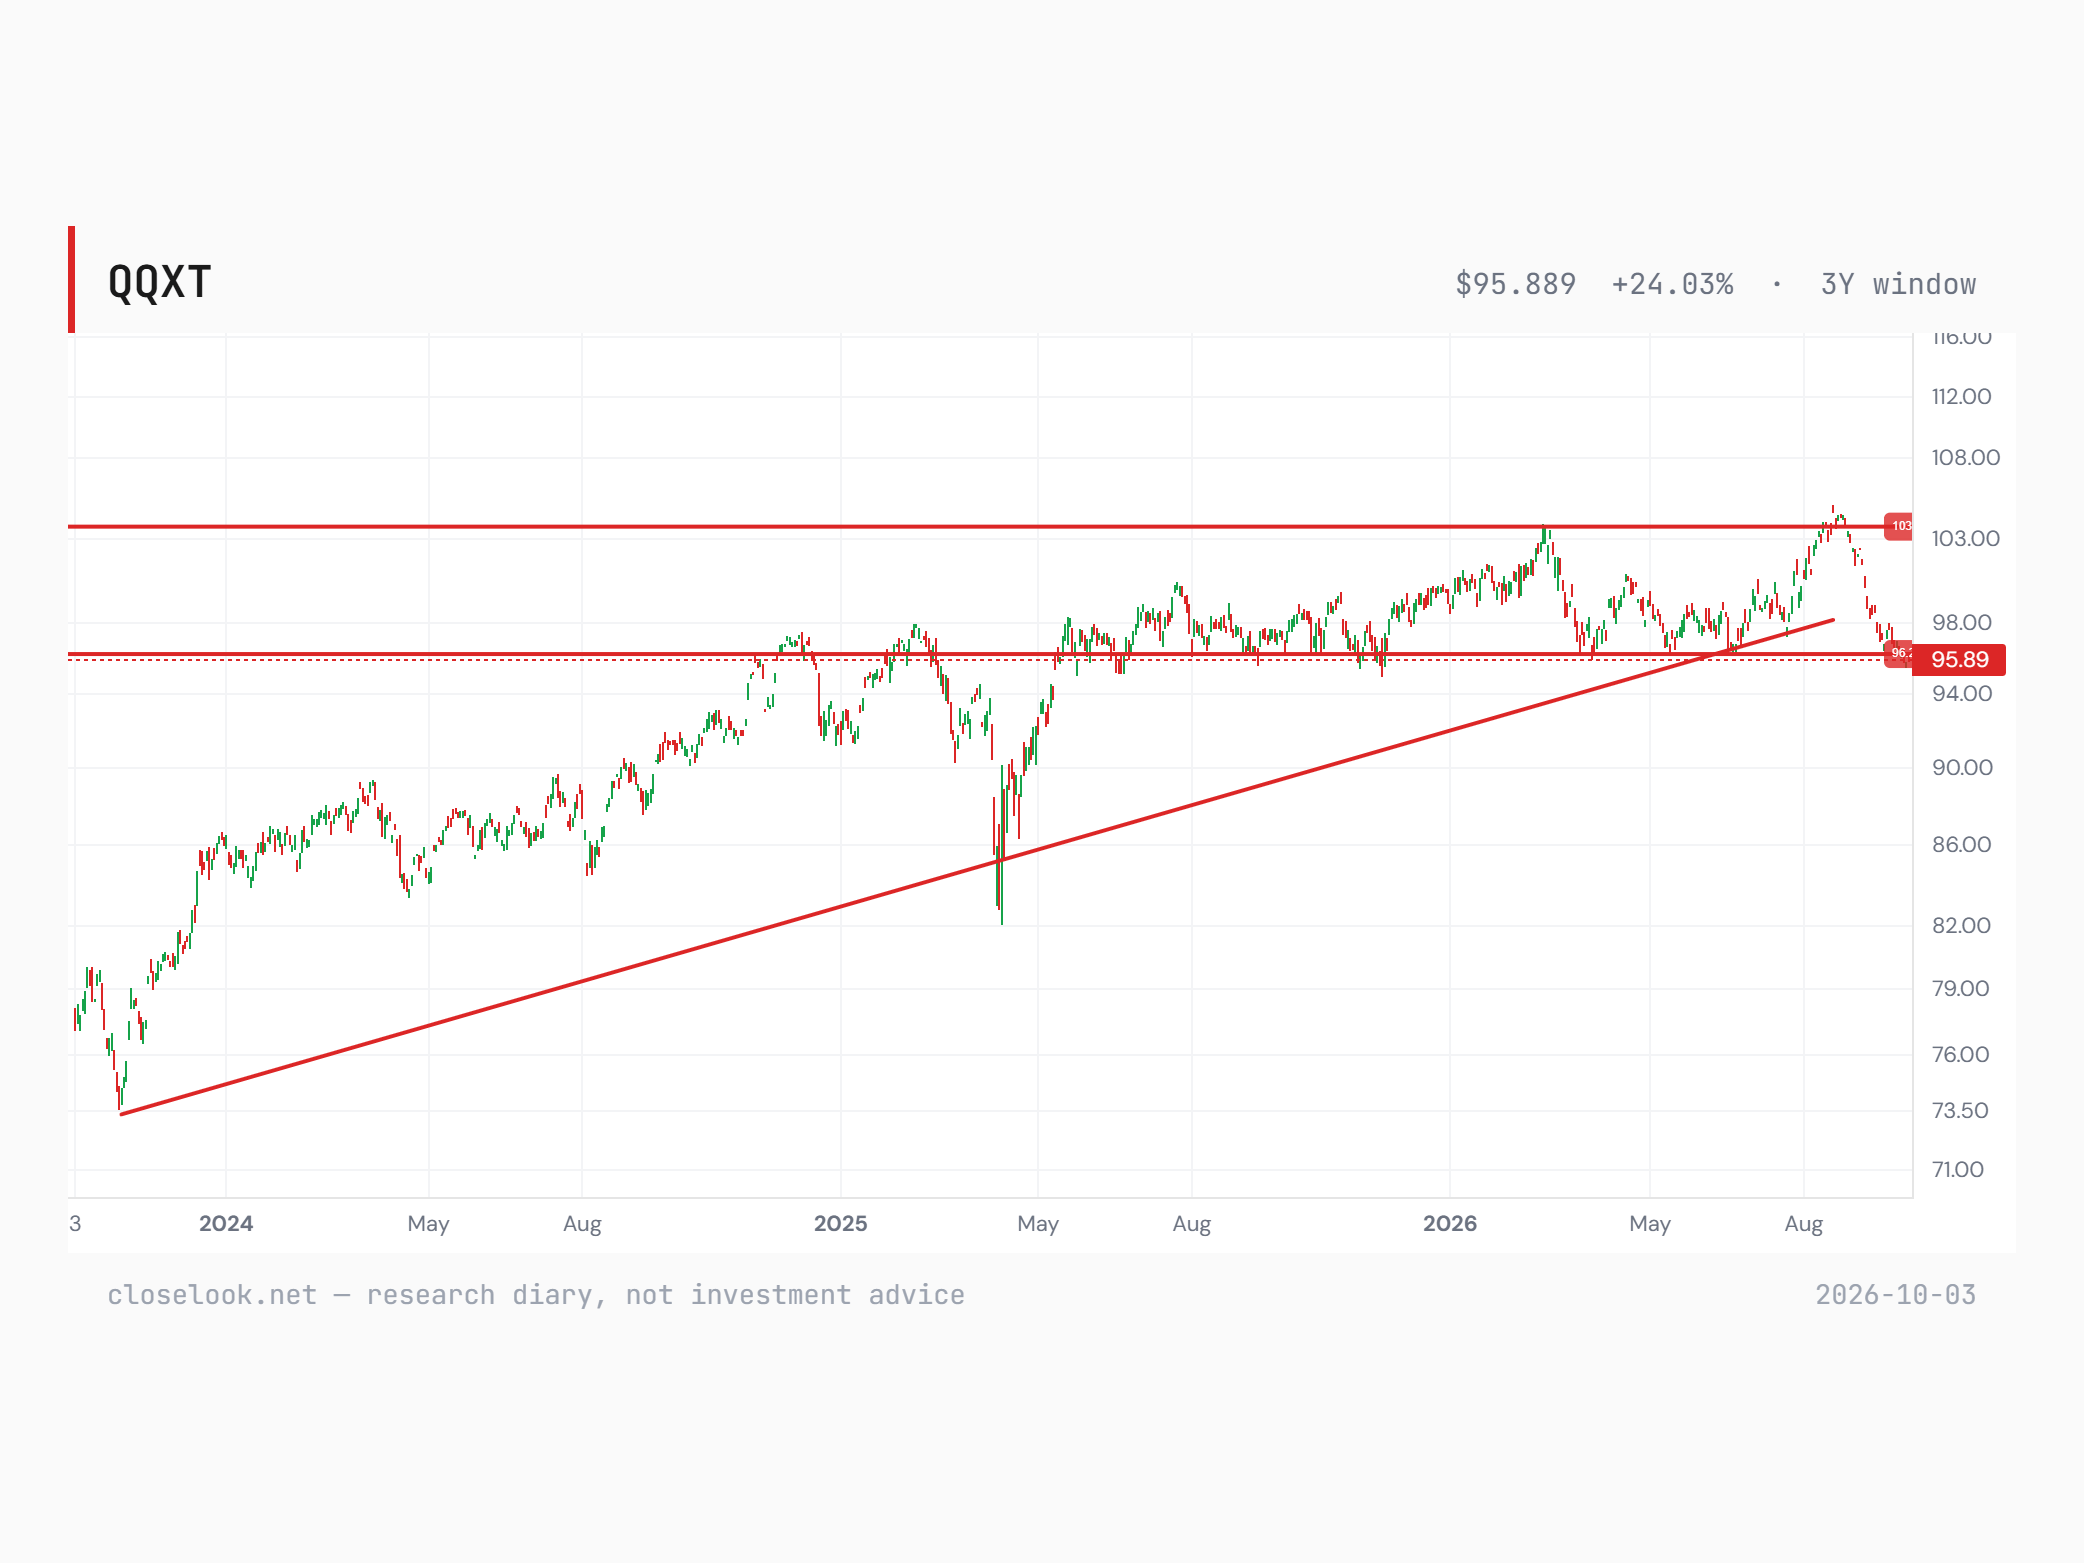
The editor’s rectangle: since the autumn of 2024 the fund has gone sideways in a box between about 95 and 104. The bull line drawn from the October 2023 low broke in September. The longer line drawn from the June 2022 low is still intact — the fund is sitting on it, just under the 96.2 shelf that had caught every pullback since mid-2025. Either way it is the last support of a three-year advance, and very critical.
6 · The levels
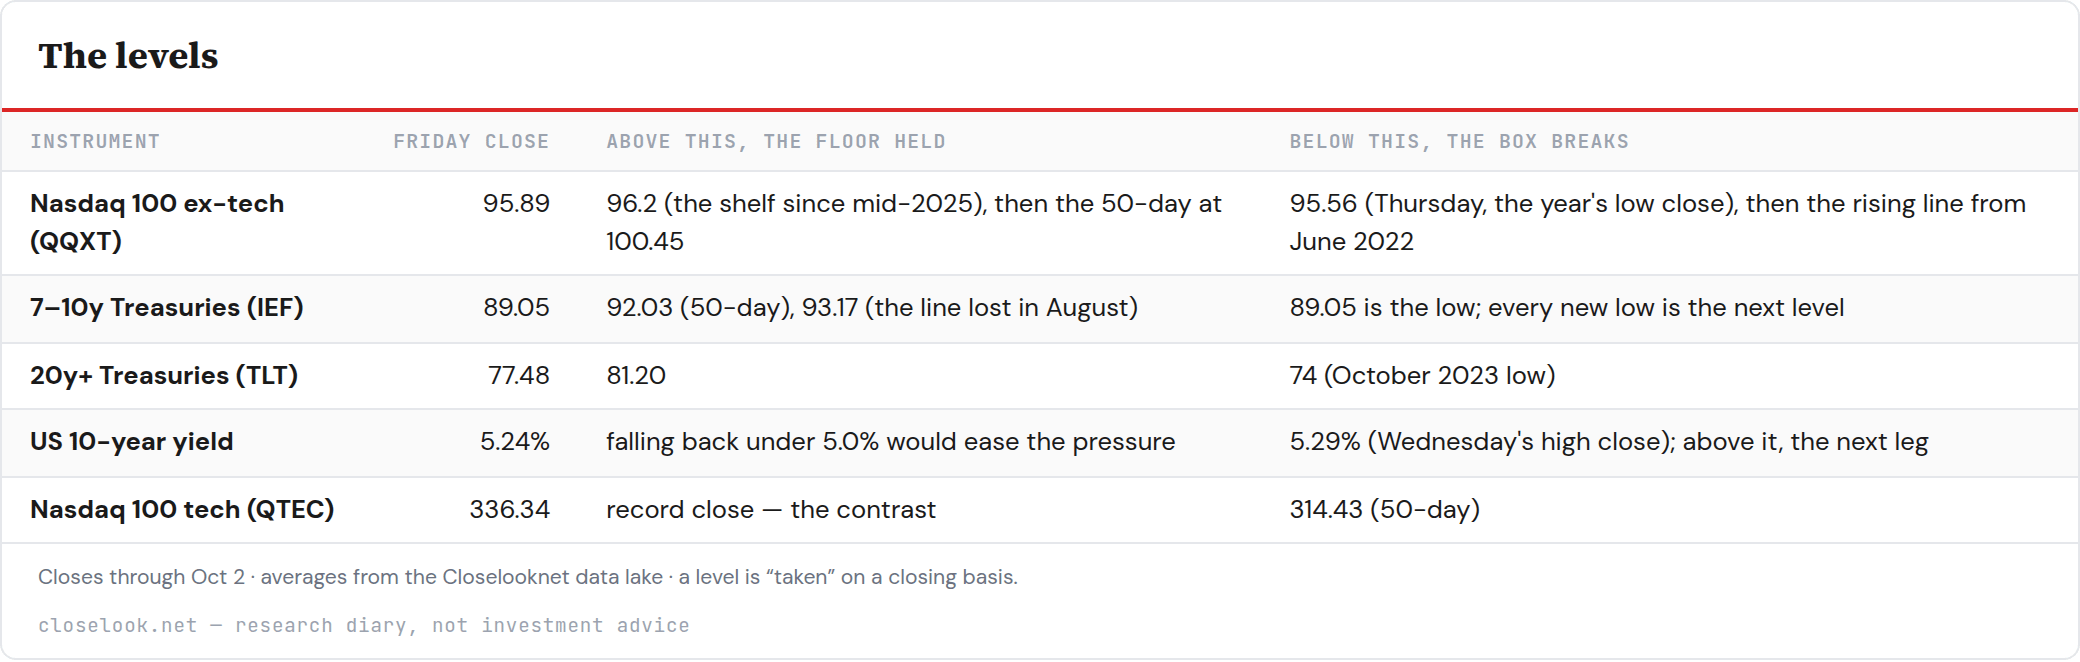
Table as text
Closes through Oct 2 · averages from the Closelooknet data lake · a level is “taken” on a closing basis.
7 · The questions ahead
The reporting season opens in mid-October. For the non-tech growth companies it is the first chance in months to show what this market needs from them: profits that accelerate, not just grow. The questions: does QQXT hold 95.56 and the 2022 line through the first reports; does the 10-year stop rising above 5.29%; does the correlation with bonds fall back — the sign that the market is grading these companies on their own numbers again rather than on the bond market; and does any part of non-tech growth break out of the box on earnings, the way the tech half did on orders.
Our read for the fourth quarter, stated so it can be scored: as long as the long rate stays above 5%, non-tech growth stays a bond-like trade with equity risk — the worst of both — and the money stays where the profits accelerate, in the AI build-out. A falling long rate would change that first, and fast: a market that is this correlated with bonds would rise with them. That is the one reason to watch it rather than ignore it.
8 · The count
The Nasdaq 100 fund closed the week at 749.58, a record and above the 746.16 confirmation line on a weekly close for the first time; the house count reads the first close above the top of wave 1. The S&P 500 fund closed at 769.64, 1.1% under its August high. The bond market withheld its countersignature for an eleventh week: the long Treasury fund made a new low every day, 77.48 on Friday. The dollar fund made its highest close of the year on Thursday.
One sentence to close, because a diary should say what it actually thinks. The non-tech growth market has spent two years going sideways while the AI half of the same index rose 72%, and this year it has started to trade like a bond — so it now carries the bond market’s risk on top of its own, without the growth that would pay for it; until its profits accelerate or the long rate falls, it is the part of the market this diary leaves alone. Probability, not prophecy. We monitor, and we score it next Sunday.
Related on Closelooknet: QQXT on the terminal · Cointegration Monitor · Sovereign Pressure · HALO Growth 100 · Sunday’s US letter · Hypergrowth letter · Daily Pulse