


Underneath, growth without AI exposure made new highs — the Nasdaq ex-tech at a three-year high, health care the best sector, gold, bitcoin and copper back — against a weaker dollar. Nvidia and Warsh arrive next week.
Edition of 2026-08-23 · from the C+ archive
1 · This Week’s Action
The tape, day by day. The week had five different sessions and one direction. Monday the semis reclaimed their 50-day lines at midday and the S&P slipped 0.47% anyway. Tuesday the dollar-yen wire broke overnight and the semis were rejected at the overhead line — SOXX −4.96%, QQQ −1.69% — the sharpest session of the week. Wednesday the Treasury doubled its long-end buybacks, the minutes leaned hawkish, Seoul had its sidecar night, and the index closed up 0.21%. Thursday the buyback relief reversed inside a session and Walmart was sold nine percent on a double beat: S&P −0.84%, VIX 16.01. Friday the chart pick rose thirteen percent, the CAC snapped seven red sessions, and IEF failed its weekly reclaim a second time: S&P +0.41%.

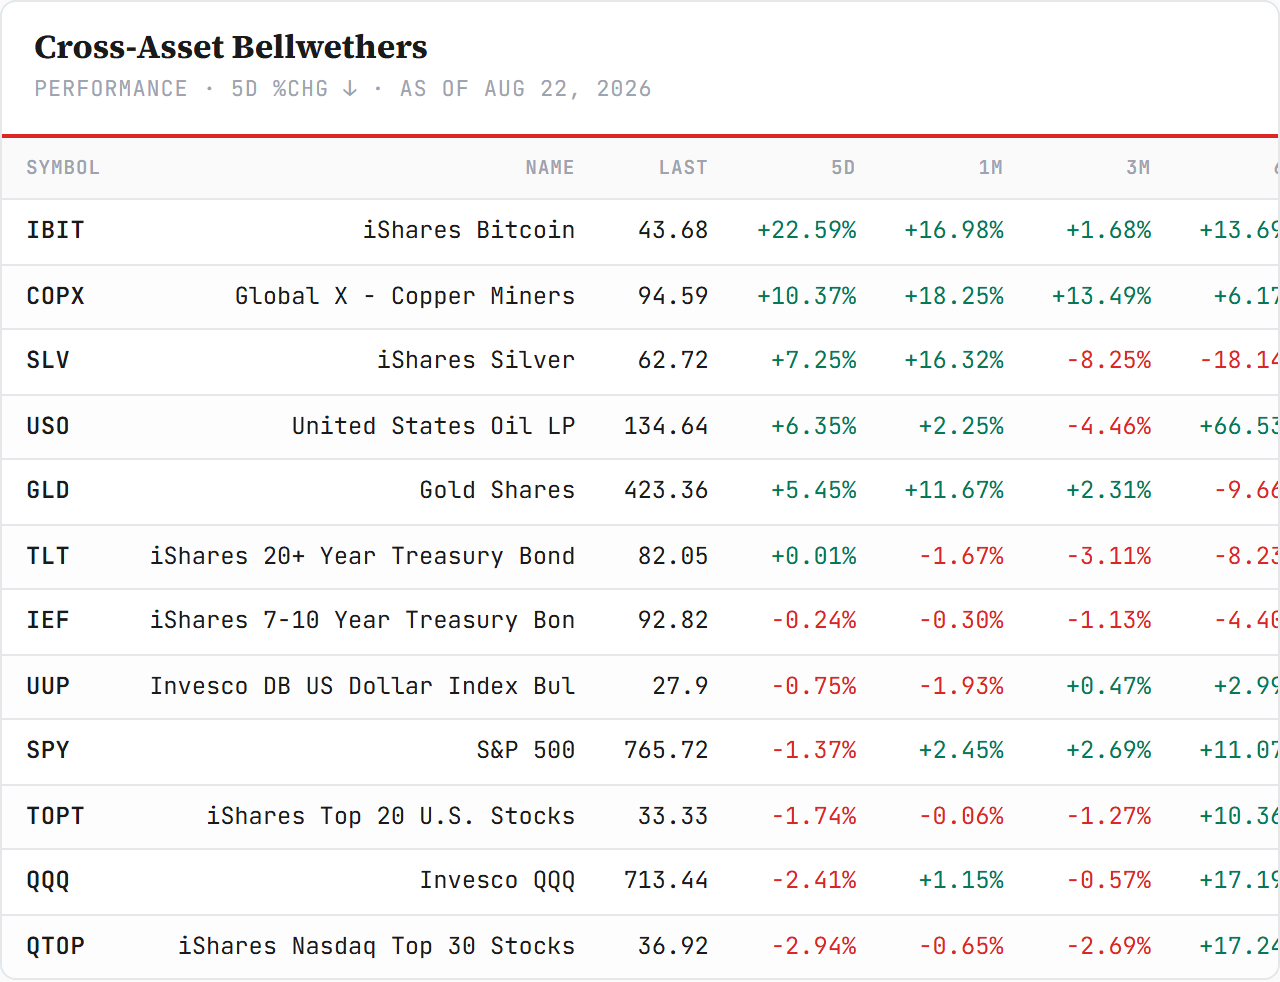
Five sessions, and the S&P lost 1.37% to 765.72, the Nasdaq 100 2.41% to 713.44 — its 50-day average to the cent — the equal-weight S&P only 0.49%. The VIX rose 6% on the week and still closed at 15.13. Everything that happened this week happened underneath the index again; this time it was mostly down.
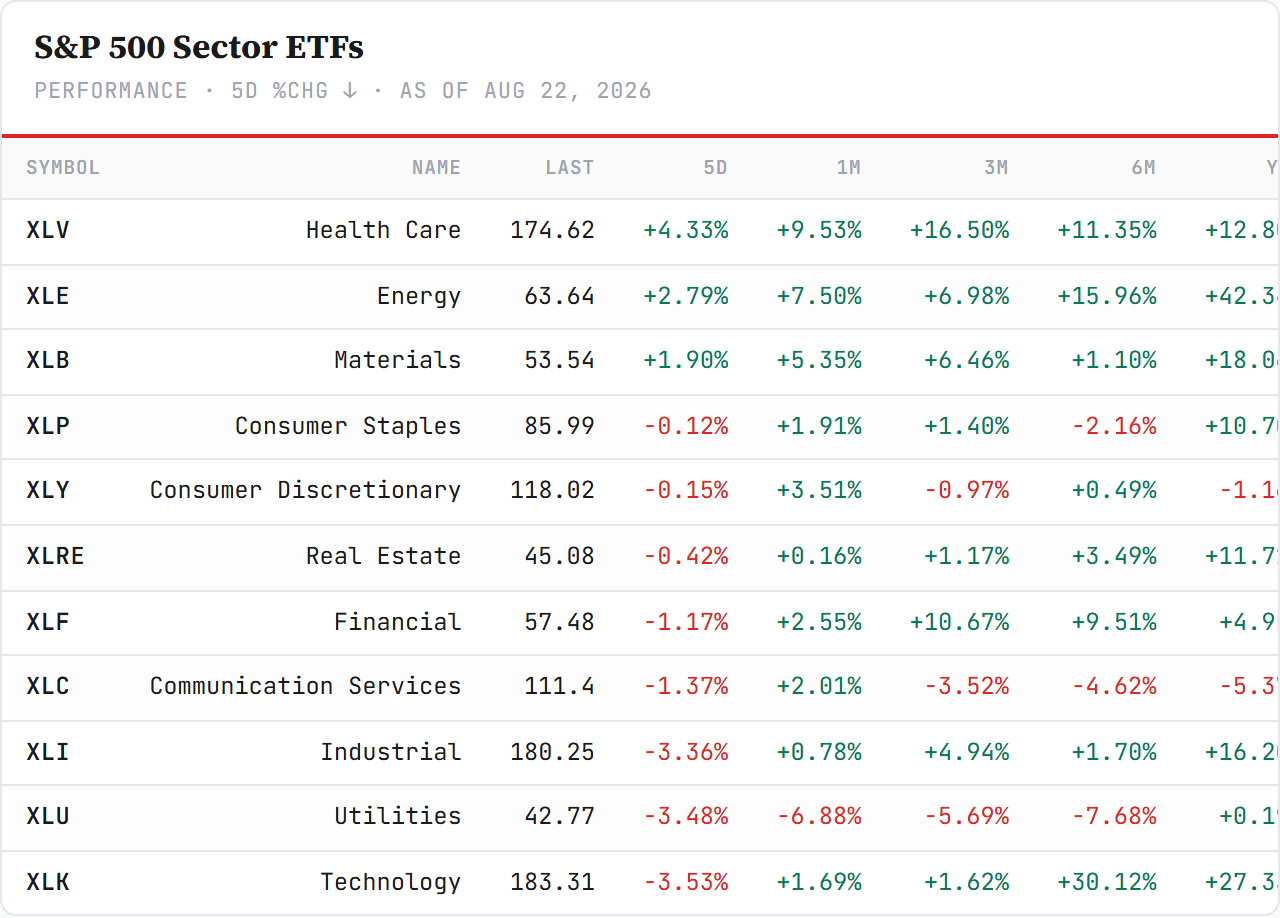
The sector read — three green, and the three are a sentence. Health care +4.33%, energy +2.79%, materials +1.90% — the only green lines of eleven, and the same three the global sector board produced. The bottom three are the buildout pair and its neighbour: technology −3.53%, utilities −3.48%, industrials −3.36%. Chips and the power to run them fell together, while the sector that sells medicine led by a point and a half. Last week the sentence was “a capex board with a geopolitical spike inside it”. This week it is a board with the capex taken out and the non-tech growth put in.
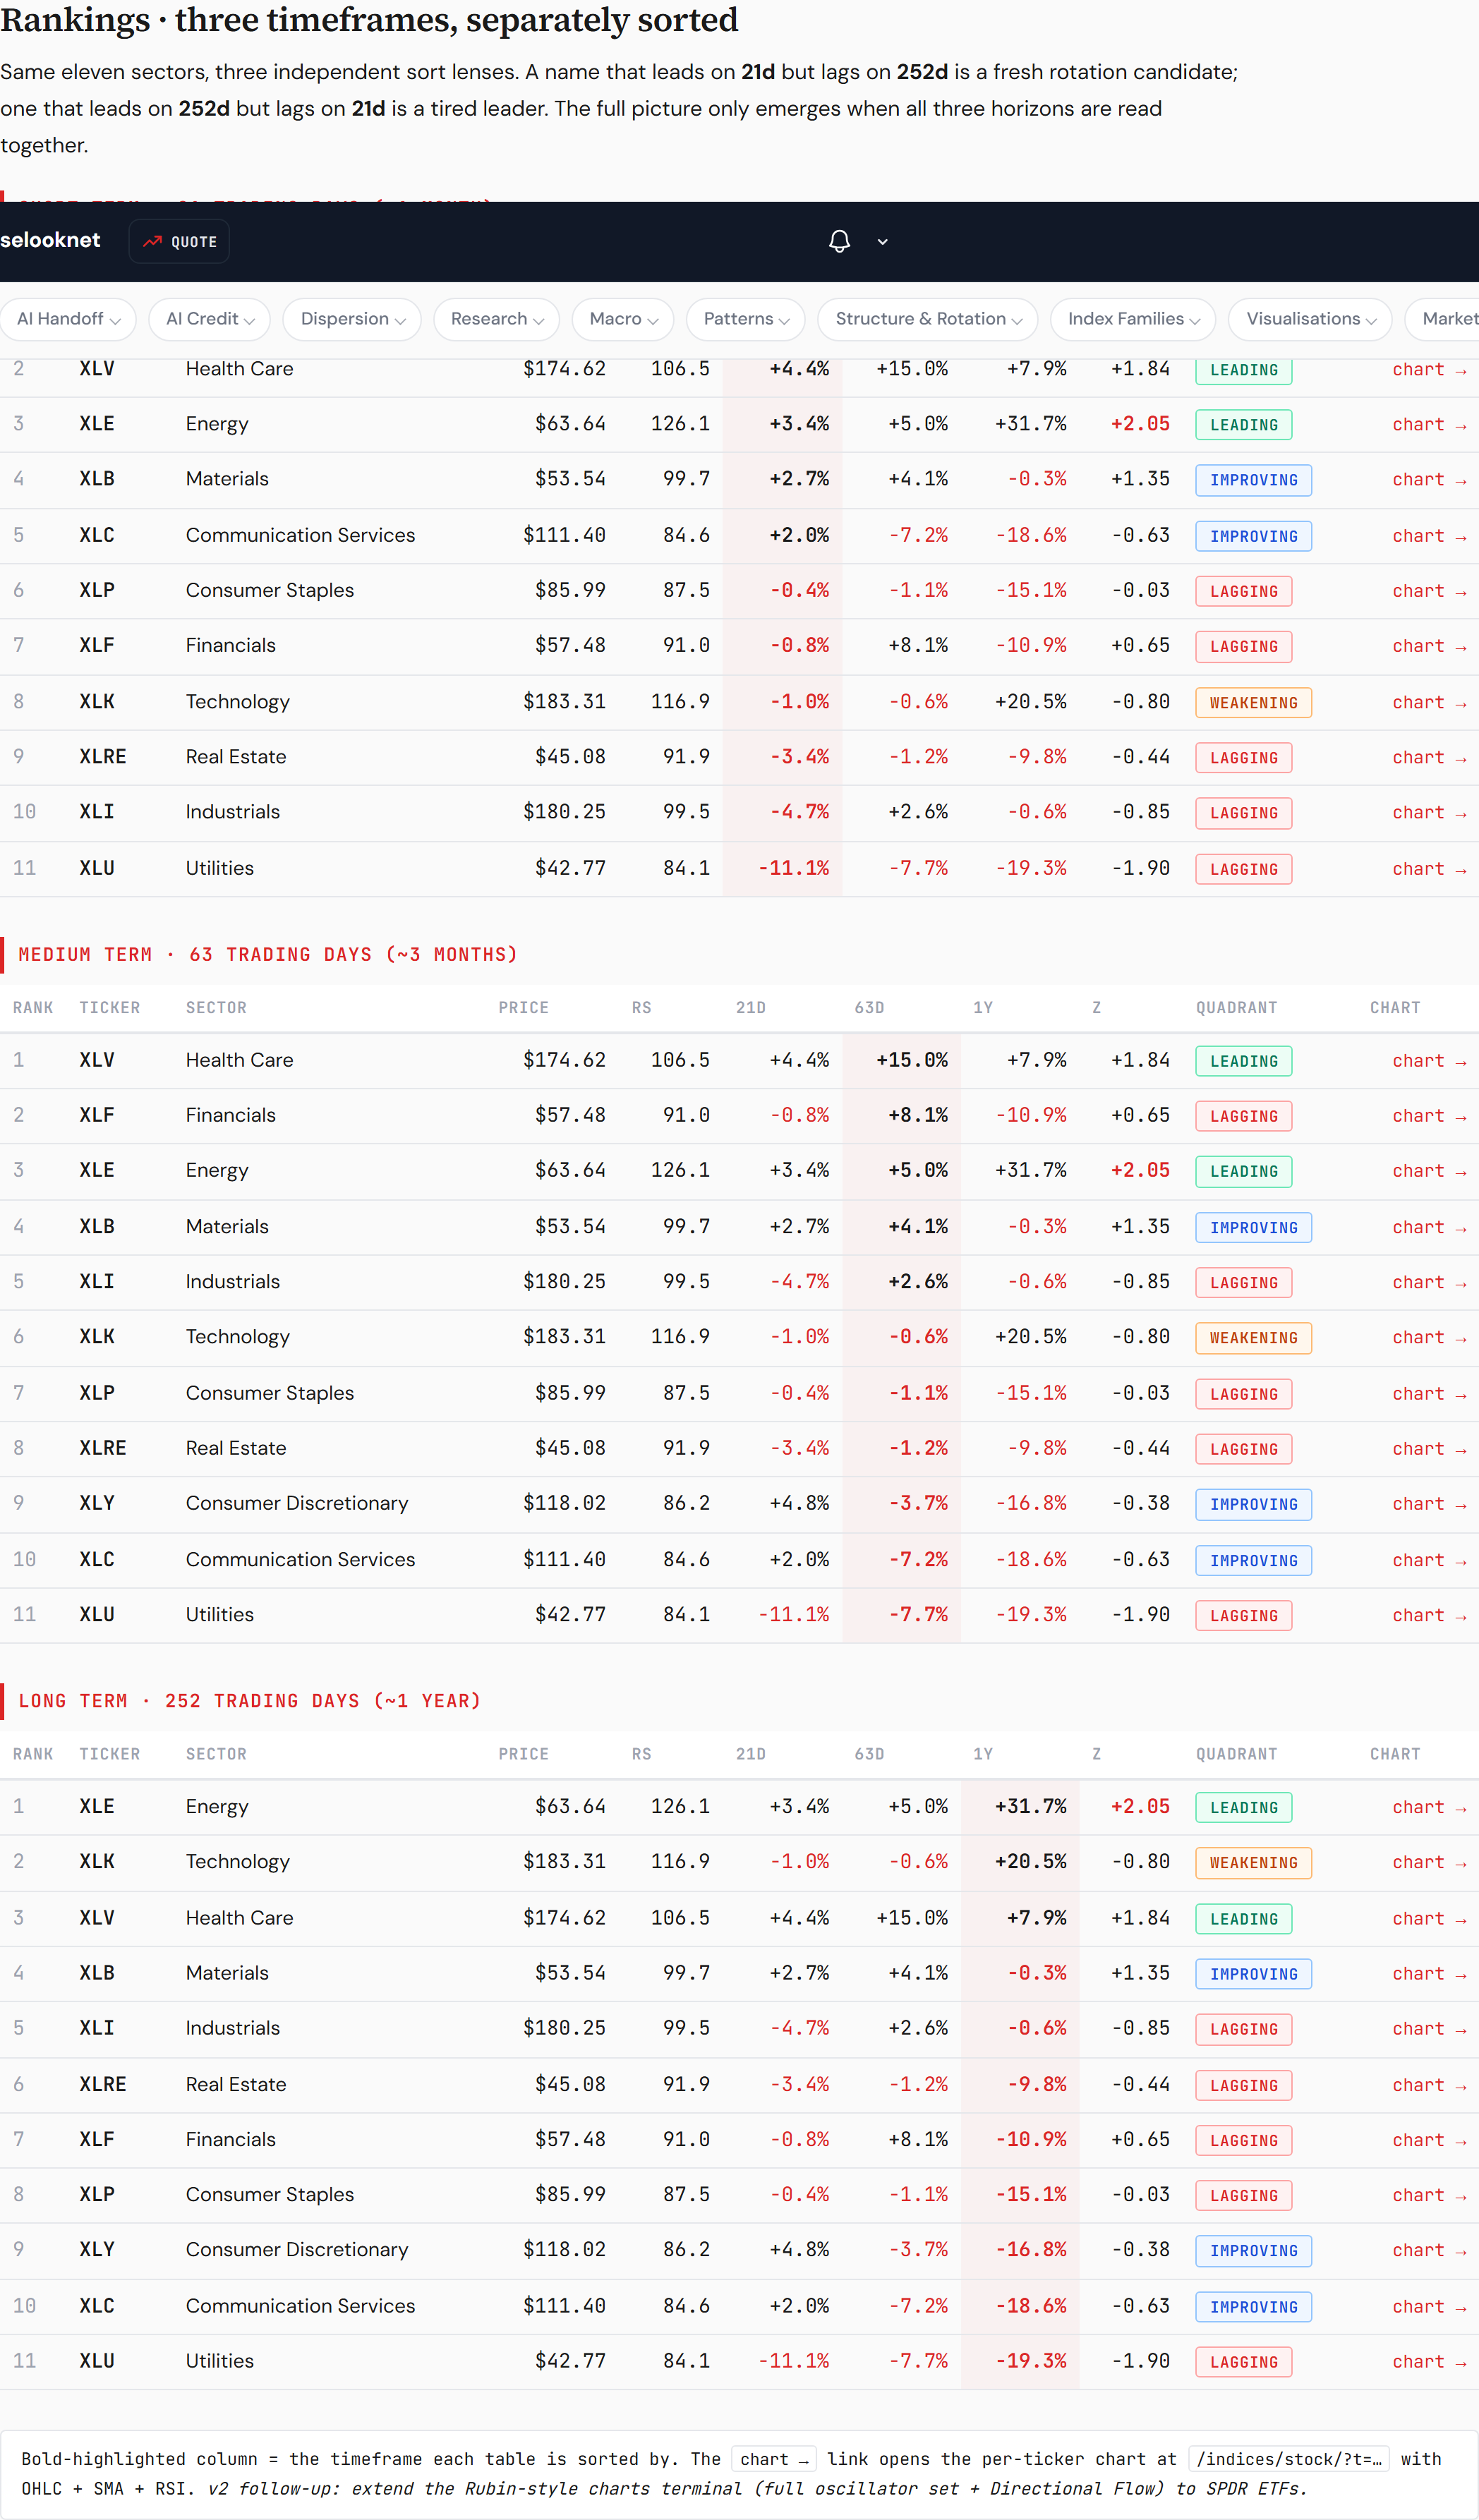
The sector rankings — relative strength, three lenses. Our sector-RS board ranks the eleven against the S&P on three horizons and tags each a quadrant. Health care is Leading on all three reads — RS 106.5, +4.4% against the index over 21 days, +15.0% over 63, z-score +1.84. Energy is Leading (RS 126.1, z +2.05); materials Improving (+2.7% / +4.1%, z +1.35); financials second on the 63-day lens (+8.1%) though still lagging on the month. And technology is tagged Weakening: RS 116.9, the second-strongest one-year line on the board, but −1.0% over 21 days, −0.6% over 63, z −0.80 — a leader on the year that lags on every shorter horizon, which is the board’s own definition of a tired leader. Utilities is last on every lens (−11.1% over 21 days). The four sectors this letter is watching — tech, health care, materials, financials — sit at ranks eight, two, four and seven on the month, and at six, one, four and two on the quarter.
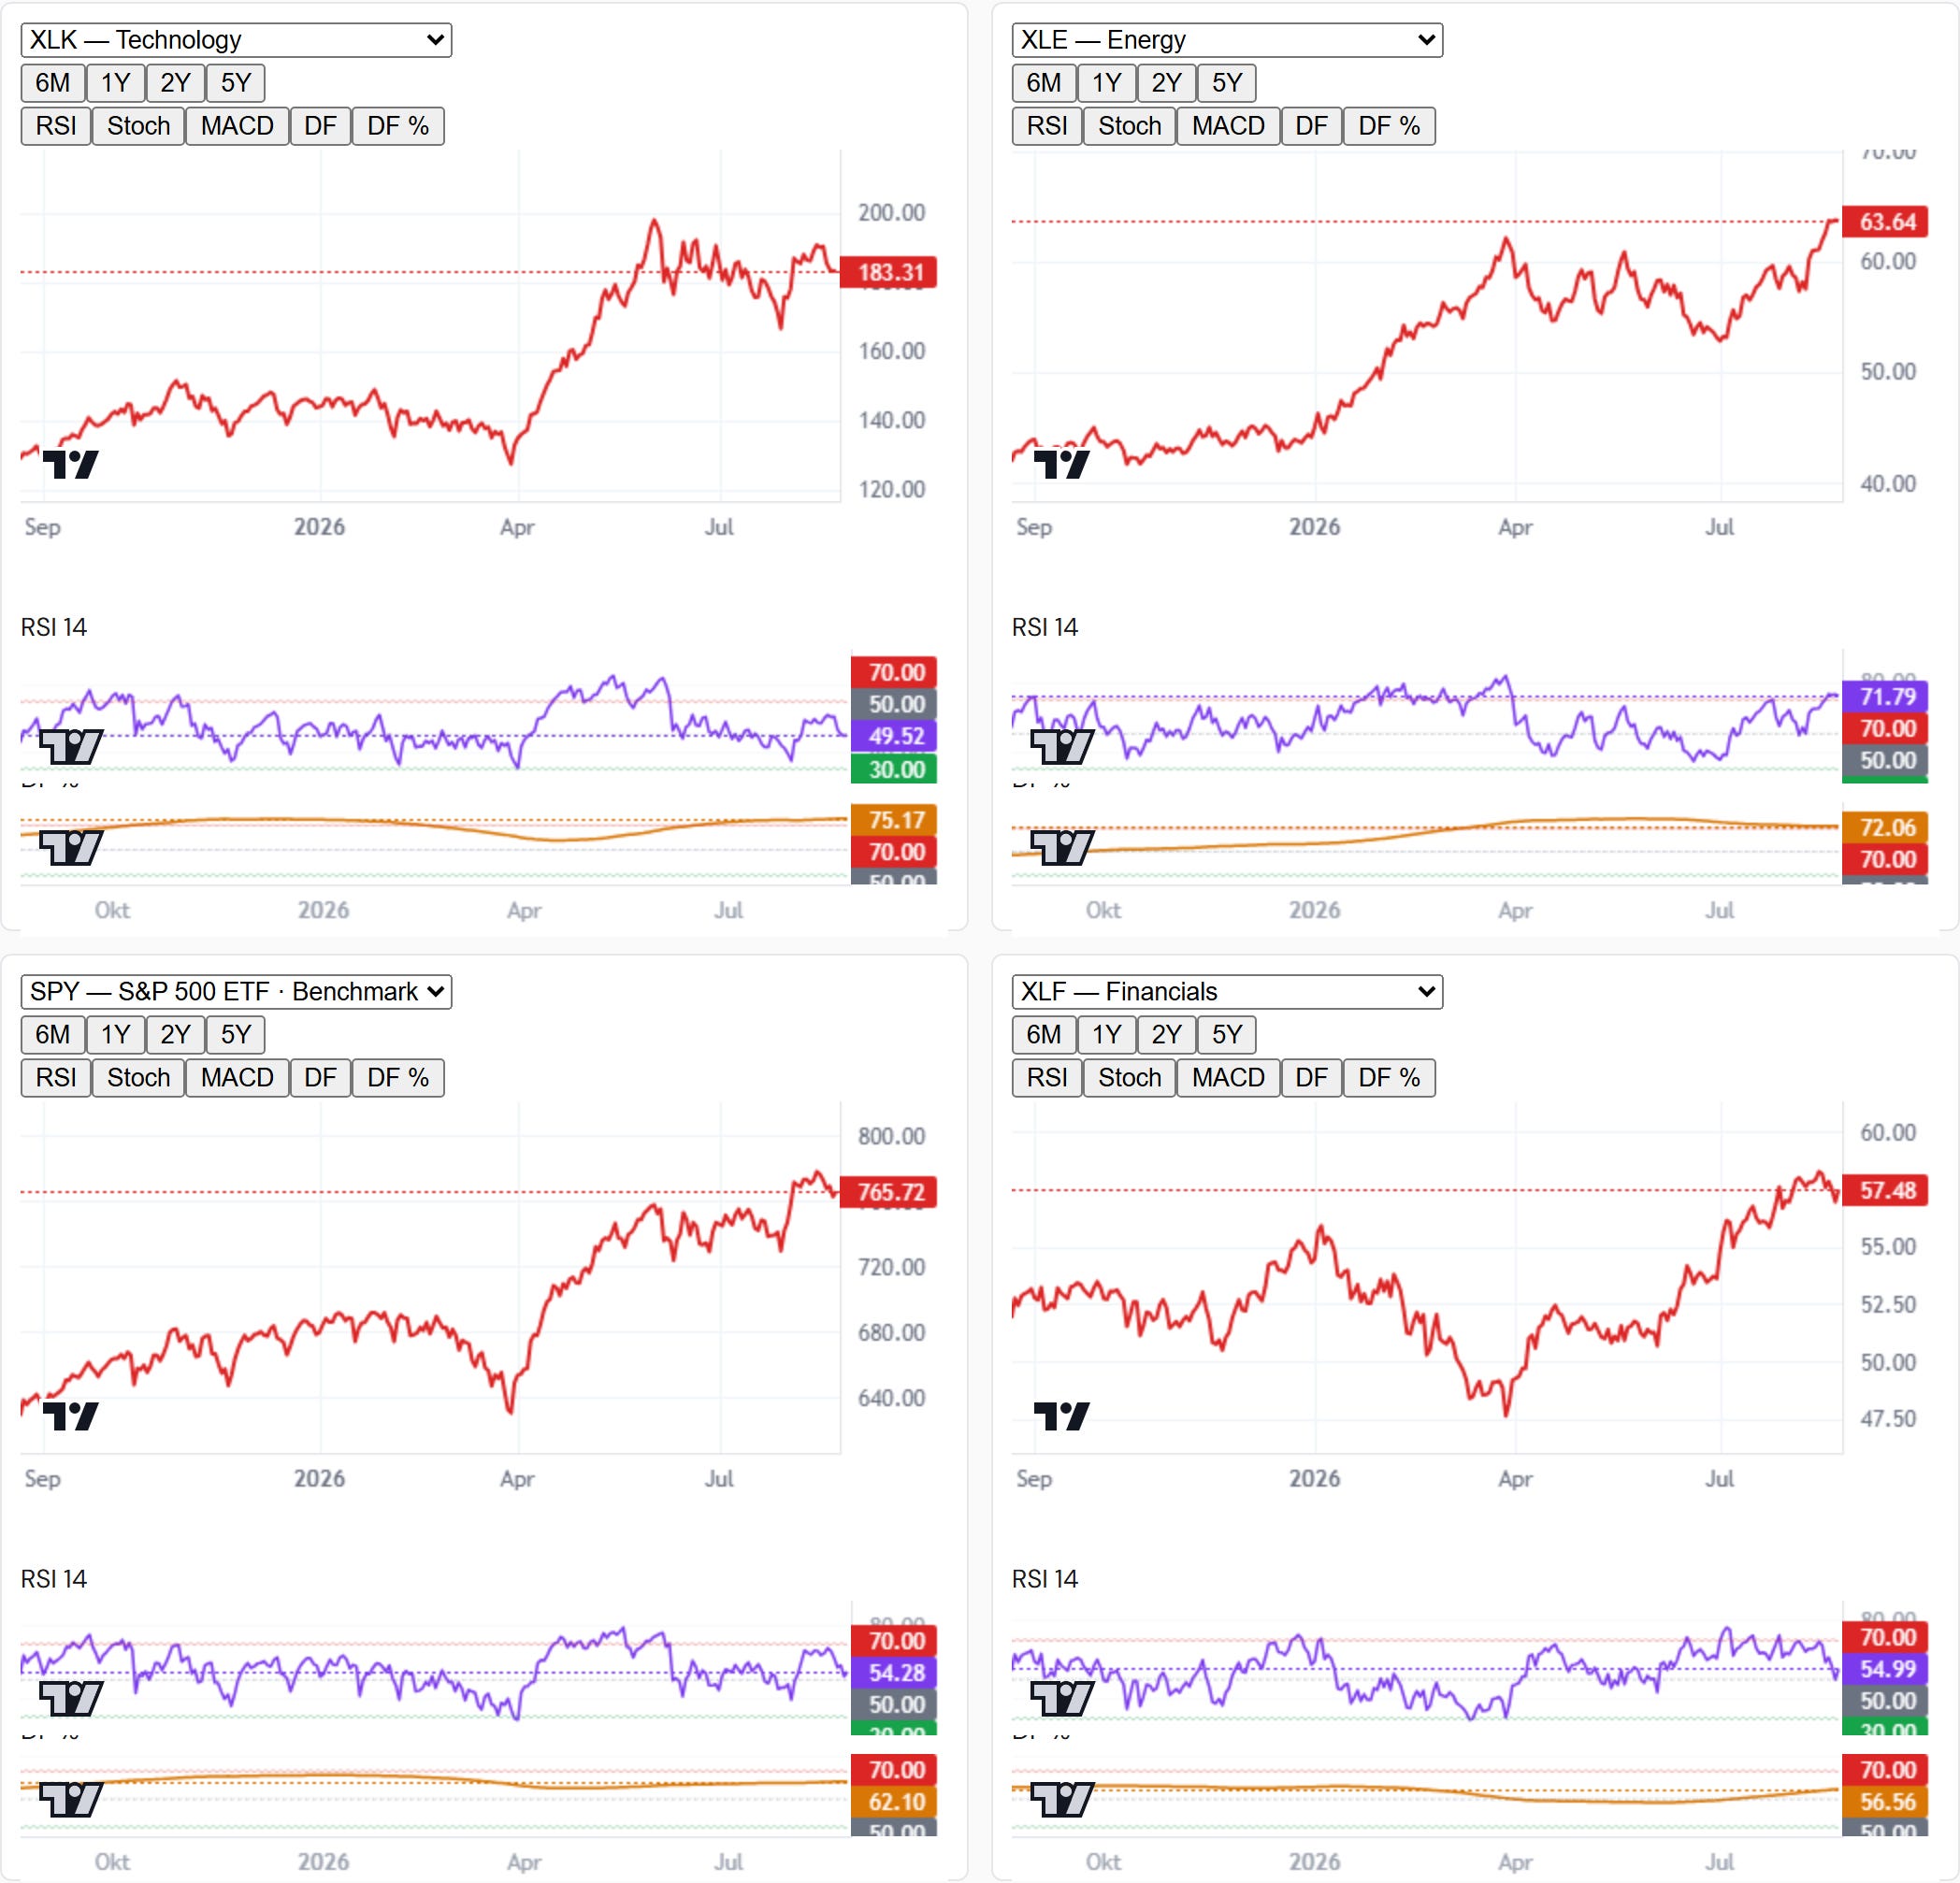
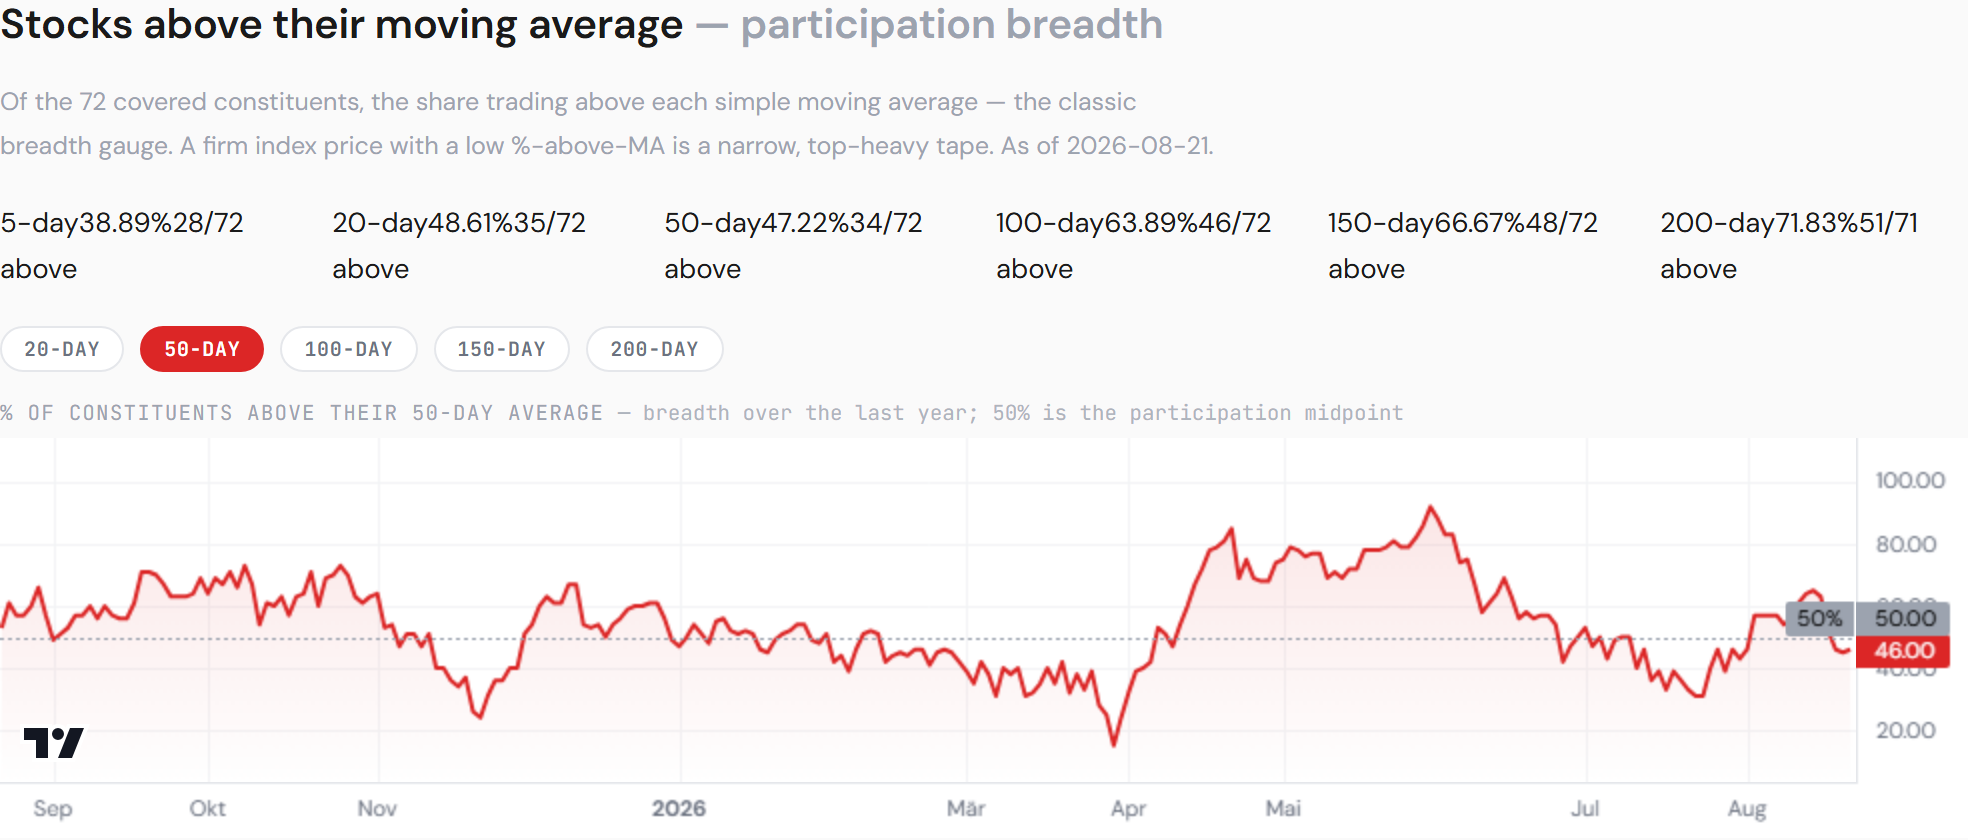
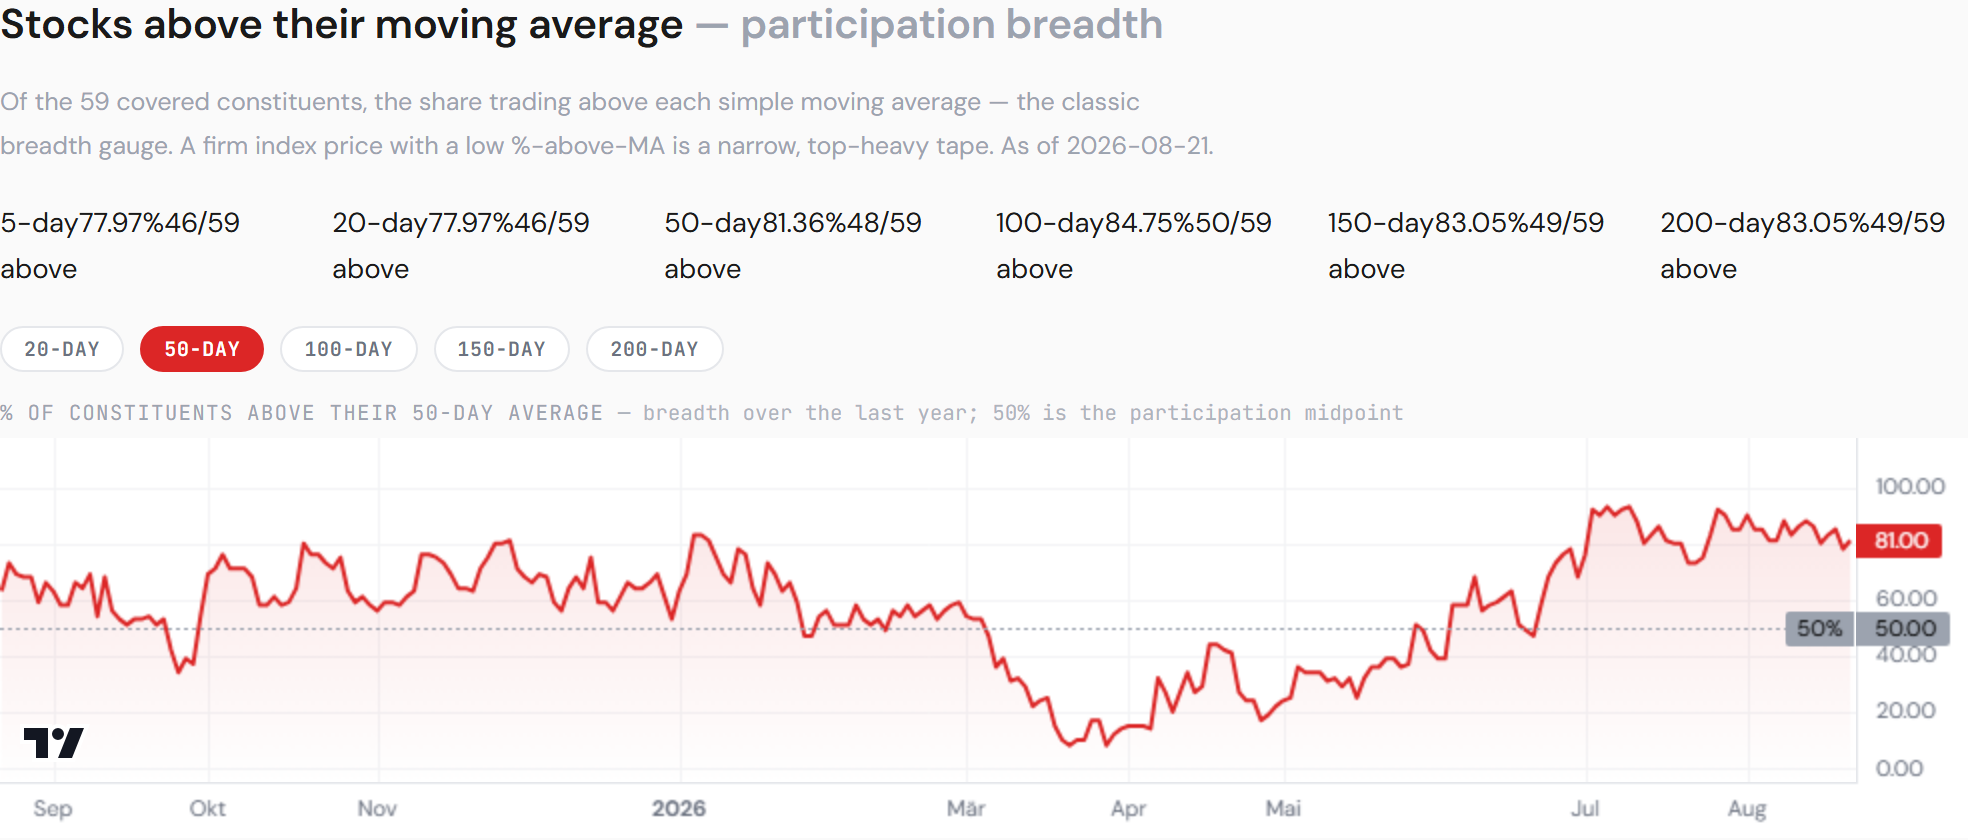
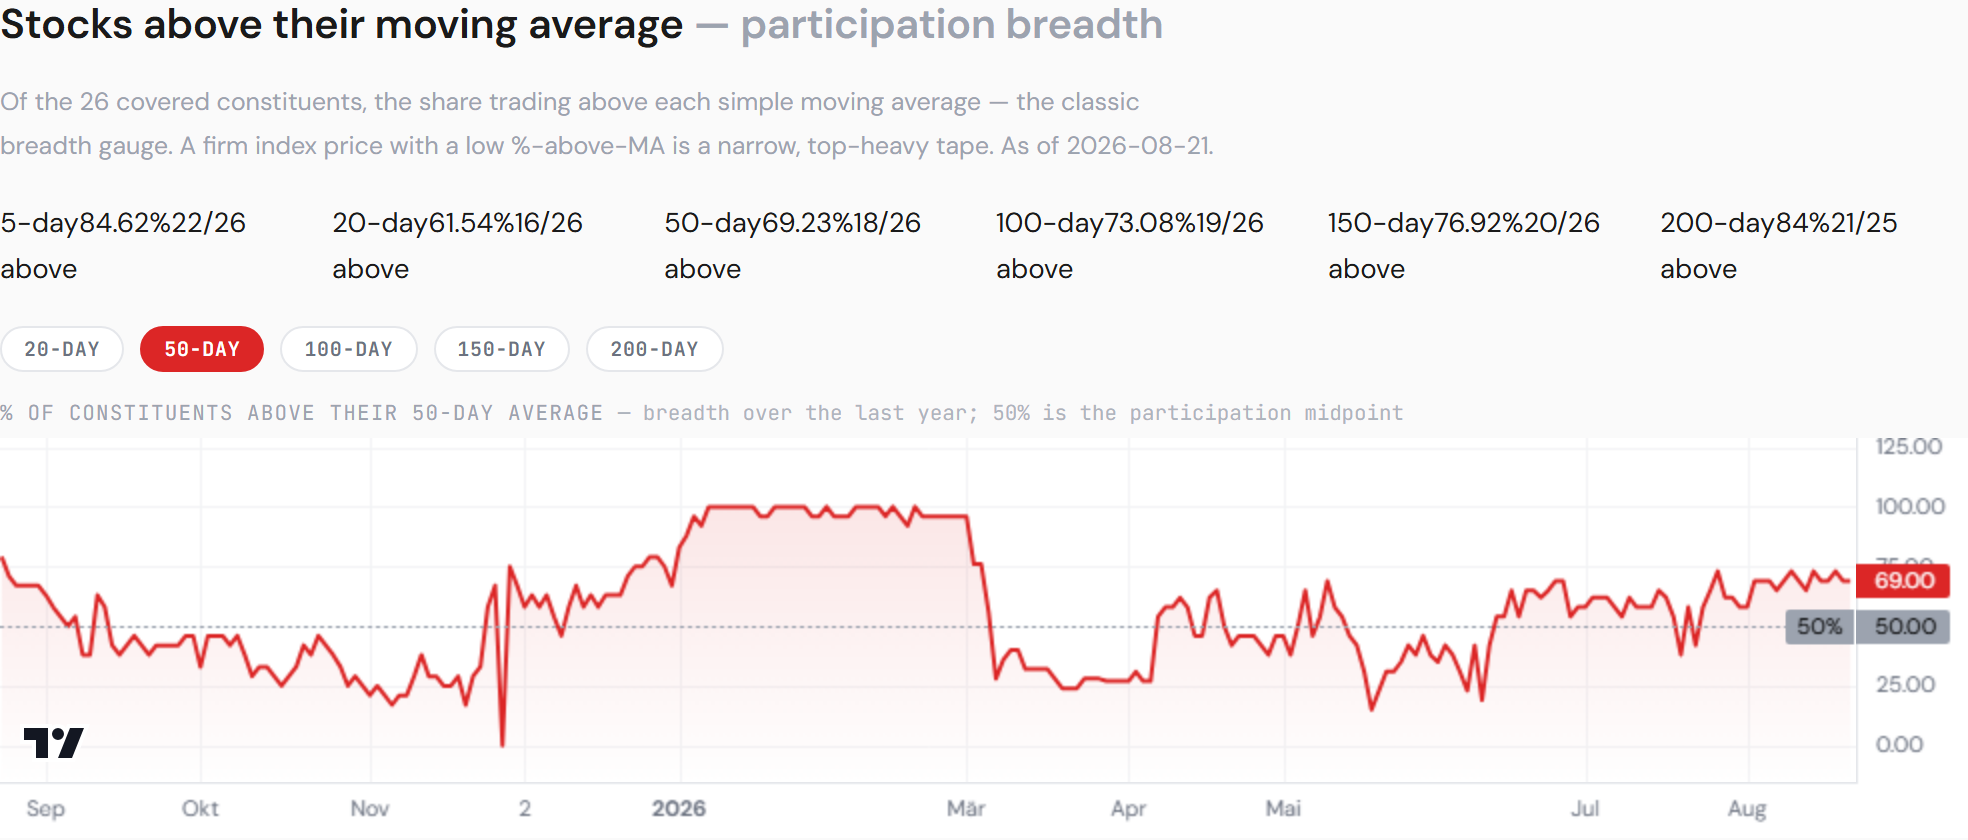
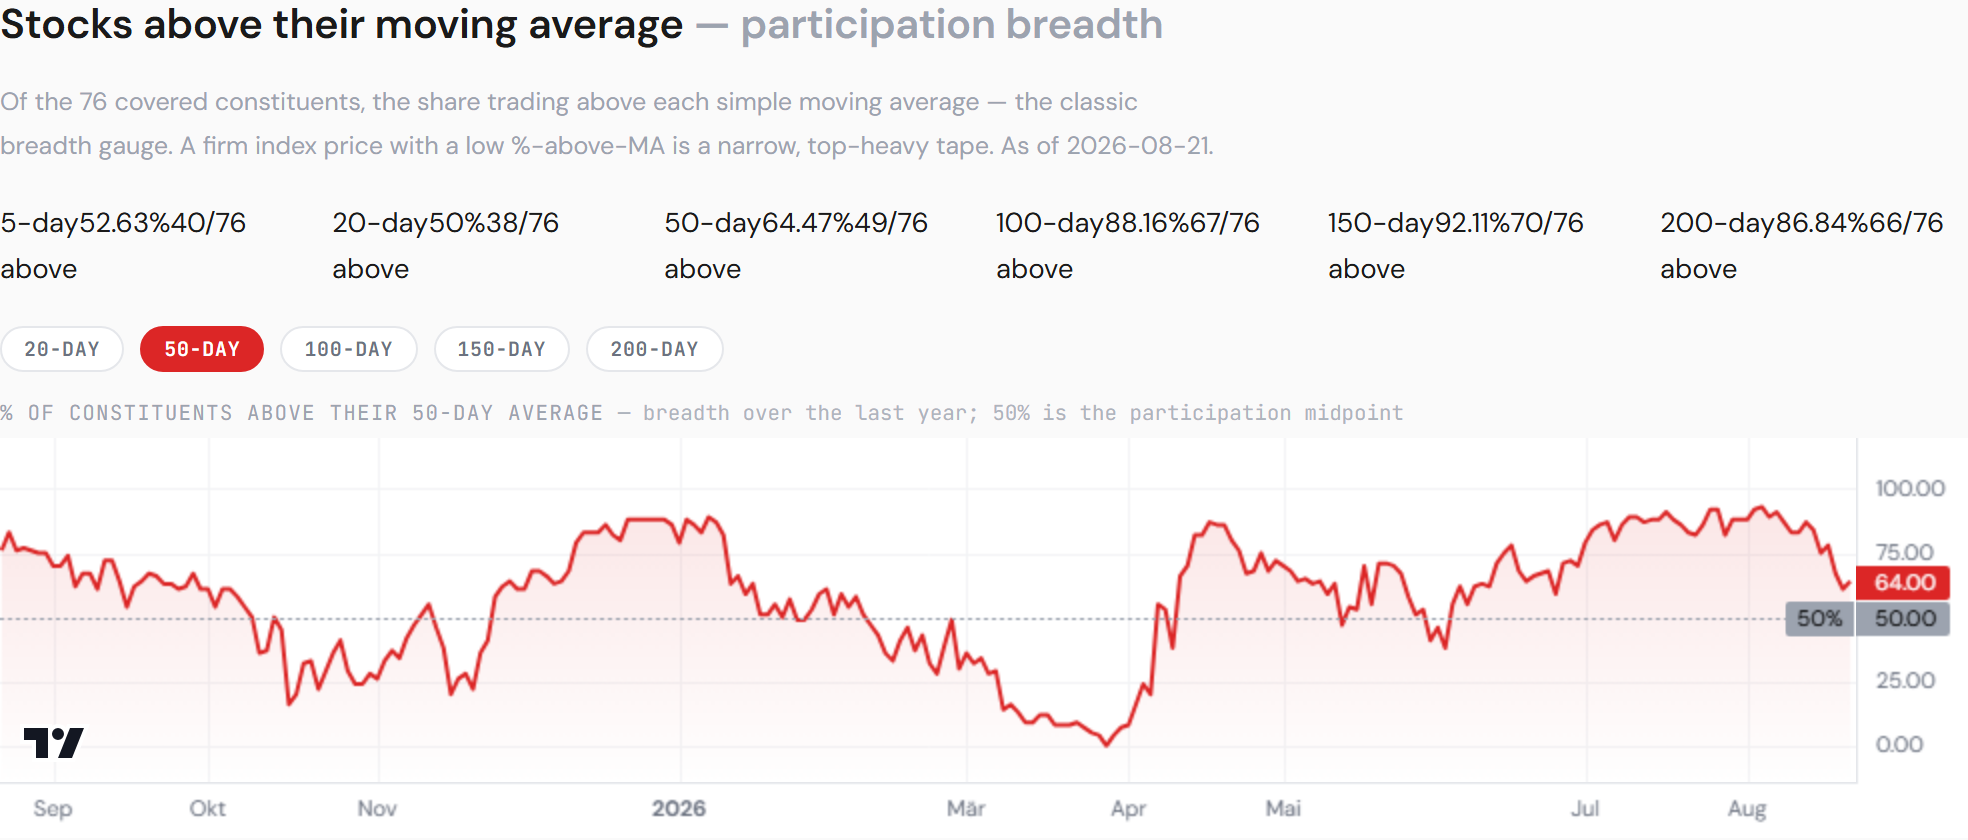
Underneath the four focus sectors — participation breadth. The sector board shows the ETF; the house dispersion pages show what its members are doing. Information technology: 47% of its 72 covered constituents above their 50-day average, 39% above their 5-day, no name at a new 52-week high — 17 five-day highs against 15 five-day lows, a sector still +2.7% on the month carried by a narrowing half. Health care: 81% above the 50-day, 85% above the 100-day, ten names at new 52-week highs — 17% of the sector — 23 five-day highs against 3 lows, and the median member +9.2% on the month, a point ahead of the ETF itself: broad, not carried. Materials: 69% above the 50-day, 84% above the 200-day, 54% of the sector at a five-day high on Friday, two at 52-week highs. Financials: 64% above the 50-day, 87% above the 200-day, 26 five-day highs against 7 lows. The strong sectors are strong underneath. The largest sector is narrow underneath — which is the week’s axis in one more instrument.
The factor read — momentum cracked, and the regime gauge moved below its trend. Last week our factor-regime gauge put momentum over low volatility at the 94.6th percentile and above its 50-day trend, and this letter wrote that a spread that far into its distribution “has never mean-reverted gently”. This week the gauge reads 92.3rd percentile, below trend: indexed 156.83 against a 50-day of 158.27, regime label momentum repair attempt below trend. The pair behind it: the S&P Momentum ETF −2.99% on the week against the Low-Volatility ETF’s −1.38%; momentum’s twenty-day rate of change +1.52% against low-vol’s −2.44%, but over sixty days momentum −0.58% against low-vol +2.35% — the defensive leg has been quietly outrunning the aggressive one for a quarter, and this week the twenty-day window caught up with the sixty.
Saturday’s Global letter found the same turn built from international instruments: momentum’s breakout failed on its weekly close, global min-vol made a new high. Two continents, two constructions, one crack — which makes it a market fact rather than an American artefact, and means the turn is not contained to one geography either.
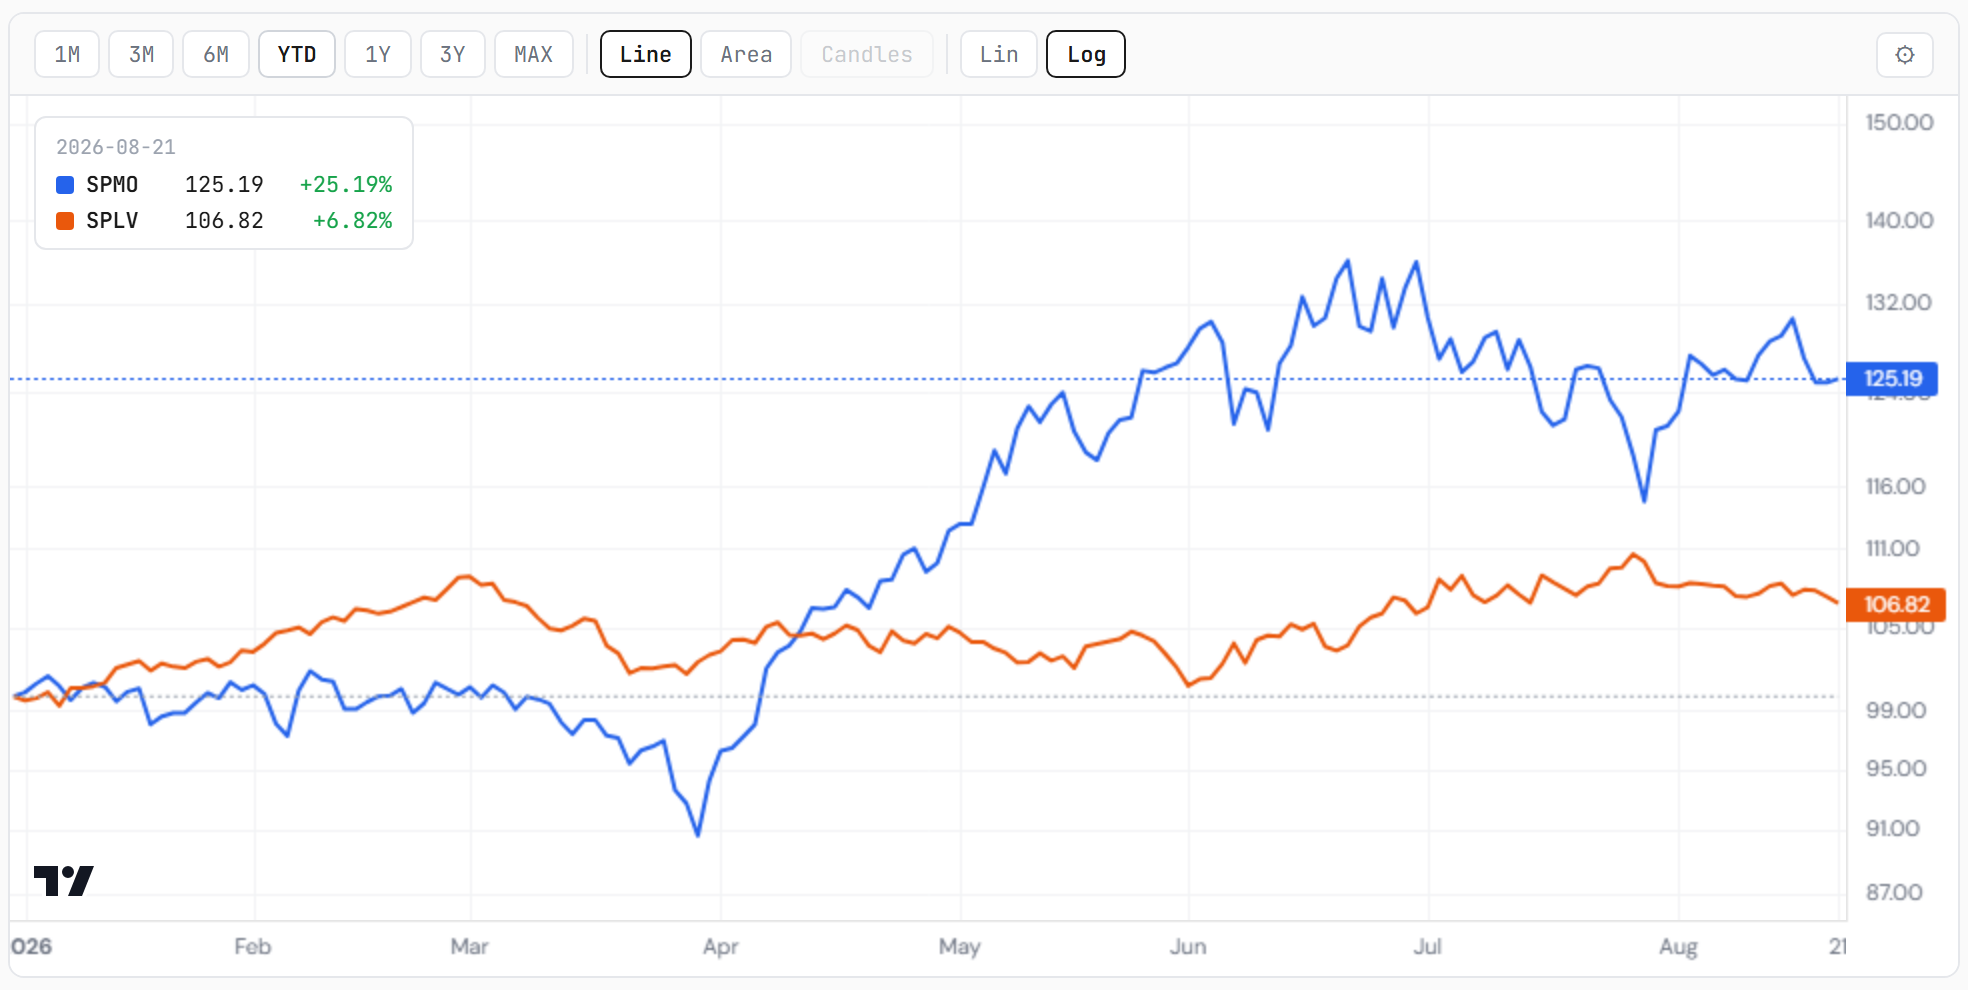
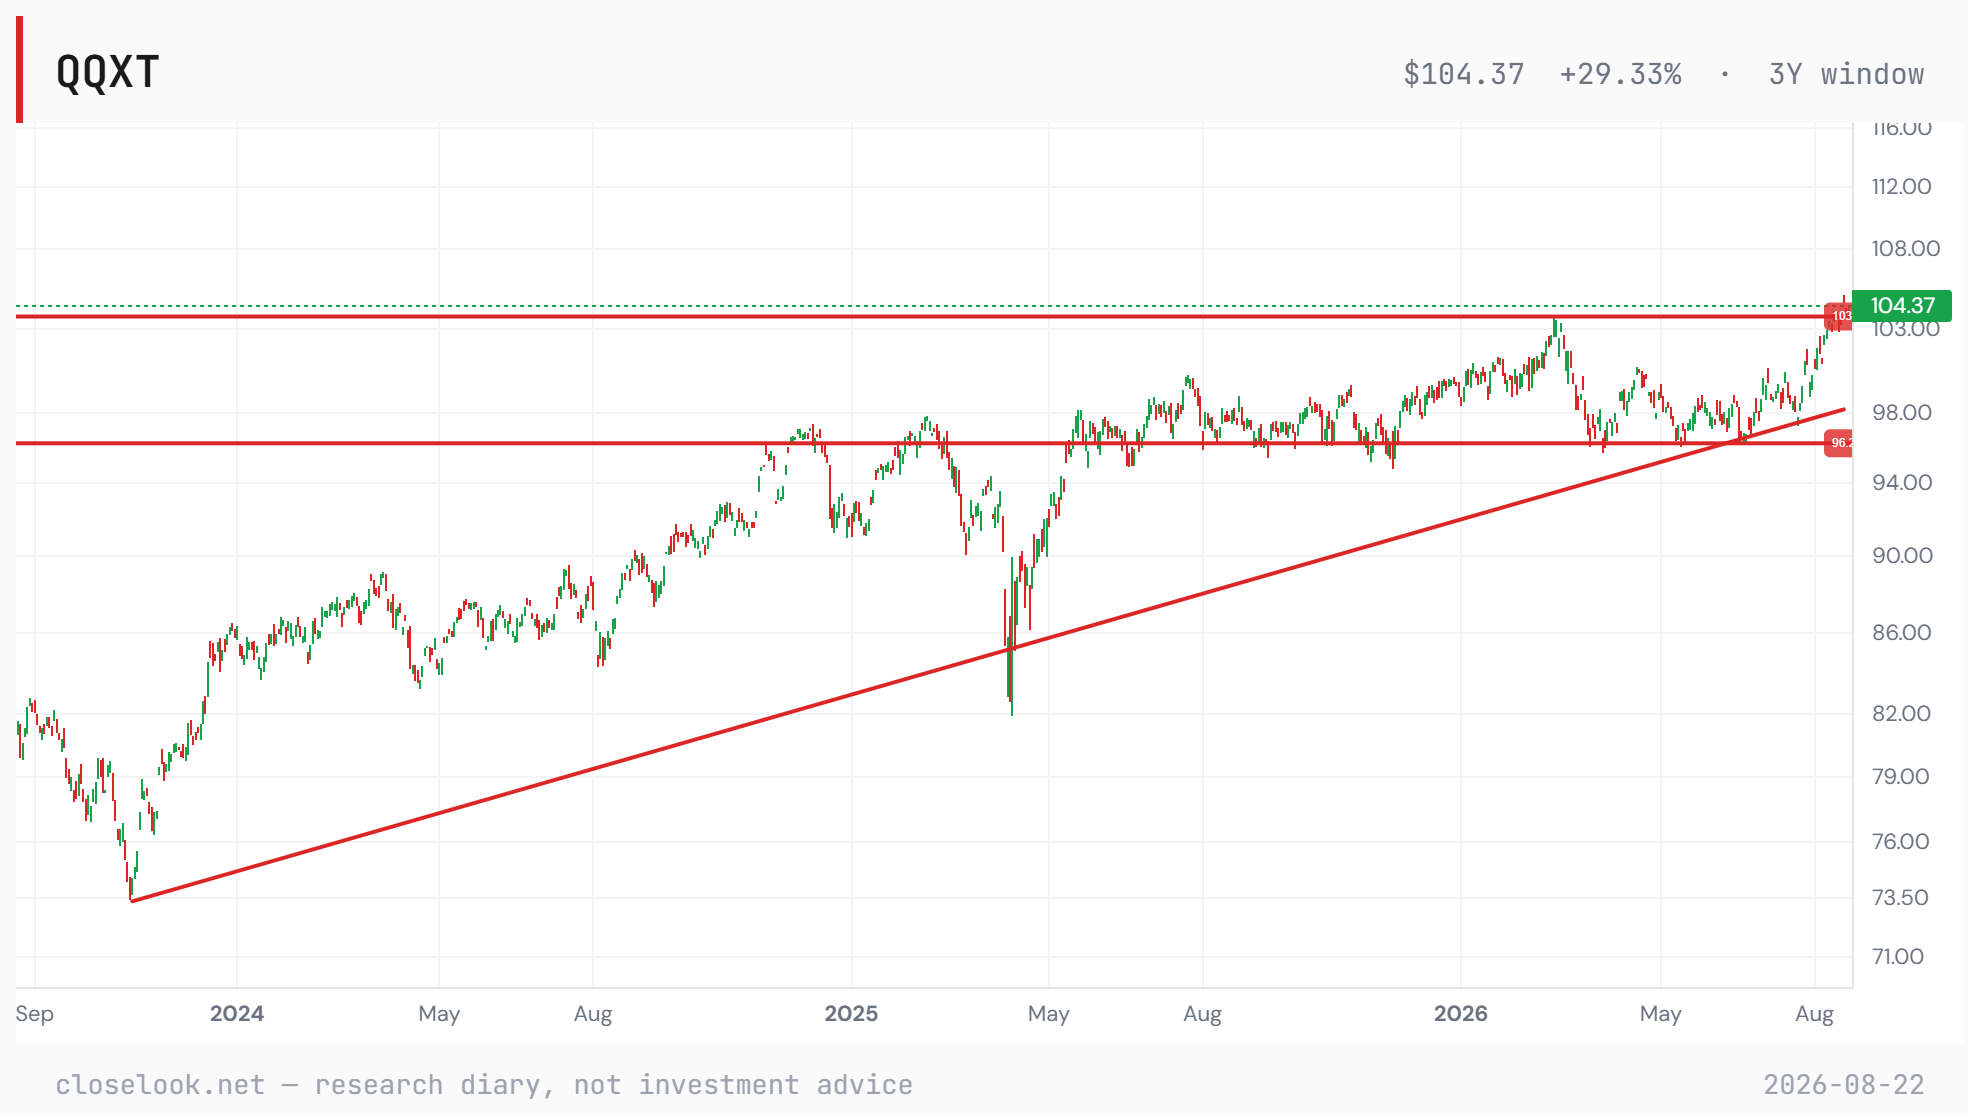
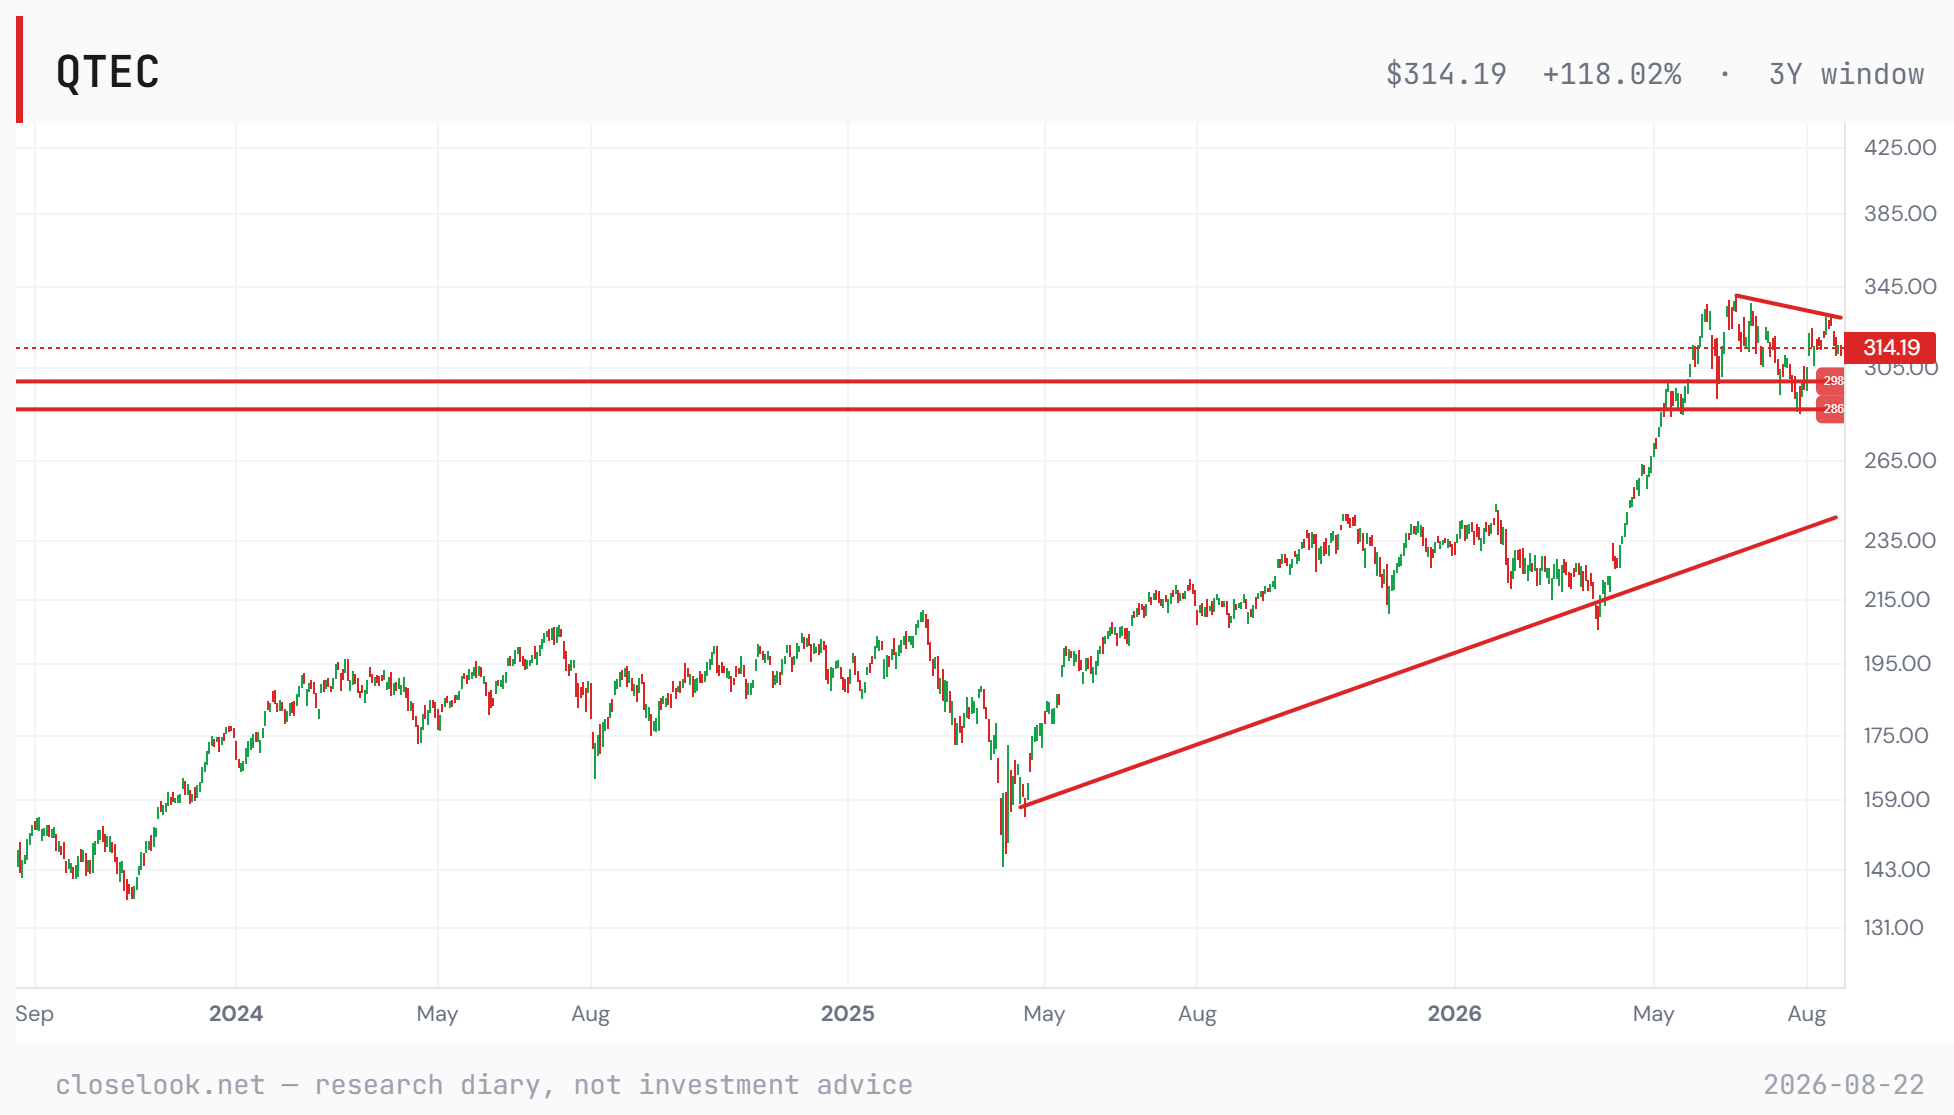
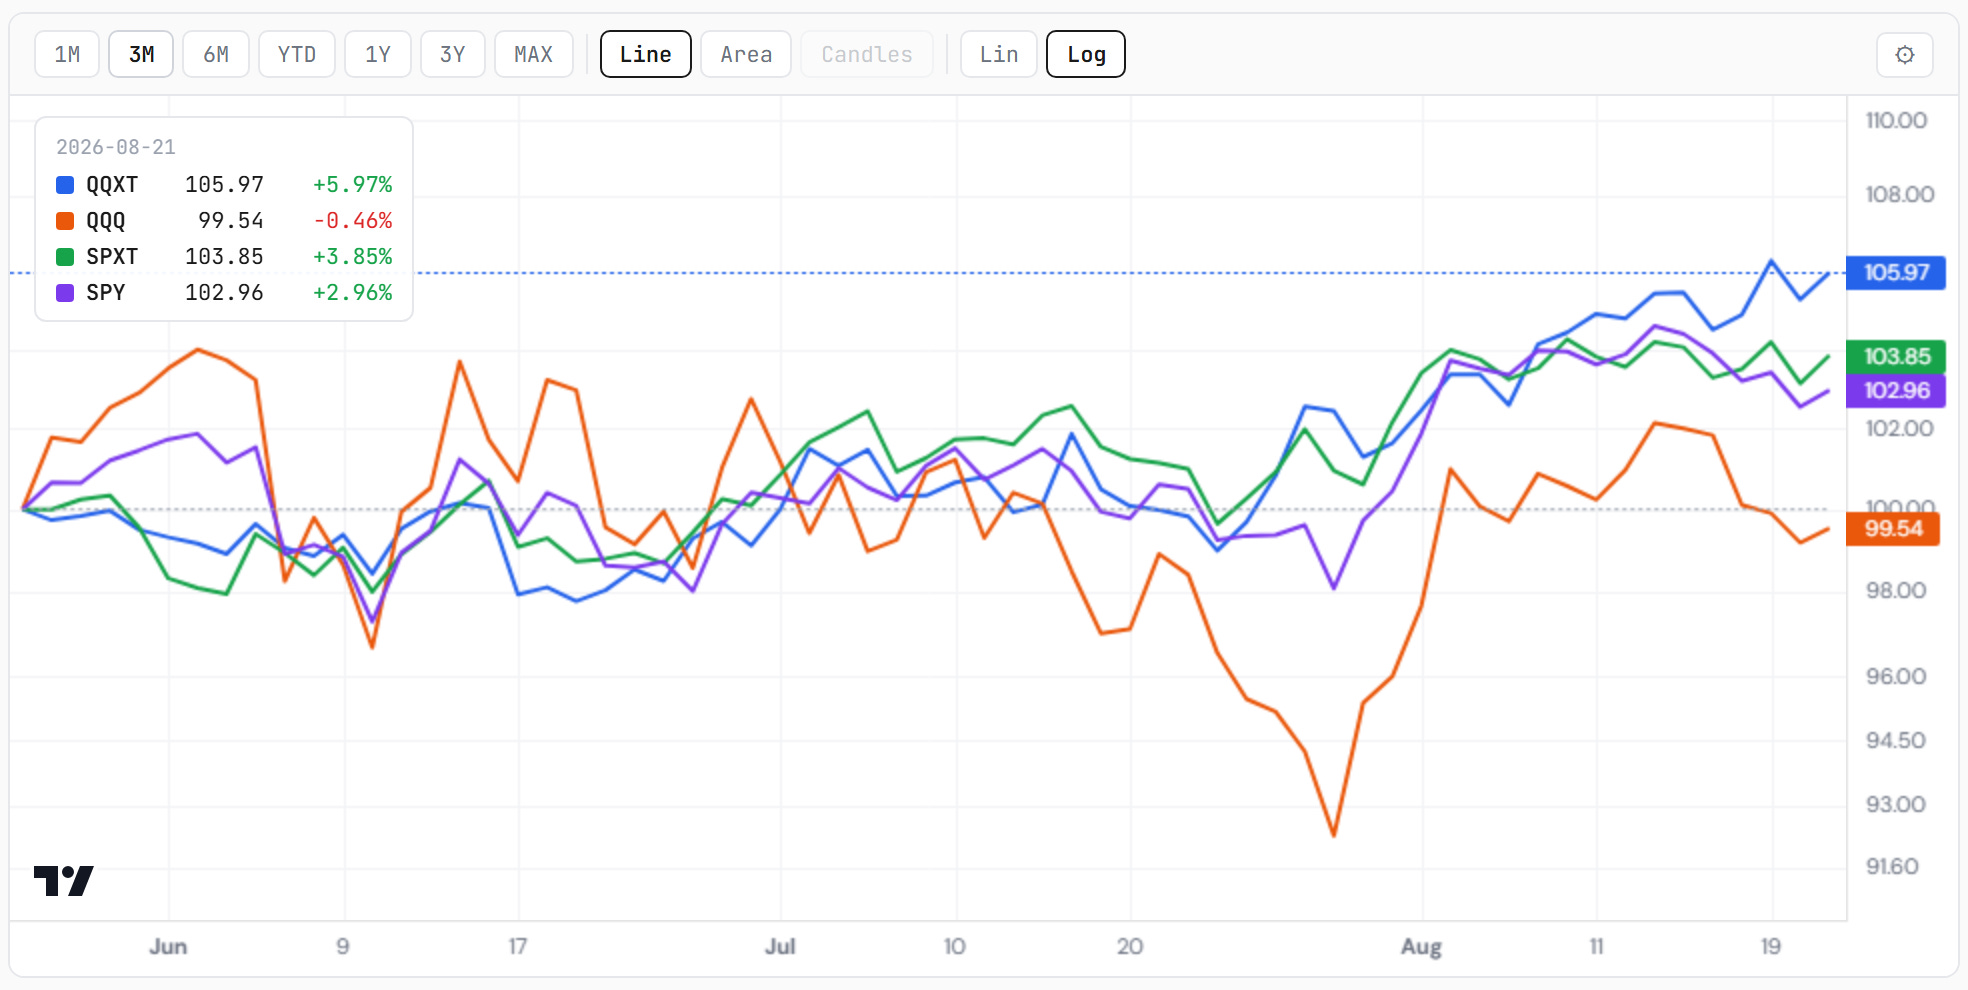
The axis turned — from software-vs-semis to tech-vs-everything-else. For most of this year the interesting line inside the tape ran through technology: software against semis, the yin and yang of the AI trade, with one half paid and the other charged. That line is still visible — software lost 0.68% this week while semis lost between 4.7% and 8.5%, and over a month software is +12.6% against semis −5.9% — but it is no longer the line that decides the index. The line that decided this week ran around technology. The Nasdaq 100 ex-technology closed at 104.37, +0.49% on the week, at a three-year high, through the 103 shelf that had capped it since February. The Nasdaq 100 technology sleeve closed 314.19, −3.82%, 6.4% below its June high and under a descending line drawn from it. Same index, two halves, opposite charts.
The windows say how far that carries. On the year tech still owns it: the Nasdaq 100 +16.1% against its ex-tech cut’s +5.0%. On the month and the quarter the order has turned: ex-tech +6.0% and +6.0%, the Nasdaq 100 +0.6% and −0.1%; the S&P ex-tech +2.7% and +3.8% against the S&P’s +2.3% and +3.1%. Health care +9.0% on the month and +17.9% on the quarter. And the 2025 stars are back alongside the industrials: gold +13.0% on the month, the bitcoin fund +16.0%, copper miners +20.9%, materials +6.9% — every one of them closed Friday at its one-month high, while the Nasdaq 100 closed 2.5% under its. It usually travels with a weaker dollar, and it did: the dollar index fund −0.75% on the week.
Growth with no AI exposure is strong; growth with it is not, this month. The year has not changed hands. The month has. Probability, not prophecy — and the month is what September trades. One standing reminder belongs here: by the commonly cited multi-decade tallies, the best-performing stock in the S&P 500 over the long run is not a technology company at all — it is Monster Beverage, an energy-drink maker.
Underneath the factor read, participation held better than the index: the equal-weight cut lost 0.49% against cap-weight’s 1.37%, the Magnificent-7 basket closed −1.44% — a fourth consecutive week in which the defaults trail the average stock — and the best line on the family’s entire board was a health-care name. The average stock is not falling apart. The index’s largest weights are.

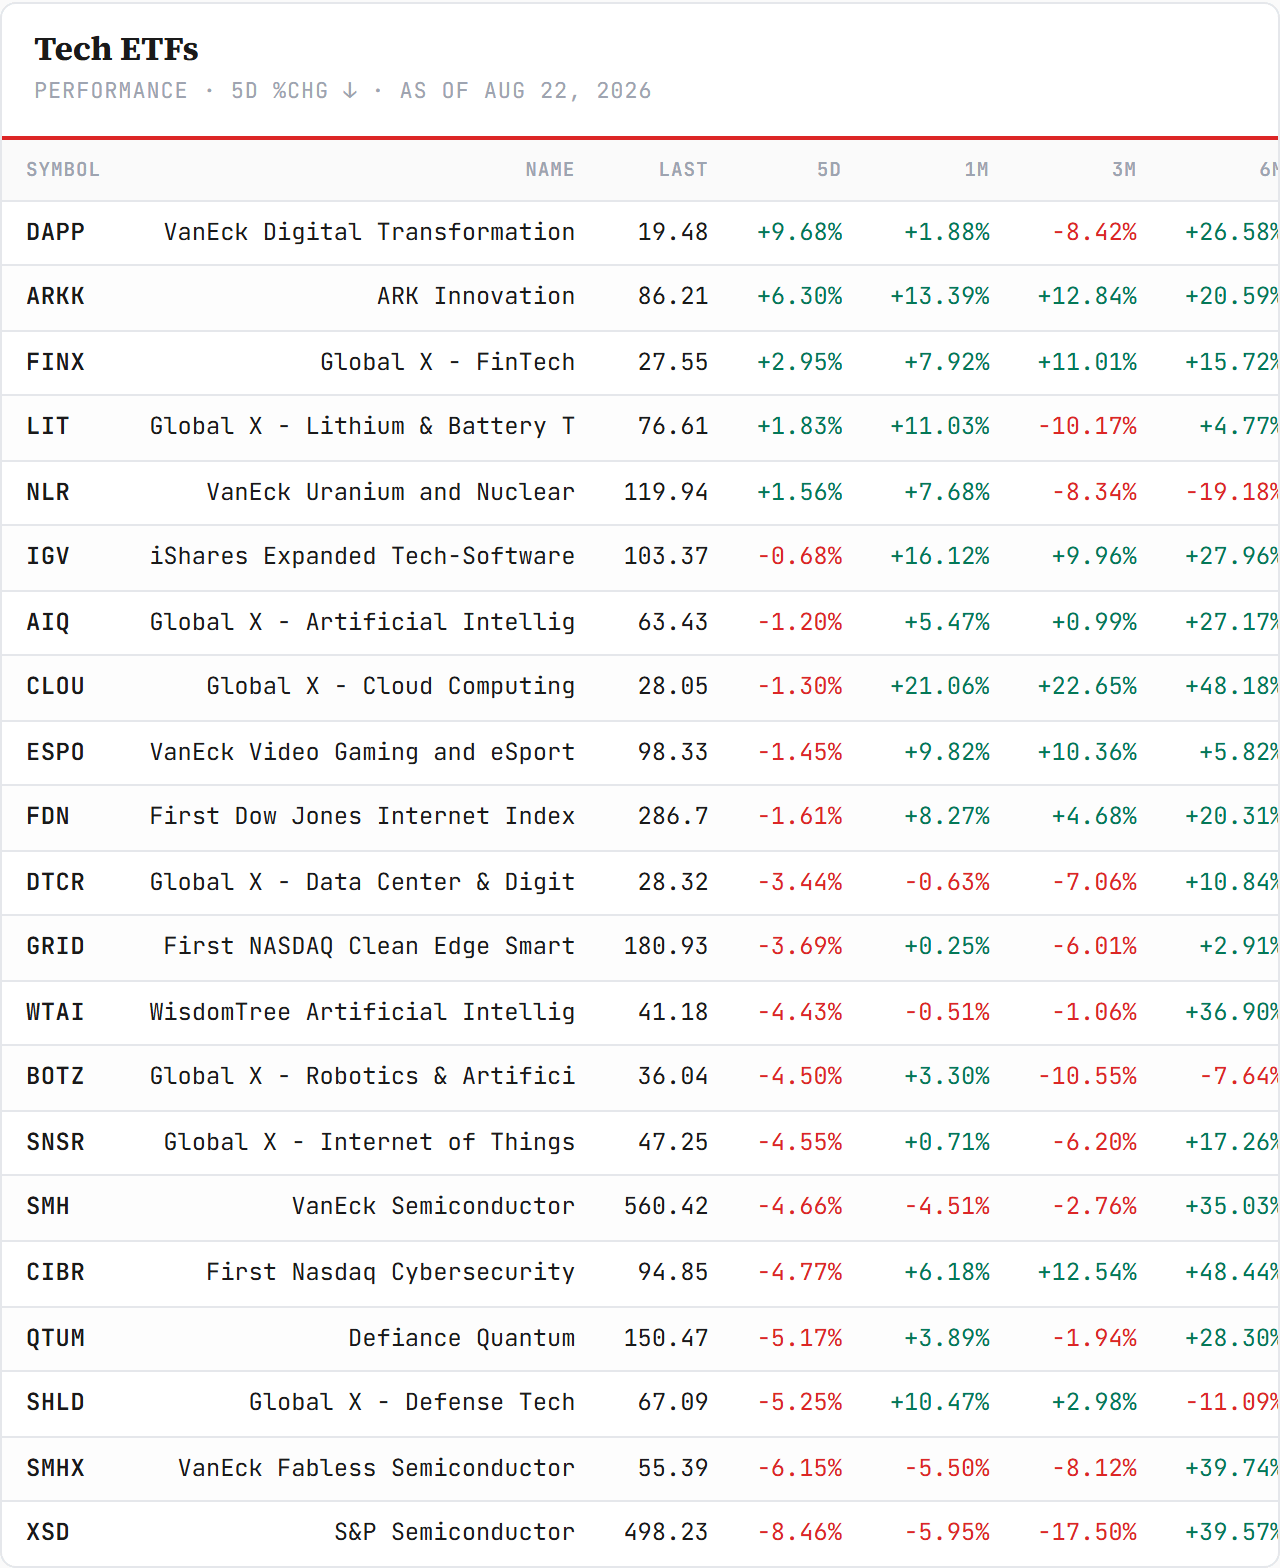
Inside tech — the year’s winners did the most, downward. The five green lines on the tech board are a list of what is not the AI stack: crypto equities +9.68% (with the coin), ARKK +6.30%, fintech +2.95%, lithium +1.83%, uranium +1.56%. The four that led last week all reversed — WTAI +4.69% became −4.43%, cloud +4.18% became −1.30%, data-centre REITs +3.60% became −3.44%, quantum +3.40% became −5.17% — and semis were the worst of the board: XSD −8.46%, fabless −6.15%, SMH −4.66%, all still between +45% and +55% on the year. Last week’s tell was “the names that ran hardest did the least”. This week they did the most.
2 · The State
The sorting rule, one week on: nothing was paid. Last week the market paid challengers and charged champions. This week it charged both, and paid almost nothing. The challengers it paid seven days ago gave it back and more: Nebius −21.1% on the week to 219.13, CoreWeave −16.5% to 87.85 — the two payments this letter said had held through day three did not hold through day eight. The champions it charged were charged again: Coherent −11.1% from its scoring entry, after the market had repented on day three (+7.8% on Monday, then −12.8% on Tuesday — a one-day pardon); Applied Materials −2.9% from its; Cisco’s charge held at +1.1%. And two new champions arrived and were charged on clean prints: Fabrinet, ten straight beats on the line, −19.4% on the day and −27% from its pre-print close; Walmart −9.15% on a revenue and earnings beat with a raised outlook. Baidu missed and lost 12.7%. The only print paid on the week was Target, +4.3% on the day, +7.1% on the week — the discount name.
So the rule did not break; it narrowed. What the market will pay for shrank to what arrives at a discount, and what it charges expanded to include good challengers as well as perfect champions. A tape that charges nearly everything for a week is not sorting by expectation any more. It is de-risking — and the thing being de-risked is the AI complex specifically: health care, energy and materials rose while every AI sleeve fell.
The one thing that was paid was the chart pick. Friday’s Weekly Chart Pick published Robinhood at 95.10 before the open — wave five out of a year-long triangle, the record quarter with crypto revenue down 38%, a manual flow set reversing up — and it closed at 108.13, +13.70% on day one, through the 100 shelf, on the session the bitcoin complex confirmed its breakout. One day is one day, and this letter scores at one week, one month and beyond. But in a week the market paid nothing it was supposed to pay, the one setup it paid was the one published on the page the same morning. The diary records it; it does not take a lap.
The veto, scored at the close: failed twice. IEF broke 93.17 on Monday, reclaimed it on Wednesday on the buyback — 93.38 at the close, above the line — and gave it back: 92.82 on Friday. By this book’s convention the weekly close is the verdict, and the verdict is the second failed reclaim in a row. The company the veto keeps is the real story: the Treasury doubled its long-end buybacks on Wednesday and the long end backed up through them within a session — the 30-year at 5.23% by Thursday midday, 5.25% by Friday morning, 5.275% at the final — while the Fed’s minutes leaned hawkish with three dissents for a hike. Saturday’s letter carries the sovereign board and the G7 detail; the tape’s reading is simpler: the bond market has now declined to sign the equity resolution two weeks running, and this week the equity market finally noticed.
The macro print was the right shape for the wrong reason. Walmart beat on revenue and earnings, raised its sales and operating-income outlook, guided full-year earnings under the street and printed US comparable sales of 2.6% against the 3.5% expected — and fell 9.15%, the worst earnings-day reaction in ten quarters, the fourth straight earnings-day decline, on the name this letter’s print record carried as nine flats in ten. The nine-flats era is over. The consumer read is a comp half a point under where the street had it; the tape read is that the broadest consumer name on the board has joined the list of things the market will charge for being expected to win.
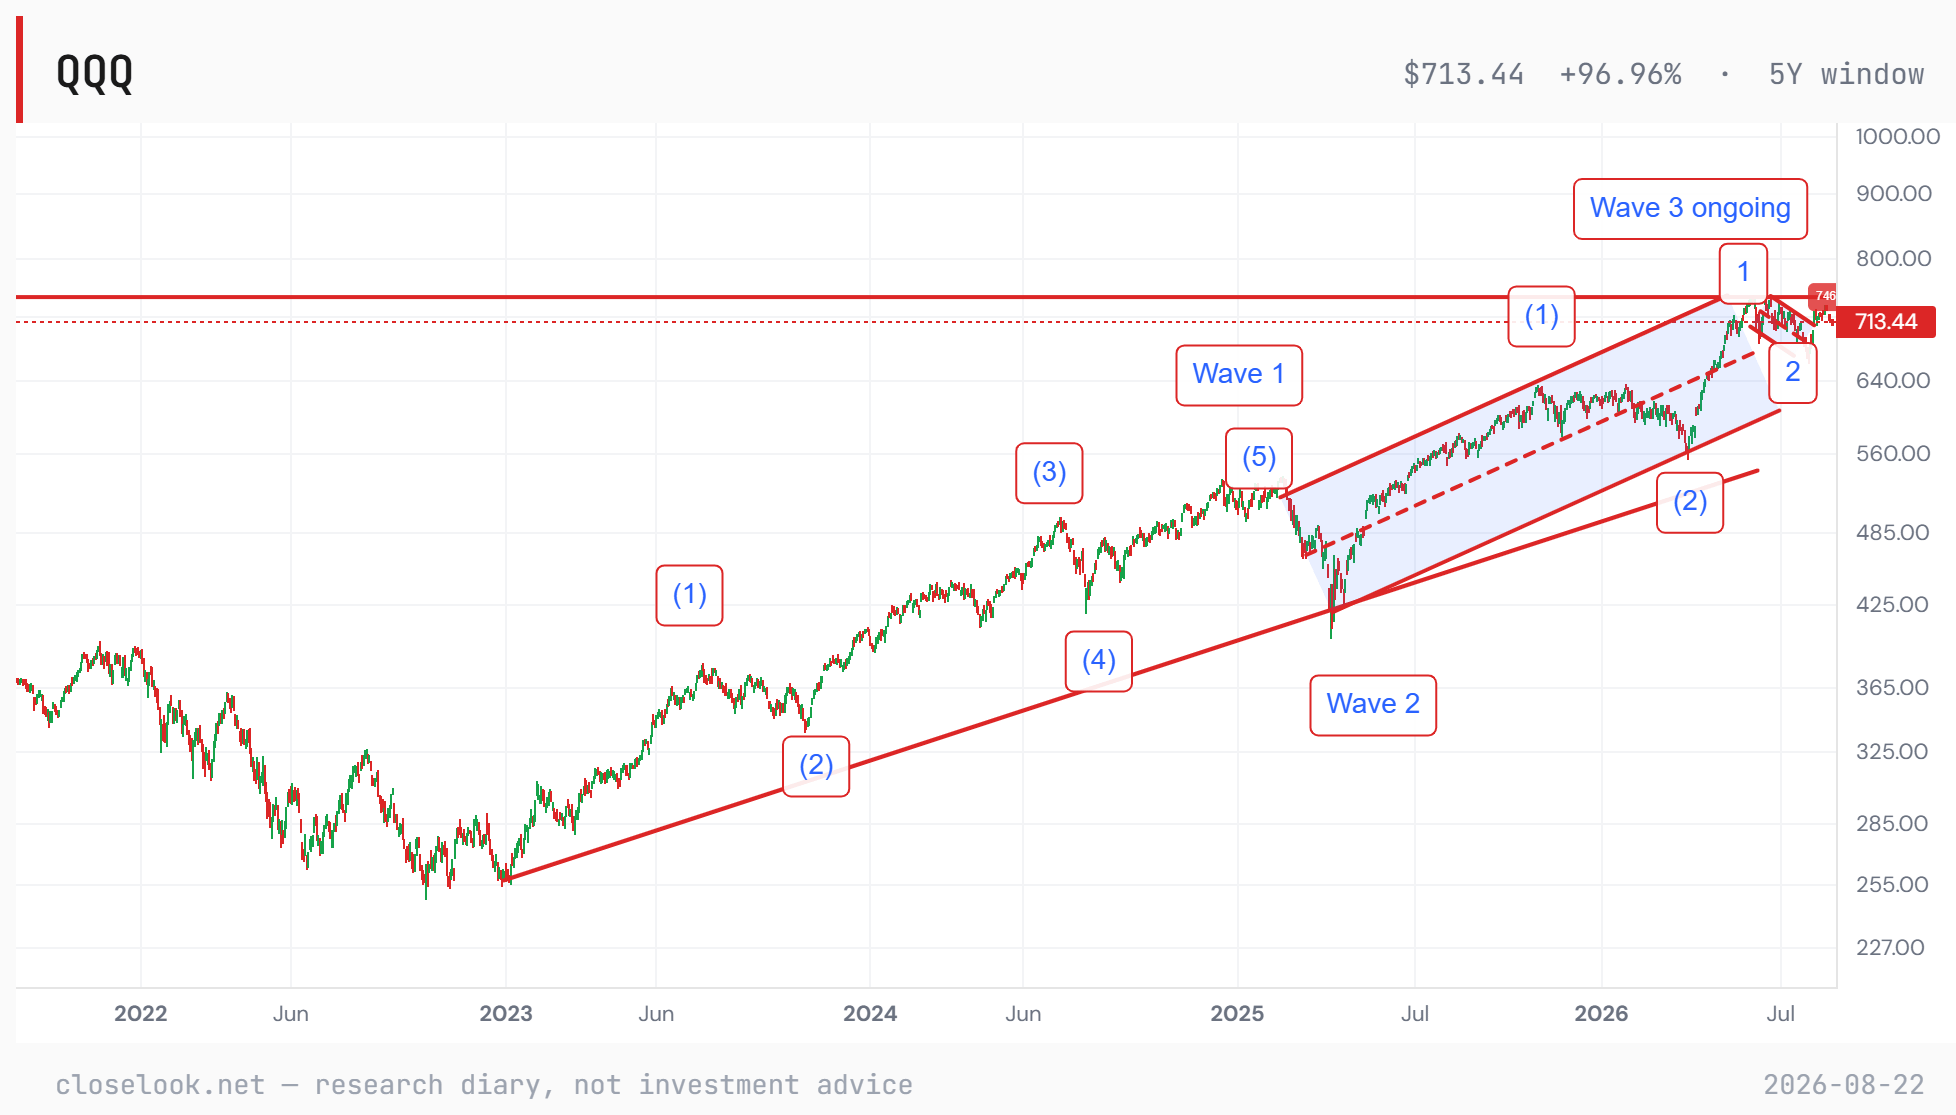
The count, long term — unchanged from last week. The wave count on the Nasdaq 100 reads as it did seven days ago: 1-2 complete off the April low, wave 3 ongoing, 746.16 the June high that confirms it, 694 the level that voids it. This week moved the index inside that map — from above 723.85 to its 50-day — without touching either line. The chart is the same chart; the price is closer to the lower line.
3 · The Outlook
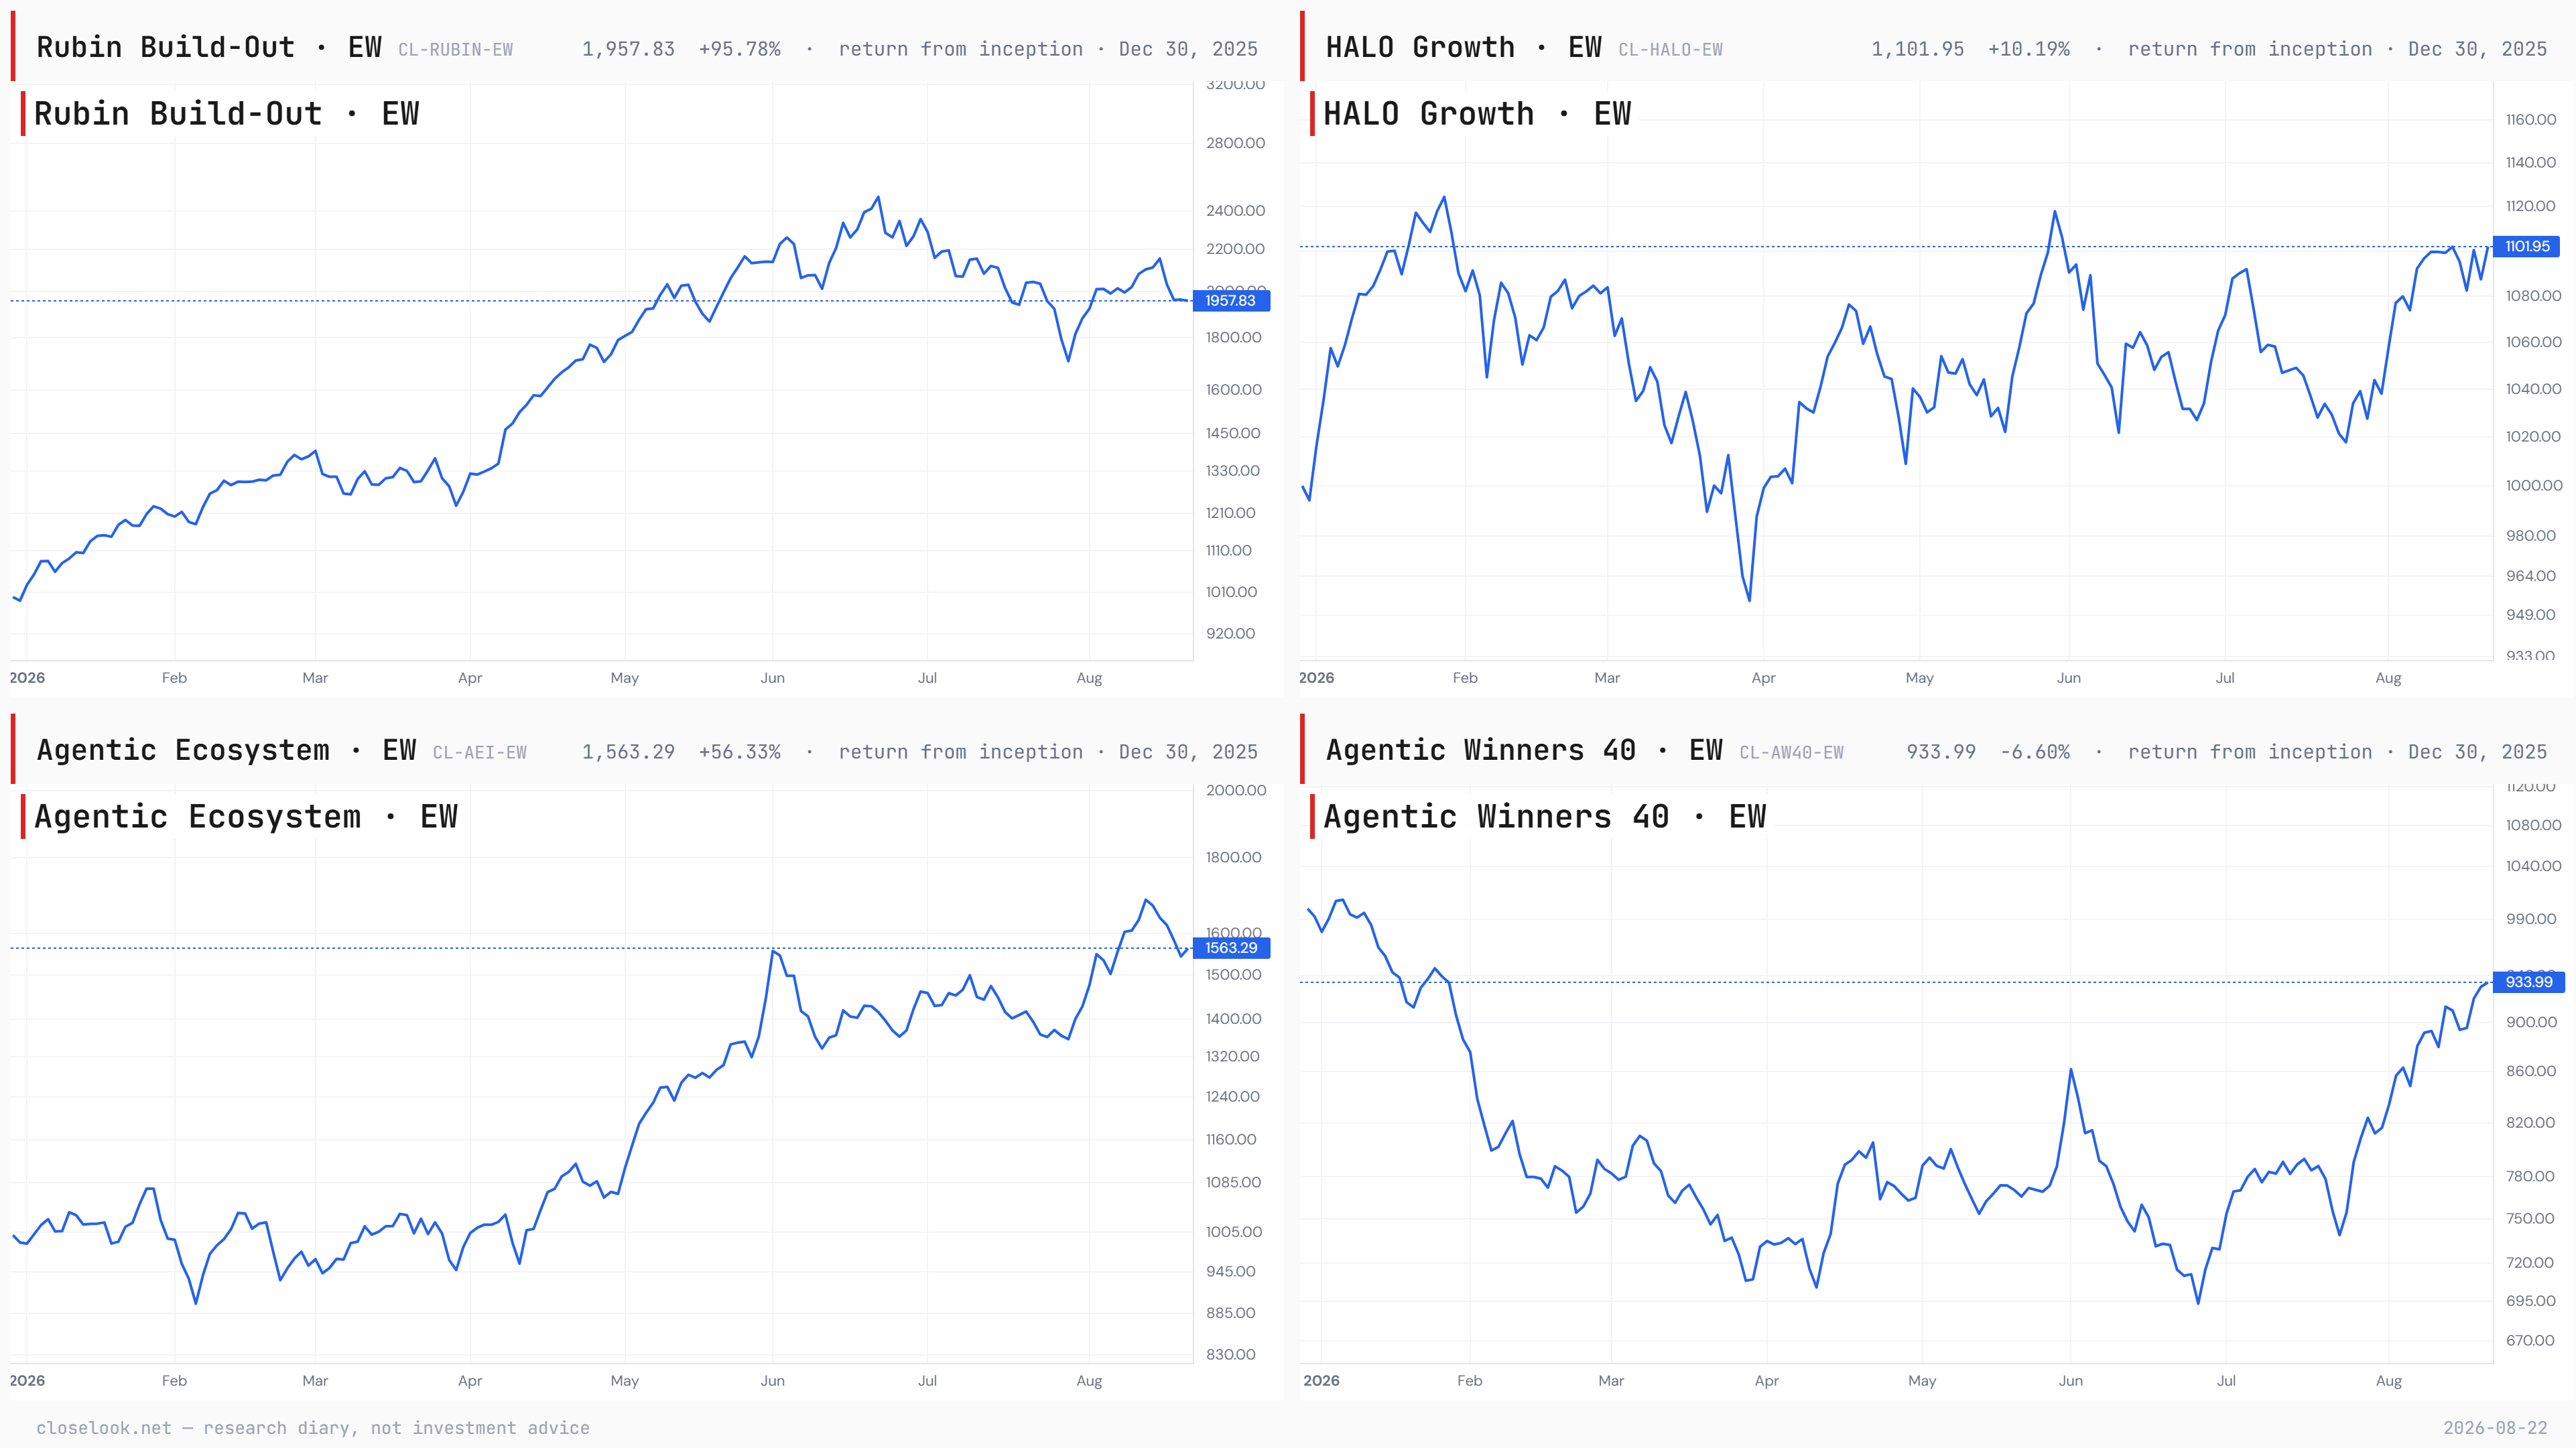
The four indices — the lightest layer rose, the heavy layers bled. The family printed the week’s axis in one row: Agentic Winners +2.7% (the applications; still −4.6% YTD), HALO +0.0% (broad growth, no AI thesis; +8.4%), Agentic Ecosystem −6.5% (the opex layer; +58.4%), Rubin Build-Out −7.3% (the capex layer; +90.5%) — with Euro-AI −3.5% across the Atlantic, +31.7% on its year.
Two things to hold from that row. The control group did not fall: HALO flat against the buildout −7.3% and the operating layer −6.5% says this was an AI unwind, not a growth unwind — the mirror of last week’s “an AI bid, not a growth bid” — and the index carrying no AI thesis is now the house expression of the week’s axis. And the lightest layer rose for a second week while the two heavy ones gave back more than a third of their recovery off the July lows: capex +14.7% off its 29 July low from +23.6% a week ago, opex +15.2% from +23.1%, applications +26.4% off its 23 July low from +31.2%.
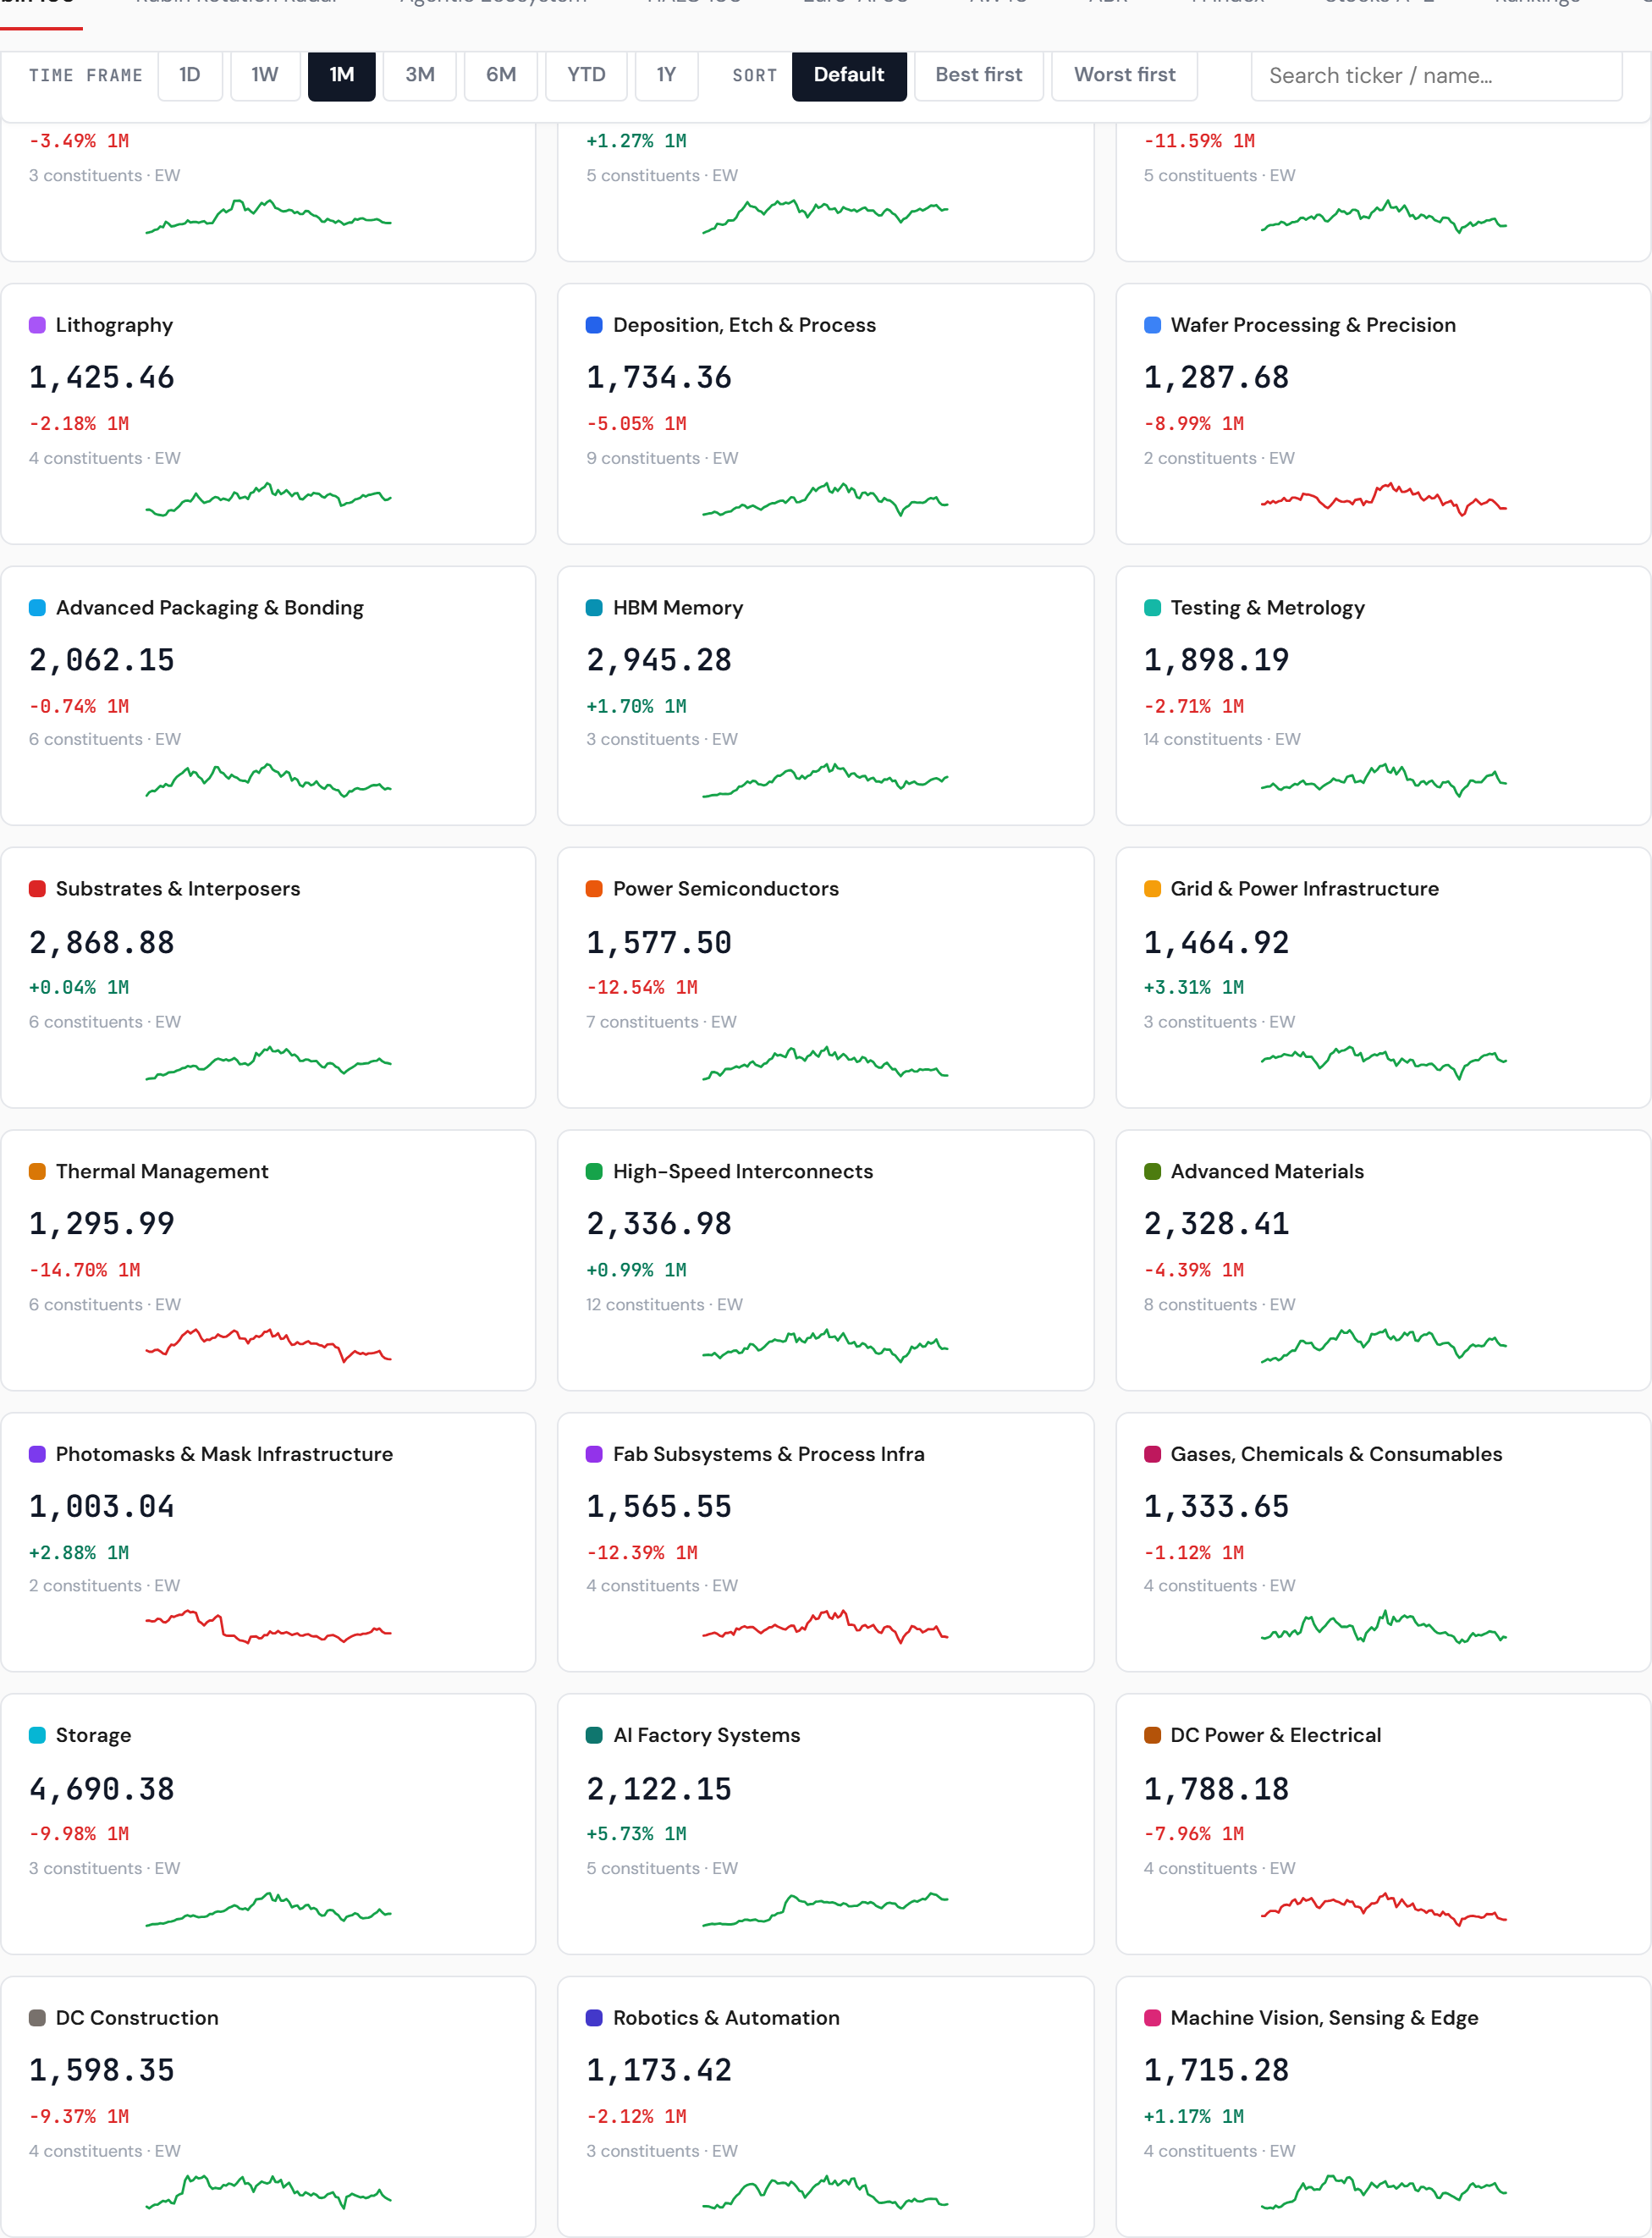
Inside the indices — where the week actually happened. Inside Rubin one line was green of twenty-four: HBM Memory +3.78%, +178% on the year, the week Korea crashed and SK hynix announced the largest buyback in the country’s history. Storage gave back 4.16% of last week’s +21%. The bottom is the fab floor: wafer processing −11.25%, testing and metrology −10.66%, foundry −10.35%, fab subsystems −9.88% — and no region hid: US constituents −8.61%, Japan −6.05%, Europe −7.14%.
Inside the Agentic Ecosystem the names that made 2026 led the way down — Foundation Models −11.02% against +753% on the year, substrate −9.29%, edge −9.22%, compute operators −9.19% — with operations and observability the best line at −3.70%. Inside Agentic Winners the inversion ran the other way for a second week: Application Leaders +6.05%, Enterprise +4.11%, Control Plane +2.81% — and Megacap Gateway −2.47%, the only sub-index positive for the year at +6.9%, red again. The applications layer spent a second week buying what it sold all year and selling the one thing it owned.
Best and worst week, by name — the whole story in ten tickers. Across the family’s constituents with a full week of prints, the five best: Tempus AI +39.5%, Freeport-McMoRan +15.3%, Illumina +14.9%, Celsius +14.7%, Uranium Energy +13.8% — then e.l.f. +11.5%, Chipotle +10.1%, Duolingo +10.0%, Ivanhoe +8.4%, Vertex +8.4%. Nine of the ten are HALO names or application names; none is a chip, a tool or a cloud. The five worst: Aehr Test Systems −24.1%, Fabrinet −23.4%, Nebius −21.1%, AT&S −18.8%, Applied Optoelectronics −16.9% — then AeroVironment, Fastly −16.6%, CoreWeave −16.5%, Allegro −16.3%, Tower −16.2%.
Put the two lists side by side and the week’s axis is legible without an index number: last week’s three best names — Nebius +47.7%, Fastly +30.4%, Aehr +30.1% — are this week’s three worst among the AI indices. Inside the capex index four names of ninety closed green; inside the operating layer three of thirty-one; inside the applications twenty-two of thirty-six; inside HALO forty-eight of eighty-nine. The median AI-infrastructure name lost nearly nine percent in five sessions. The median growth name without an AI thesis gained.
The AI Handoff Board — the stack jumped two rungs. The handoff ratios did in a week what they had been doing in months: use-against-operate +11.3% to 1.2076, use-against-build +9.0% to 1.5293, beyond-gateways +5.2% to 1.2892 — the applications pulling away from both the operators and the builders at once, which is the Application-Leaders-up, Foundation-Models-down week expressed as a ratio. Two went the other way and both deserve naming: operate-against-build −2.1% — the operating layer fell faster than the buildout it runs on — and verification-against-design −4.1%. Last week the stack shifted one rung up, leaving the picks behind. This week it left the operators behind too.
The hyperscaler cohort — the leaders sat out a fourth time, and this time fell. The Mag Pulse board reads the basket at 67.28, −1.44% on the week and 3.2% below the 69.5 shelf that has capped it since spring — further from it than last week’s 1.8%. Underneath: the hyperscalers (Microsoft −2.27%, Amazon −1.53%, Alphabet −0.31%) −1.18% as a cohort, consumer AI −2.23% with Meta −6.77% and Apple +1.12% pulling opposite ways, the supplier (Nvidia) −4.64% into its own print, the torque name (Oracle) −2.69% while still +22.0% on the month. Fourth consecutive reading in which the defaults trail a tape whose average stock is holding up. The December pivot at 62.56 sits seven percent below; the question this letter asked last week — rotation or distribution — got a week of evidence for the second reading and is still open.
Compute tightness — the demand side was sold, not refuted. The two neocloud payments that held through day three did not hold through day eight: Nebius −21.1%, CoreWeave −16.5%. Fabrinet beat for a tenth straight time and was sold 19.4%. Inside the family the Data & Memory sleeve fell 3.9%, Compute Operators 9.2%. Against that, SK hynix announced a 40-trillion-won buyback and cancellation — the largest by a Korean listed company — and HBM Memory was the only green sub-index in the capex table. Physical shortage is still a slow fact; positioning was a fast one this week, and it ran the other way. Last week this letter wrote that price and flow could not disagree for long. They stopped disagreeing — price came down to flow.
Structural inflation — the gauge cooled as the bond market heated. The house composite in the macro lab reads 49, “Contained”, direction flat, the persistence core at −0.14 and the supply-shock bucket at +0.36 not spreading to breadth or expectations. Last week the gauge’s own named risk — expectations — printed hot and this letter called that “the instrument doing its job in an uncomfortable direction”. This week the instrument says the structural side is contained — while the 30-year sat at 5.275% and the Fed’s minutes counted three votes for a hike. That is the tension of the moment: the long end is not pricing inflation. It is pricing supply.

Breadth and temperature — participation held, thermometer warmed. The equal-weight cut beat cap-weight by nine tenths of a point, the average stock fell half a percent in a week the index fell one and a half, and the best names on the board were outside the AI complex entirely. The Money Temperature composite reads 53, two points warmer than a week ago, still the middle of its range and still labelled transition. Equities fell and the gauge warmed, because the hard-asset bid is risk appetite by another name and the board read it as such. Participation good, thermometer neutral-warm, and neither reading front-runs anything.
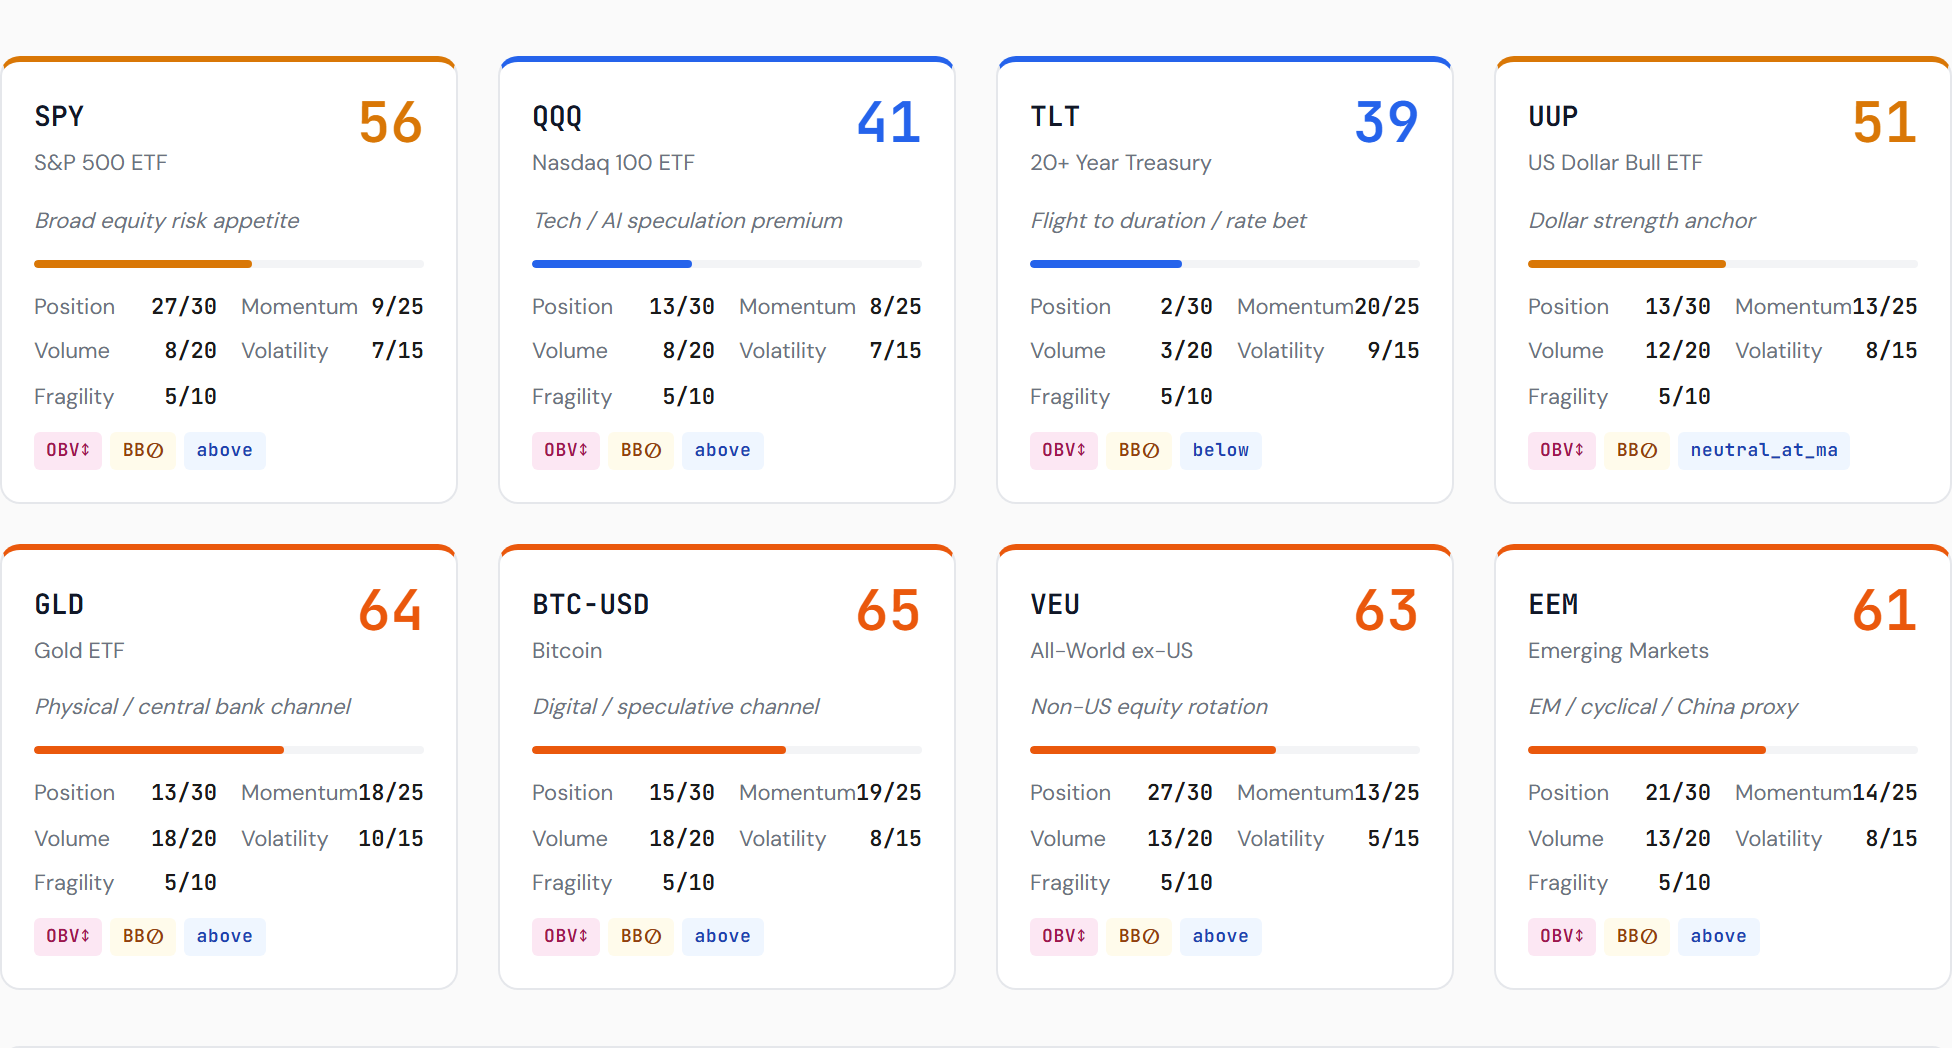
The count — retreated, not voided. Last week this letter filed the count as advanced: QQQ through the 723.85 high-water mark, 746 the confirmation, 694 the kill-switch. This week it retreated: 723.85 was lost on Tuesday and never regained, and Friday closed at 713.44 — the 50-day average to the cent. The chip index, which never challenged its 505 floor last week, closed 2.9% above it. What has not happened is the kill-switch: 694 is 2.7% below, and a count that loses its first marker while holding its last is a count on the wrong side of the map, not off it. The difference prints at 694 — or at 746, and the index is now 4.4% from the second and 2.7% from the first. Nvidia prints on Wednesday with both lines in range.
