


The axis inverted inside a week. Software broke its June resistance and went green on the year, the Magnificent-7 basket beat the average stock for the first time in five weeks and closed at the shelf’s door — while the silicon stayed sold to within one percent of its floor and the market paid software beats and charged hardware ones, Nvidia’s eleventh double beat included. The index moved in a one-percent band all week. Nothing under it did.

1 · This Week’s Action
The tape, day by day. The quietest index week of the summer sat on top of the loudest rotation. Monday −0.29% while the hard assets started giving back their Warsh-week gains. Tuesday +0.32% — the day the world ex-US index printed a record close and both min-vol funds made highs they would not hold. Wednesday +0.02%, the market flat to the cent into Nvidia’s print after the bell. Thursday +0.66%, the widest move of the week, as the supply-capped guide was paid: Nvidia +8.74%, the software beats from Wednesday night paid alongside it. Friday −0.23% on Warsh’s first keynote as chair — the hard assets sold, Thursday’s hardware beats sold harder, and the old-guard megacaps caught a bid against the whole tape.
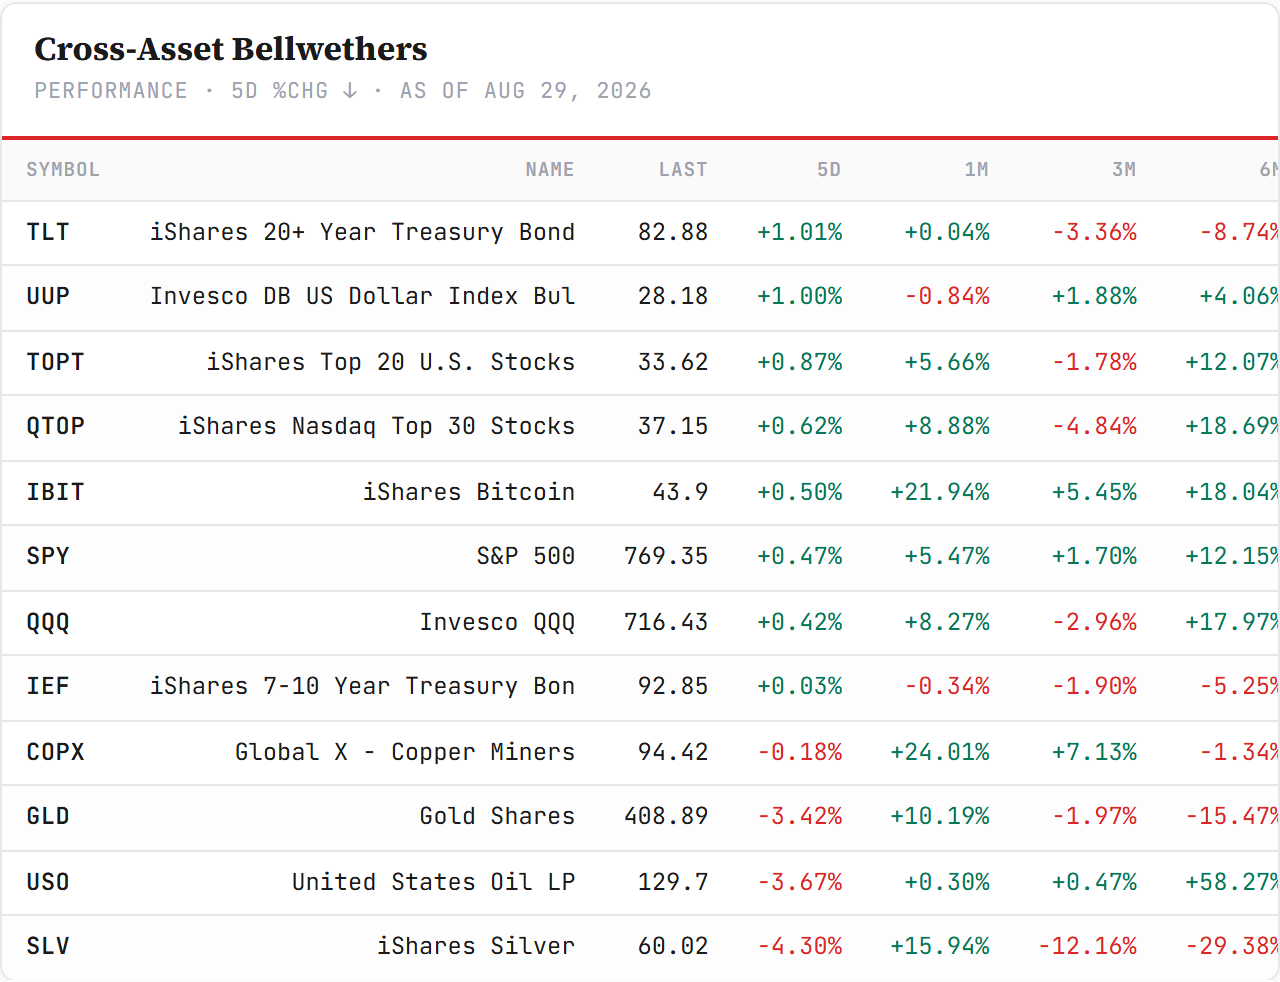
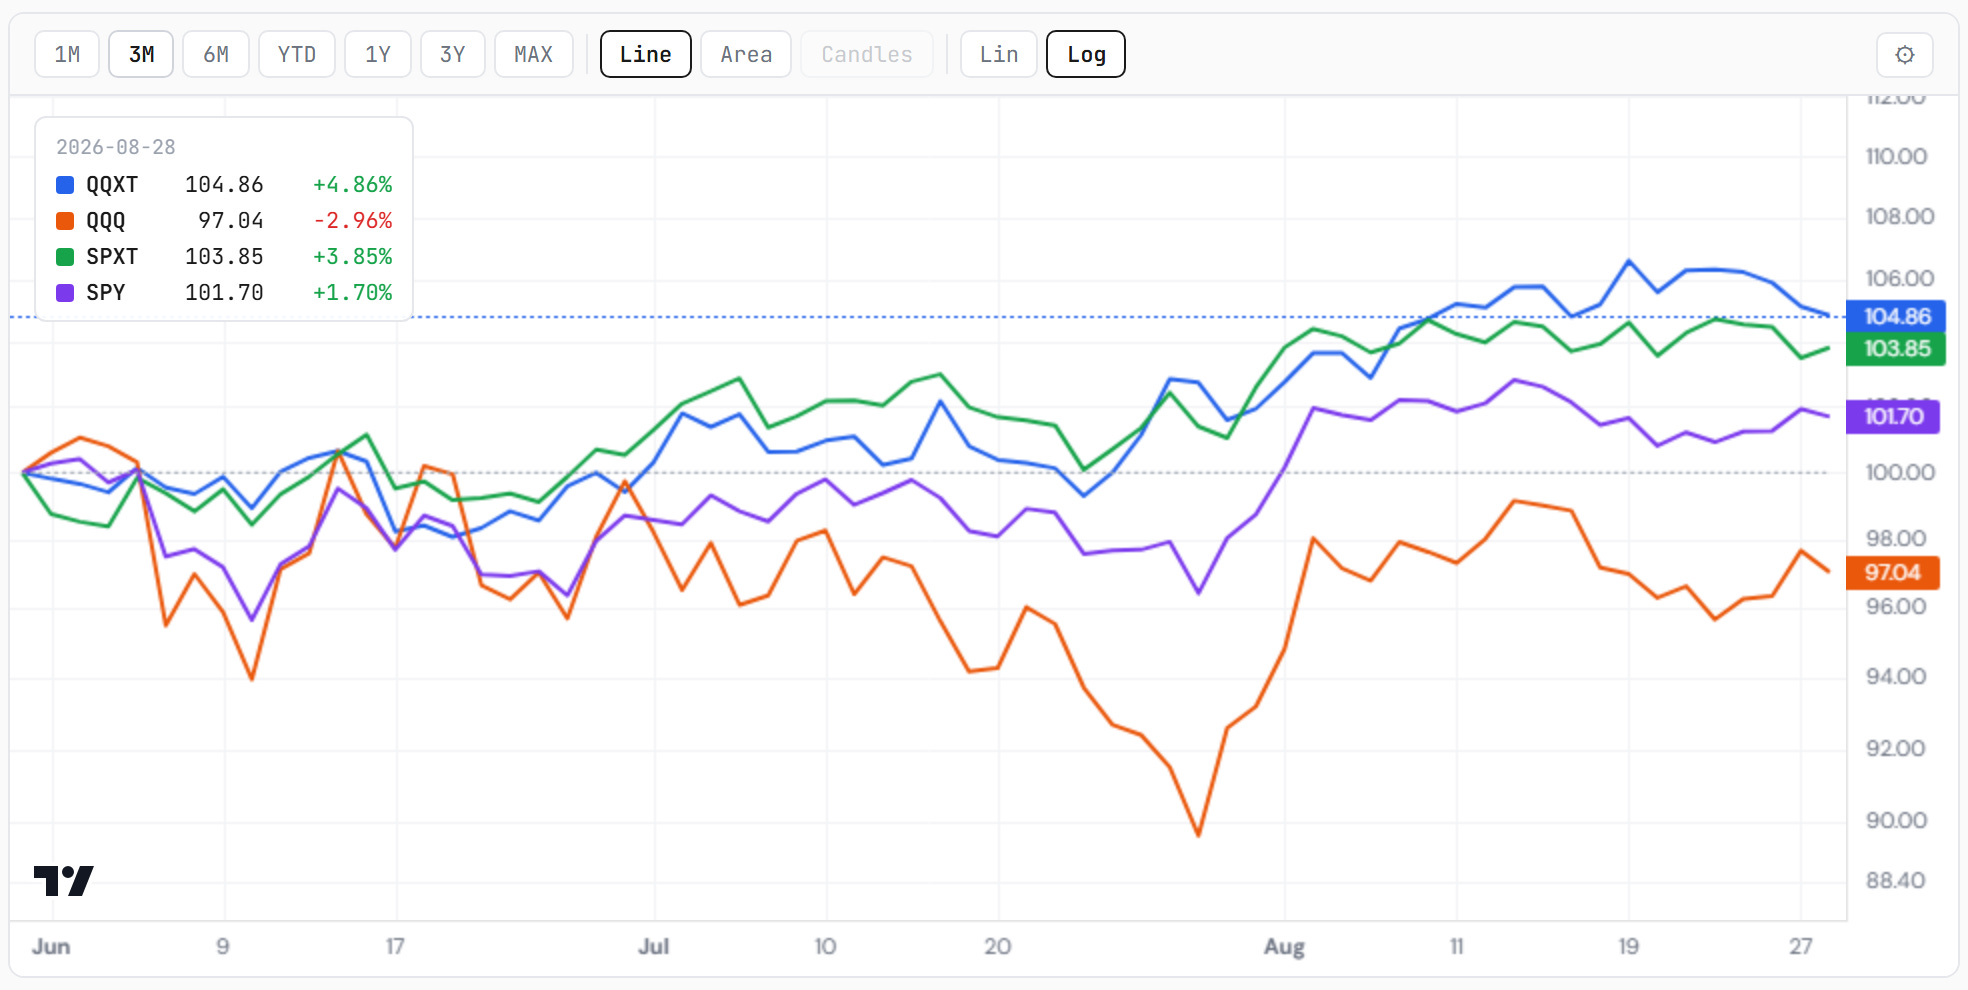
Five sessions inside a one-percent band: the S&P +0.47% to 769.35, the Nasdaq 100 +0.42% to 716.43 — back above the 50-day average it closed on to the cent last week — and the equal-weight S&P −0.44%. The VIX fell 4.6% to 14.43 in a week the market sold clean beats. Everything that happened this week happened underneath the index again. For the first time in five weeks, what happened underneath favoured the top of it.
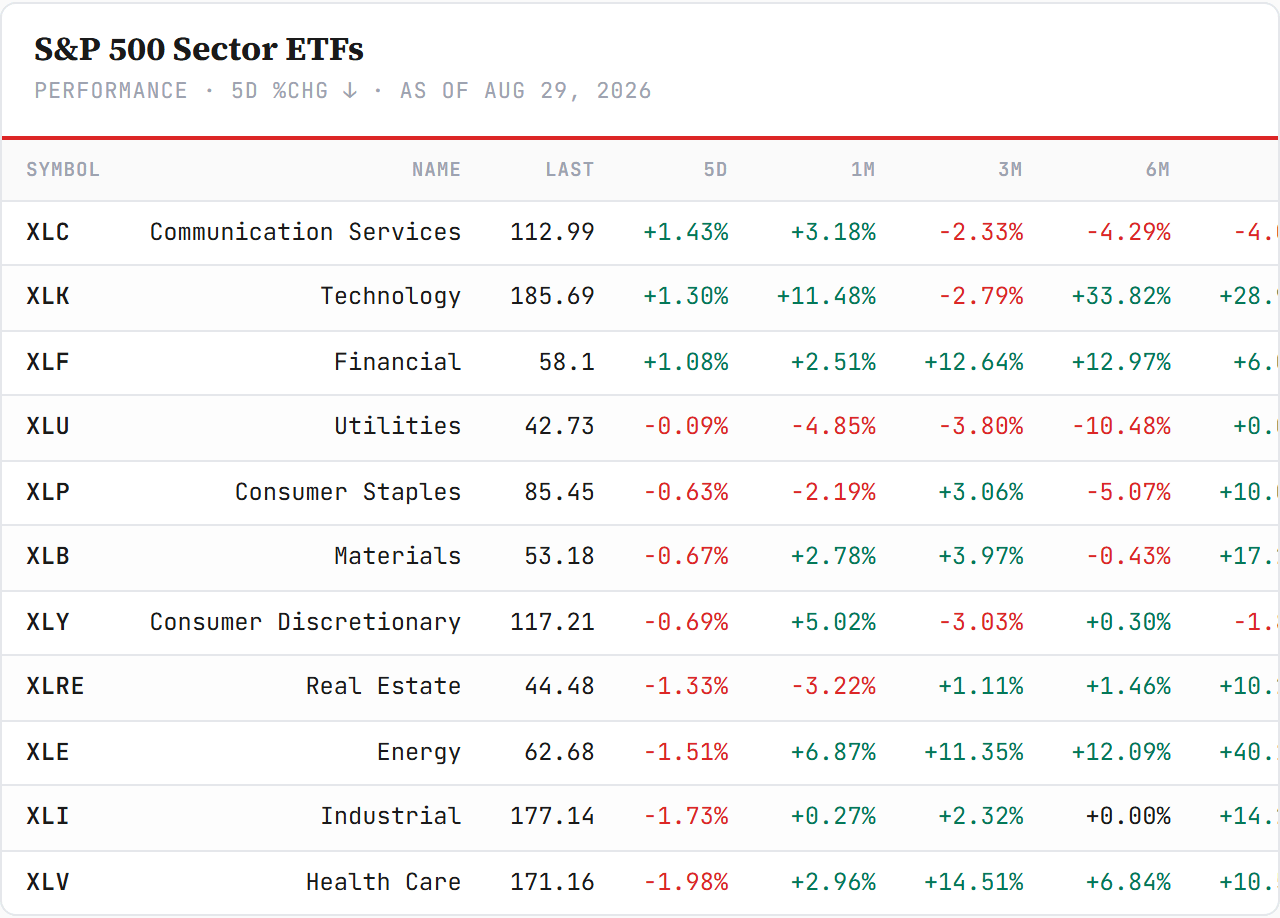
The sector read — the inversion, second week running. Three green of eleven, and they are last week’s bottom: communications +1.43%, technology +1.30%, financials +1.08%. Last week’s green three — health care, energy, materials — are in this week’s bottom five: XLV −1.98%, XLE −1.51%, XLB −0.67%. Utilities flat, staples and discretionary red, real estate −1.33%. Last week the sentence was “a board with the capex taken out and the non-tech growth put in”. This week the board put half the tech back in — the half that writes code — and took the non-tech growth back out. Two full inversions in two weeks is not leadership. It is a tape auditioning leaders and dismissing each after five sessions.
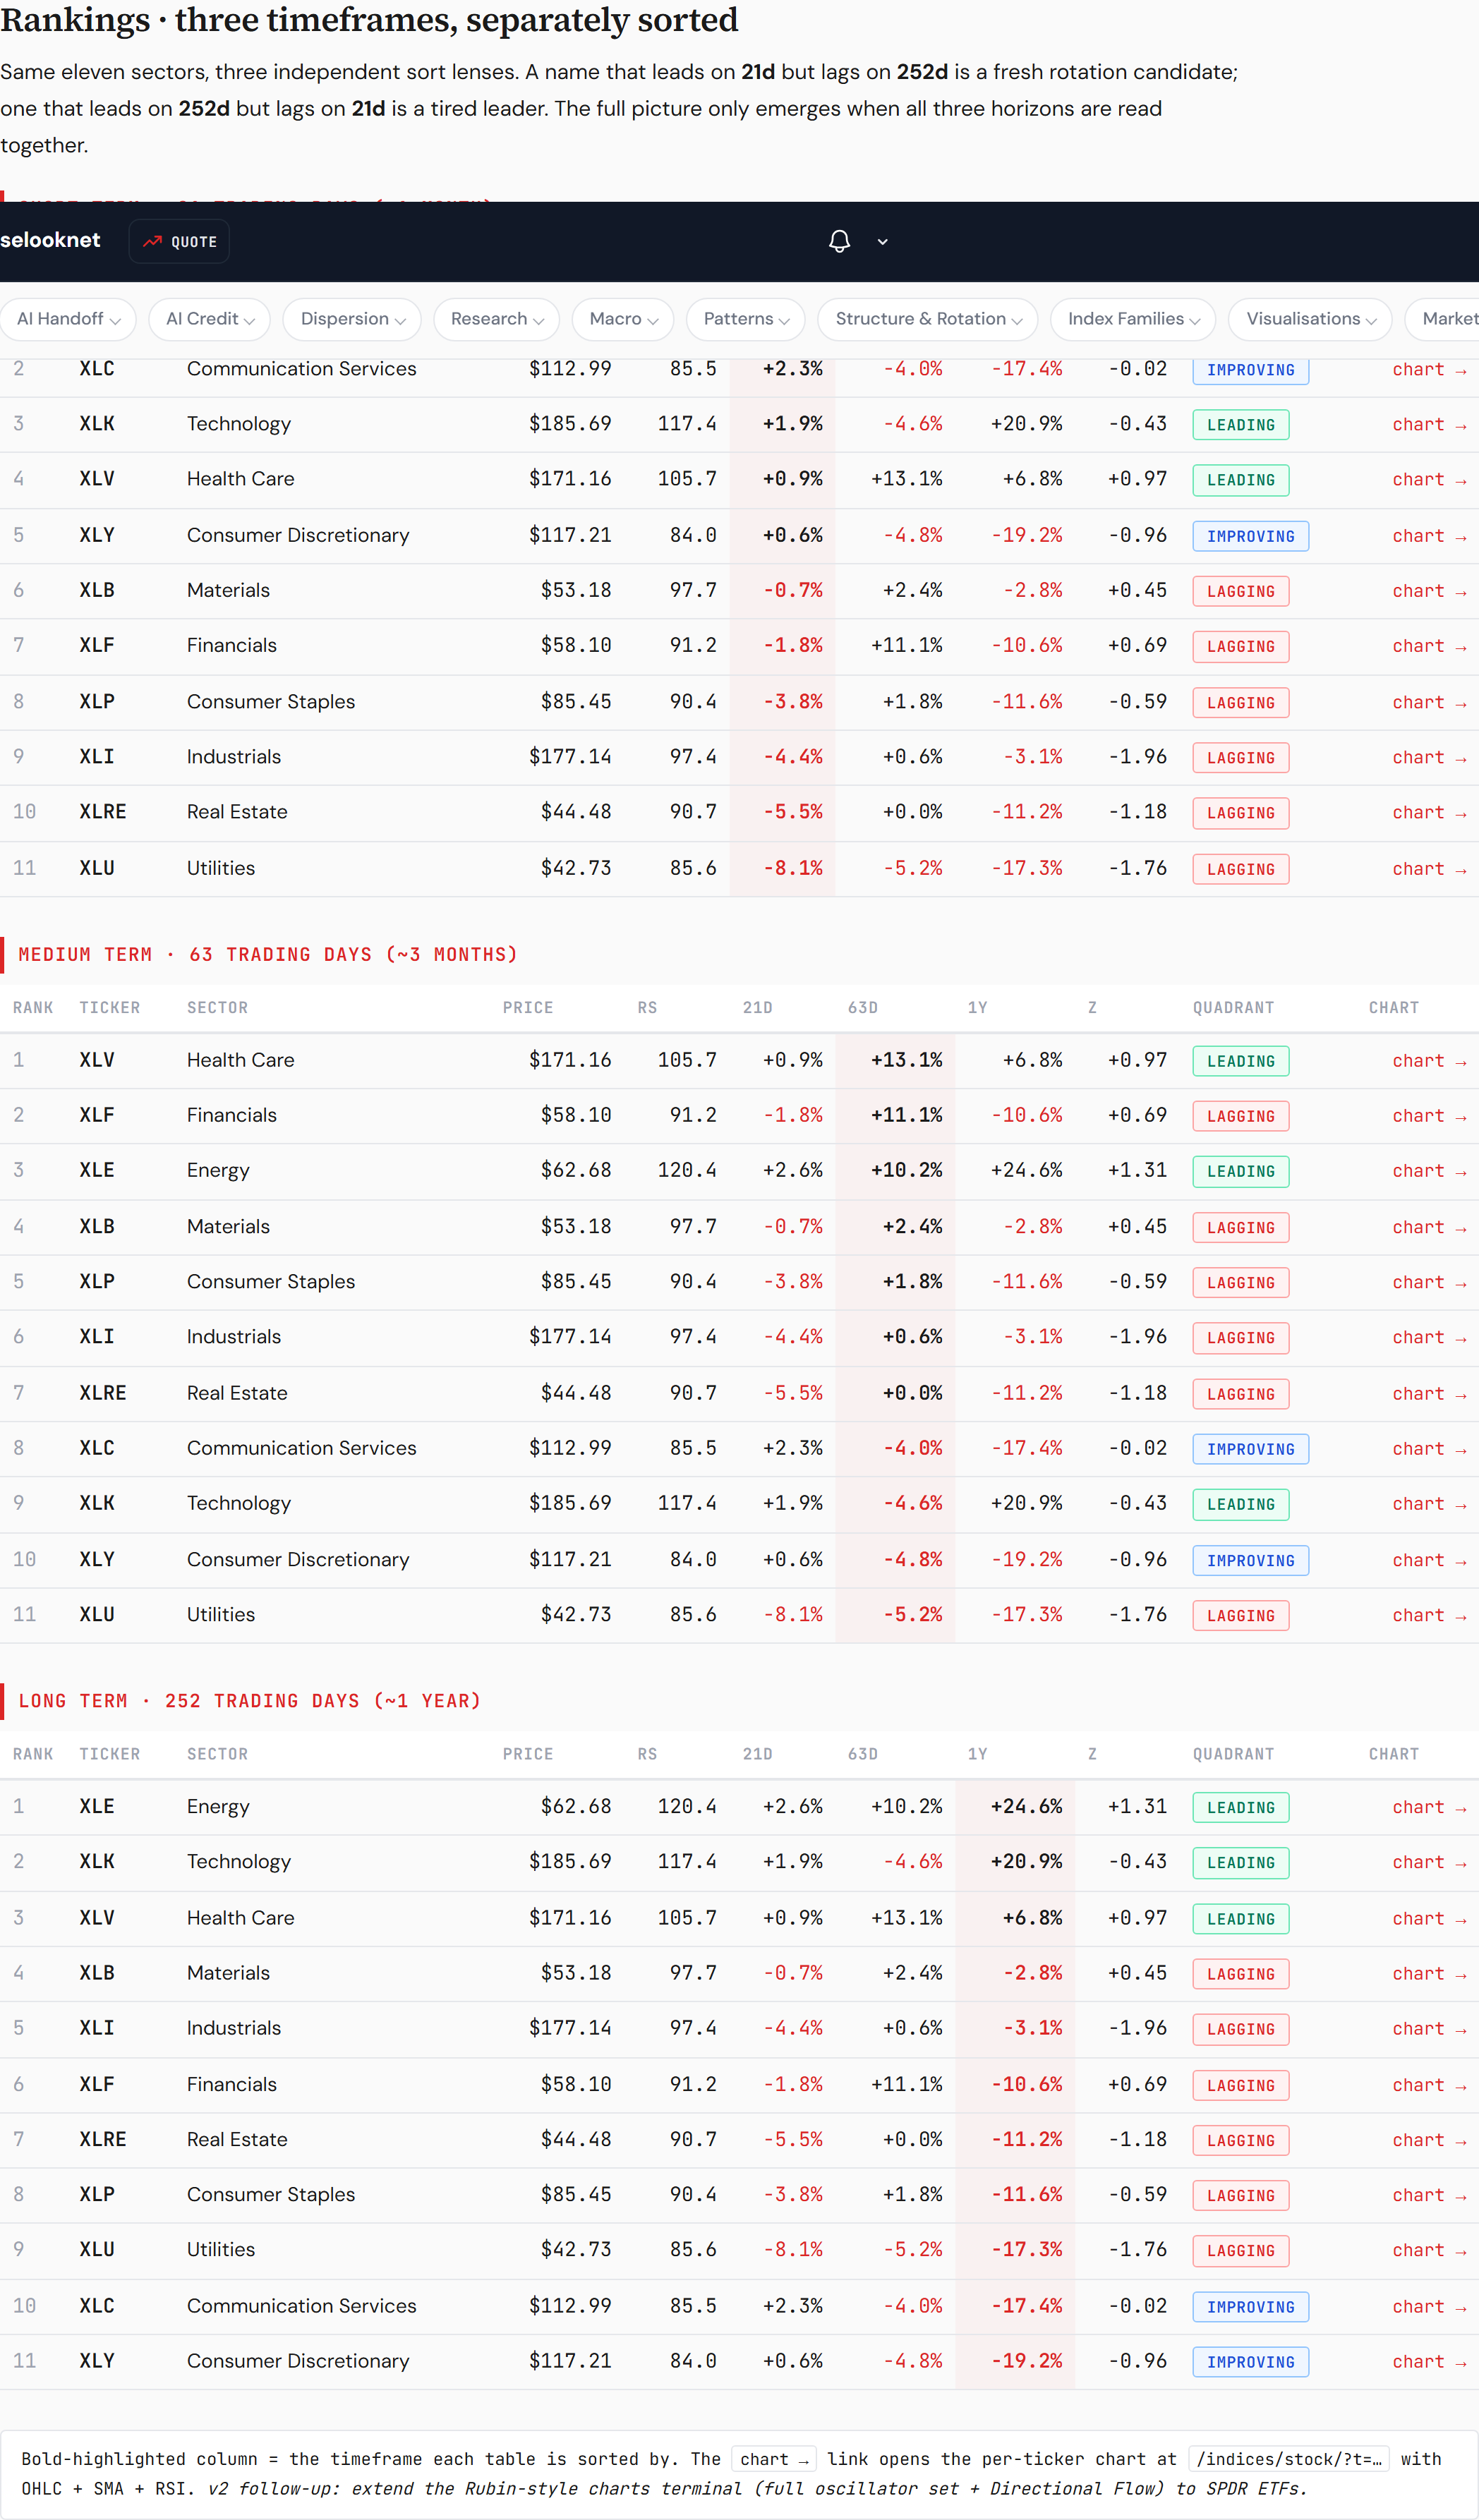
The sector rankings — relative strength, three lenses. Our sector-RS board reads the rotation’s speed. Technology, tagged Weakening last week with a negative 21-day read, has turned: +1.9% against the index over 21 days — the tired leader is repairing — though still −4.5% over 63: the quarter has not forgiven it yet. Health care keeps the quarter crown (+12.8% over 63 days) but the month is fading (+0.9%) — the same shape its breadth prints below. Energy +2.6% and +9.7% stays quietly strong on both lenses; financials −1.8% on the month against +10.9% on the quarter; materials near flat on both. And utilities is collapsing on every lens: −8.1% over 21 days, −5.5% over 63 — last on the board, in the week the long end rallied. The rotation is not just fast. It is now fast in both directions at once — tech repairing while its replacement leaders fade.
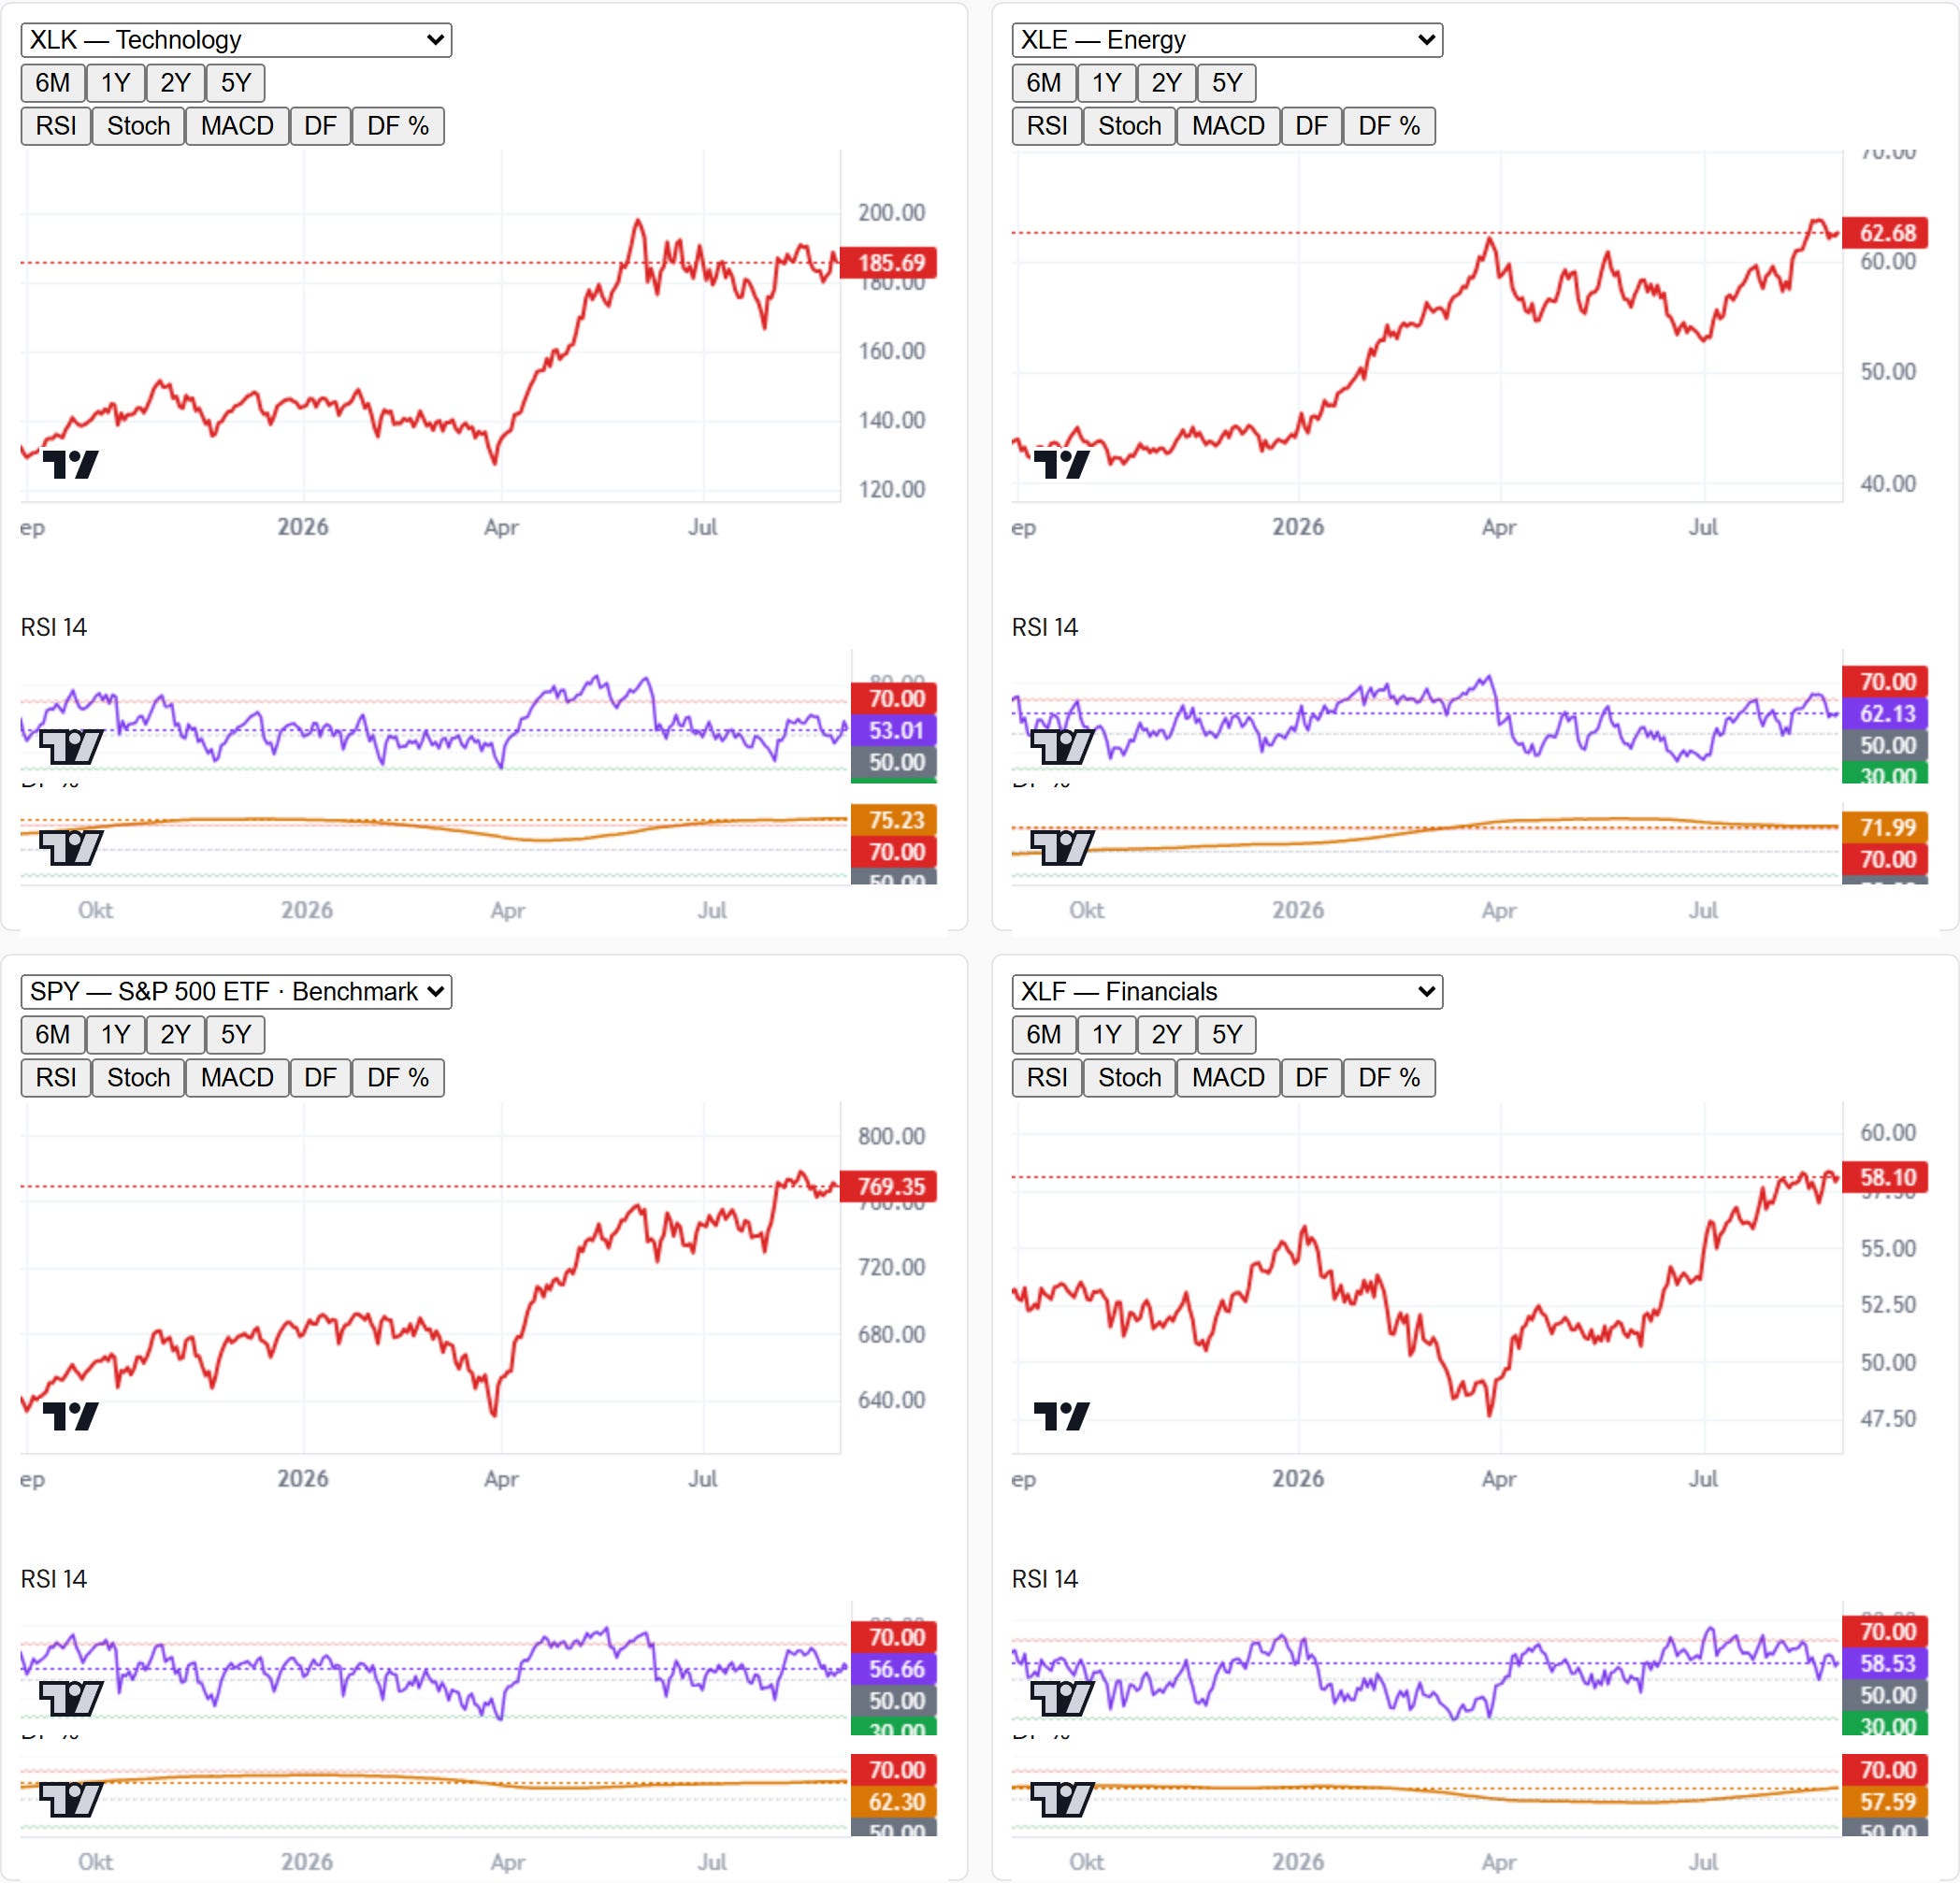
Underneath the four focus sectors — the breadth flipped with the boards. The dispersion pages show the members behind each ETF, and this week they show the rotation reaching the internals. Health care: still 76% of members above their 50-day — but 4 five-day highs against 24 five-day lows, a −20 differential, the exact inversion of last week’s 23-against-3. The sector that was “broad, not carried” spent this week broadly retreating. Technology: 50% above the 50-day, 14 five-day highs against 15 lows — balanced, no longer the narrowest sector on the board, its members firming as the ETF led. Materials 3 highs against 8 lows; financials 11 against 18 with 88% still above the 100-day — the medium-term structure intact, the week’s tape against it. One week ago the strong sectors were strong underneath and the largest sector was narrow underneath. This week the largest sector is the balanced one and last week’s leaders are printing lows. The internals rotate as fast as the surface now.


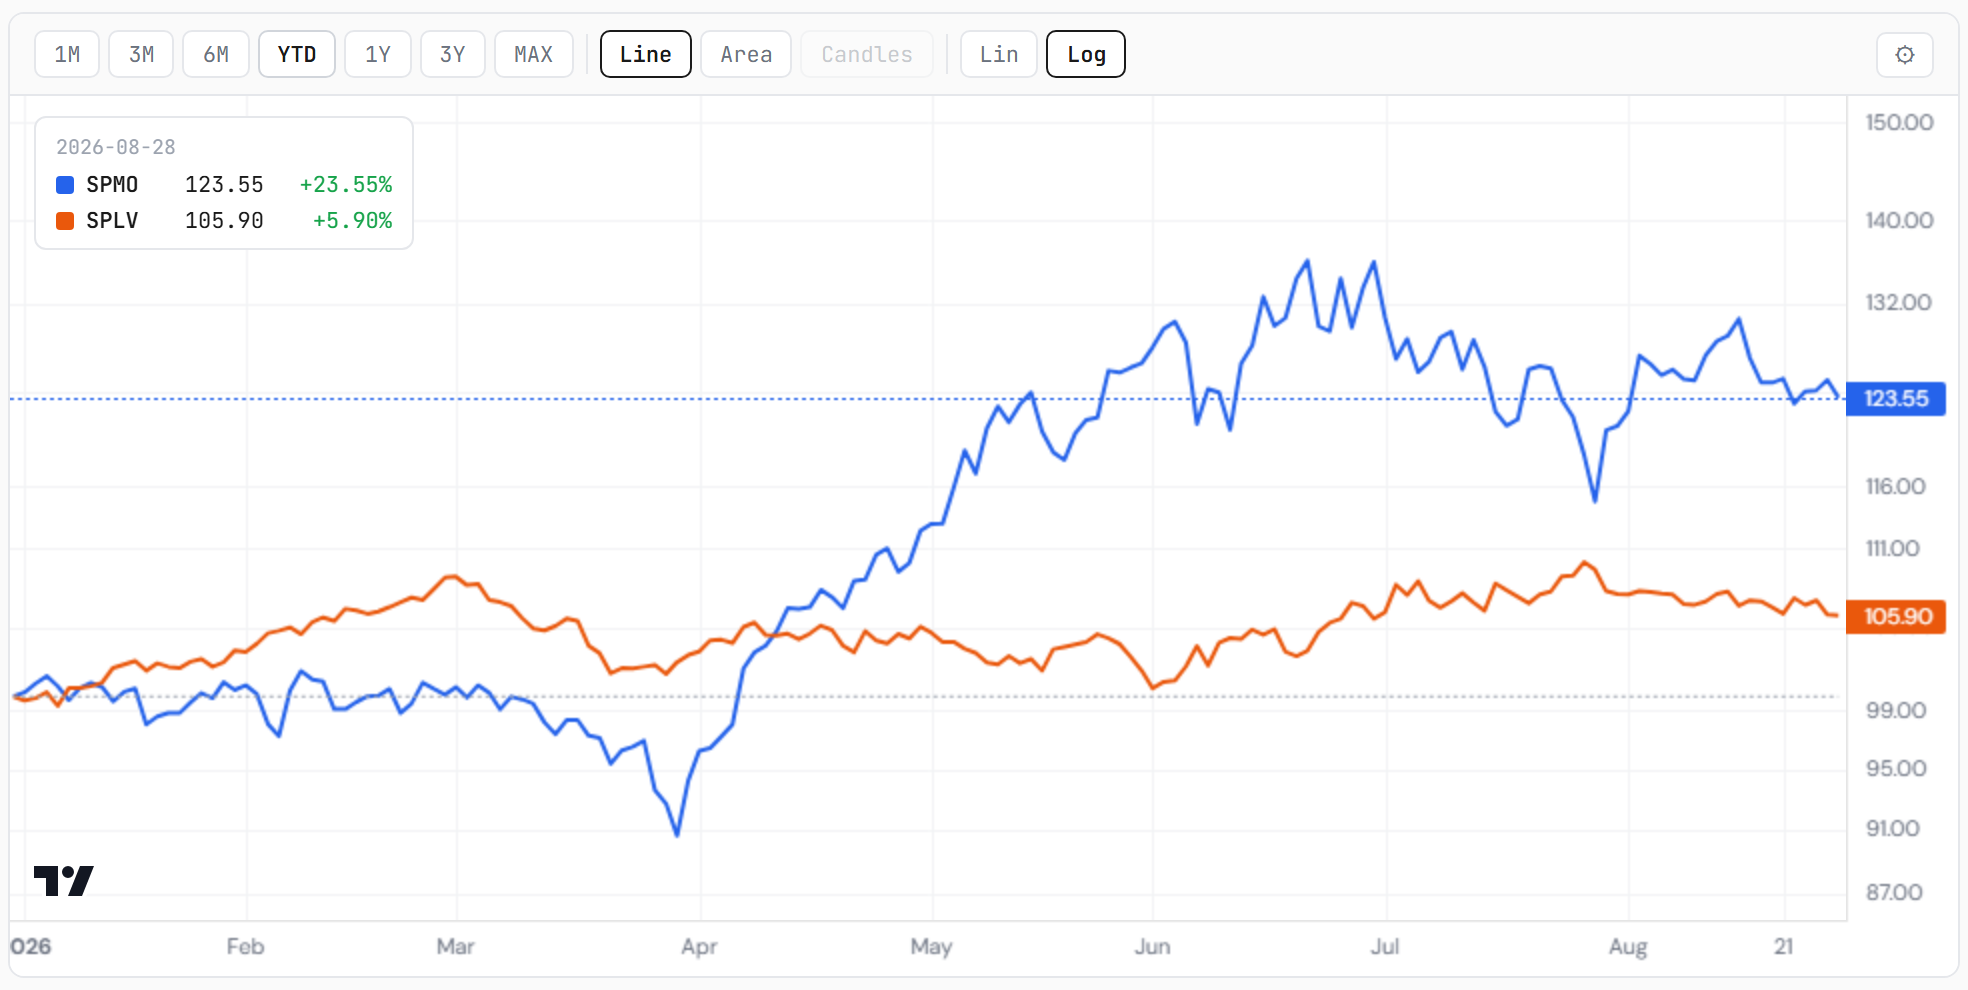
The factor read — repair attempt, below trend, percentile still bleeding. The factor-regime gauge holds its label from last week — momentum repair attempt below trend — and the numbers say the repair has not landed: the momentum-over-low-vol spread indexed at 155.25 against a 50-day at 157.22, still below trend, at the 89.7th percentile of its distribution — down from 92.3rd last week and 94.6th two weeks ago. The pair behind it went quiet rather than violent: SPMO −1.31% against SPLV −0.31%, the twenty-day rates of change now +2.05 against −1.51 — momentum winning the month — while the sixty-day still reads −5.36 against +4.71, the defensive leg owning the quarter. Saturday’s letter found the identical shape internationally: momentum three weeks under its failed breakout, min-vol making highs on Tuesday and fading them by Friday. On both continents, both ends of the factor spectrum keep refusing the baton. In a week when sectors and layers rotated violently, the style axis went still — which says the rotation is running through what companies do, not how their charts behave.
The axis, one week on — it inverted, and the destination is the story. Last week this letter re-drew the tape’s axis from software-vs-semis to tech-vs-everything-else, with the ex-tech cuts at three-year highs. One week later the axis inverted: the Nasdaq 100 ex-technology gave back 1.35% from that high while the Nasdaq 100 gained 0.42%; the S&P ex-tech lost 0.44% against the S&P’s +0.47%. The everything-else trade lasted exactly as long as every other leadership this tape has auditioned — five sessions.
Run the pairs explicitly, because each one carries its own sentence. Nasdaq 100 ex-tech against the Nasdaq 100 tech sleeve: −1.35% against +0.62% — the ex-tech cut that made a three-year high last week trailed its own tech sleeve by two points this week. S&P 500 ex-tech against the tech sector: −0.44% against +1.30% — same signature at index scale. The year-to-date order still reads the other way (the ex-tech cuts trail their parents on the year), which means this week did to the ex-tech trade exactly what the previous week did to tech: interrupted it without overturning it.
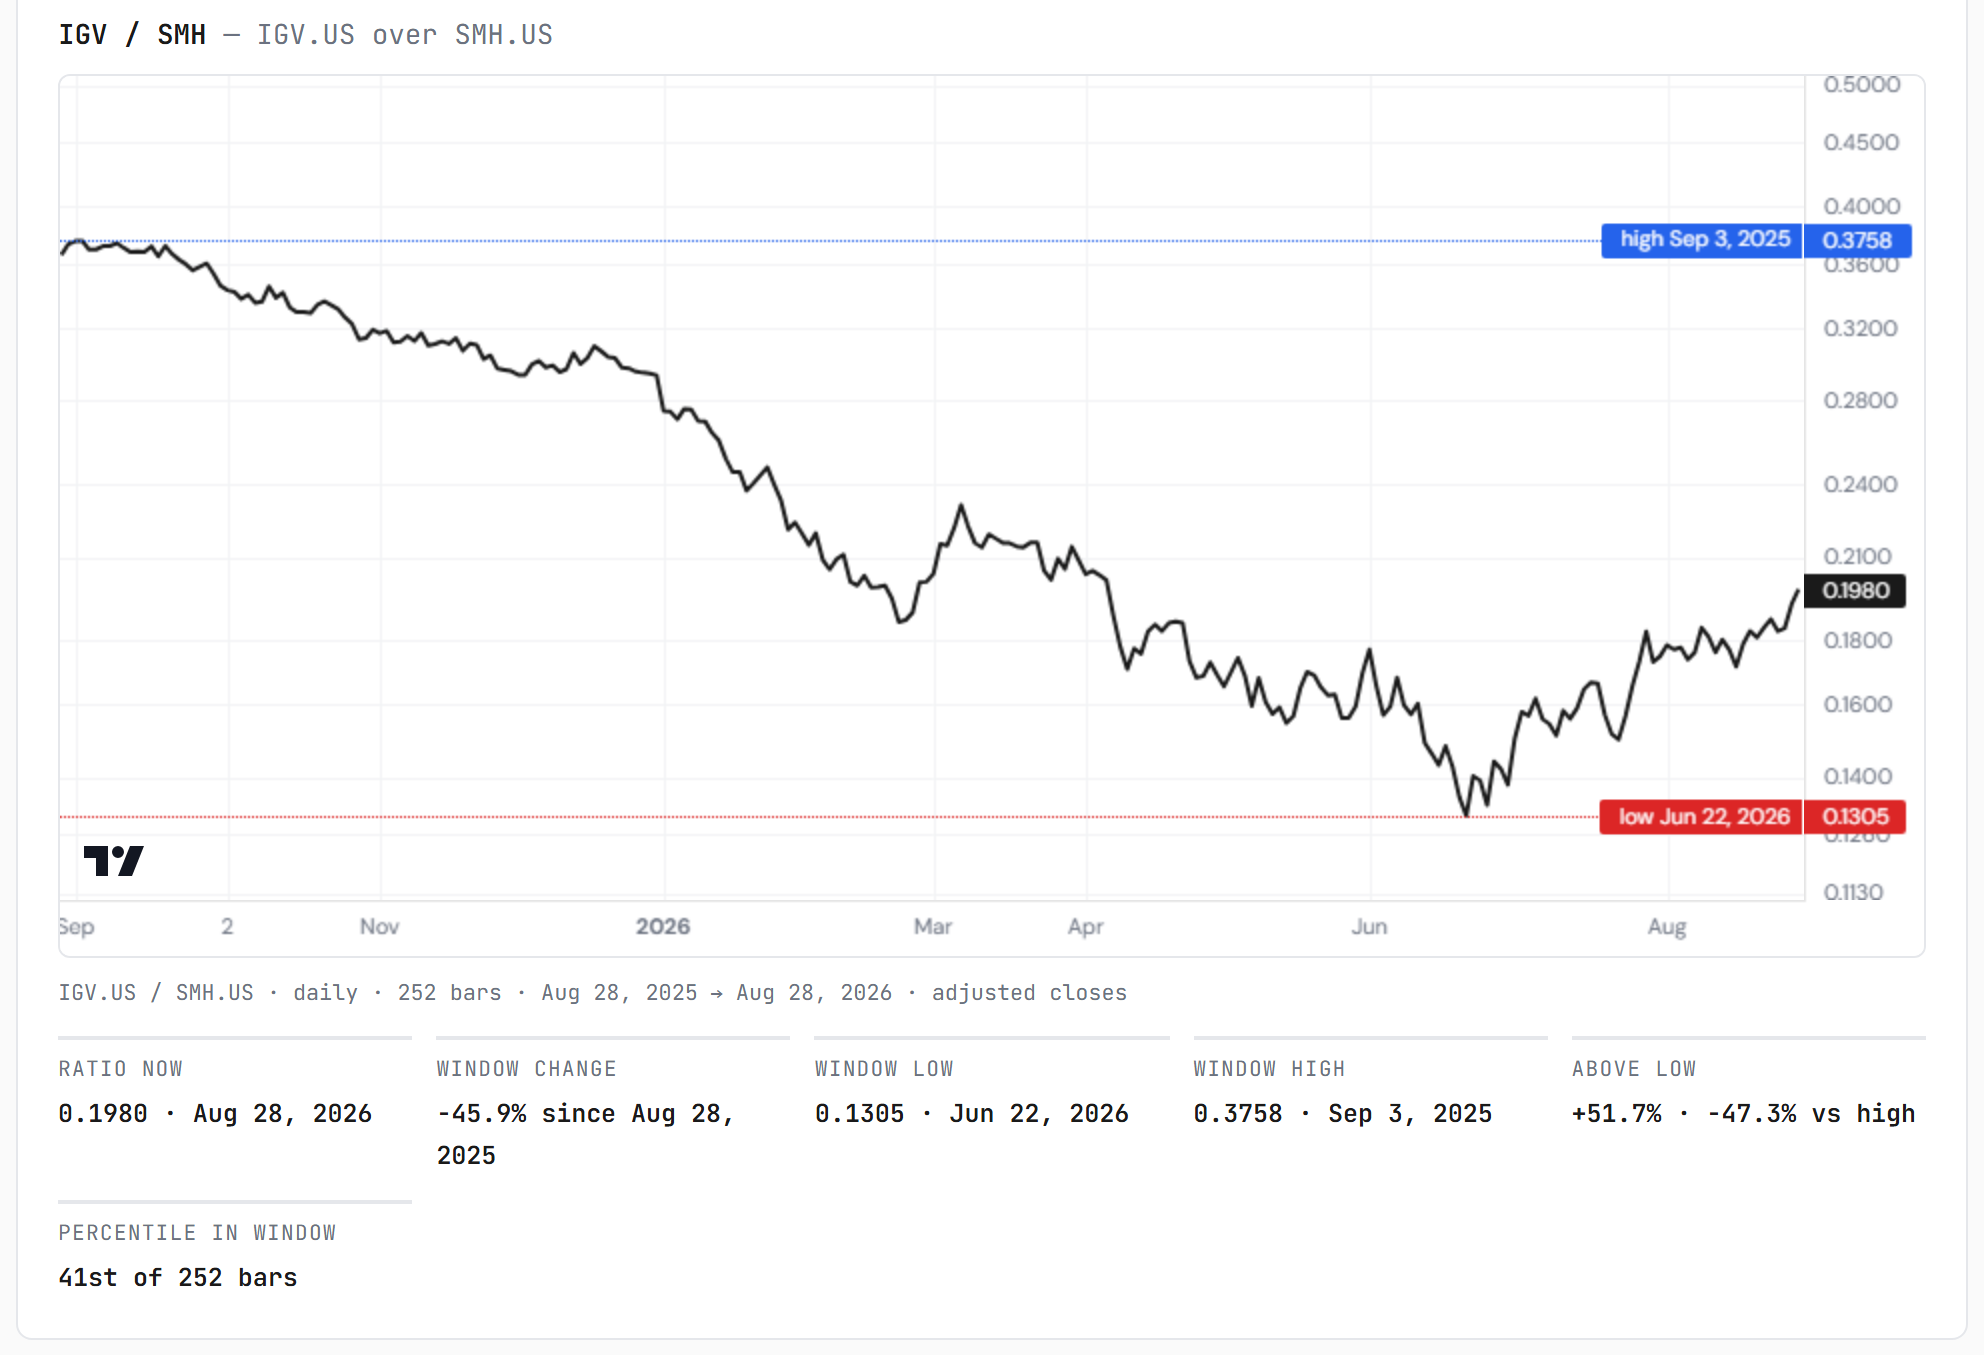
But the money did not go back to where it left. It went to two specific addresses inside tech, and to neither of the others. Software: IGV +5.93%, the best line on the tech board, through the 107.70 resistance that had capped it since June 1 — and, at +3.60%, green on the year for the first time since the winter. The last major sleeve underwater for 2026 surfaced this week. The pair board dates the move: the software-to-semis ratio bottomed on June 22 and is 52% off that low — a two-month trend this week extended, not a one-week bounce. And the balance sheets: the Magnificent-7 basket +2.66% against the equal-weight’s −0.44%. The silicon got neither half: XSD −3.29%, the worst tech line a second straight week, SMH −1.30%, the chip index within one percent of its floor. The axis is no longer tech-vs-everything-else, and it never went back to software-vs-semis as an internal affair. It is now the layer axis: code and balance sheets in; silicon, operators and last month’s defensive growth out.
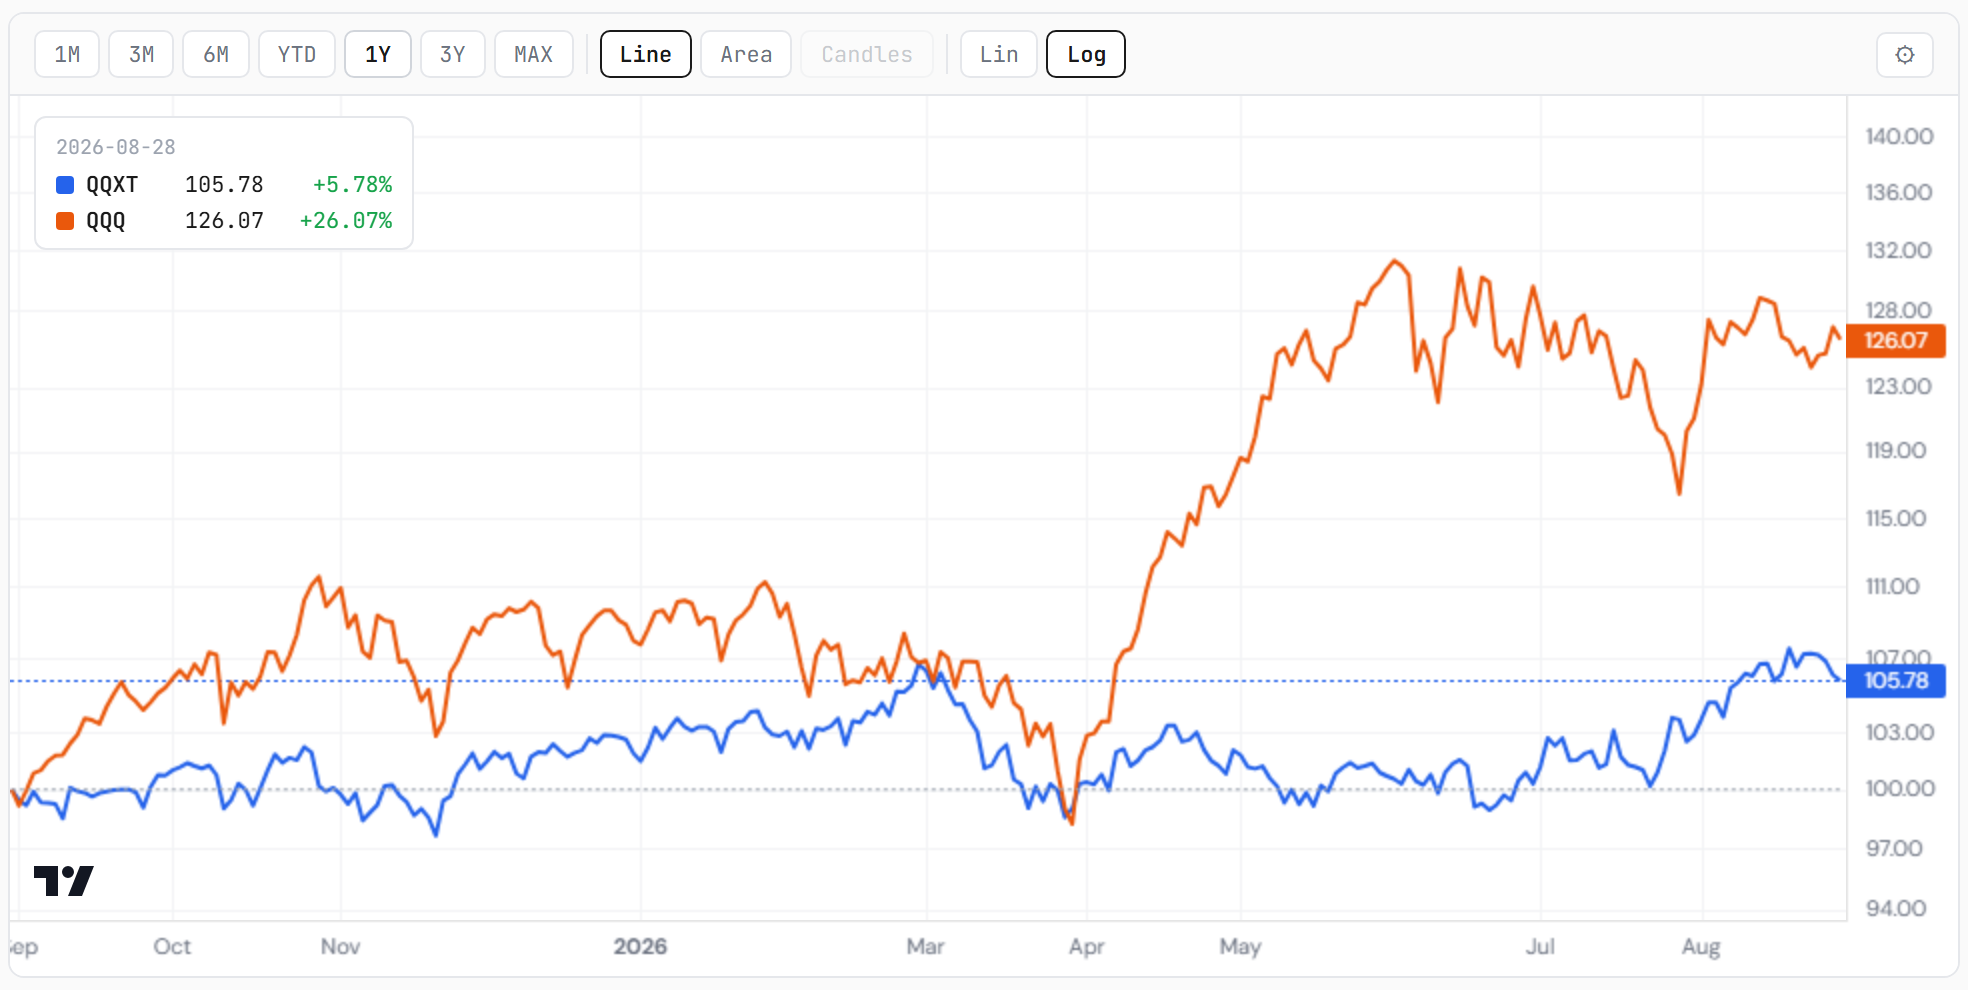
Underneath it, the participation statistic that defined the last month broke: the defaults beat the average stock for the first time in five weeks — the Mag-7 basket +2.66% against equal-weight −0.44%, cap-weight above equal-weight in both indices. For four consecutive weeks this letter tracked the largest names trailing a resilient average stock and asked whether it was rotation or distribution. This week supplied the answer neither reading predicted: re-concentration. The money that left the defaults came back — on a hawkish keynote, into the names that finance themselves.

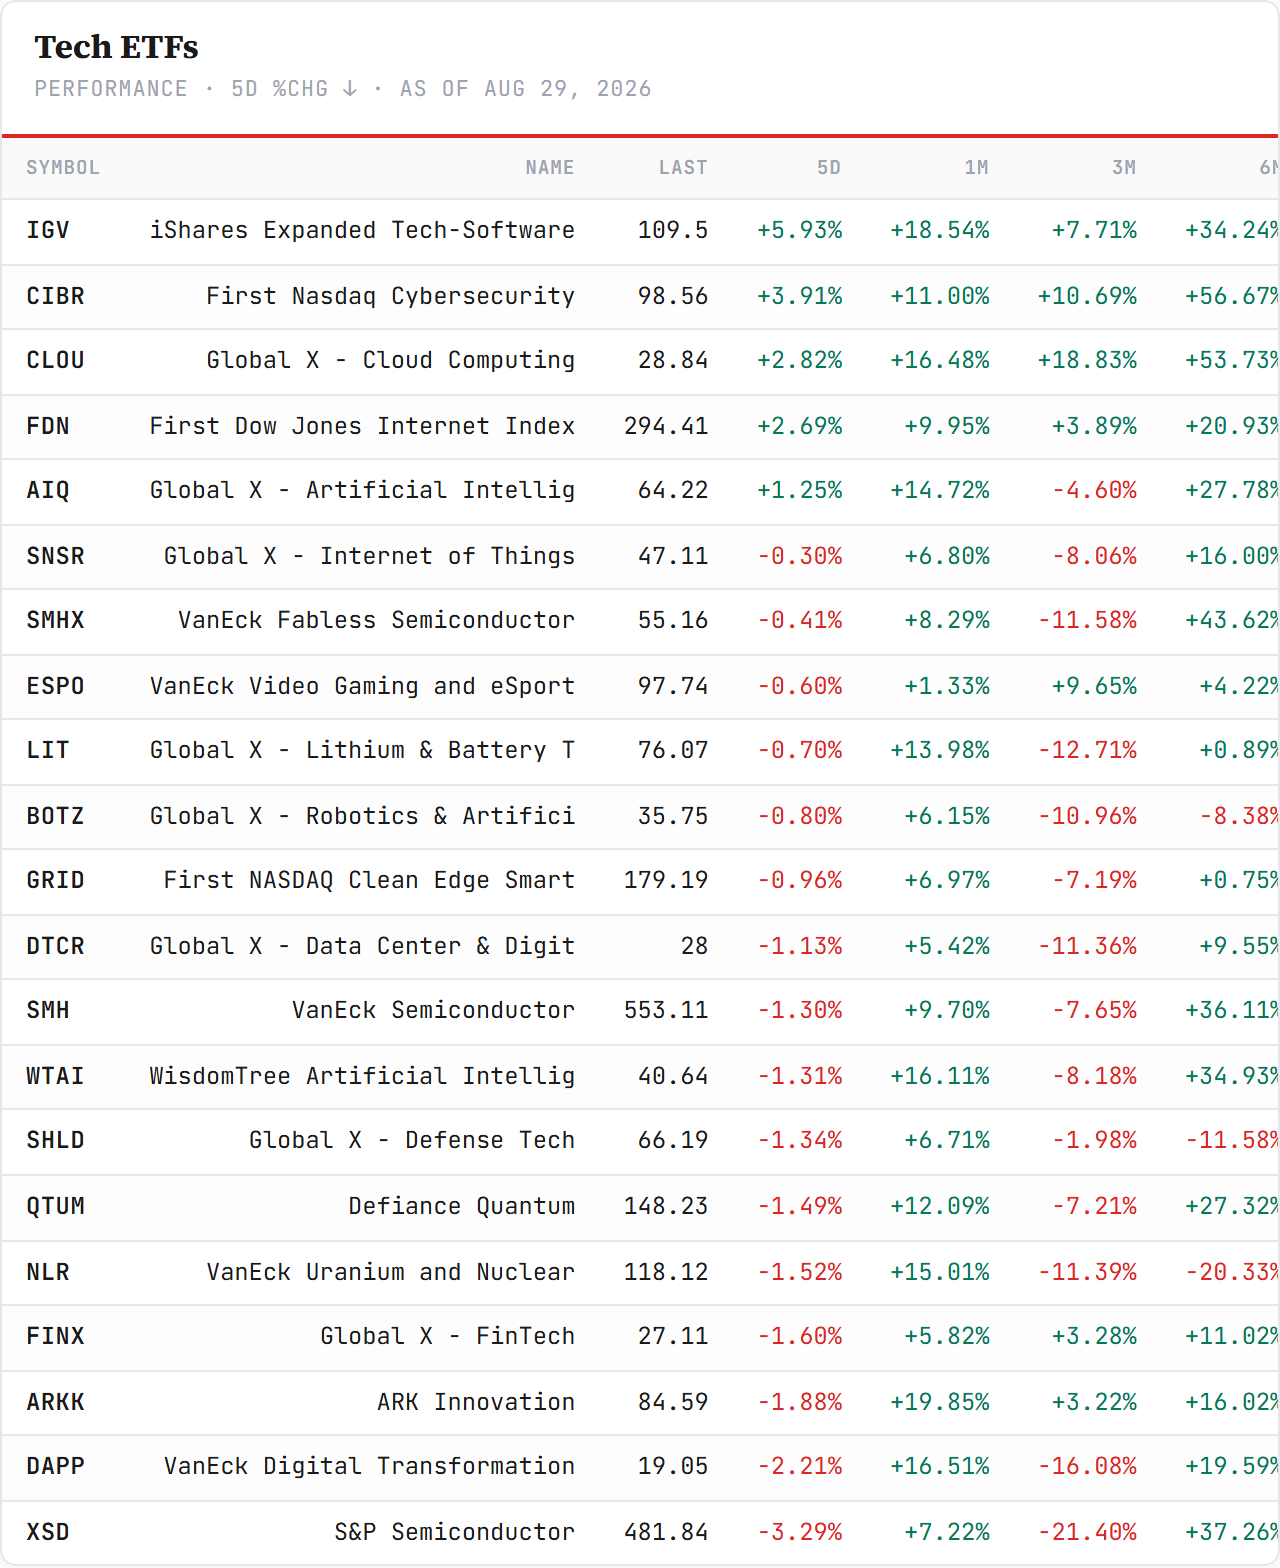
Inside tech — the split is now the whole board. Five green lines, all of them the layer above the chip: software +5.93%, cybersecurity +3.91%, cloud +2.82%, internet +2.69%, AI applications +1.25%. Sixteen red, led down by the silicon and its adjacents: XSD −3.29%, DAPP −2.21% (with the coin’s fade), ARKK −1.88%, fintech −1.60%, nuclear −1.52%, quantum −1.49%. Two weeks ago the split was one week old and this letter called it a tell. It is now a three-week trend with a dated bottom, a broken resistance, and the year’s first green print on the software sleeve. The layer axis runs through this board most visibly of all.
2 · The State
The sorting rule found its axis: the market pays the layer, not the beat. Last week the rule narrowed to “nothing gets paid”. This week it split cleanly in two — by layer, not by quality. The software prints were paid, and paid large: Okta +23.0% on the week on a double beat with raised guidance, Salesforce +22.4%, Elastic +16.3% (+19.3% in Friday daylight alone), CrowdStrike +13.8%, ServiceNow +12.6%, Workday +5.8% on its own beat-and-raise. The hardware and infrastructure prints were charged, whatever they reported: Rubrik, a clean beat-and-raise, sold 13.1% in Friday daylight; Marvell −10.3%; IREN −12.5% — and Fabrinet, the entry-premium exhibit of two weeks ago, bled a further 5.1% without printing anything. Same week, same tape, same quality of report; opposite verdicts, sorted entirely by what layer of the stack the reporter lives in.
Nvidia’s print is the rule’s largest exhibit. The eleventh consecutive double beat — revenue $96.0 billion against roughly $92 billion — with a fiscal-2028 outlook the CEO framed as supply-capped: demand above 70% growth, shipping at 70%. The market’s answer, in two sessions: paid +8.74% on Thursday to 227.98, half refunded on Friday, −4.57% to 217.55. A +1.32% week for the guide that would have been worth ten percent in April. The scoring window closes at Monday’s close, and it closes on a number the market has already argued itself into and half out of. On this record the printed columns were foregone; the two-day reaction shape — pay, then refund half on the macro — is the new information, and it rhymes with everything else the week did.
The 70% number, taken seriously. Fiscal 2028 runs roughly across calendar 2027, so what Wednesday’s call delivered was a growth forecast for next year, given tonight — and its construction is the unusual part. Huang’s exact framing: “Even though our demand is much greater than 70%, our supply allows us to confidently deliver 70%.” That is not a demand forecast with execution risk; it is a shipping schedule with demand overflow — the cap is the fabs, the packaging and the power, not the order book. The CFO added that customer forecasts “point to our growth doubling next year.” Read against this letter’s four layers: a supply-capped 70% year at the supplier is the strongest statement the capex thesis has ever received — and the market’s response was to pay the applications layer, half-refund the supplier, and keep selling the operators who rent the constrained compute. Either the market is looking through 2027 to what comes after the catch-up, or it is repricing the discount rate on everything that needs financing before it gets there. Friday’s keynote argues for the second reading; Monday’s scoring close and Wednesday’s Broadcom print will grade it.
The chart pick, scored and staged. Robinhood, published two Fridays ago at 95.10, scored +9.6% at its one-week checkpoint — recorded in the edition’s own scoring note, next checkpoint late September. Friday’s third edition published Synopsys pre-open with the machine block showing its Directional Flow still negative and accelerating down against a seven-driver fundamental repair — and the stock promptly fell 4.8% in the daylight session, the entry printing below the reference. The record keeps both: the pick that ran and the pick that opened red. That is what a published track record is for. And one lane of the thesis got independent confirmation this week: the EDA sub-index inside the buildout was its best line at +5.98% — the design-software lane leading the index it sits in, the same week its flagship name was charged. Layer paid, name charged: the rule again, one level down.
The veto, scored at the close: failed a third time — from the highest push yet. IEF spent midweek comfortably above the line — 93.51 on Tuesday, the strongest reclaim attempt of the three — and closed Friday at 92.85. Three consecutive weeks now: push through 93.17 midweek, sold back by Friday, each push from higher than the last. TLT held its floor again (82.88 against 81.2, +1.01% — the best line on the cross-asset board). The long end actually rallied into the buyback window — the 30-year finishing at 5.207% from 5.275% — while the belly kept getting sold on Fridays. The bond market has now declined to sign the equity resolution three weeks running, each refusal more emphatic in its intraweek shape, and Saturday’s letter adds the Pacific half: the yen closed through its wire for the first time, and Japan’s 30-year printed another era high. The veto stands, and its company got worse.
The macro print was a podium, not a datapoint. Warsh’s first Jackson Hole keynote as chair: the 2% vow, prices first, the bet that AI aids labor supply — with Hammack calling for hikes the same day and the July minutes’ three dissents behind them both. The direction had exactly one session to trade, and that session sold gold 1.9%, the miners near four, and bid the dollar and the balance-sheet megacaps. One session is one session; the question it opens — blip or September template — is section 4’s, and the market’s first answer was the rate-hike-era playbook to the letter: Amazon +3.97%, Alphabet +1.74%, Microsoft +1.68%, Apple +1.63%, Meta +1.21%, while Nvidia gave back 4.57% and the beat-and-raises were sold. When the discount rate leans up, the market buys the companies that fund themselves and sells the ones that need the capex cycle. Friday was a clean specimen.
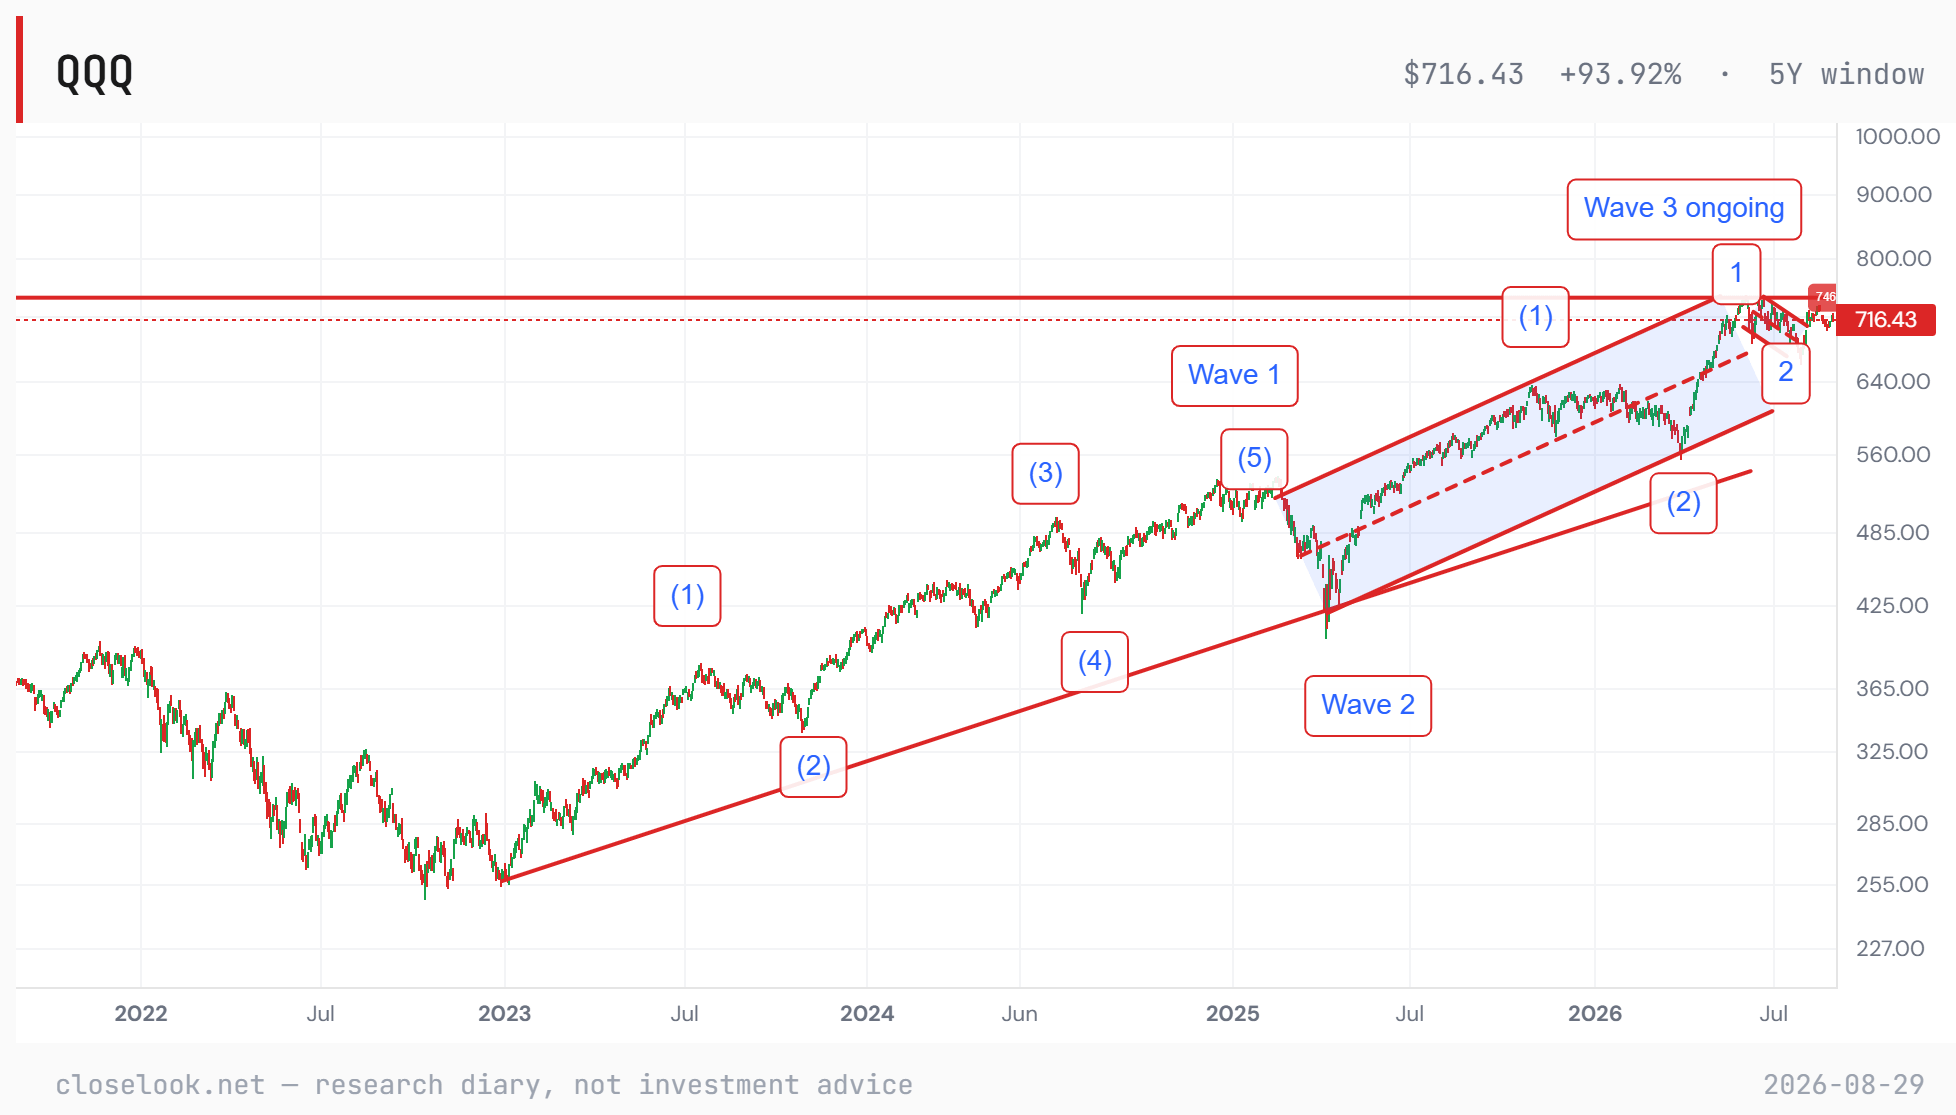
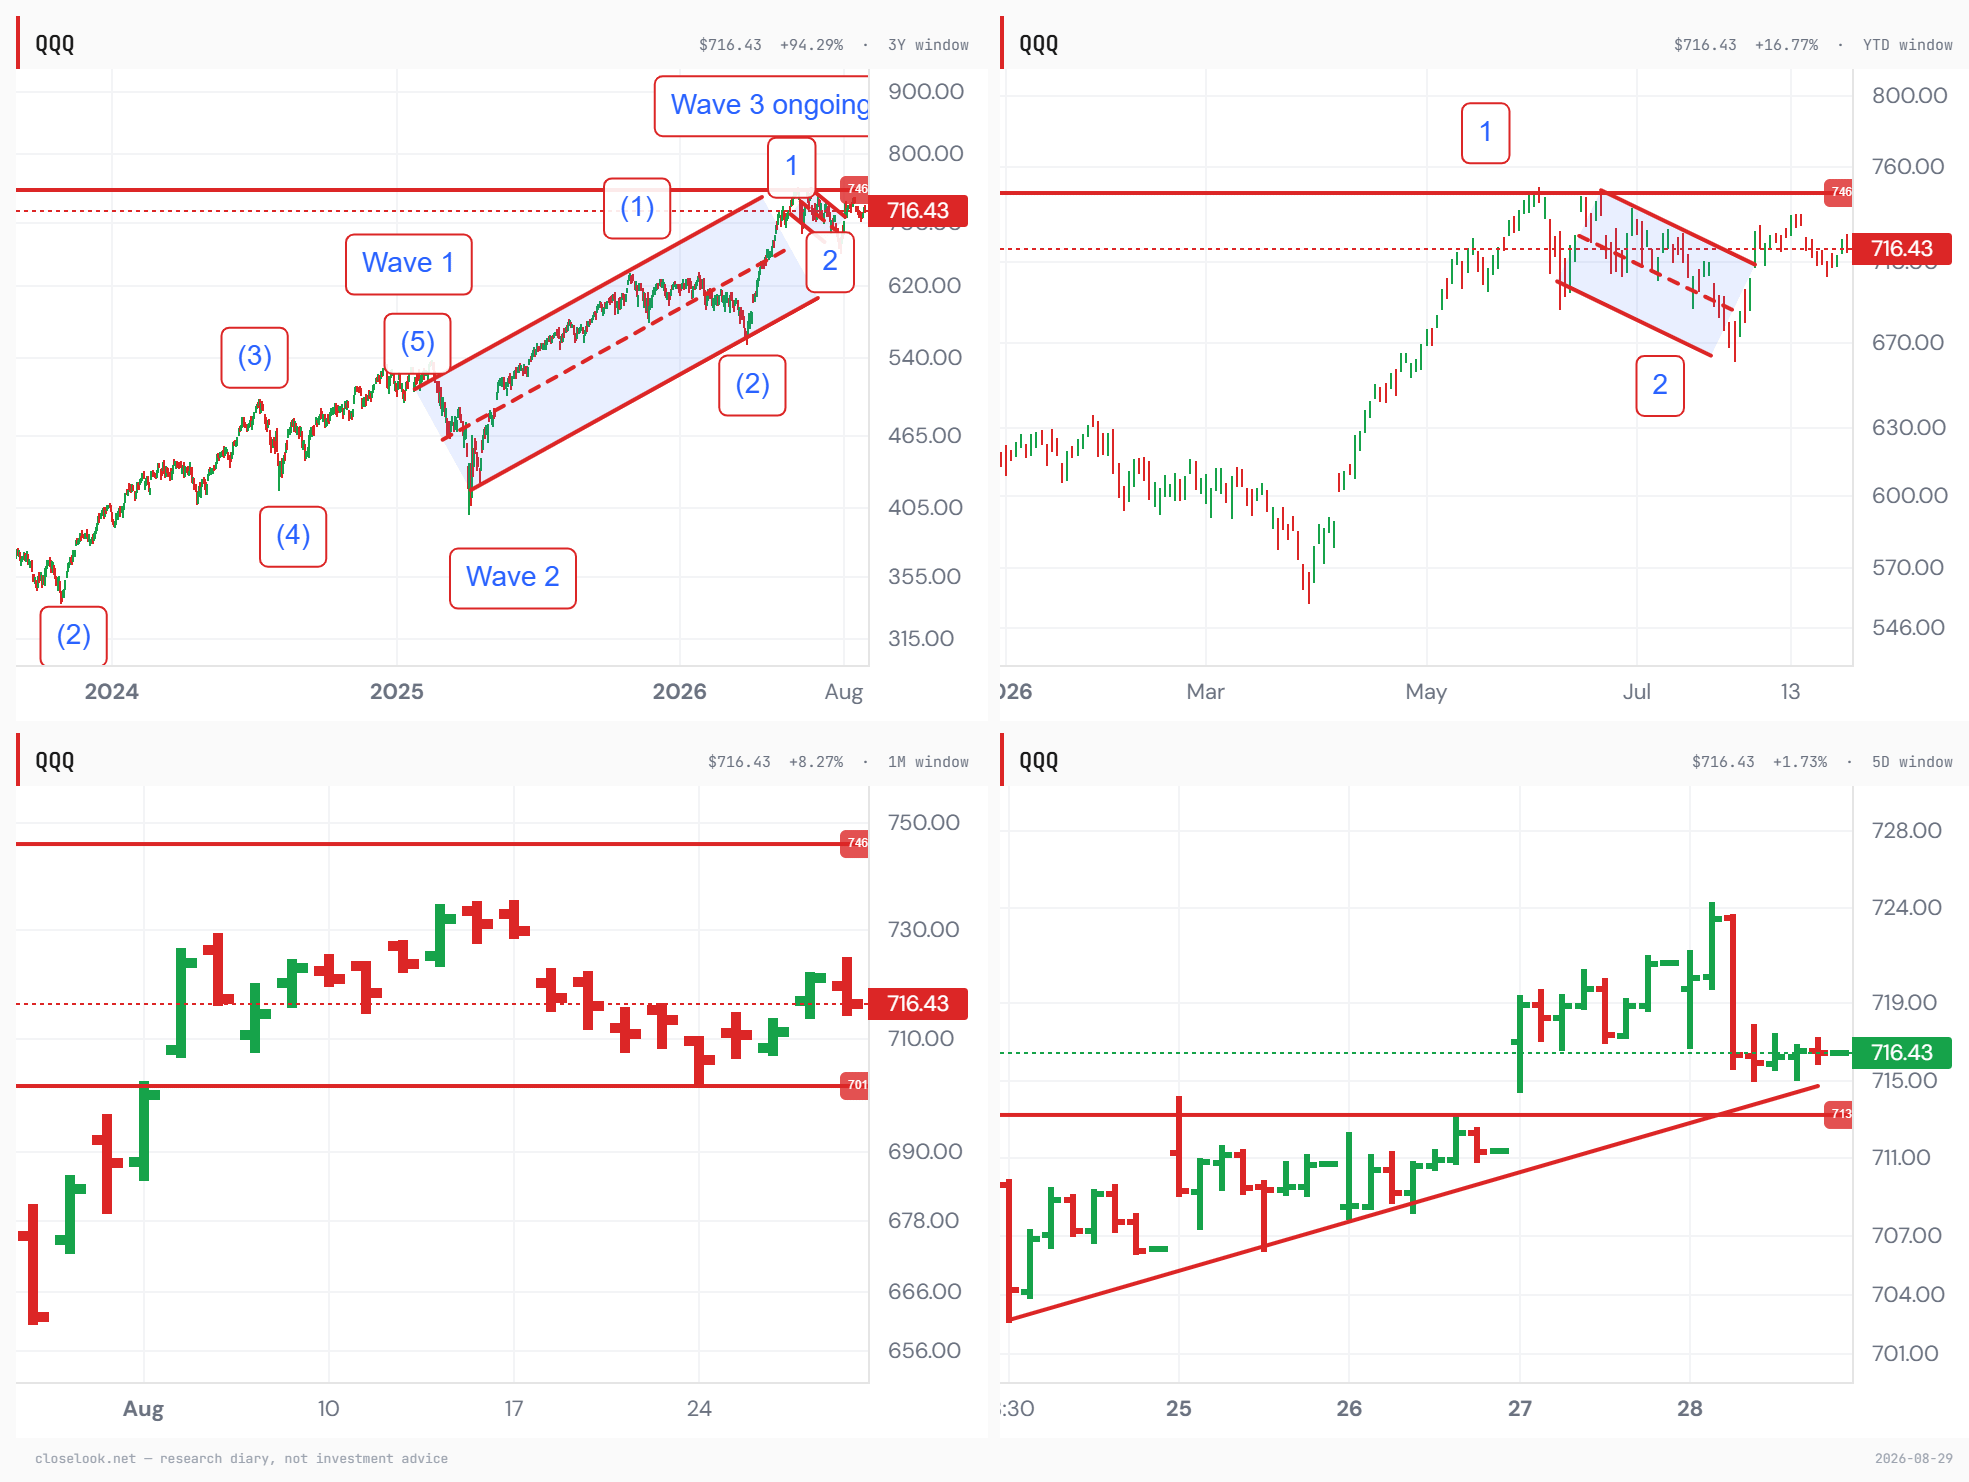
The count — back above the average, both lines still live. The Nasdaq 100 reclaimed the 50-day it closed on to the cent last week: 716.43 against 712.06. The map is unchanged — 1-2 off the April low, wave 3 ongoing, 746.16 the confirmation (4.1% above), 694 the kill-switch (3.1% below) — and the week moved the index from the average to just above it without approaching either line. Saturday’s letter carries the five-year count on the world ex-US — wave 3 still progressing, the stall reading as a pause — and the two counts agree: postponement inside an advance, not a topping structure. Both counts also carry the same caveat: the falsifiers are close enough to answer quickly.
The same chart at four focal lengths. The house grid runs the count through its windows: the three-year view carries the wave structure — 1 and 2 complete, wave 3 ongoing inside its channel; the year-to-date view shows this summer’s 1-2 sequence against the 746 line; the one-month view frames the index between 746 above and the 701 August shelf below; and the five-day view shows the week’s own micro-structure — an ascending triangle pressing against the 713 line, resolved upward into Friday’s close at 716. Four windows, one reading: an advance pausing at descending focal lengths, with the smallest window the only one that resolved this week — and it resolved up.
3 · The Outlook
The four indices — the money went back into the thesis, and picked its lightest layer. The family printed the layer axis in one row: Agentic Winners +4.68% (the applications — all nine sub-indices green, and at −0.12% YTD one ordinary week from going green on the year for the first time since January), Agentic Ecosystem +1.59% (the opex layer; +60.9%), Rubin Build-Out −1.77% (the capex layer; +87.1%), HALO −2.25% (broad growth, no AI thesis; +6.0%) — with Euro-AI +0.4% across the Atlantic, +32.9% on its year.
The control group flipped, and that is the week’s most important internal. Last week HALO held flat while the AI layers bled — an AI unwind, not a growth unwind. This week HALO fell 2.25% while the applications rose 4.68% and the opex layer rose too: an AI bid inside a growth sell — the exact mirror. Two weeks, two opposite verdicts, same one-week cadence as every other board. What was bought in both weeks: the application layer. What was sold in both: nothing — which is the sideways market in one sentence. The index carrying no AI thesis, which last week was the house expression of the axis, spent this week as its casualty: longevity −3.2% after leading, speculative −7.4%, space −7.3%, only Asia-Pacific and payments green.
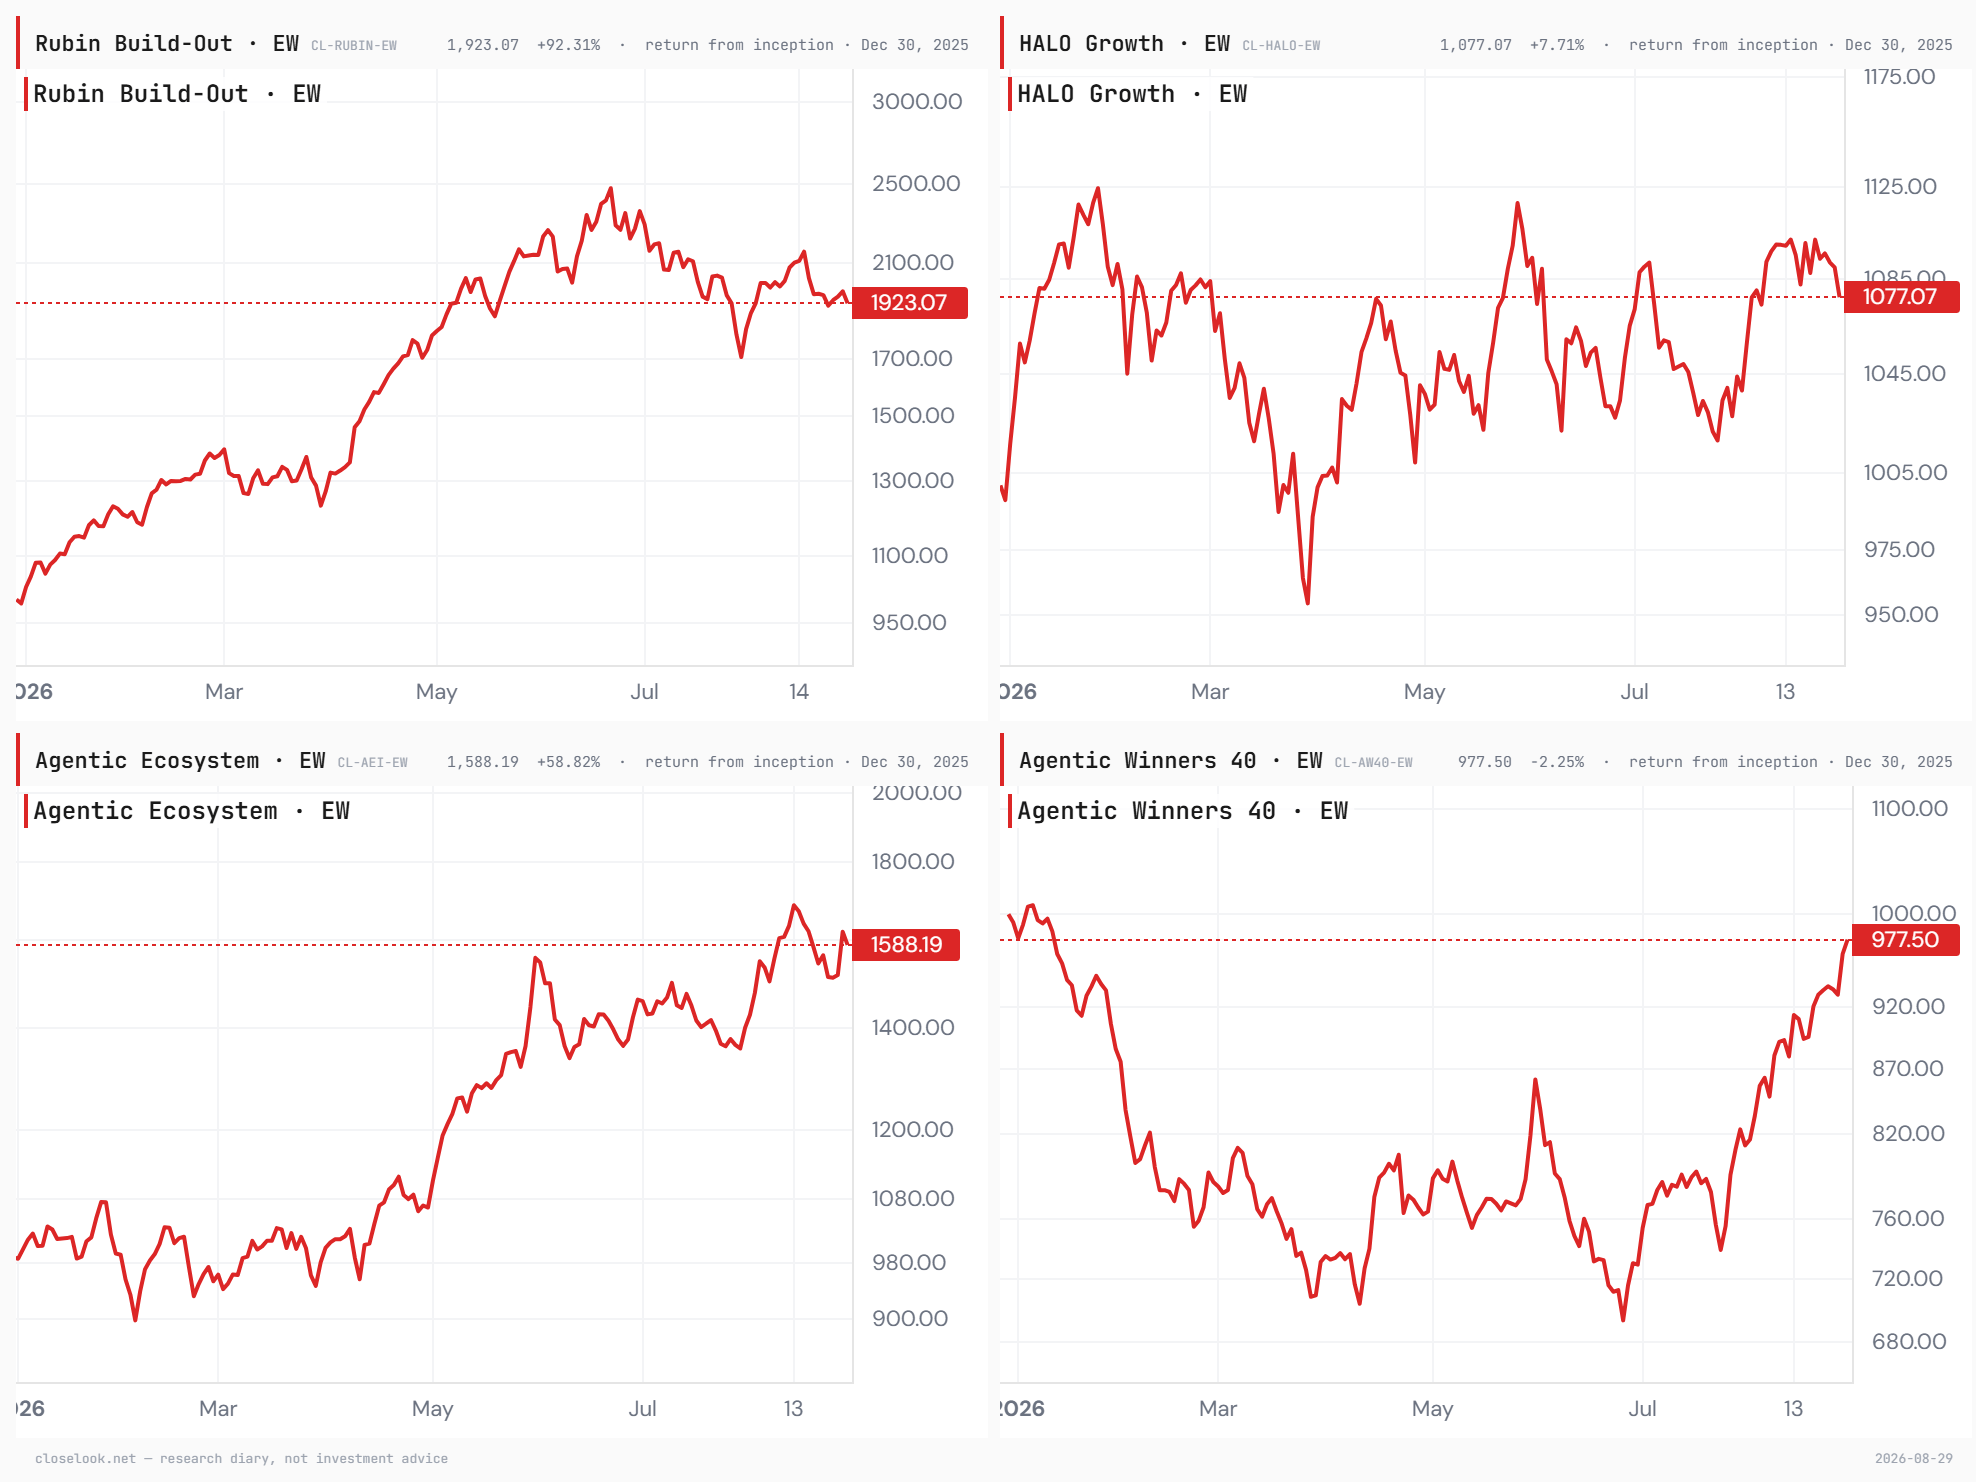
Inside the indices — where the week actually happened. Inside Rubin the best line was EDA & chip IP +5.98% — the buildout’s software — with design +3.55% and the chip architects +2.34% behind it, while HBM Memory, last week’s only green sub-index, fell 4.01% into the bottom five in the same week Korea’s fund confirmed its breakout in dollars. The bottom is unchanged in character: DC construction −6.69%, storage −6.18%, fab subsystems −5.15%, testing & metrology −5.04%. Inside the Agentic Ecosystem the security stack got paid outright: identity, trust & governance +13.66% — the best sub-index in the entire four-family system — operations & observability +5.84%, govern & secure +5.74%, agentic security +3.72%; at the bottom, compute operators −4.02% and foundation models −3.40% against their +723% year. Inside Agentic Winners, everything: control plane +7.87%, enterprise +5.84%, application leaders +5.51%, and megacap gateway +3.38%, green again after two red weeks, still the only sub-index positive on the year. No rotation inside the layer. The whole layer was bought.
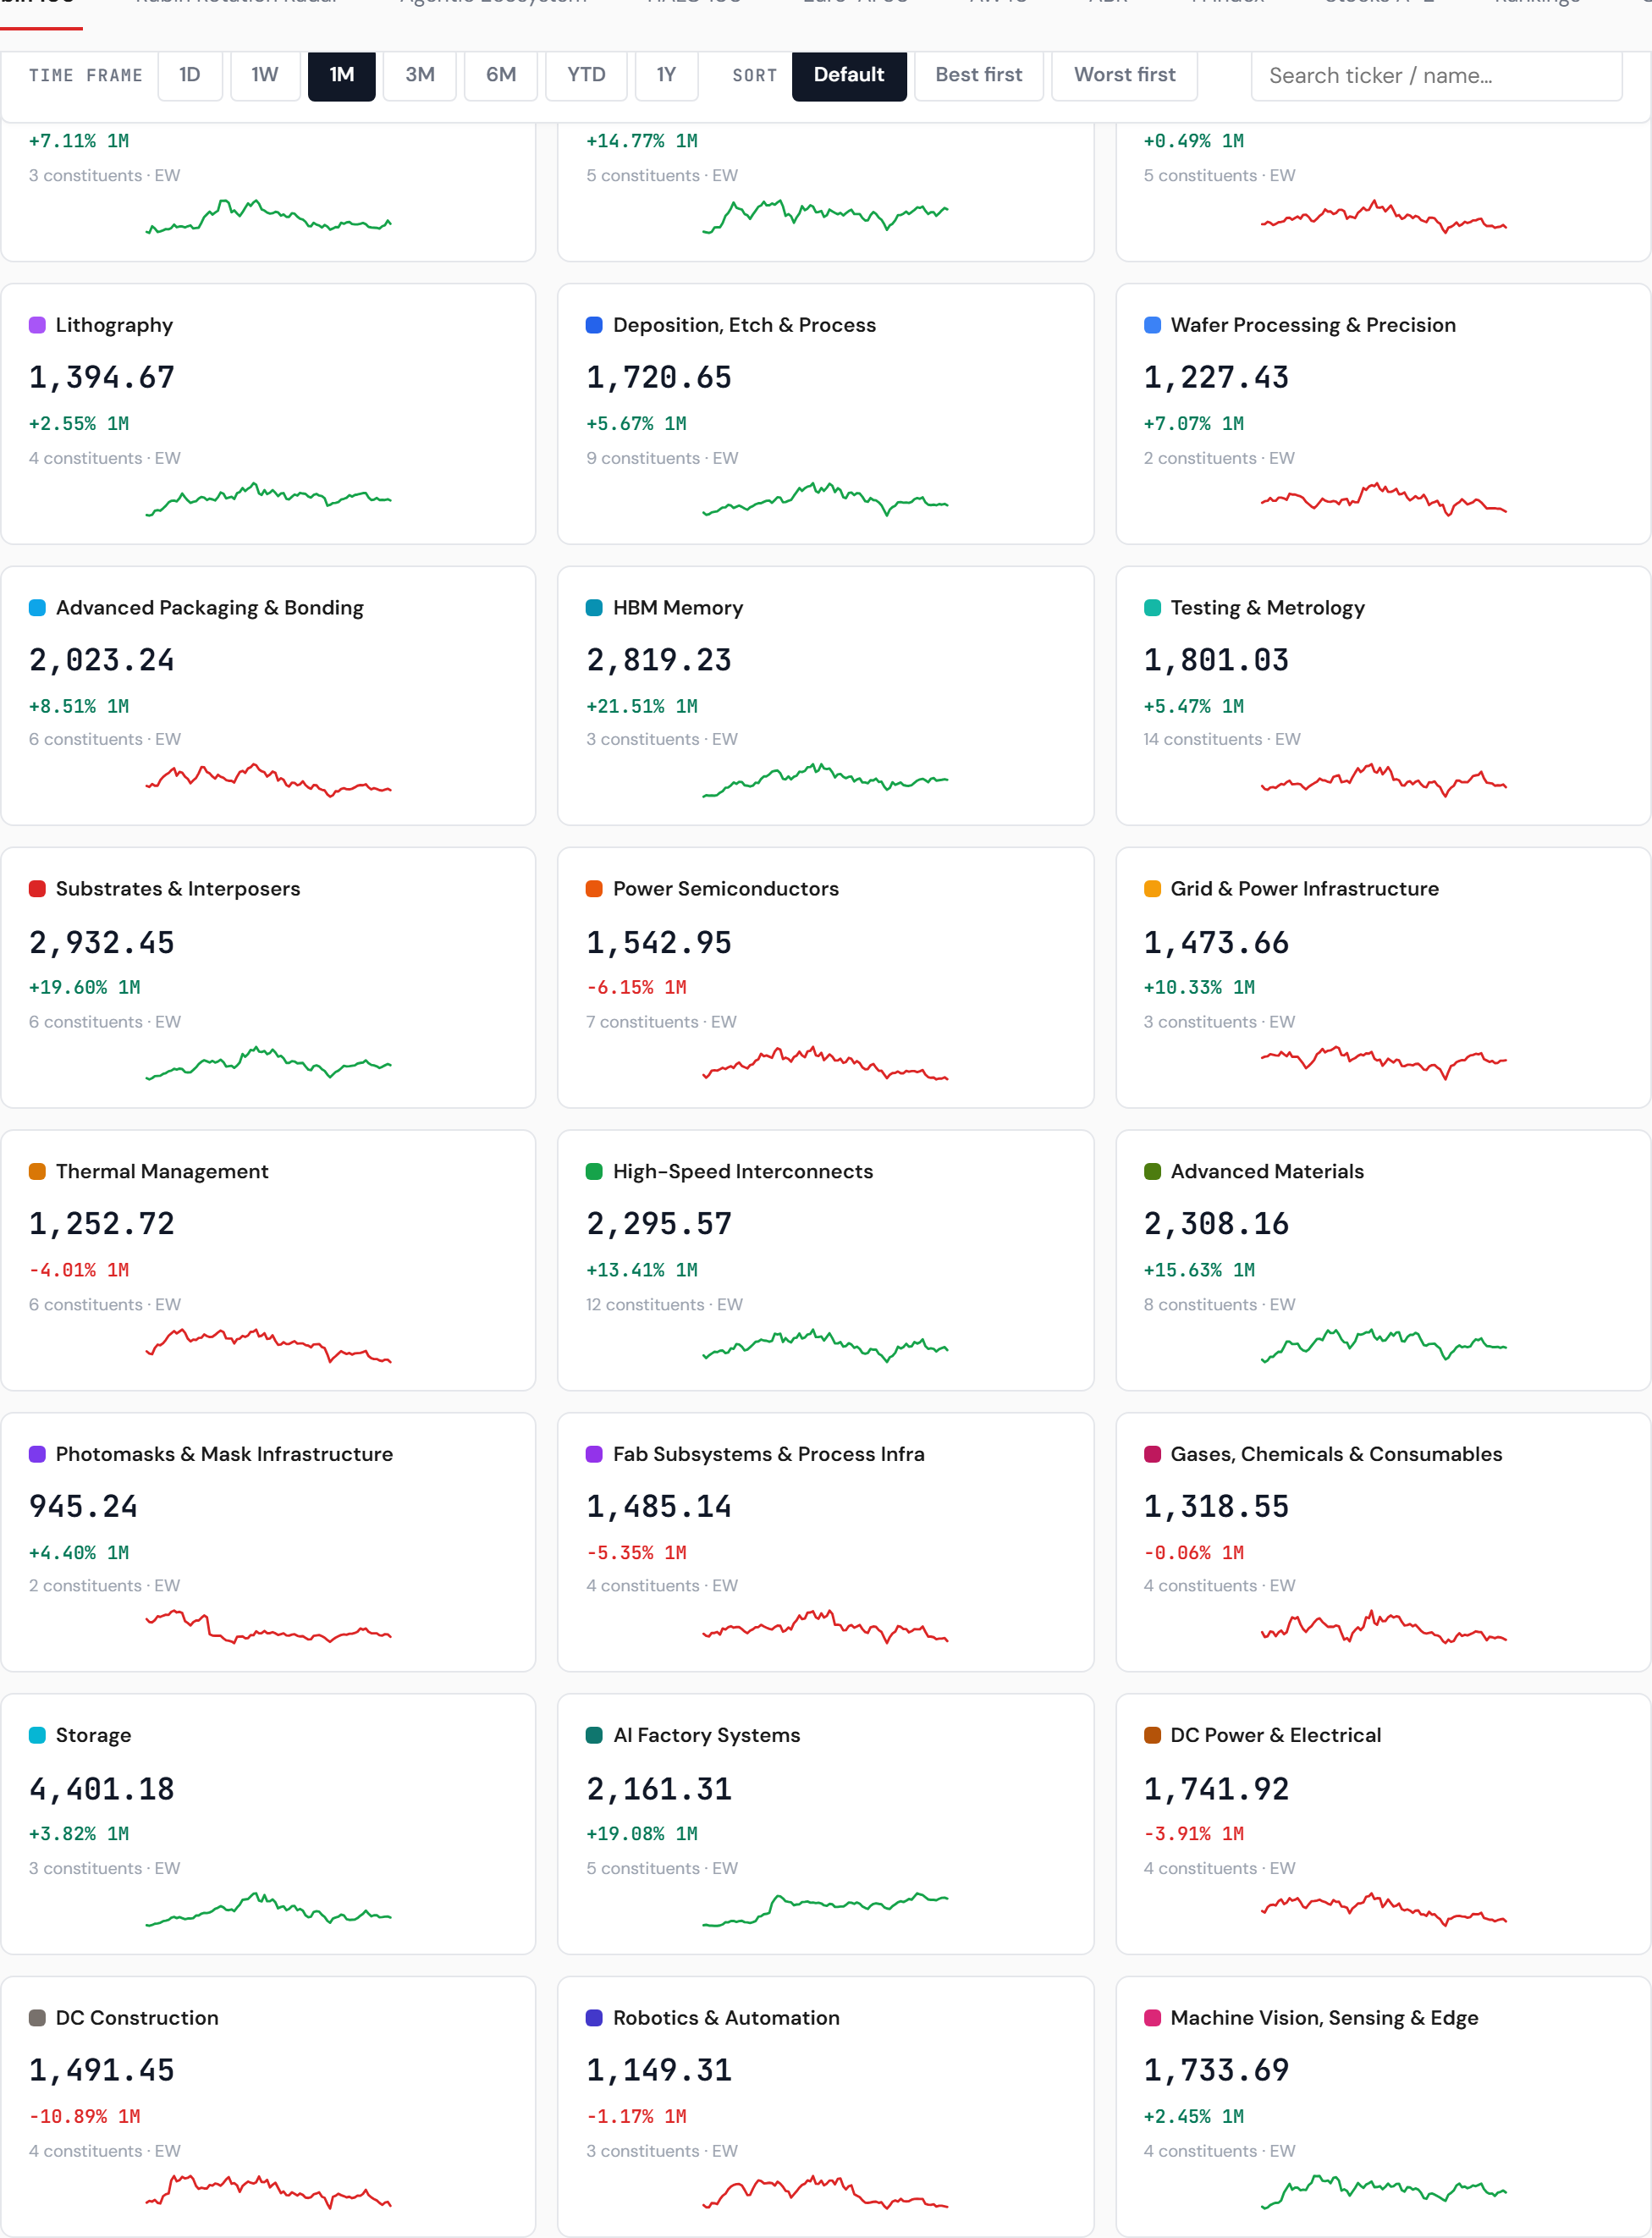
Best and worst week, by name — the mirror, third week running. Across the family’s constituents, the five best: Okta +23.0%, Salesforce +22.4%, freee +17.3%, Elastic +16.3%, CrowdStrike +13.8% — then ServiceNow +12.6%, Ferrotec +11.9%, Atlassian +11.7%, Veeva +11.6%, Synopsys +11.2%. Nine of the ten are software or application names; not one chip, not one cloud operator, not one HALO name — the exact inversion of last week’s list, which was nine HALO-and-applications names with no software. The five worst: Aehr −20.6%, AST SpaceMobile −15.4%, IREN −15.4%, Applied Optoelectronics −14.9%, Everpure −14.0% — then Tempus AI −11.9%, last week’s best name in the entire system at +39.5%, now sixth-worst. Third consecutive week in which the prior week’s hero list leads the casualty list. The medians say it without names: applications +2.93%, opex +1.65%, capex −1.62%, HALO −2.18%. Green counts: 34 of 40 in the applications, 45 of 126 in the buildout, 26 of 99 in HALO.
The AI Handoff Board — a third week up-stack, with a security spike. The handoff ratios: use-against-build +3.85% to 1.6007, use-against-operate +3.04%, beyond-gateways +3.19% — the applications pulling away from builders and operators for a third consecutive week. The sharpest line is new: trust-against-execution +4.48% — the security layer re-rating against the workflow layer it protects, the Okta-CrowdStrike week expressed as a ratio. And the one going the other way is the operators again: operators-against-suppliers −4.79% — the neoclouds falling against the chipmakers that supply them, which is what a capacity trade looks like when the market stops paying for capacity.
The hyperscaler cohort — the streak broke at the shelf’s door. The Mag Pulse board reads the basket at 69.07, +2.66% on the week — 0.62% below the 69.5 shelf that has capped it since spring, from 3.2% below a week ago. Underneath: Microsoft +6.27%, Meta +5.11%, Apple +3.35%, Amazon +3.02%, Oracle +2.99% (+18.3% on the month), Nvidia +1.32% through its own print, Alphabet +0.51%. The hyperscaler cohort beat QQQ by 2.24 points. Four weeks of “the defaults trail the average stock” ended in one: the basket beat equal-weight by over three points, and the question this letter has carried — rotation or distribution — received the third answer: re-concentration into the balance sheets, on a hawkish podium. The shelf at 69.5 is now the working test: a weekly close through it would say the defaults are leading again for the first time since spring; a rejection would file this week as a defensive crowding into size. Either way, the December pivot at 62.56 has stopped being the live end of the map.
Compute tightness — the operators’ third red week, against a supply-capped guide. The demand signal could not have been louder: the chip supplier itself capped next year’s growth at 70% by shipping capacity, with demand above it. The operators who rent that compute were sold anyway — Nebius −4.5%, CoreWeave −4.1%, IREN −15.4% — their third consecutive red week, and the operators-against-suppliers ratio fell 4.8%. Price and thesis now disagree in the sharpest form yet: the tightest supply statement of the cycle, from its most authoritative source, against a funding market that keeps marking the capacity traders down. One of them is early. The book’s tilt has already chosen which.
The financing architecture underneath it — and a coming deep-dive. The operators’ bleed is, at bottom, a funding question, and the funding side moved structurally this month. On August 10 Nvidia announced compute-financing platforms with Apollo, BlackRock, Blackstone, Brookfield, Goldman Sachs and KKR — over $500 billion of third-party capital to be mobilized for AI factories, with the explicit aim of turning Nvidia compute and full-stack AI infrastructure into an investable asset class — long-duration, usage-linked revenue streams packaged for the capital that owns pipelines and toll roads, with Nvidia reportedly standing behind residual GPU values for up to a quarter of a project’s value, the exact risk that has kept banks away from lending against chips. BlackRock’s chief executive compared it to the birth of mortgage-backed securities in the 1970s. Hold that against this week’s tape: the market is repricing the equity of the capacity traders in the same weeks the industry is building the machinery to move that capacity onto credit — off the neoclouds’ balance sheets and into structured vehicles. Whether that machinery rescues the operators or disintermediates them is, in this letter’s view, the most consequential open question in the whole stack — and it gets its own treatment: a special Closelook analysis on the August 10 platforms — how AI infrastructure and GPUs become a financeable asset class, who carries the residual risk, and what the mortgage-securitization analogy implies for both directions — is in preparation and will publish separately on closelook.net.
Structural inflation — contained, while the long end rallied. The house composite in the macro lab reads 49, “Contained”, direction flat — unchanged. The 30-year rallied to 5.207% into the buyback window while the belly failed its third reclaim; the gauge keeps saying the long end’s problem is supply, not inflation, and this week the long end traded like a market that agrees — until Friday’s keynote reminded it that the short end has its own opinion. Warsh’s prices-first framing against a Contained structural gauge is the fall’s macro argument in miniature.

Breadth and temperature — the reversal week. Equal-weight lost 0.44% against cap-weight’s +0.47% — the first cap-weight week in five — while the Money Temperature composite warmed a second consecutive week, 57 from 53, still transition. Equities crept, hard assets fell, the gauge warmed anyway: what it is reading is rotation-as-appetite — money moving between layers at full speed rather than leaving. Participation narrowed this week by choice, not by damage: the average stock fell half a percent while the top of the index absorbed the inflow.
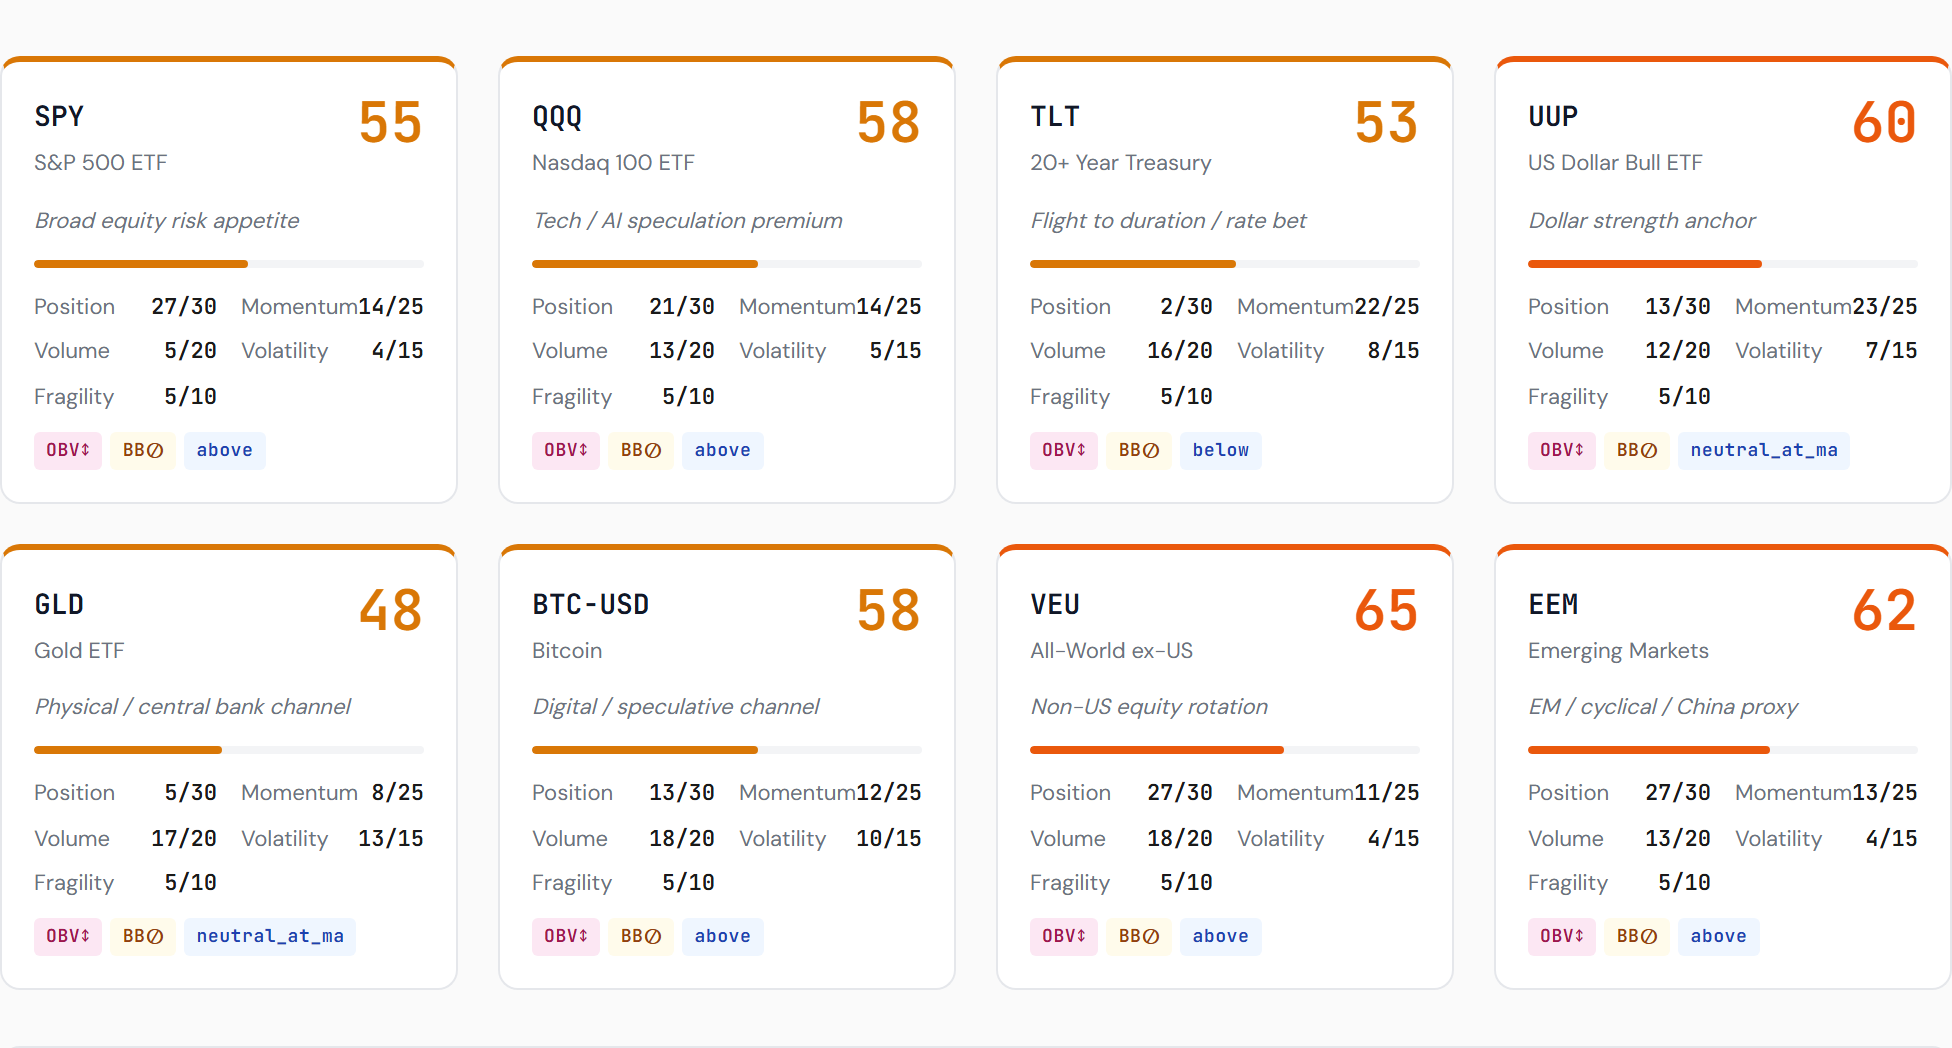
The count, restated for the week ahead. Above the 50-day, 4.1% from confirmation, 3.1% from the kill-switch, with five scoring windows Monday, six Tuesday, Broadcom Wednesday and payrolls Friday. The count has its referees booked daily.
