Everything that builds, runs and sells the AI economy rose through it — the chip index 6.3%, the Magnificent Seven to a record, Meta 12.9% and Microsoft 4.5% on the first agent products that look broadly sellable, Korea and Taiwan at the head of the world board, bitcoin through 86,000. The rate rise is global, for different reasons: growth in America, normalisation in Japan, weaker sovereign credit in Europe — France now pays more than Italy and Greece to borrow. The world ex-US index took back its first lost line by eight cents. America won a third week.

1 · This Week’s Action
The global view. The ex-US world index closed the week at 84.38, up 0.62% — back above 84.30, the line it lost a week ago, by eight cents on the weekly close. The path: Monday 85.09 on the chip rally, Tuesday 85.44 — a daily close above the 85.23 line for the first time in three weeks — Wednesday 83.97 on a hot business survey and a Fed governor, Thursday 83.57 as the thirty-year yield climbed, Friday 84.38. The index sits 2.4% under its September 4 record of 86.41. The all-world index closed 160.03, up 0.93%, 1.5% under its August high. The S&P 500 rose 1.21% and the Nasdaq 100 3.25%, with its highest close of the past year on Tuesday; the Nasdaq Composite closed at records on Monday and Tuesday.
The year’s order held and narrowed a third time. VEU +14.7% for 2026, VT +13.5%, the S&P fund +13.1% — the ex-US lead over America is 1.6 points, from 2.3 last week, 3.7 the week before and 4.5 before that. Three consecutive stay-home weeks. This one did not come with a central bank; it came with a bond market.
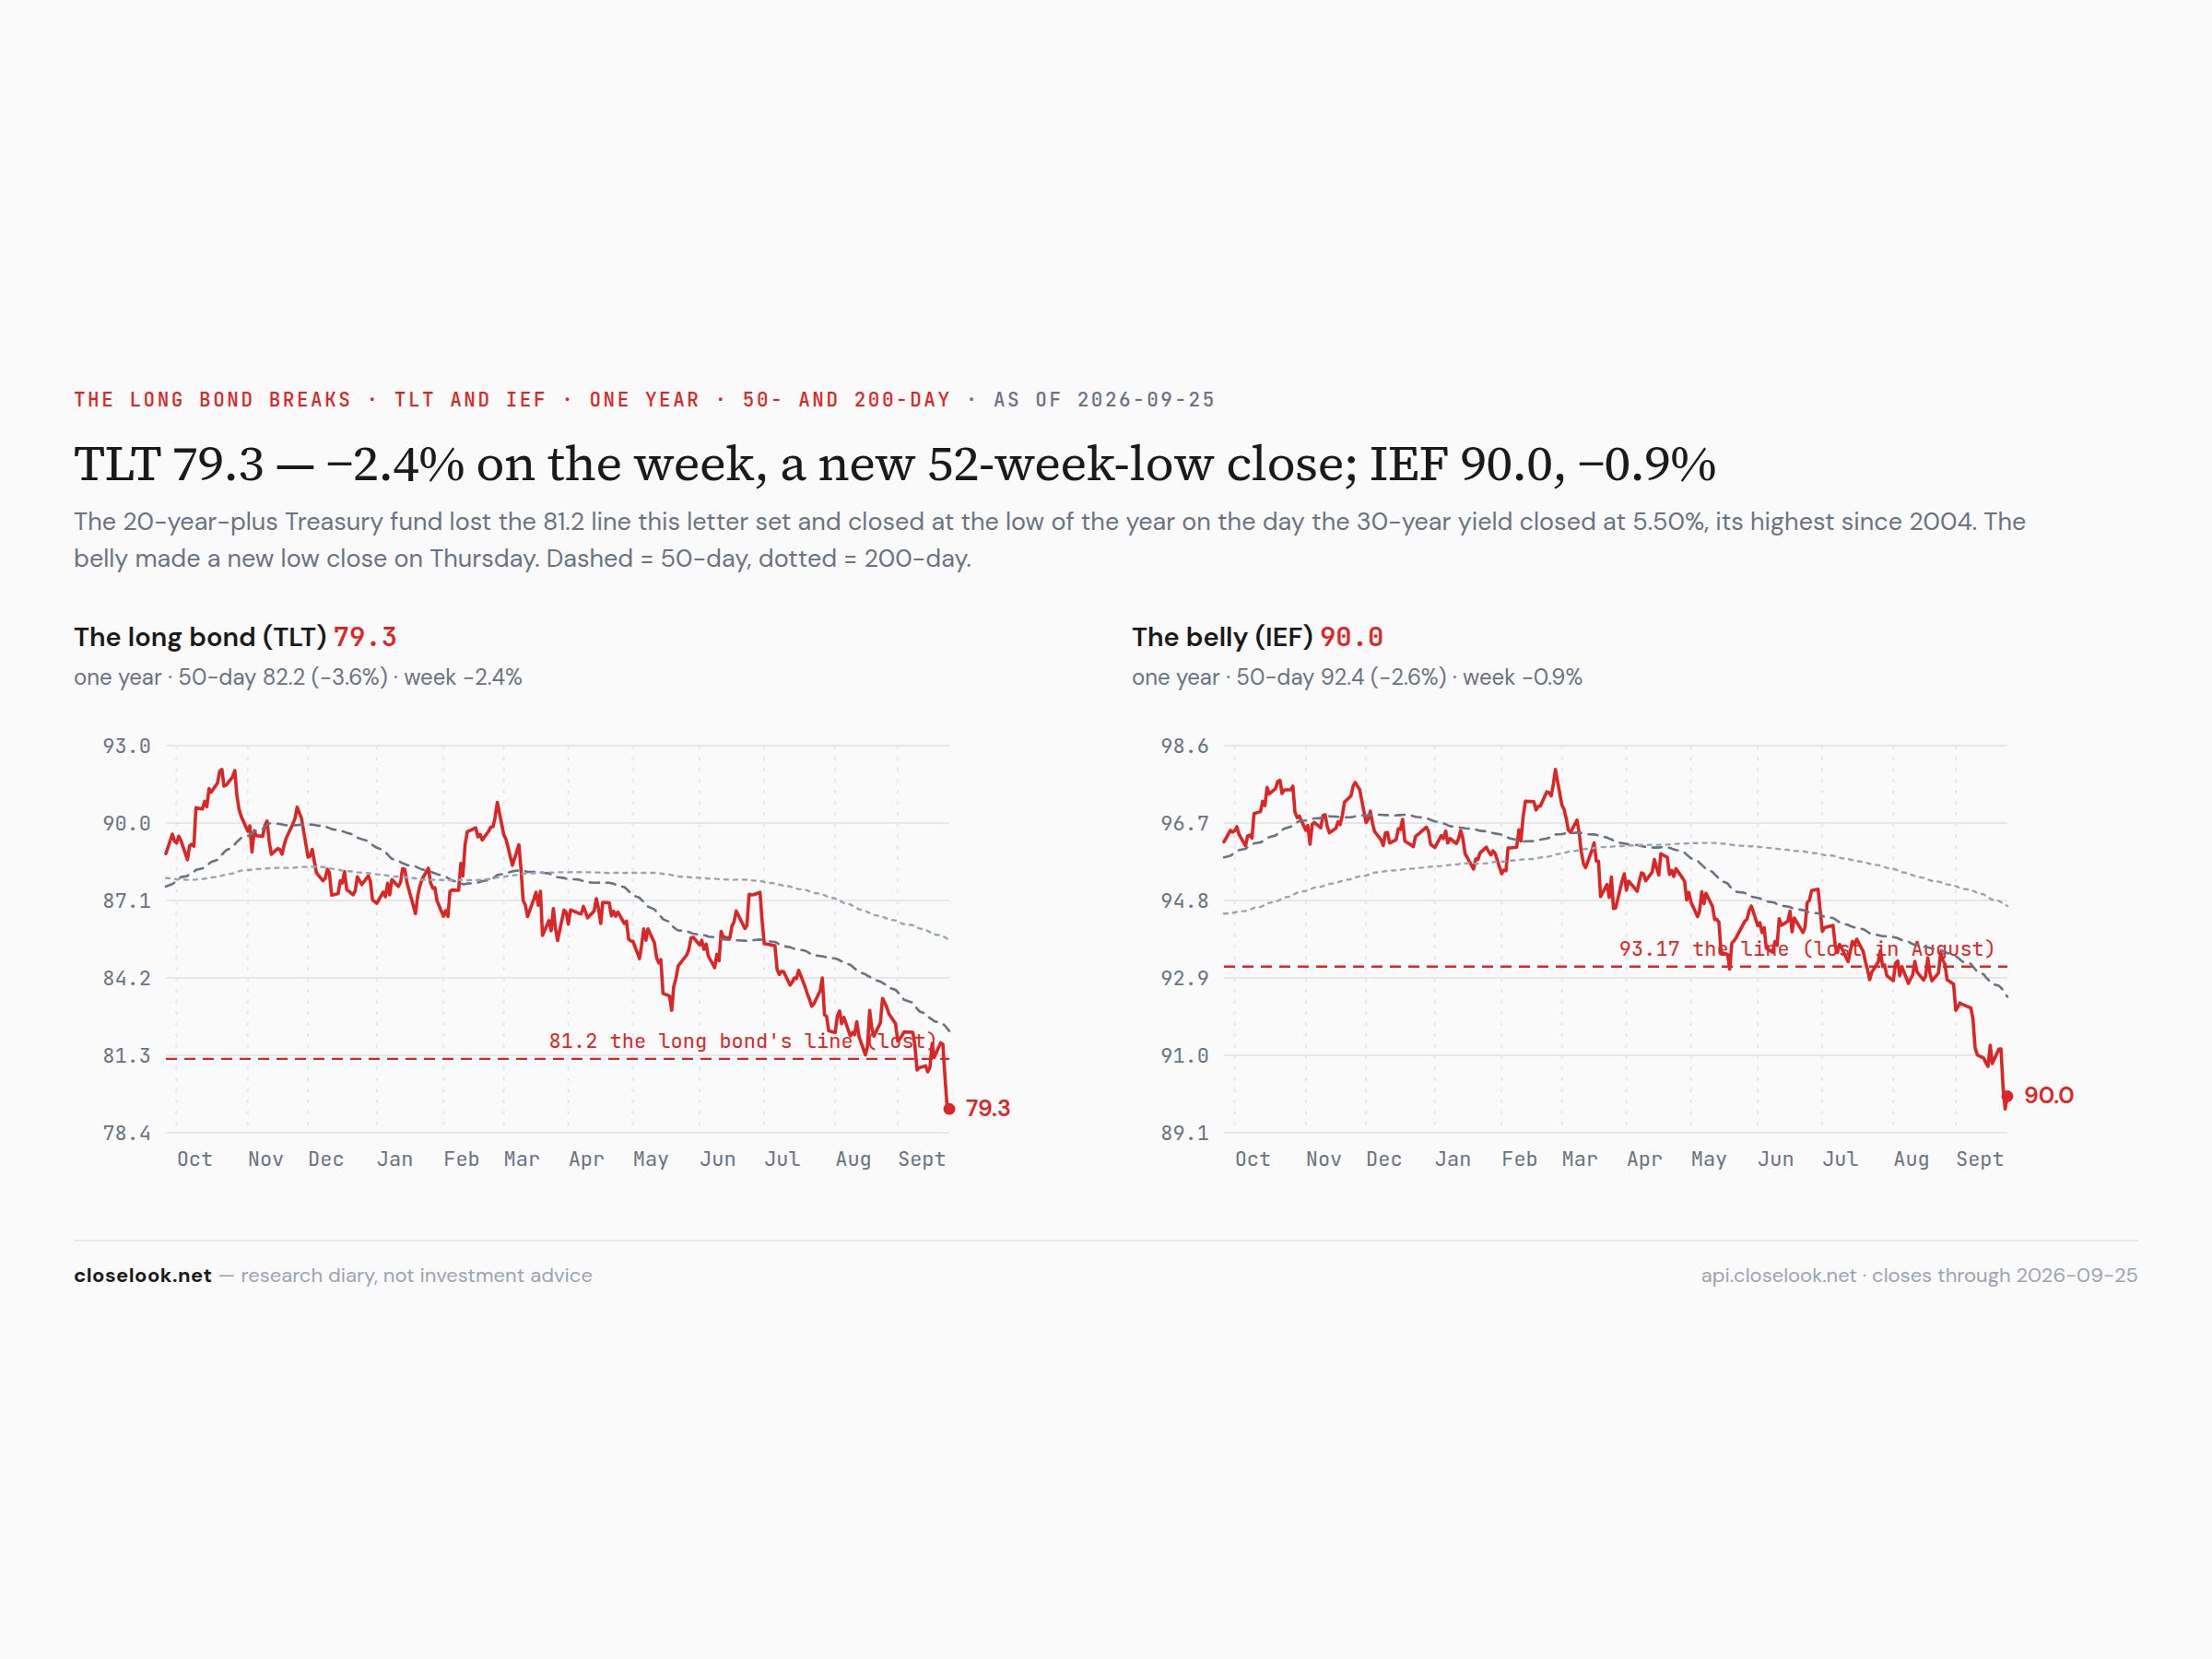
The long bond broke — and the builders ran anyway. That is the week in one line, and it is worth the second line to say why it is unusual. The thirty-year Treasury yield closed Friday at 5.50%, its highest since 2004; the long-bond fund TLT fell 2.38% to 79.32, under the 81.2 line this letter set, with new fifty-two-week-low closes on Thursday and Friday. The ten-year closed at 5.18%, 18 basis points higher on the week, after a flash business survey on Tuesday showed US output growing at its fastest pace in more than five years and Fed Governor Michael Barr said further rate increases are likely to be needed. A rising discount rate is supposed to hurt the long-duration assets first. The long-duration assets did the opposite: the chip index rose 6.27%, the Magnificent Seven fund made a record close of 72.97 on Monday and held above 72 all week, Meta rose 12.9% and Microsoft 4.5%, the Asian chip markets led the world board, and bitcoin closed Monday at 86,603.
What ran: the whole chain, not one link. Last week the letter tracked a memory trade. This week the bid went wider than memory, and the breadth of it is the point. The fabless chip vehicle +7.78%, the equal-weight chip fund +6.73%, the chip majors +5.86% — AMD +12.6% to 630.63, Arm +12.6% to 310.32, Intel +13.3% to 123.00, TSMC’s ADR +3.7%, ASML +3.8%, Micron +6.5% to 1,082.28. The AI baskets rose 2.9% to 4.3%; cloud +2.05%, software +1.59%, cybersecurity +1.08% — smaller moves, but green, on a week with a 5.50% long bond. The house buildout index rose 5.05% with all thirty-six of its sub-indices green. The one large chip name that fell was Broadcom, −1.3%; the one memory name that fell was SanDisk, −0.8%, after a record-level run. Memory was part of the week. It was not the week.
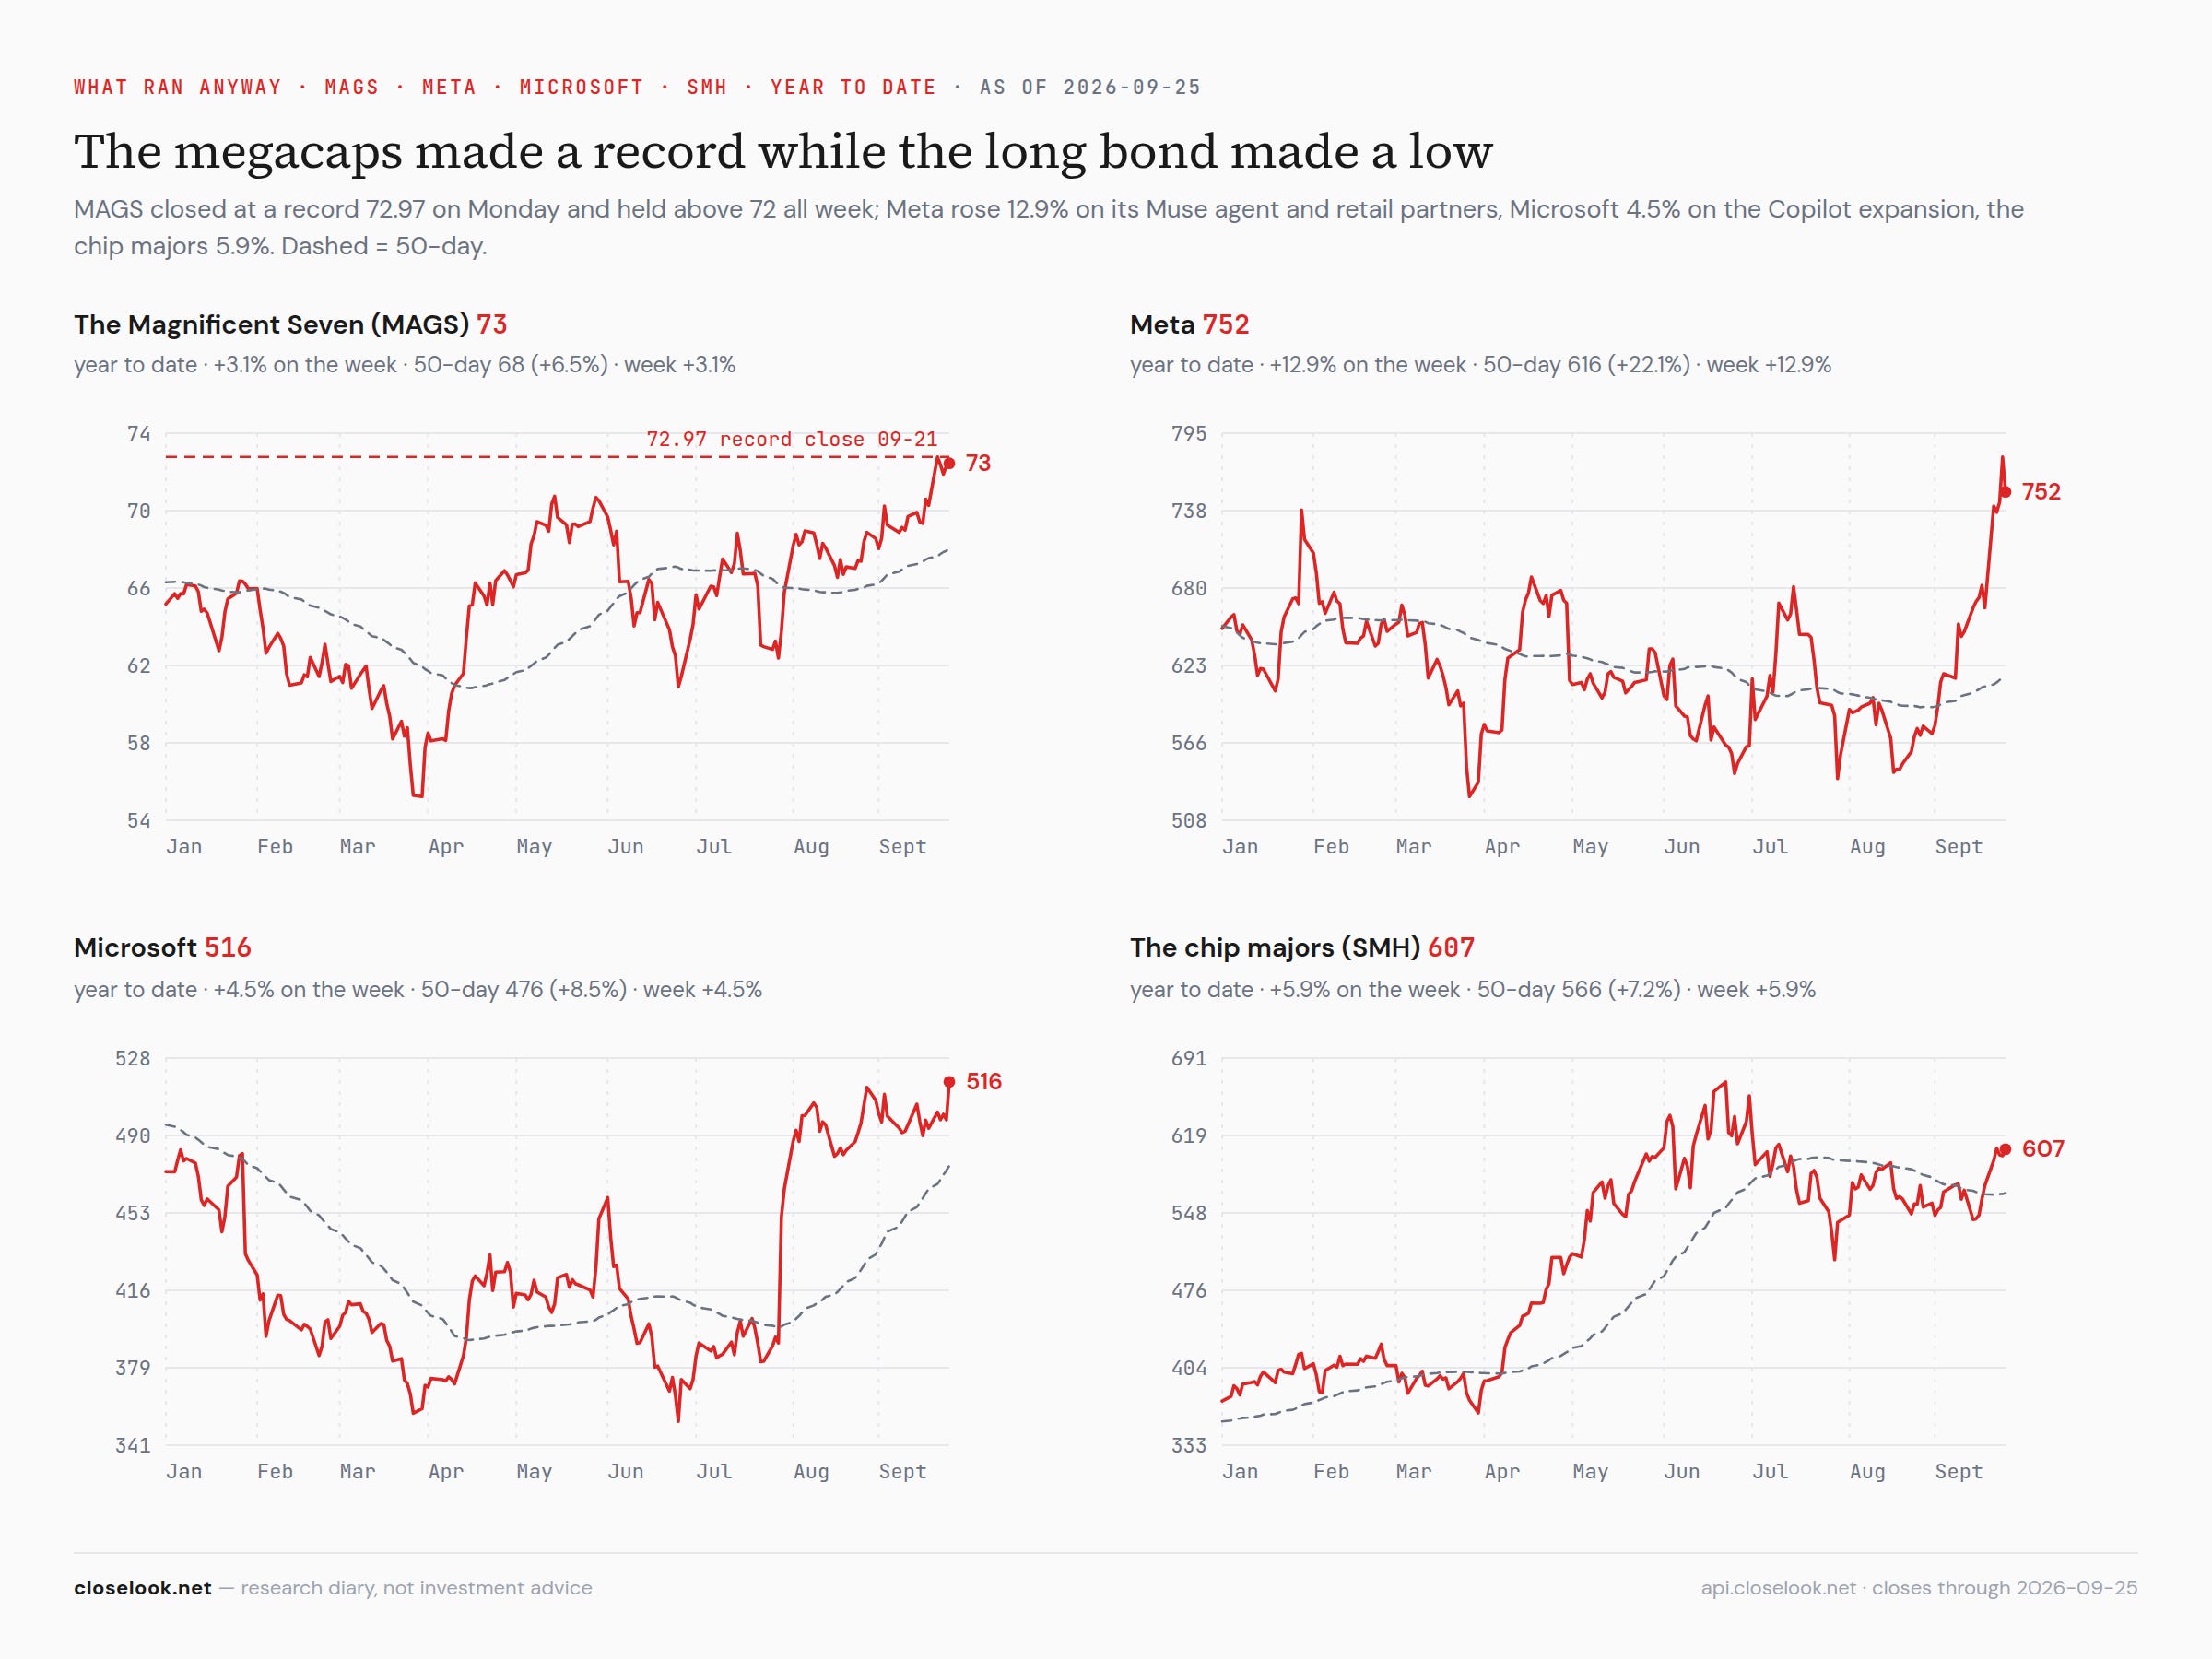
The applications turned up in the prices — Meta and Microsoft. Two of the largest companies on earth showed agent products this week that look like they can be sold to everyone, and the market paid for both. Meta rose 11.3% on Monday — its best day in thirteen months — after its Muse agent reached No. 1 on Apple’s US App Store; at its Connect event on Wednesday it named Walmart, Best Buy, Gap, Sephora and Wayfair as shopping partners for Muse, after Instacart on Monday, and showed a $449 third-generation Ray-Ban, cheaper $349 and $249 glasses, a $1,299 headset and a small pendant that carries the agent. Amazon has blocked the agent from its store. Meta closed Thursday at 777.59, gave back 3.3% on Friday to 751.66, and ended the week up 12.9%. Microsoft rose 3.6% on Friday alone to 516.17, the best of the megacaps, on reports of a large Copilot expansion — coding tools, autonomous agents and direct access to Word, Excel and Outlook — after Stifel upgraded it to Buy on Wednesday. It ended the week up 4.5%. The software fund rose 1.6% on the week; the bid was for the companies that own the agent, not for software as a group.
The rest of the seven: Nvidia +1.3%, Apple +1.5%, Tesla +2.2%; Alphabet −1.6%, Amazon −1.6%. The fund made its record on Monday and the two that led it were the two with a new product to sell. That is a different record from the ones this letter has recorded since June, which were made on spending plans.
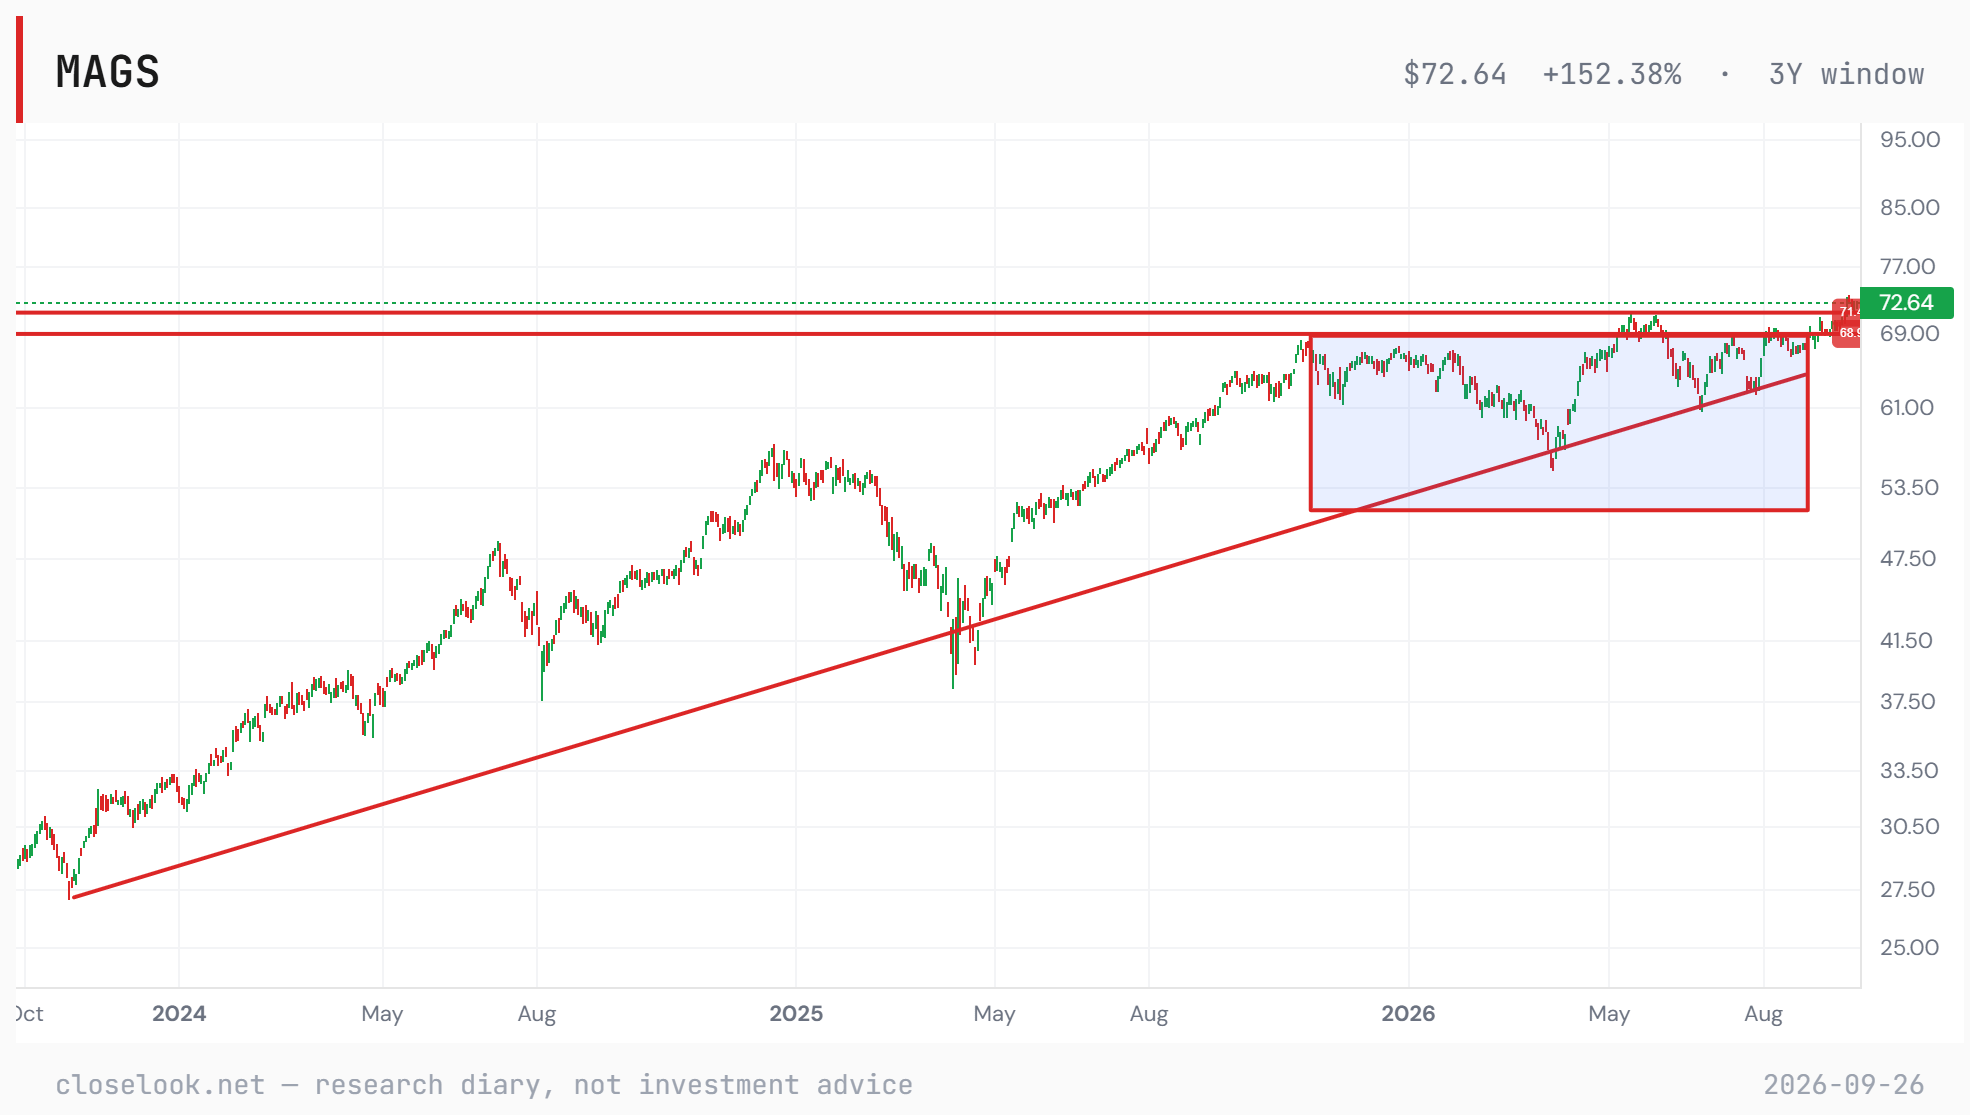
The editor’s MAGS chart puts the record in its frame: a breakout from a ten-month box. Since November 2025 the fund had traded between roughly 53 and 69, with a rising line from the 2023 low under it. This week it closed through the top of the box and through the 71.4 high of the summer, at 72.64 on Friday. A breakout from a box that long is the kind of move the chart reads as a new leg, as long as the fund holds above 69 on a weekly close.
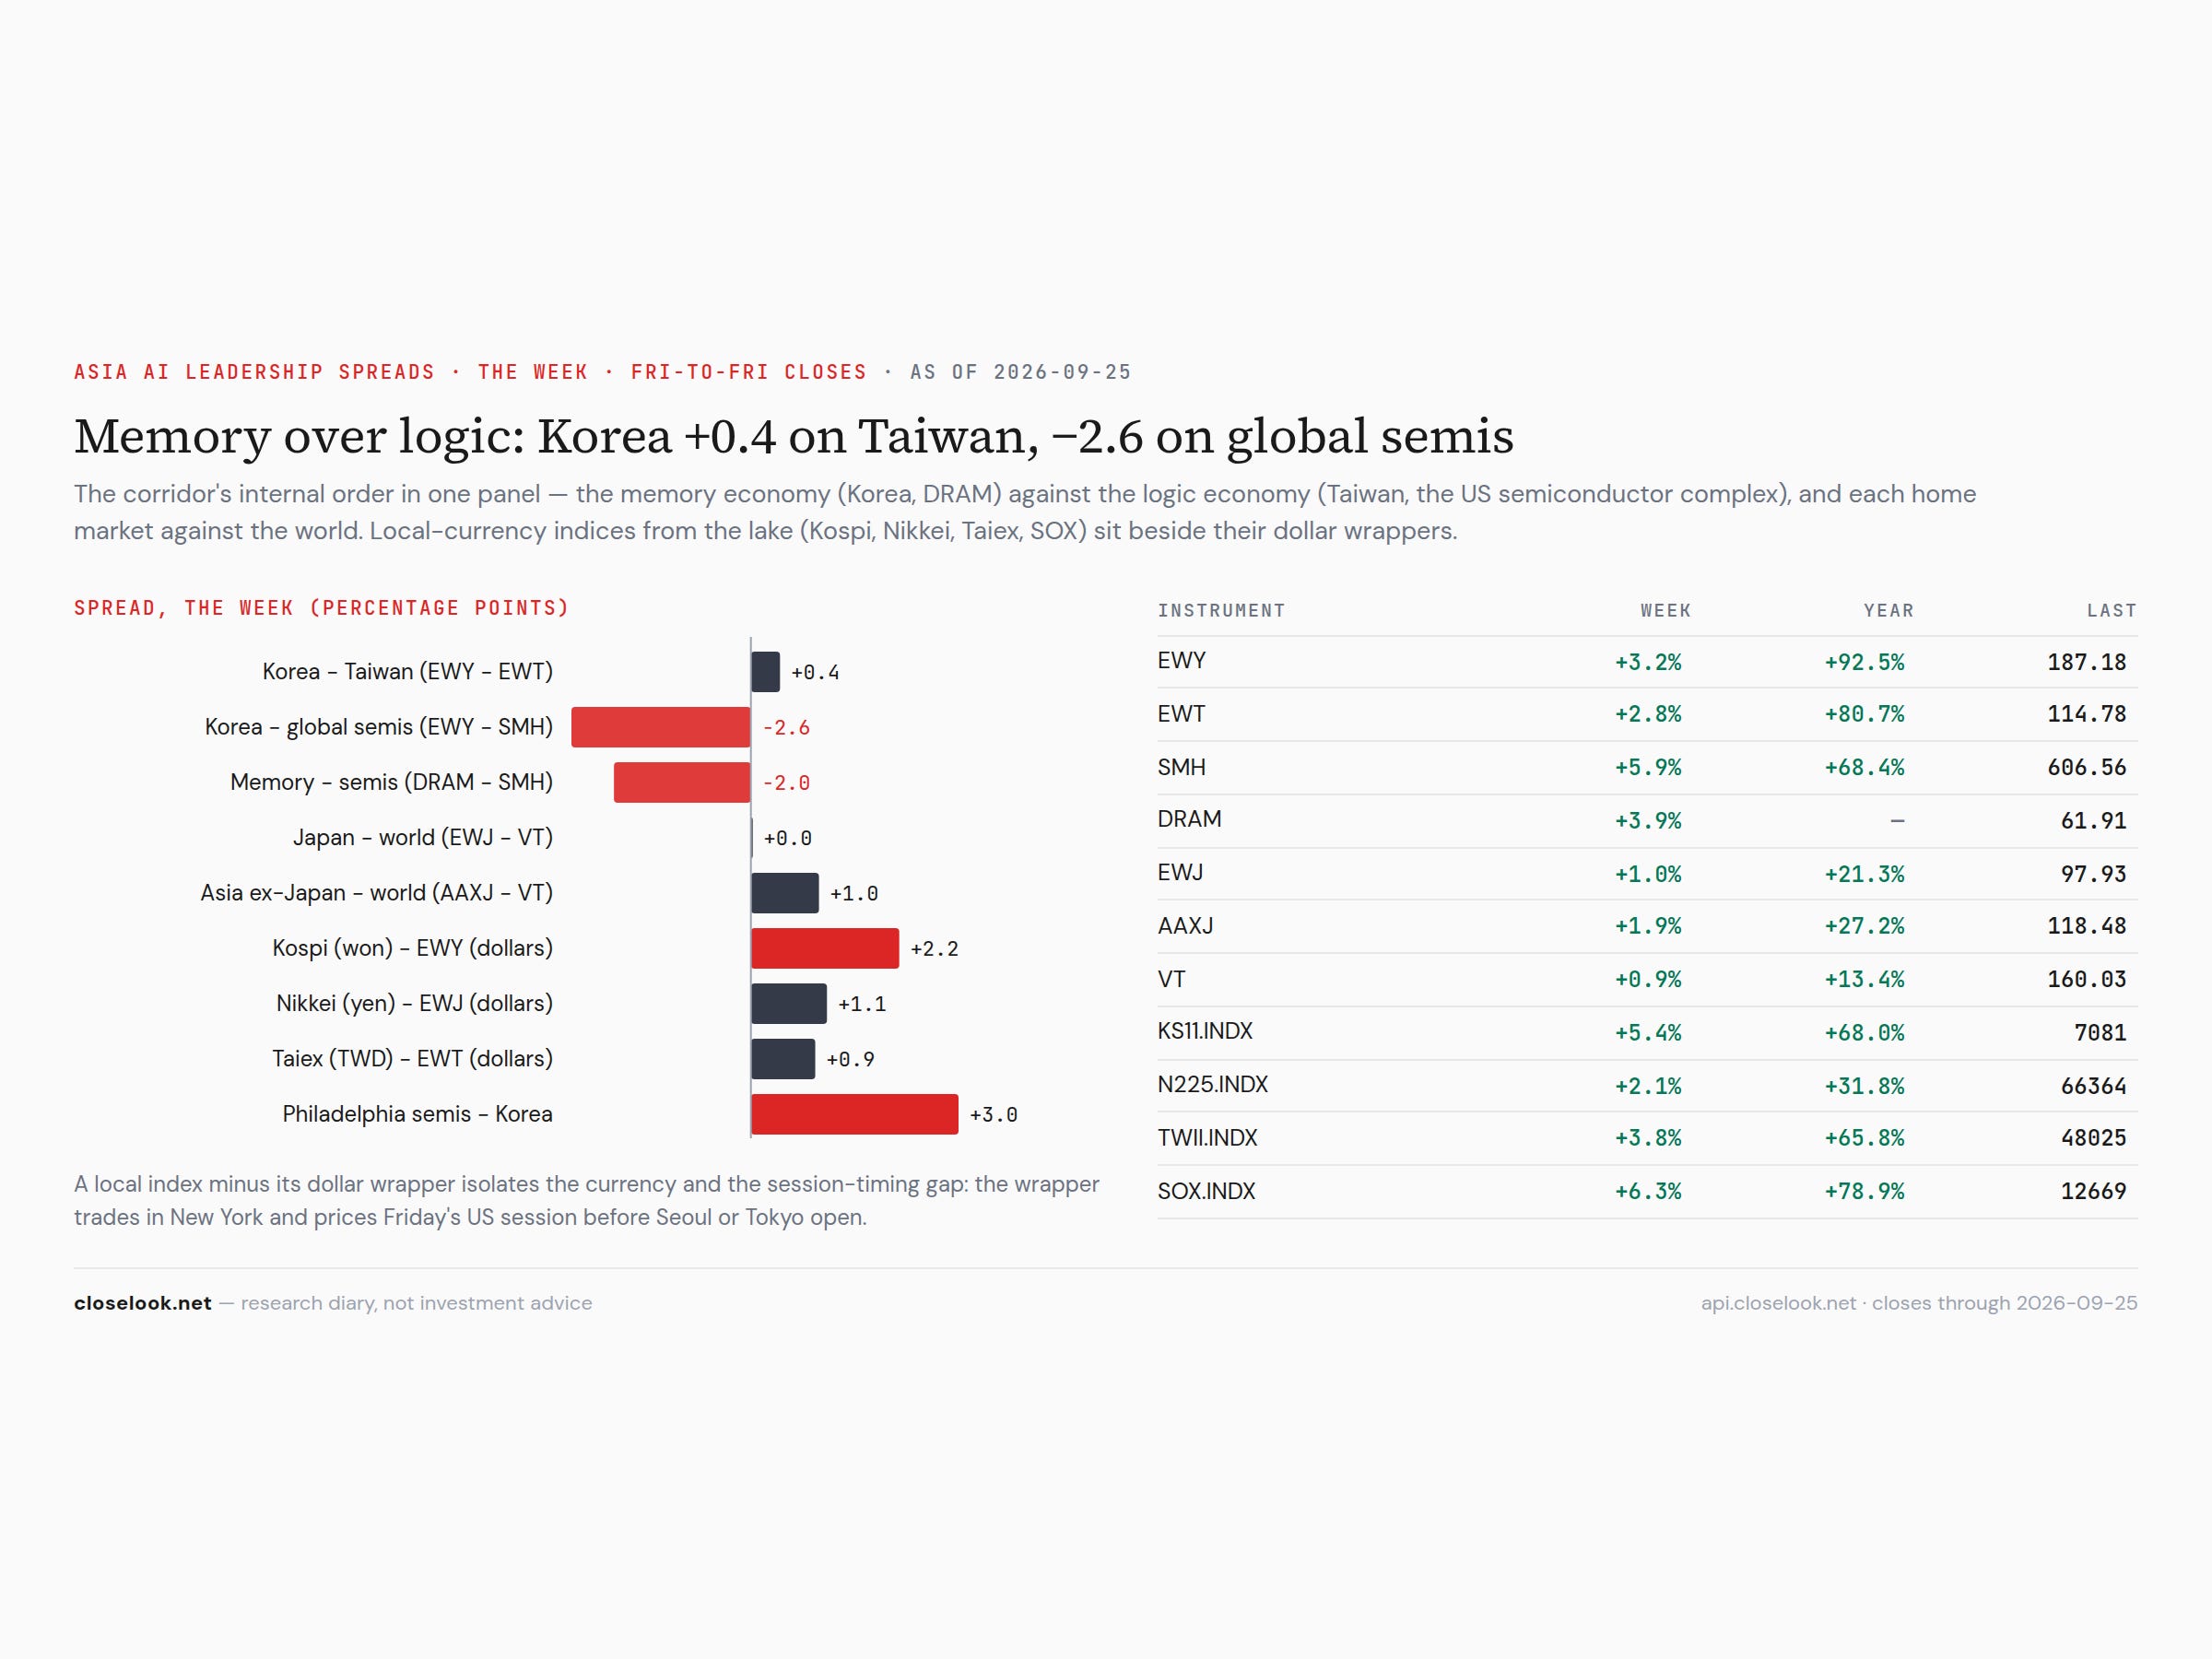
Korea and Taiwan led the world — and Japan’s wrapper made a record. The regional board turned: twenty-two green, one flat, twelve red of thirty-five, after two green last week. The top two are the chip corridor: Korea +3.24% to 187.18 and Taiwan +2.81% to 114.78, a fifty-two-week-high close for the Taiwan fund on Monday at 115.64. Seoul’s customs data on Monday showed exports for the first twenty days of September up 78.3% to $71.4 billion, with semiconductors up 259.4% to $34.12 billion — 47.8% of everything Korea sold abroad. The Kospi closed 7,007.72 on Monday, above 7,000, and 7,080.92 on Wednesday before Seoul shut for Chuseok. Taipei’s Taiex rose from 47,181 to 48,157 by Wednesday and closed Thursday at 48,025 before its own holiday on Friday. Japan’s fund closed 98.78 on Tuesday, a fifty-two-week-high close, and 97.93 on the week, +0.96%, on a two-session Tokyo week — shut Monday to Wednesday, then the Nikkei +2.1% to 66,364 on Thursday and Friday, with Tokyo Electron up 4.6% on Friday morning.
Then the rest: Austria +2.28%, Malaysia +1.94%, Thailand +1.76%, Southeast Asia +1.57%, the Netherlands +1.49%, Switzerland +1.03%, Spain +1.02%. The bottom: Argentina −4.14%, Indonesia −3.77%, China’s A-shares −2.01%, Brazil −1.87%, Norway −1.77%, Australia −1.11%, China large caps −1.05%. The best-to-worst spread widened to 7.38 points from 4.59 — the first widening in three weeks. Last week the letter read a red, narrowing board as de-grossing. This week the board went green and widened: that is money choosing, and what it chose was the chip corridor over the commodity and China end.
Sorted by Weighted Alpha (leaders → laggards) · Barchart, close of week.
The cross-asset backdrop — the bonds and the metals paid for it. Six green, six red. The Nasdaq top-30 fund +3.58%, the bitcoin fund +3.37%, the Nasdaq 100 +3.19%, the US top-20 fund +2.49%, the S&P +1.27%, the dollar +0.81%. The red six are the duration and the hard assets: oil −3.57%, silver −2.99%, the long bond −2.38%, gold −1.93%, the belly −0.88%, copper miners −0.63%. Oil fell 3.5% on Friday alone on reports of US–Iran deal talks. The dollar index closed at 101.13, up 0.9%, with a fifty-two-week-high close for the dollar fund on Thursday. In one sentence: the market sold everything that pays a fixed rate or stores value and bought everything that grows with the AI economy — the bitcoin fund included.
Sorted by Weighted Alpha (leaders → laggards) · Barchart, close of week.
The US sectors. Four of eleven green: technology +3.52%, communications +1.94% — Meta’s week — health care +1.37%, industrials +0.40%. The bottom: utilities −3.87%, energy −3.53%, real estate −2.28%, financials −1.83%, staples −0.89%. The rate-sensitive groups sat at the bottom again — utilities, real estate and financials, the same three as last week — and energy joined them with its barrel. The equal-weight S&P fell 0.56% and small caps 0.75%: the index rose on the few, a fact the letter keeps in view below.
Sorted by Weighted Alpha (leaders → laggards) · Barchart, close of week.
The tech ETFs — the chips first, then everything that uses them. Fourteen green of twenty-one. The fabless vehicle +7.78%, the equal-weight semis +6.73%, the chip majors +5.86%, the WisdomTree AI fund +4.28%, the internet-of-things fund +4.16%, quantum +4.01%, ARK +2.88%, the Global X AI fund +2.87%, cloud +2.05%, software +1.59%. The red seven: digital transformation −2.39%, lithium −2.10%, defense tech −1.95%, uranium −1.77%, fintech −1.58%, data centers −0.71%, gaming −0.50%. Last week software beat semis by two points; this week semis beat software by four. The order changed. The sign did not: both rose.
Sorted by Weighted Alpha (leaders → laggards) · Barchart, close of week.
The global sectors. Five sectors of eleven green: technology +3.70% to 148.96 — 0.5% under its June high of 149.74 — communications +1.58%, health care +1.36%, industrials +0.73%, staples +0.02%. The bottom: energy −2.51%, utilities −2.39%, financials −0.94% to 130.21, REITs −0.61%, discretionary −0.55%, materials −0.44% to 109.33. Financials spent a third week under the 134.55 August line and materials a fifth under the February line. Global tech is seventy-eight cents from its high.
Sorted by Weighted Alpha (leaders → laggards) · Barchart, close of week.
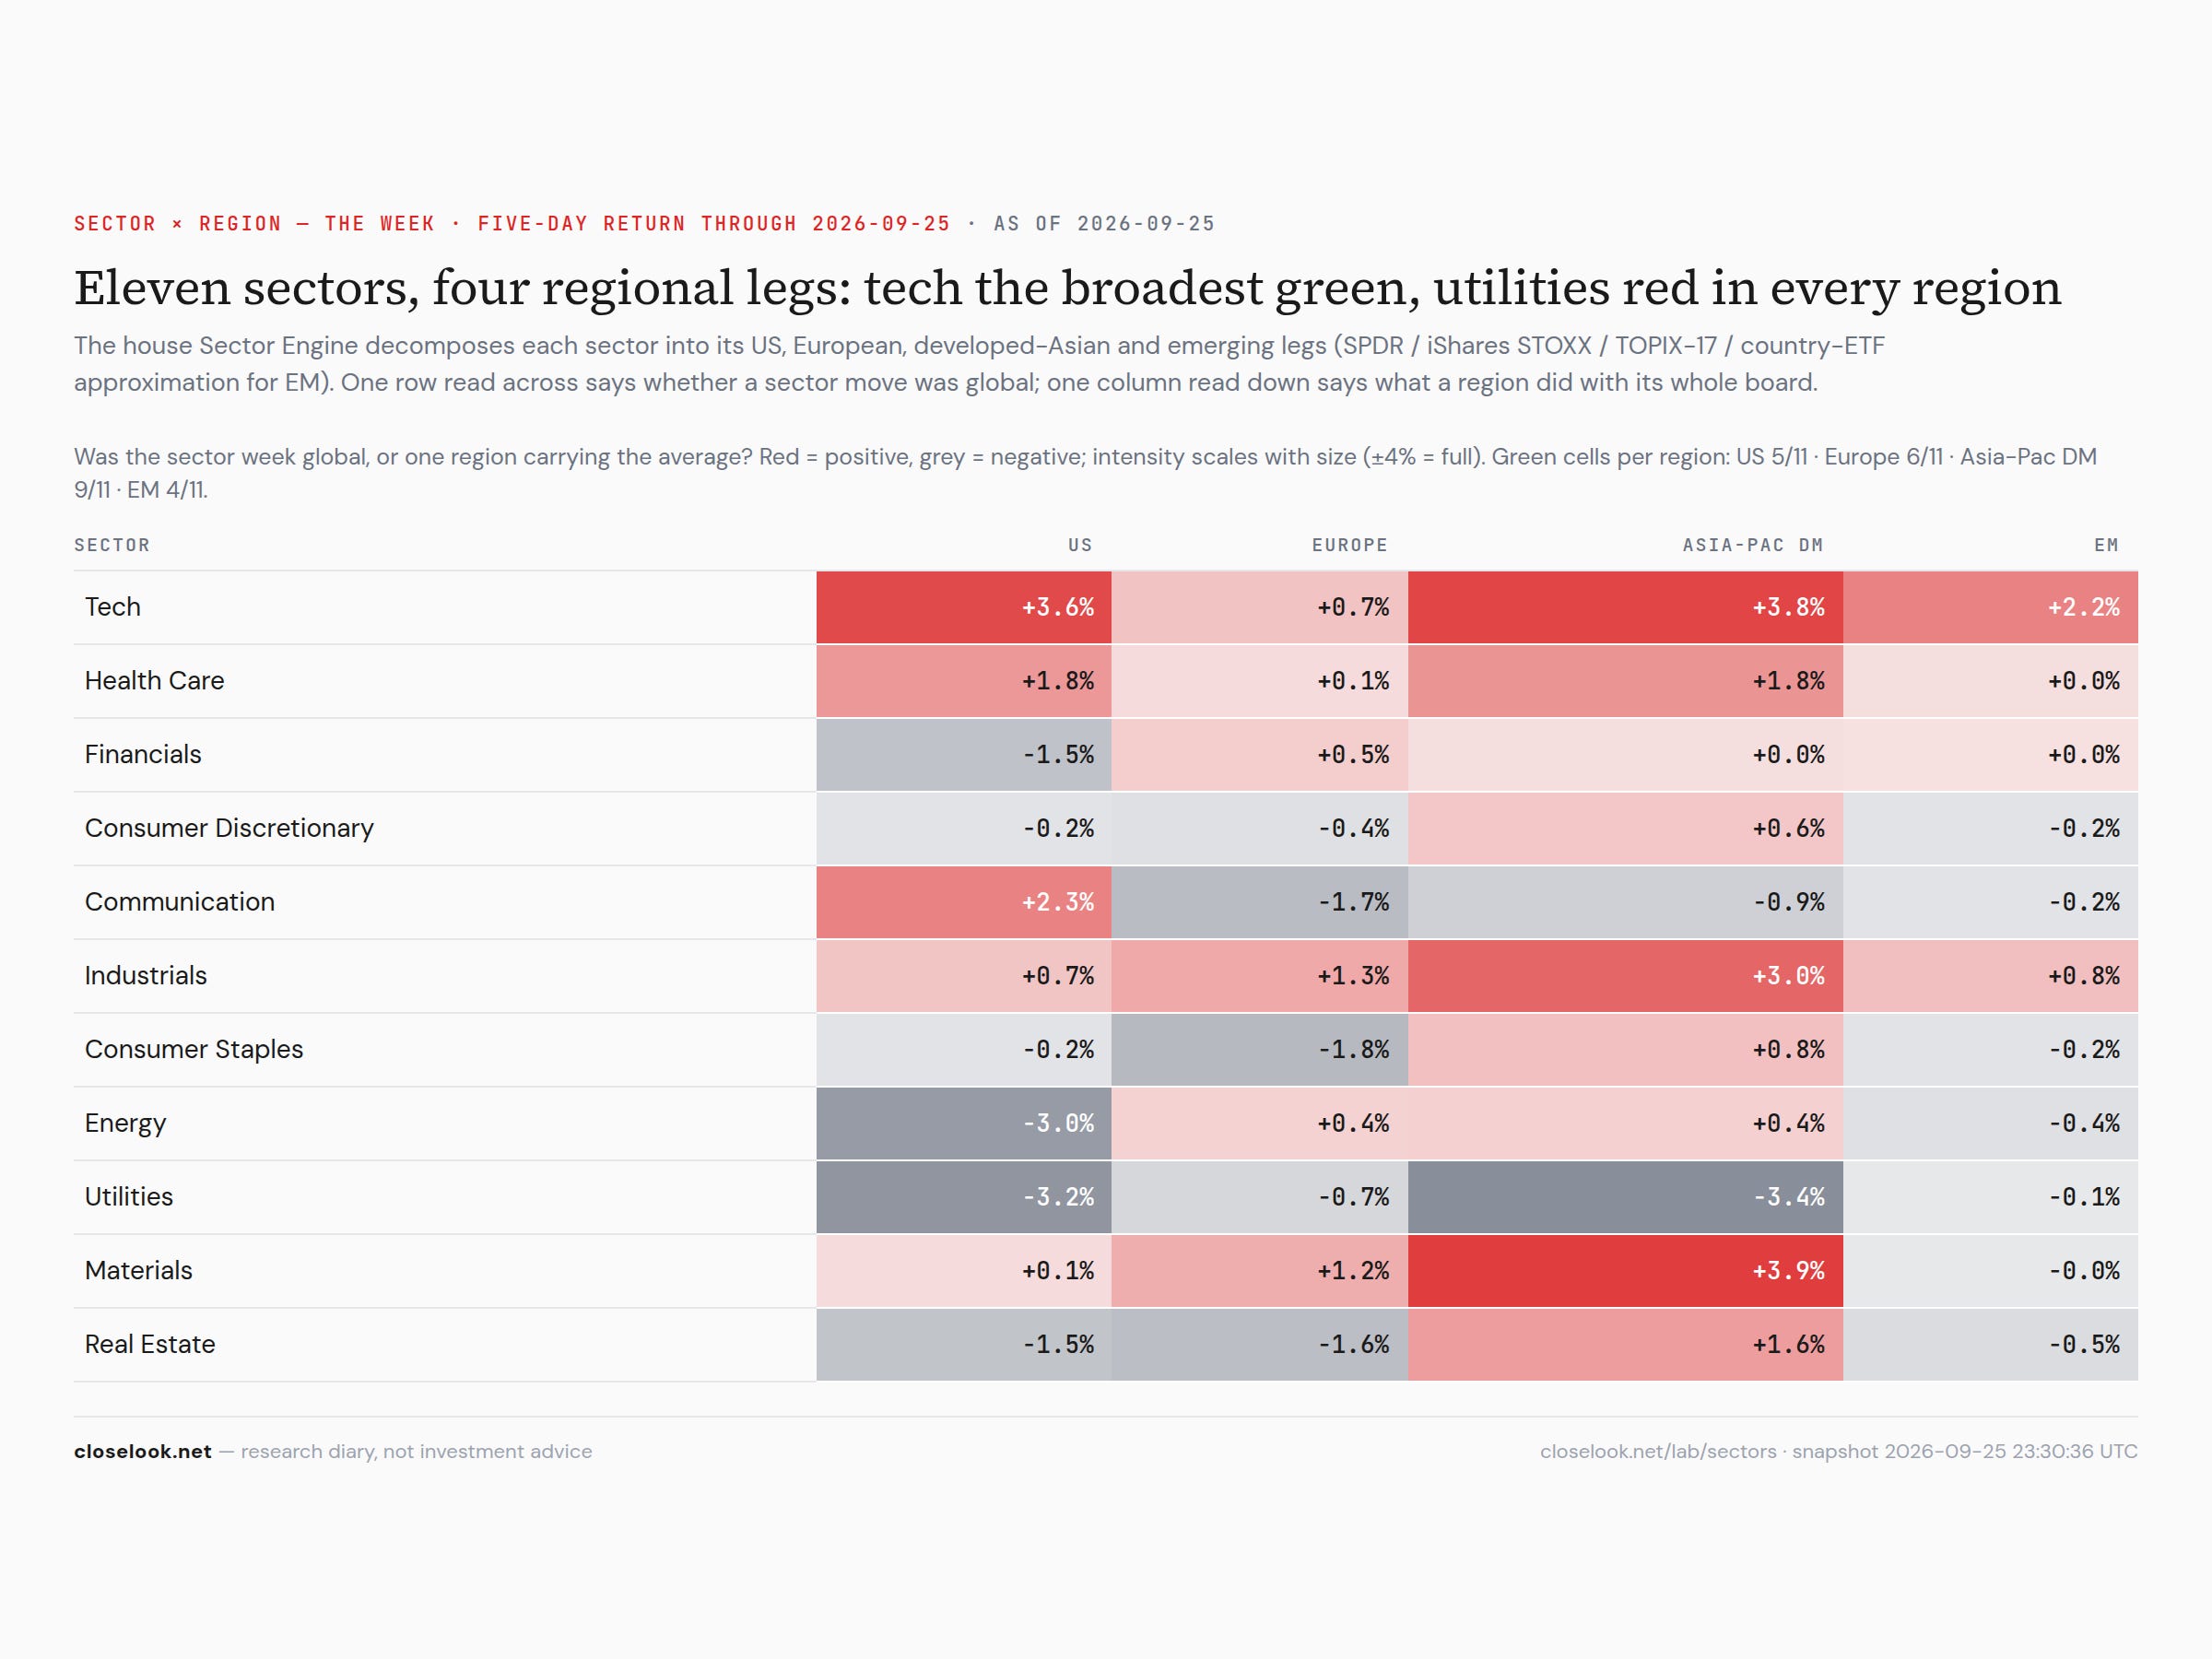
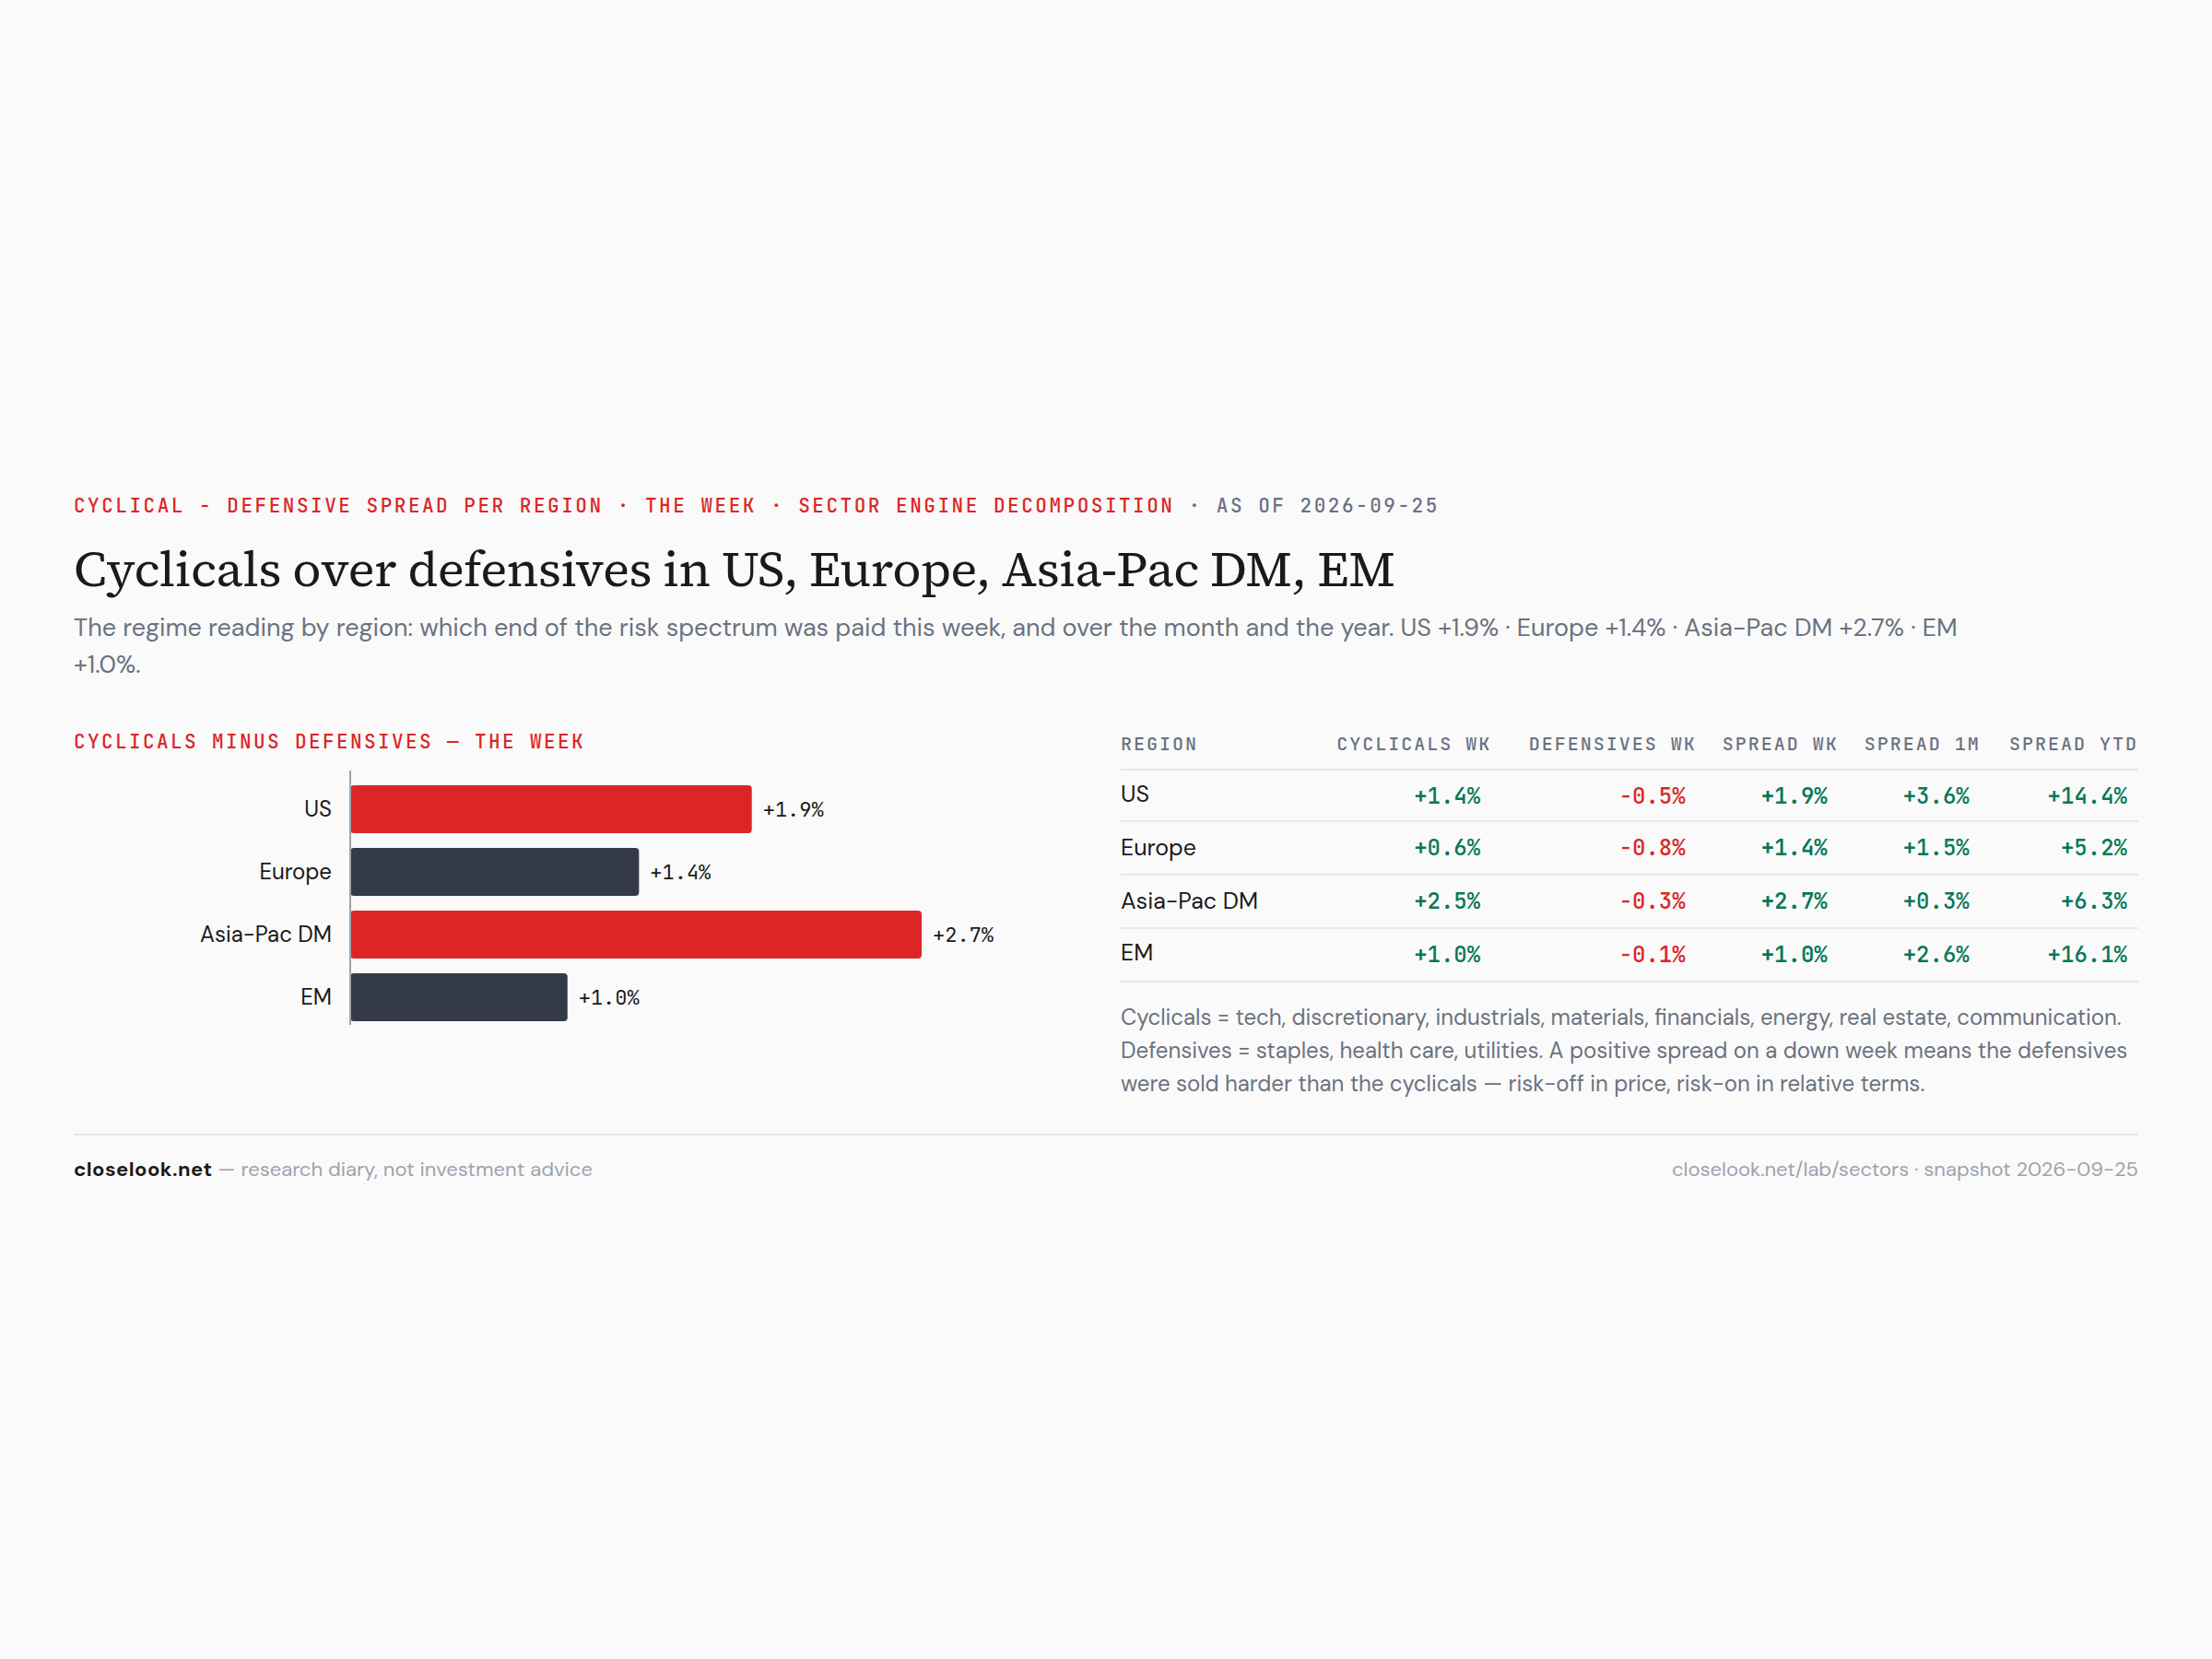
Was the sector week global, or one region carrying the average? The house Sector Engine decomposes each of the eleven sectors into its four regional legs. Technology was up in all four: the US +3.6%, developed Asia +3.8%, emerging markets +2.2%, Europe +0.7%. Developed Asia also carried industrials +3.0% and materials +3.9%; the US carried communications +2.3%. Utilities fell in three regions of four — the US −3.2%, developed Asia −3.4% — and energy fell 3.0% in the US while rising in Europe and Asia. Tech green in every region, utilities red in most: that is the rate story and the AI story on one grid, and they point in opposite directions.
The Global Compass
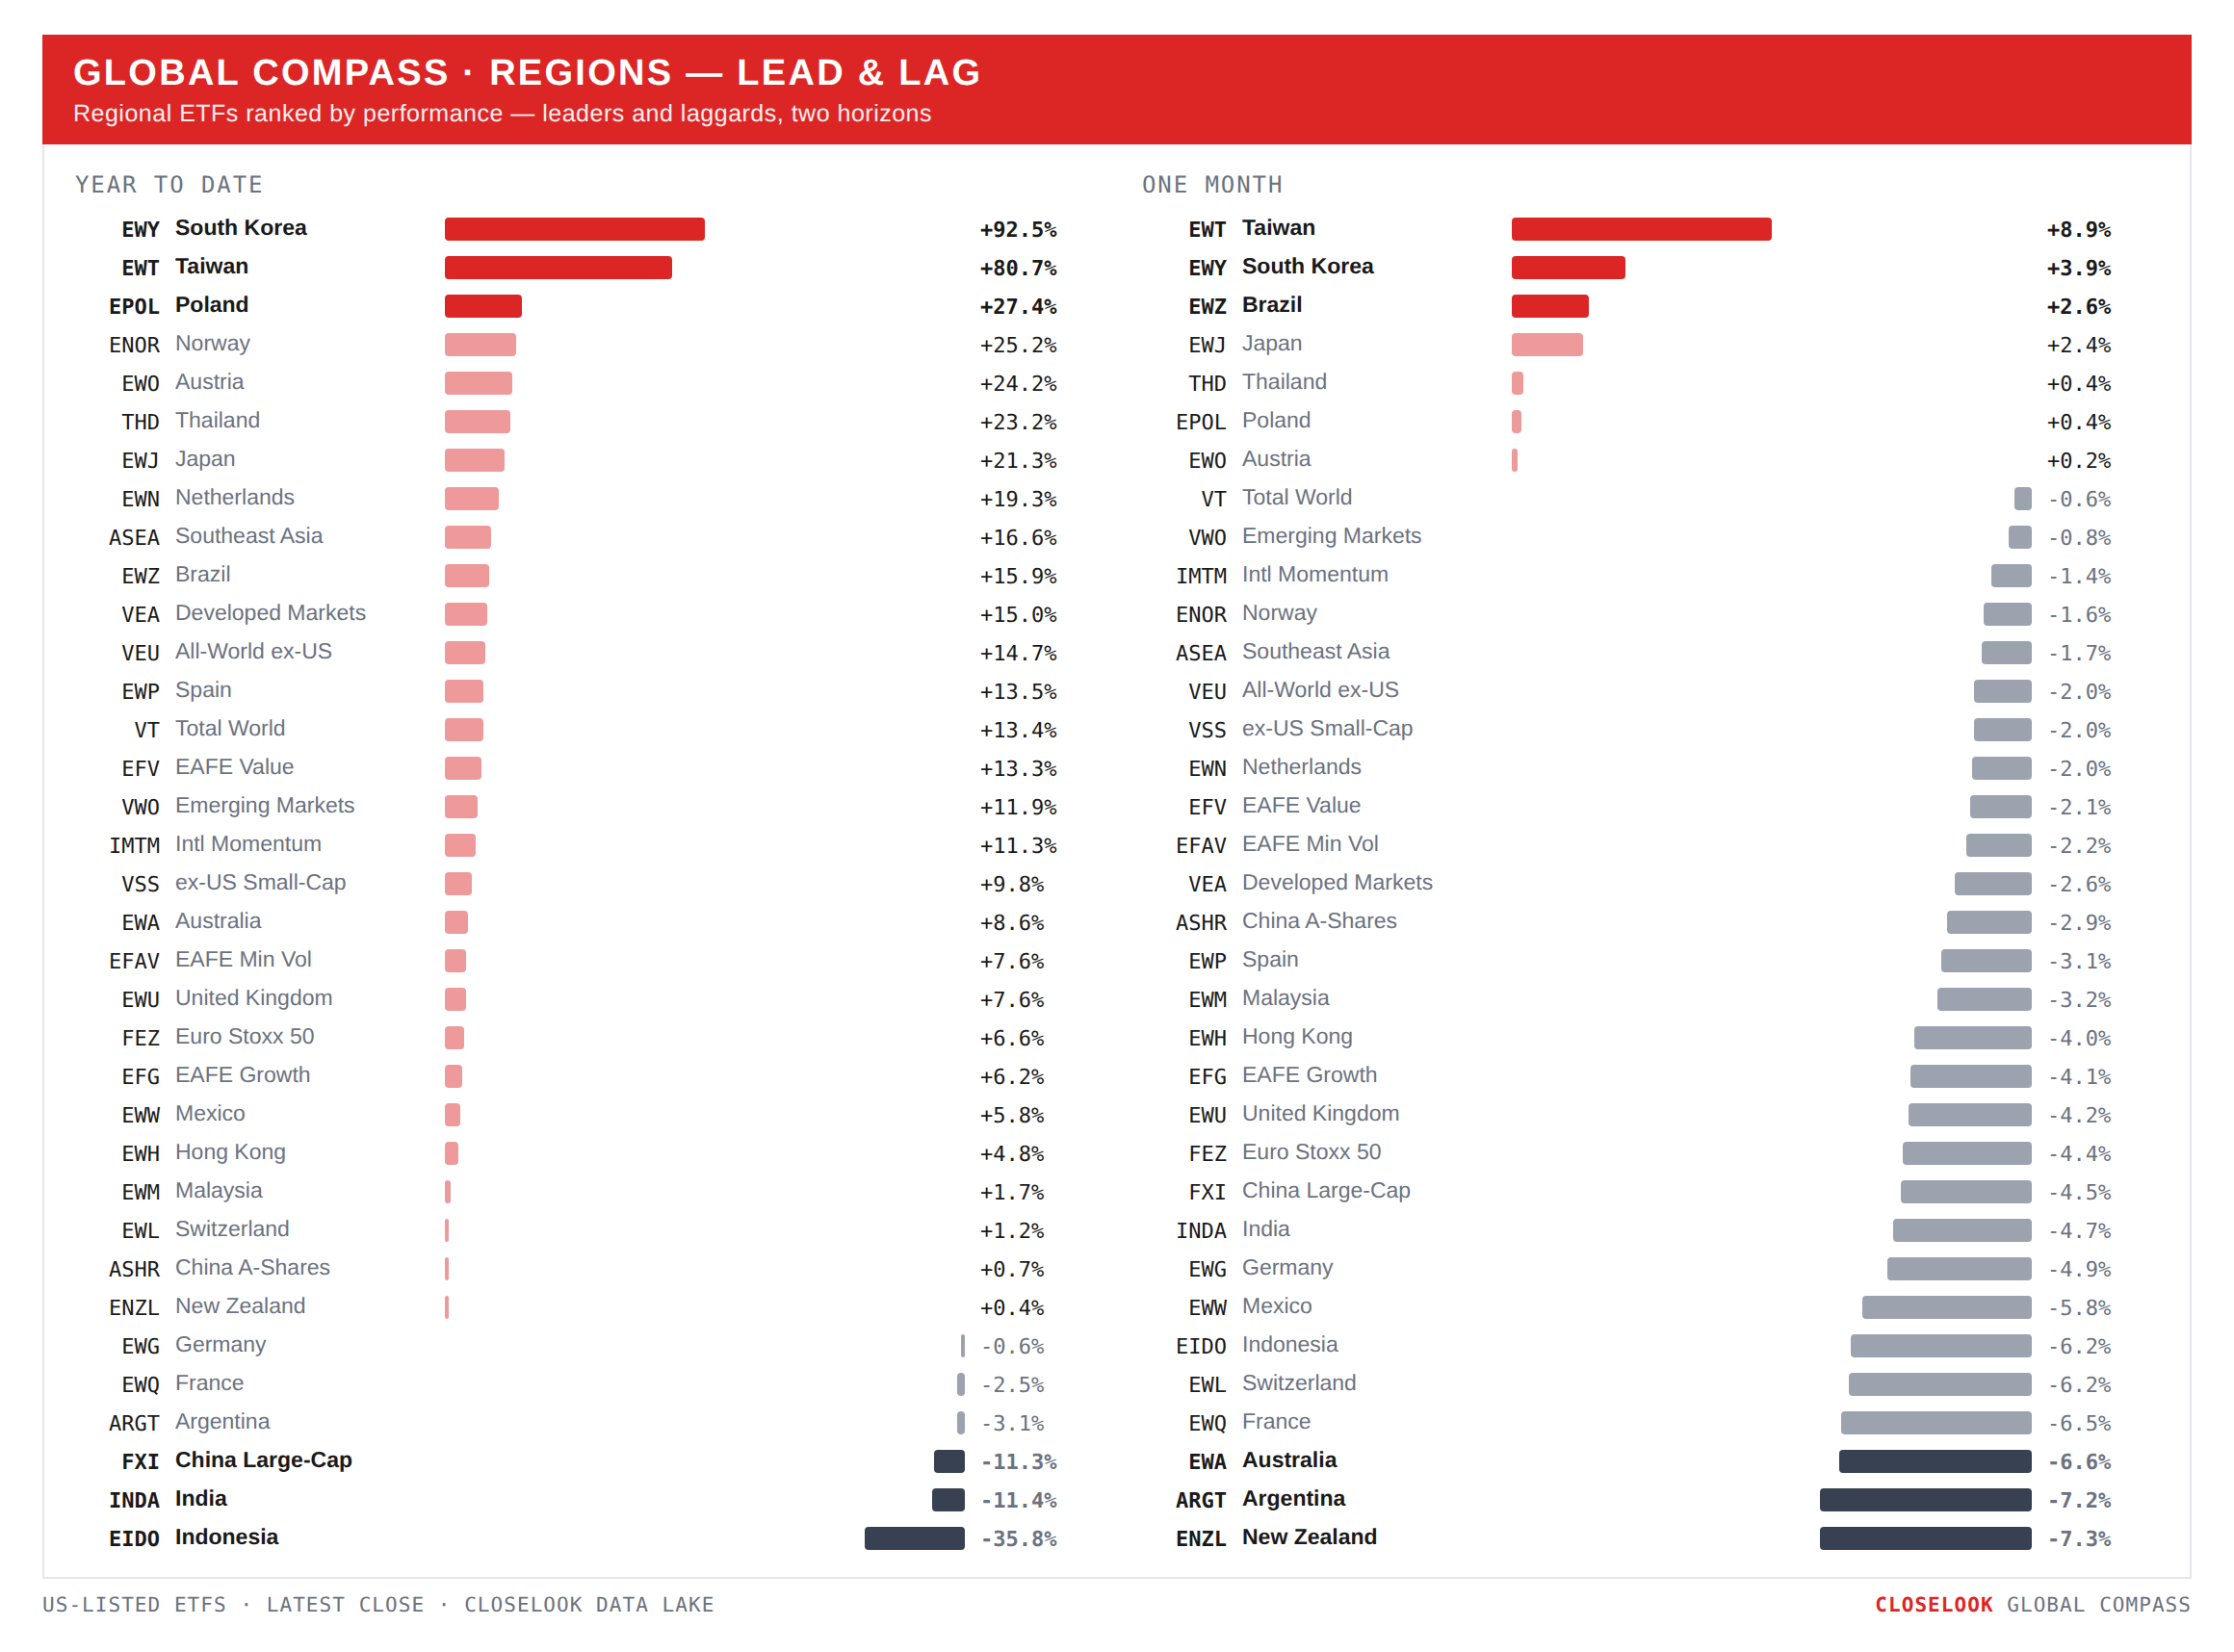
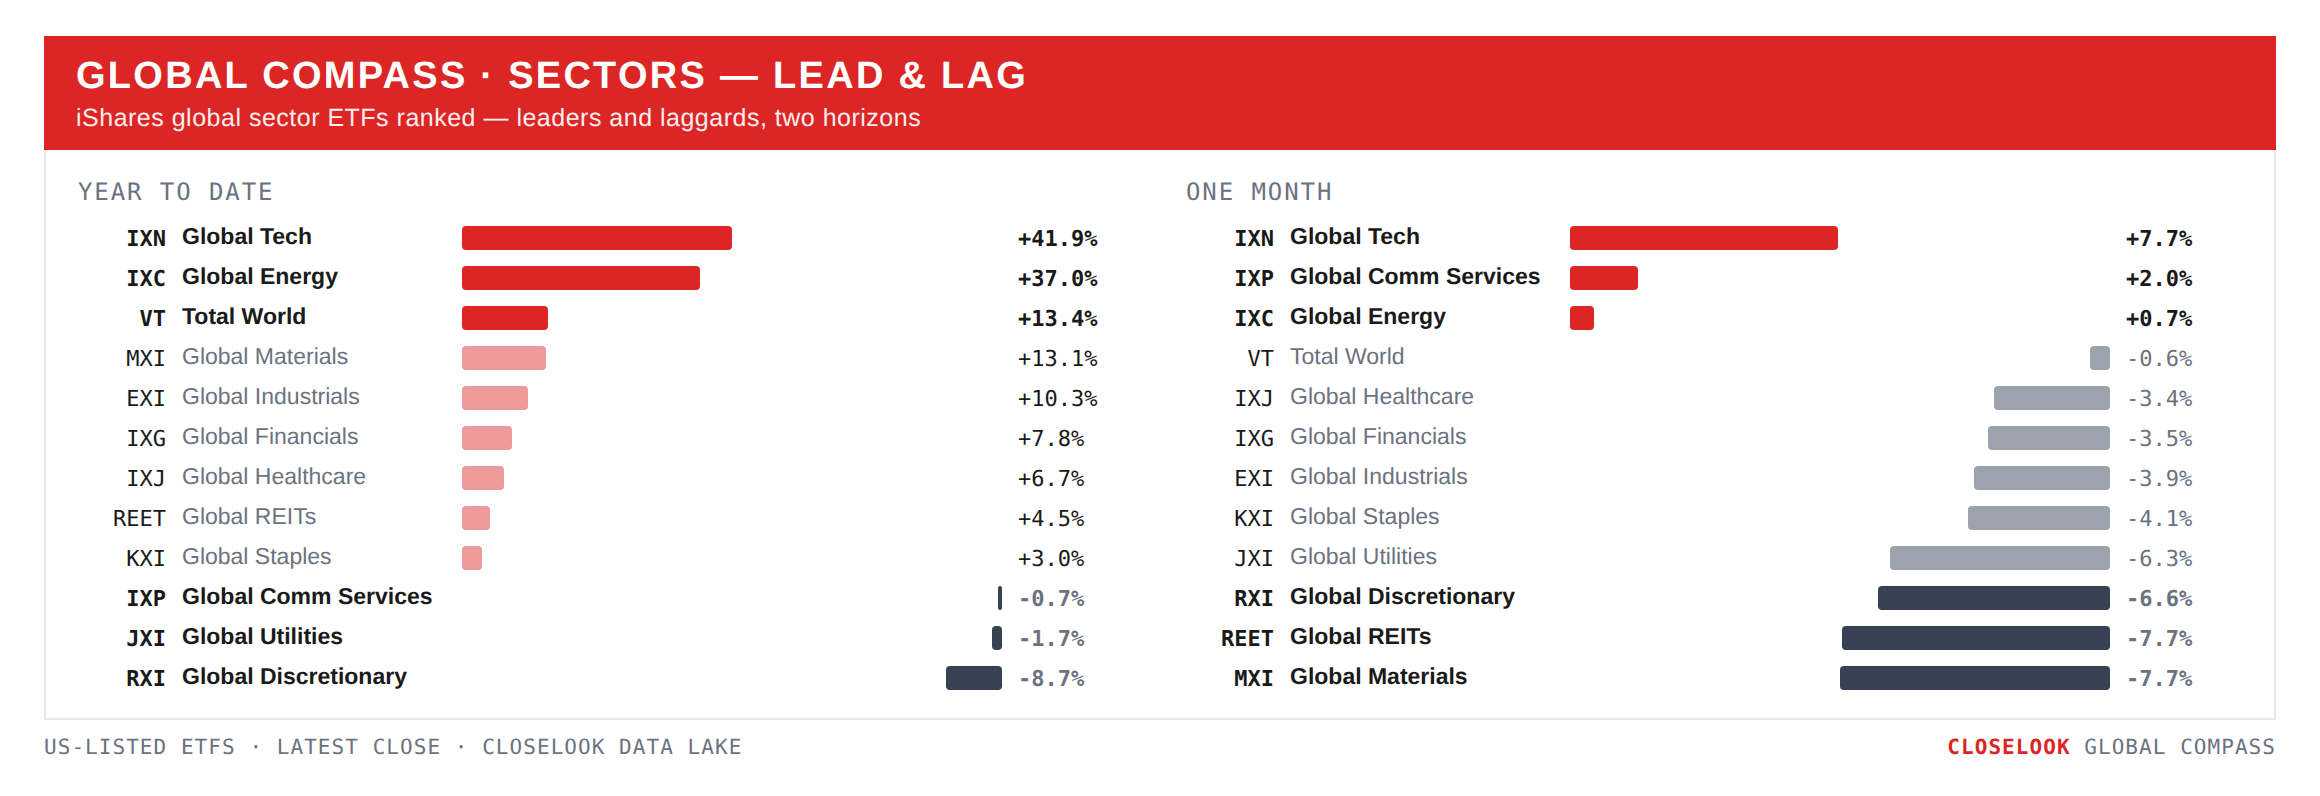
Regions: developed beat emerging on the broad wrappers; the corridor beat everyone. VEA +0.64% against VWO +0.25% — developed ahead on the broad wrappers, but the ranking underneath is Asia’s chip exporters on top and China, Brazil and Indonesia at the bottom. Emerging is two markets again: the chip exporters and everyone else. Asia ex-Japan’s broad fund rose 1.93% on the week.
Sectors: cyclicals over defensives in every region. The engine’s cyclical-minus-defensive spread was positive in the US (+1.9 points), Europe (+1.4) and developed Asia (+2.7) — the same sign in all three regions the engine reports in full, the first time in three weeks. Last week Europe bought its defensives; this week it sold them. A rate rise that sells defensives and buys cyclicals is a rate rise the market is reading as growth, not as a squeeze.
Sectors: the leaders’ bench, at the new distances. Technology 148.96, 0.5% under its June high after +3.70%. Industrials 193.47, 6.5% under August. Financials 130.21, 5.0% under its September 3 record, three weeks under its line. Materials 109.33, 7.7% under its August 25 record, five weeks under the February line. Last week the growth pair and the commodity pair were four and seven percent under. This week tech closed almost all of its gap and financials widened theirs. The bench has split.
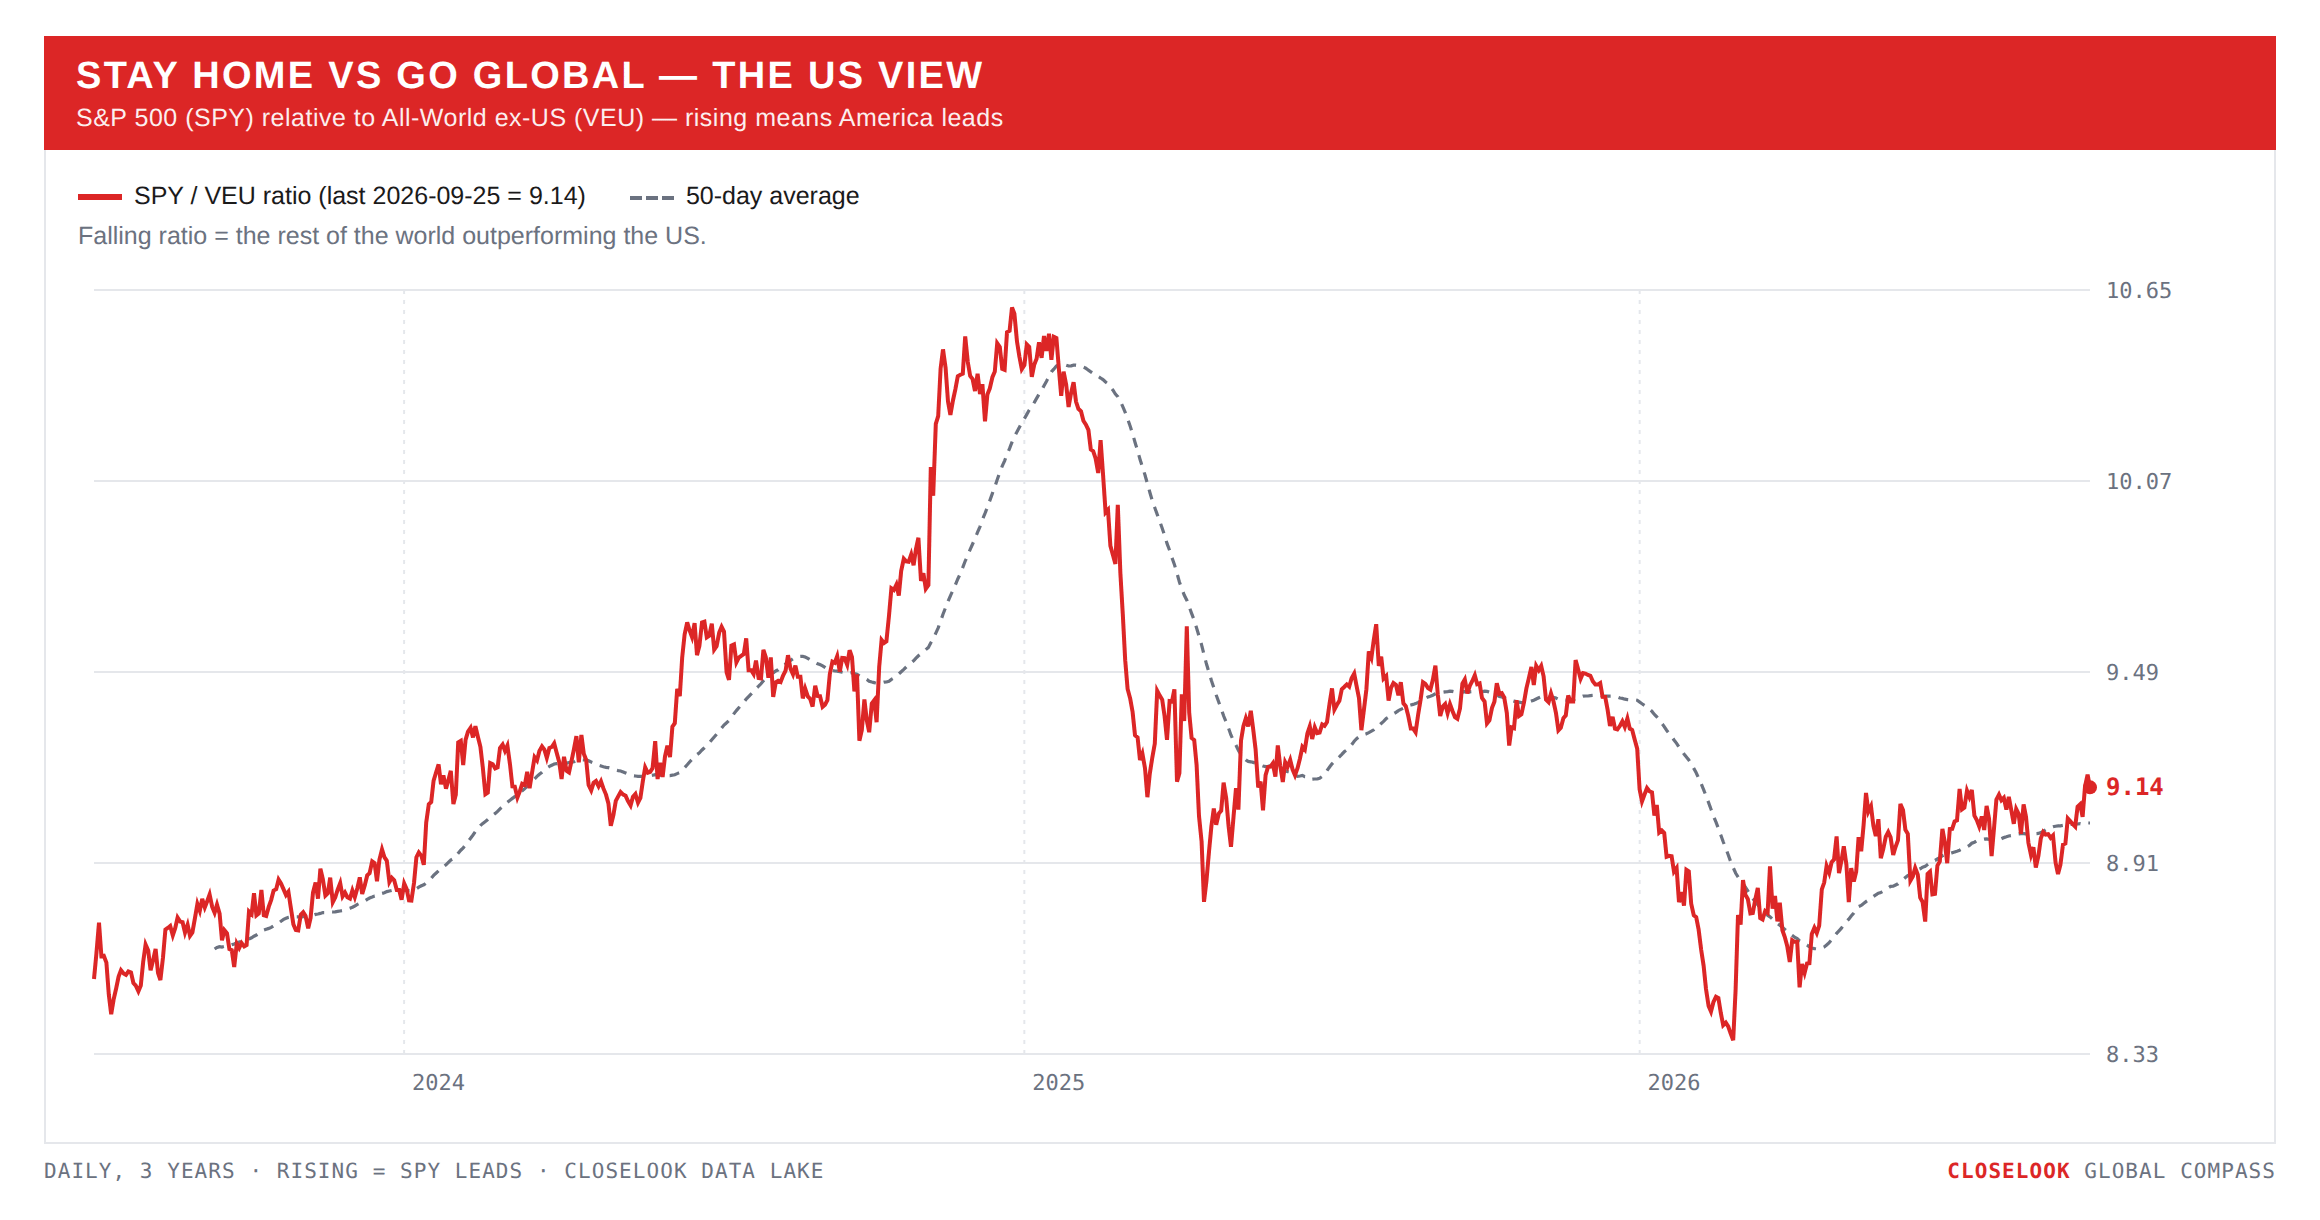
Stay home vs go global — the US view. America won a third week: SPY +1.27%, VT +0.93%, VEU +0.62%. The year still reads ex-US first: +14.7% against +13.5% against +13.1%, the lead 1.6 points and shrinking every week this month. The house cointegration monitor lists the VEU/SPY pair as breaking. The trend is intact on the year and losing on the month, and the letter’s lines say which of those matters next: 84.30 was retaken on Friday, by eight cents.
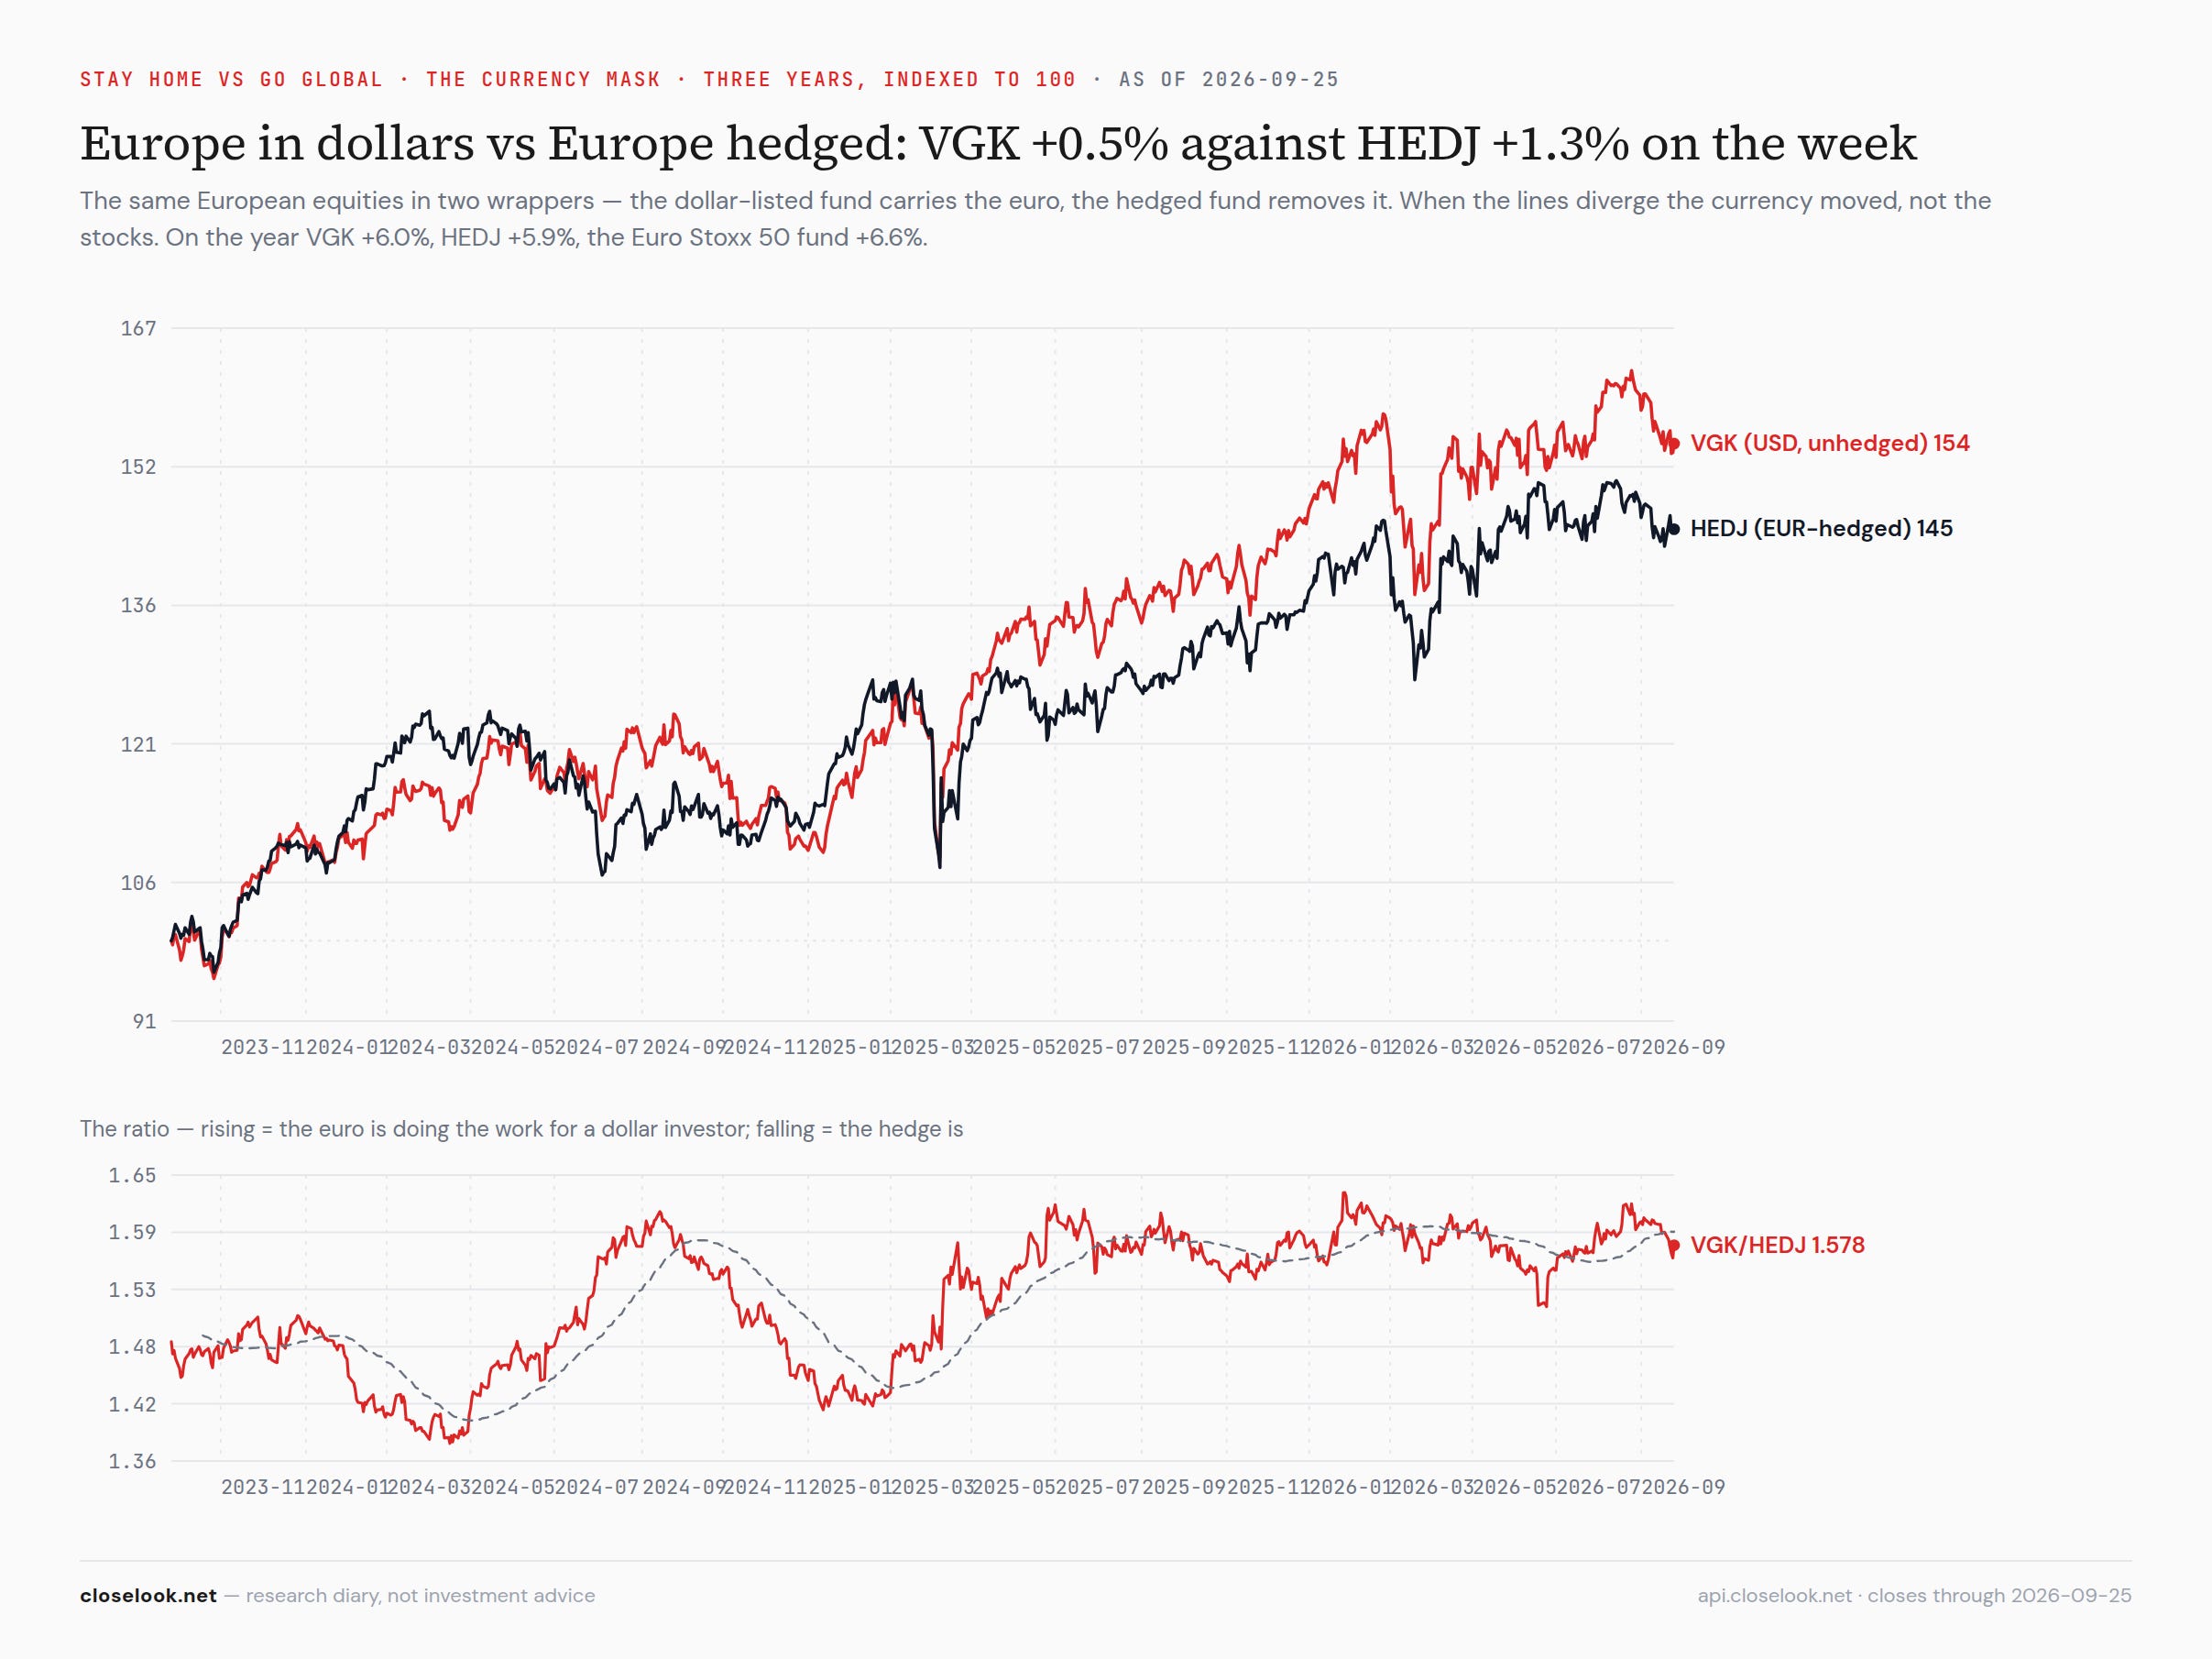
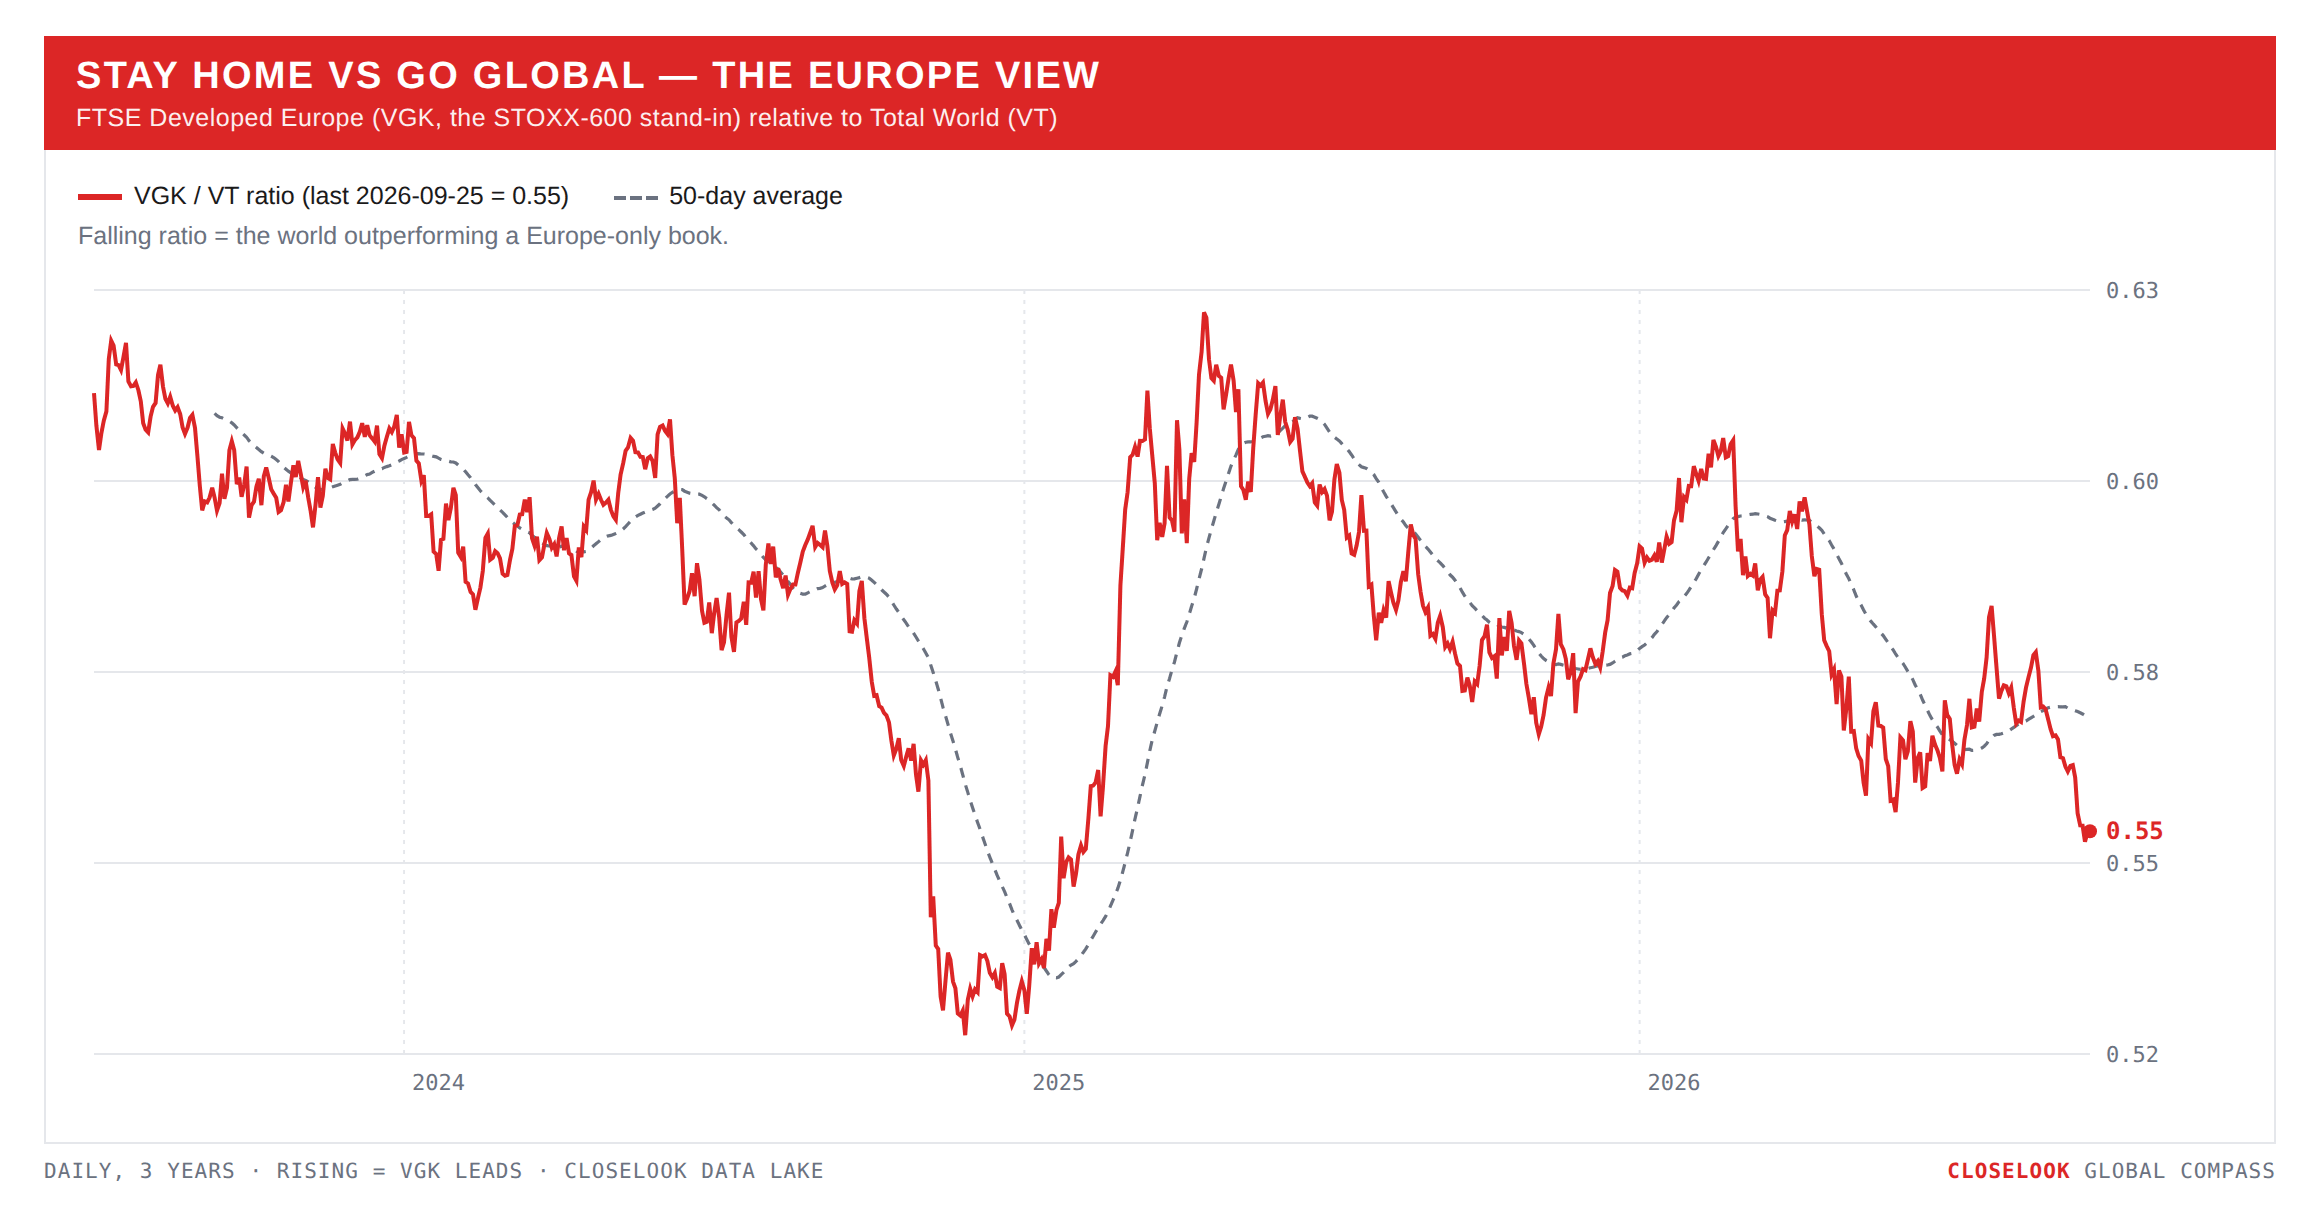
Stay home vs go global — the Europe view: the mask flipped a sixth time. The euro-hedged Europe fund rose 1.30% while the dollar-listed one rose 0.48% — the dollar index up 0.9% again. In local terms: the STOXX 600 +0.50%, the Euro Stoxx 50 +1.07%, the DAX +0.41% to 25,409, the CAC +0.16%, the FTSE 100 +0.34%, Spain’s IBEX +0.95%, Switzerland’s SMI +1.15%. Europe rose in its own currency and gave half of it back in the translation, for a second week.
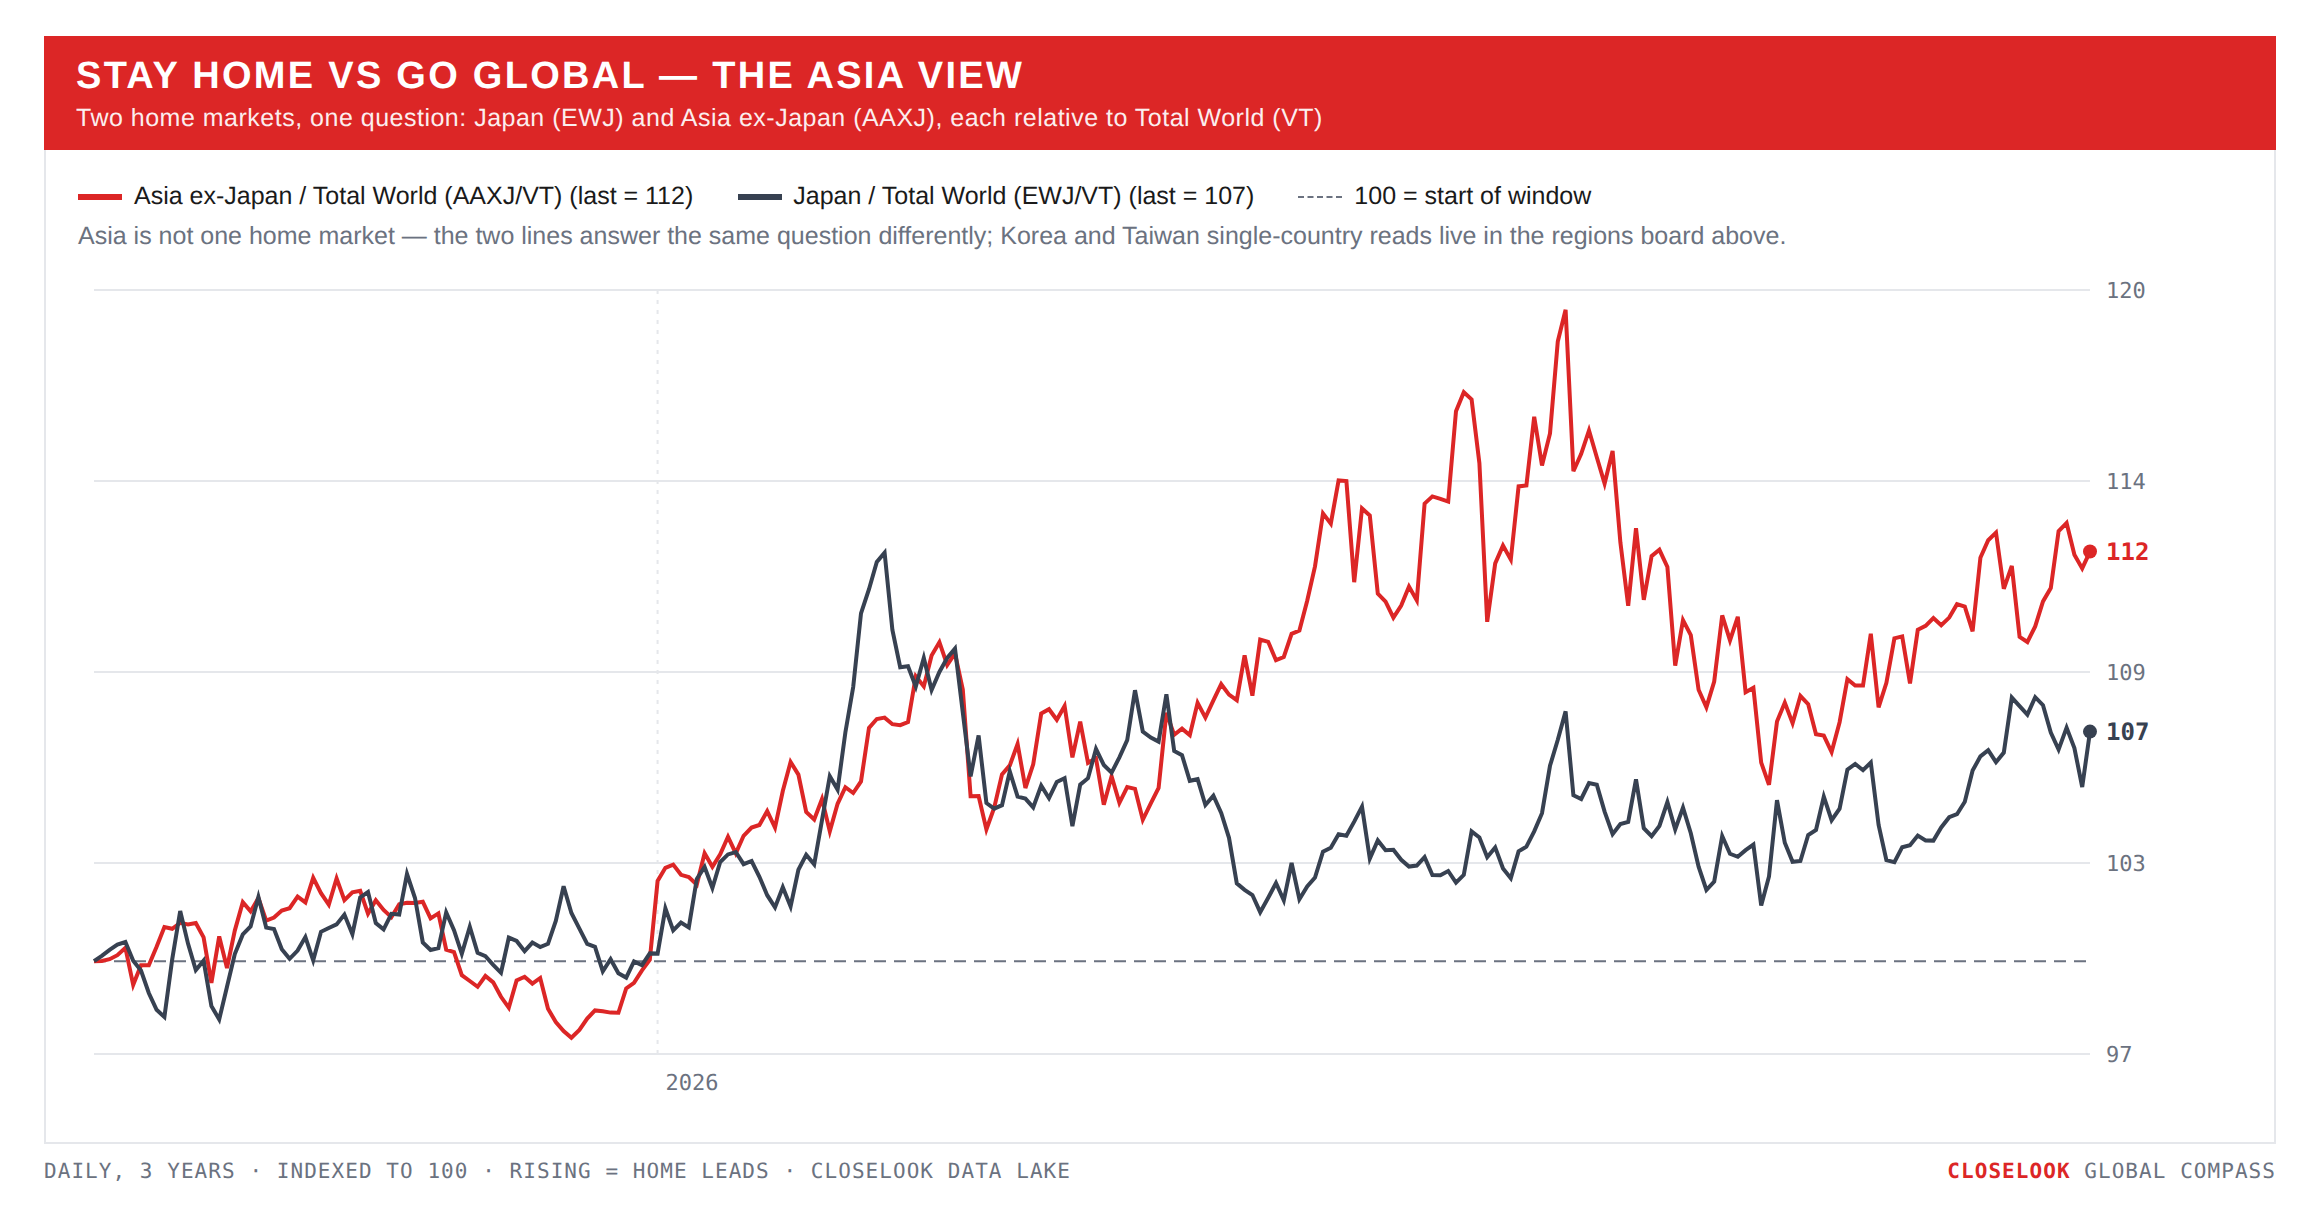
Stay home vs go global — the Asia view: the wrappers caught up with their home markets. Last week every Asian home market beat its dollar wrapper. This week the gap closed from the wrapper side, because the holidays shifted the sessions. Korea: EWY +3.24% on five New York sessions, the Kospi +2.7% on three Seoul sessions before Chuseok. Taiwan: EWT +2.81%, the Taiex +1.8% on four sessions before Mid-Autumn. Japan: EWJ +0.96%, the Nikkei +2.1% on two sessions. The yen closed the week at 157.19, after 158.81 on Thursday, with Japan’s finance minister Katayama saying on Friday that President Trump had raised the weak yen with Prime Minister Takaichi. The memory vehicle DRAM closed 61.91, up 3.86%, above the 58 line on every close of the week.
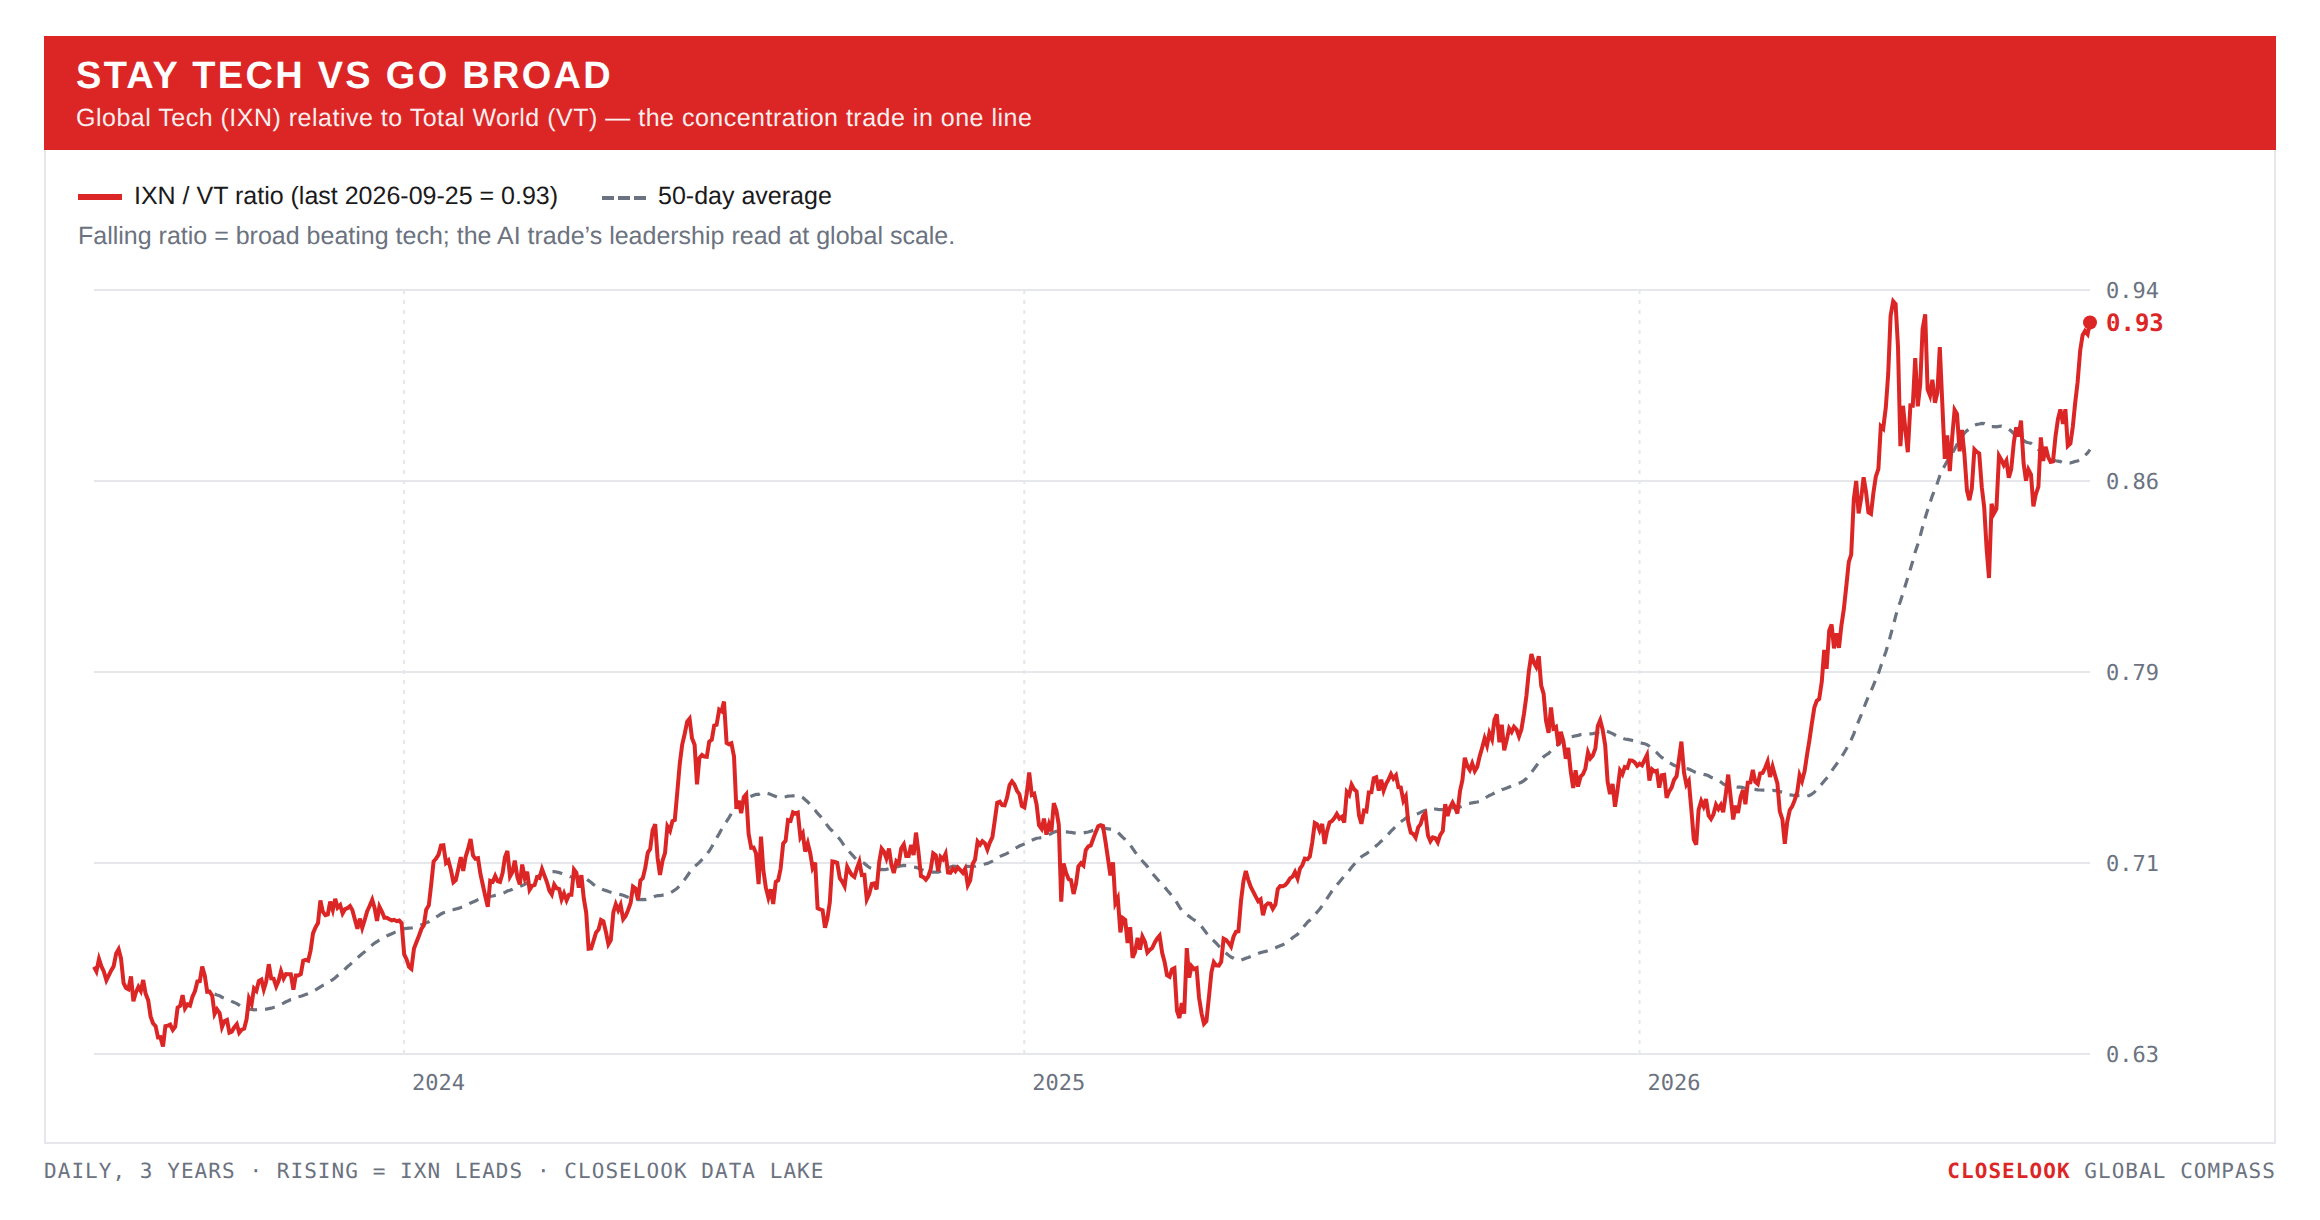
Stay tech vs go broad. Tech led by a distance, at home and abroad. The Nasdaq 100 +3.25% against the S&P’s +1.21% and the equal-weight S&P’s −0.56%; global tech +3.70% against the world’s +0.93%. Technology was the best US sector and the best global sector. Last week tech led by its code and on Friday by its silicon; this week it led by its silicon all week and by its applications on Monday and Friday.
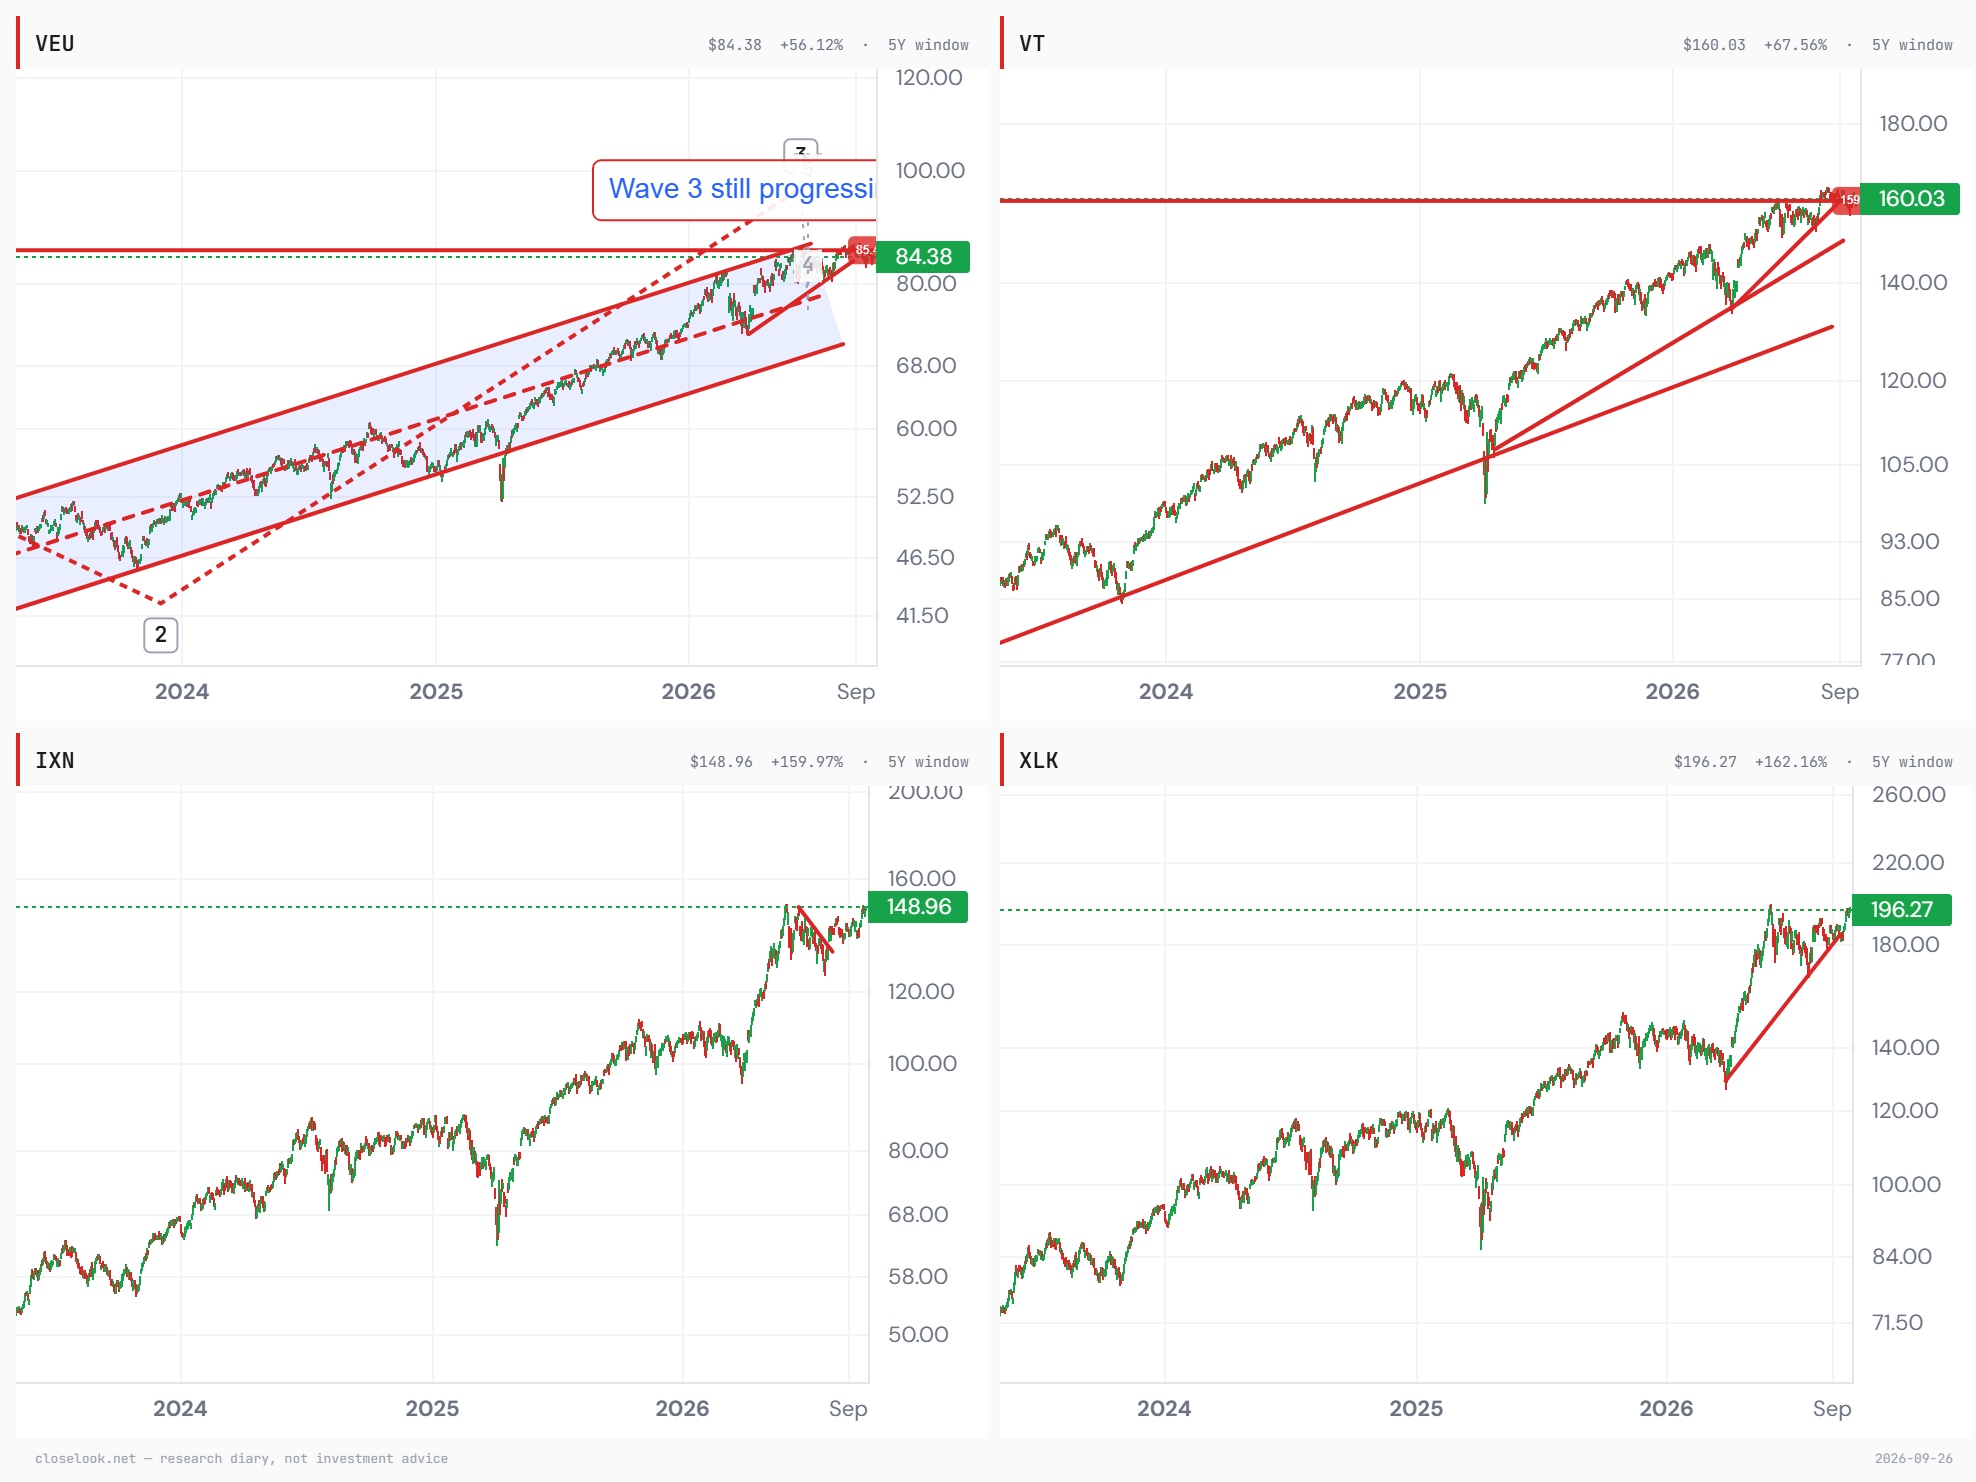
The editor’s five-year grid puts the four side by side: the world ex-US and the all-world fund pressing on their summer shelves, global tech at 148.96 and the US tech sector at 196.27 both back at the level of their summer highs. The broad indices have not broken out; the tech indices are at the door.
Momentum vs defensive — momentum up, min-vol down. International momentum rose 0.74% to 53.39, 1.25 under its August 17 high of 54.64. International min-vol fell 0.15% to 92.84; global min-vol −0.62%. On the year momentum leads +11.3% against +7.6%. For two weeks both ends fell together; this week they sorted the normal way for a risk-on week.
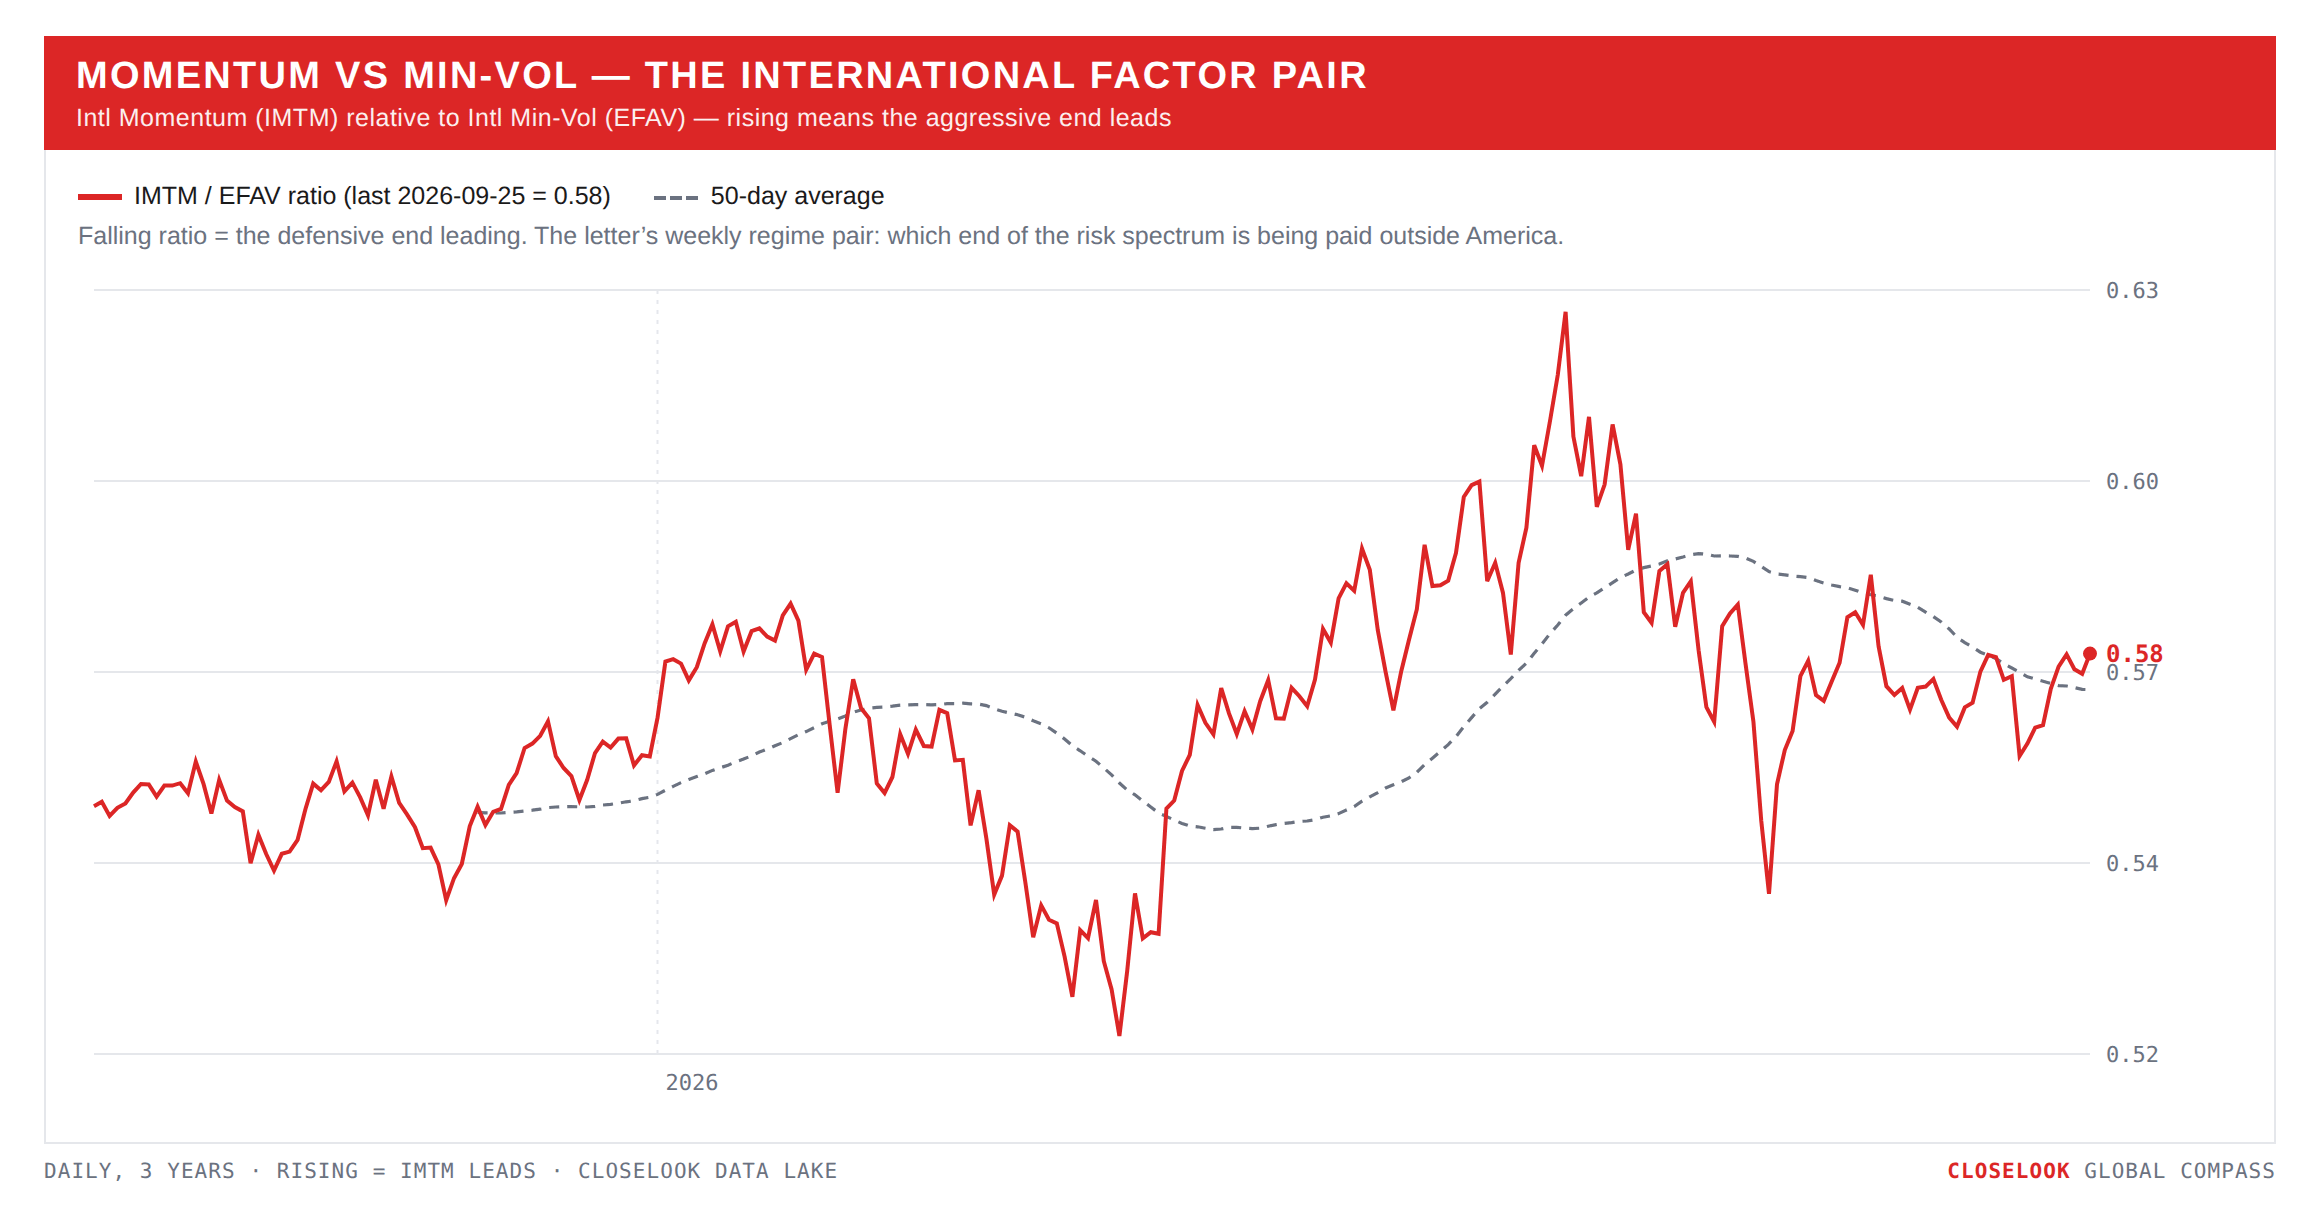
One more pair: growth over value, a second week. EAFE growth +0.69% against value +0.06%. On the year value still leads, +13.3% against +6.2%. The commodity exporters that carry the value side — Norway −1.77%, Brazil −1.87%, Australia −1.11% — fell with their barrel and their metals.
The Closelook letters — where this one sits. The house thesis, compressed: the stock market is a growing system at the aggregate level in which most constituents slowly fade while a small group massively outperforms — and that group changes dynamically; it never stays static. Own the aggregate, know the current winner group, watch for the rotation. Right now the winner group is the AI stack, and the live question is which of its layers — building, operating, using — earns the next leg. This week all three were bought at once. This letter reads the map (regions, currencies, rates); Sunday’s US letter reads the tape and its levels; Sunday evening’s Hypergrowth letter reads the names.
2 · The State
The mechanism, named: a growth rate rise, not a squeeze. Put the week in order. Monday: Korea’s customs data put chip exports up 259% in twenty days, the Kospi through 7,000, Meta +11.3% on its agent’s app-store rank, Arm +14% and Intel +13% at midday, bitcoin to 86,603 on the close, the Nasdaq Composite at a record close. Tuesday: a second Composite record close, the Nasdaq 100 at 30,732, its highest close of the past year, and AMD into the trillion-dollar club; the world index to 85.44, above its lost line. Wednesday: the flash business survey showed US output growing at its fastest pace in more than five years, Governor Barr said further rate increases are likely, the ten-year went back above 5% and closed at 5.11%; the US–China trade truce was extended to 10 January; Meta’s Connect named its retail partners after the close. Thursday: the thirty-year touched 5.45% and Oracle invoked force majeure on a New Mexico data-center campus — Arm fell 7.9% on it, Meta rose 4.5%, Tokyo reopened with its chip-equipment makers leading, and a Trump–Xi meeting produced warm words, two pandas and no major agreement. Friday: Microsoft +3.6% on Copilot, Meta −3.3%, oil −4% on US–Iran talk, the thirty-year closed at 5.50%.
The yields rose on a growth number and a hawkish sentence, not on an inflation scare or a funding accident. That is the kind of rate rise equities can absorb — and this week the ones that absorbed it best were the ones with the most growth to discount.
What did not choose: the belly and the long end, both at new lows. IEF spent a seventh consecutive week under the 93.17 reclaim line — 91.15, 91.16, 90.19, 89.69, 90.00 — with Thursday’s 89.69 a new fifty-two-week-low close. TLT: 81.80 Monday, 81.75, 80.46, 79.42, 79.32 — two new lows to end the week, and the 81.2 line it held by a nickel last Friday lost on Wednesday. The pattern the letter has named for seven weeks, the belly trying and failing, turned into the long end failing too. Last week the bond veto over the equity read was engaged on the belly and a dissent on the long end. This week it is engaged on both, and the equities did not listen.
The rate rise is global — and it has three different reasons. The house sovereign pressure index rose from 0.07 last Friday to 0.61, after 0.75 on Thursday; the equal-weight ten-year across the board’s sovereigns is 4.34%, up 10 basis points on the week and 38 in twenty-one sessions. Every ten-year on the board is higher than a month ago. The thirty-year yields at Friday: the US 5.50%, Britain 5.85%, Italy 5.10%, Japan 4.16%, Canada 4.22%, Germany 3.90%. The ten-years: Britain 5.36%, the US 5.17% (+51 basis points in twenty-one sessions), France 4.73%, Italy 4.55%, Greece 4.42%, Germany 3.60%, Japan 3.07%. The level is shared. The reason is not, and the reason is what matters for where the money goes.
America’s yields rise because its economy is stronger. The trigger this week was a business survey showing the fastest output growth in more than five years and a Fed governor saying more increases may be needed. A rate rise driven by growth is one equities can carry, and this week they carried it.
Japan’s rise because the Bank of Japan is leaving zero behind. The ten-year was 2.07% at the end of 2025 and is 3.07% now — a full percentage point in nine months; the thirty-year rose from 3.41% to 4.16%. The bank hiked to 1.25% last week, the highest policy rate in thirty-one years, and the yen still sits near 157. It is a normalisation, not a stress, but it takes away the cheapest money in the world, one step at a time.
Europe’s rise because sovereign credit is weaker — and France is where it shows. The French ten-year yield over Germany’s was 68 basis points at the end of June, 82 at the end of August, 104 last Friday and 113 this Friday — France’s widest in the house data series, which starts in January 2025, and thirty points of it in four weeks. The line has gone vertical. France now pays 18 basis points more than Italy and 30 more than Greece to borrow for ten years; at the start of 2025 it paid 31 less than Italy. The equity market has seen it: the French fund is down 6.5% in a month and 2.5% on the year, the CAC 40 is 7.4% under its August high, and the DAX 4.4% under its own. Germany’s spread did not move the Bund lower: the Bund rose to 3.60%, so this is not a flight into safety inside the euro, it is a sell-off with France at the front of it.
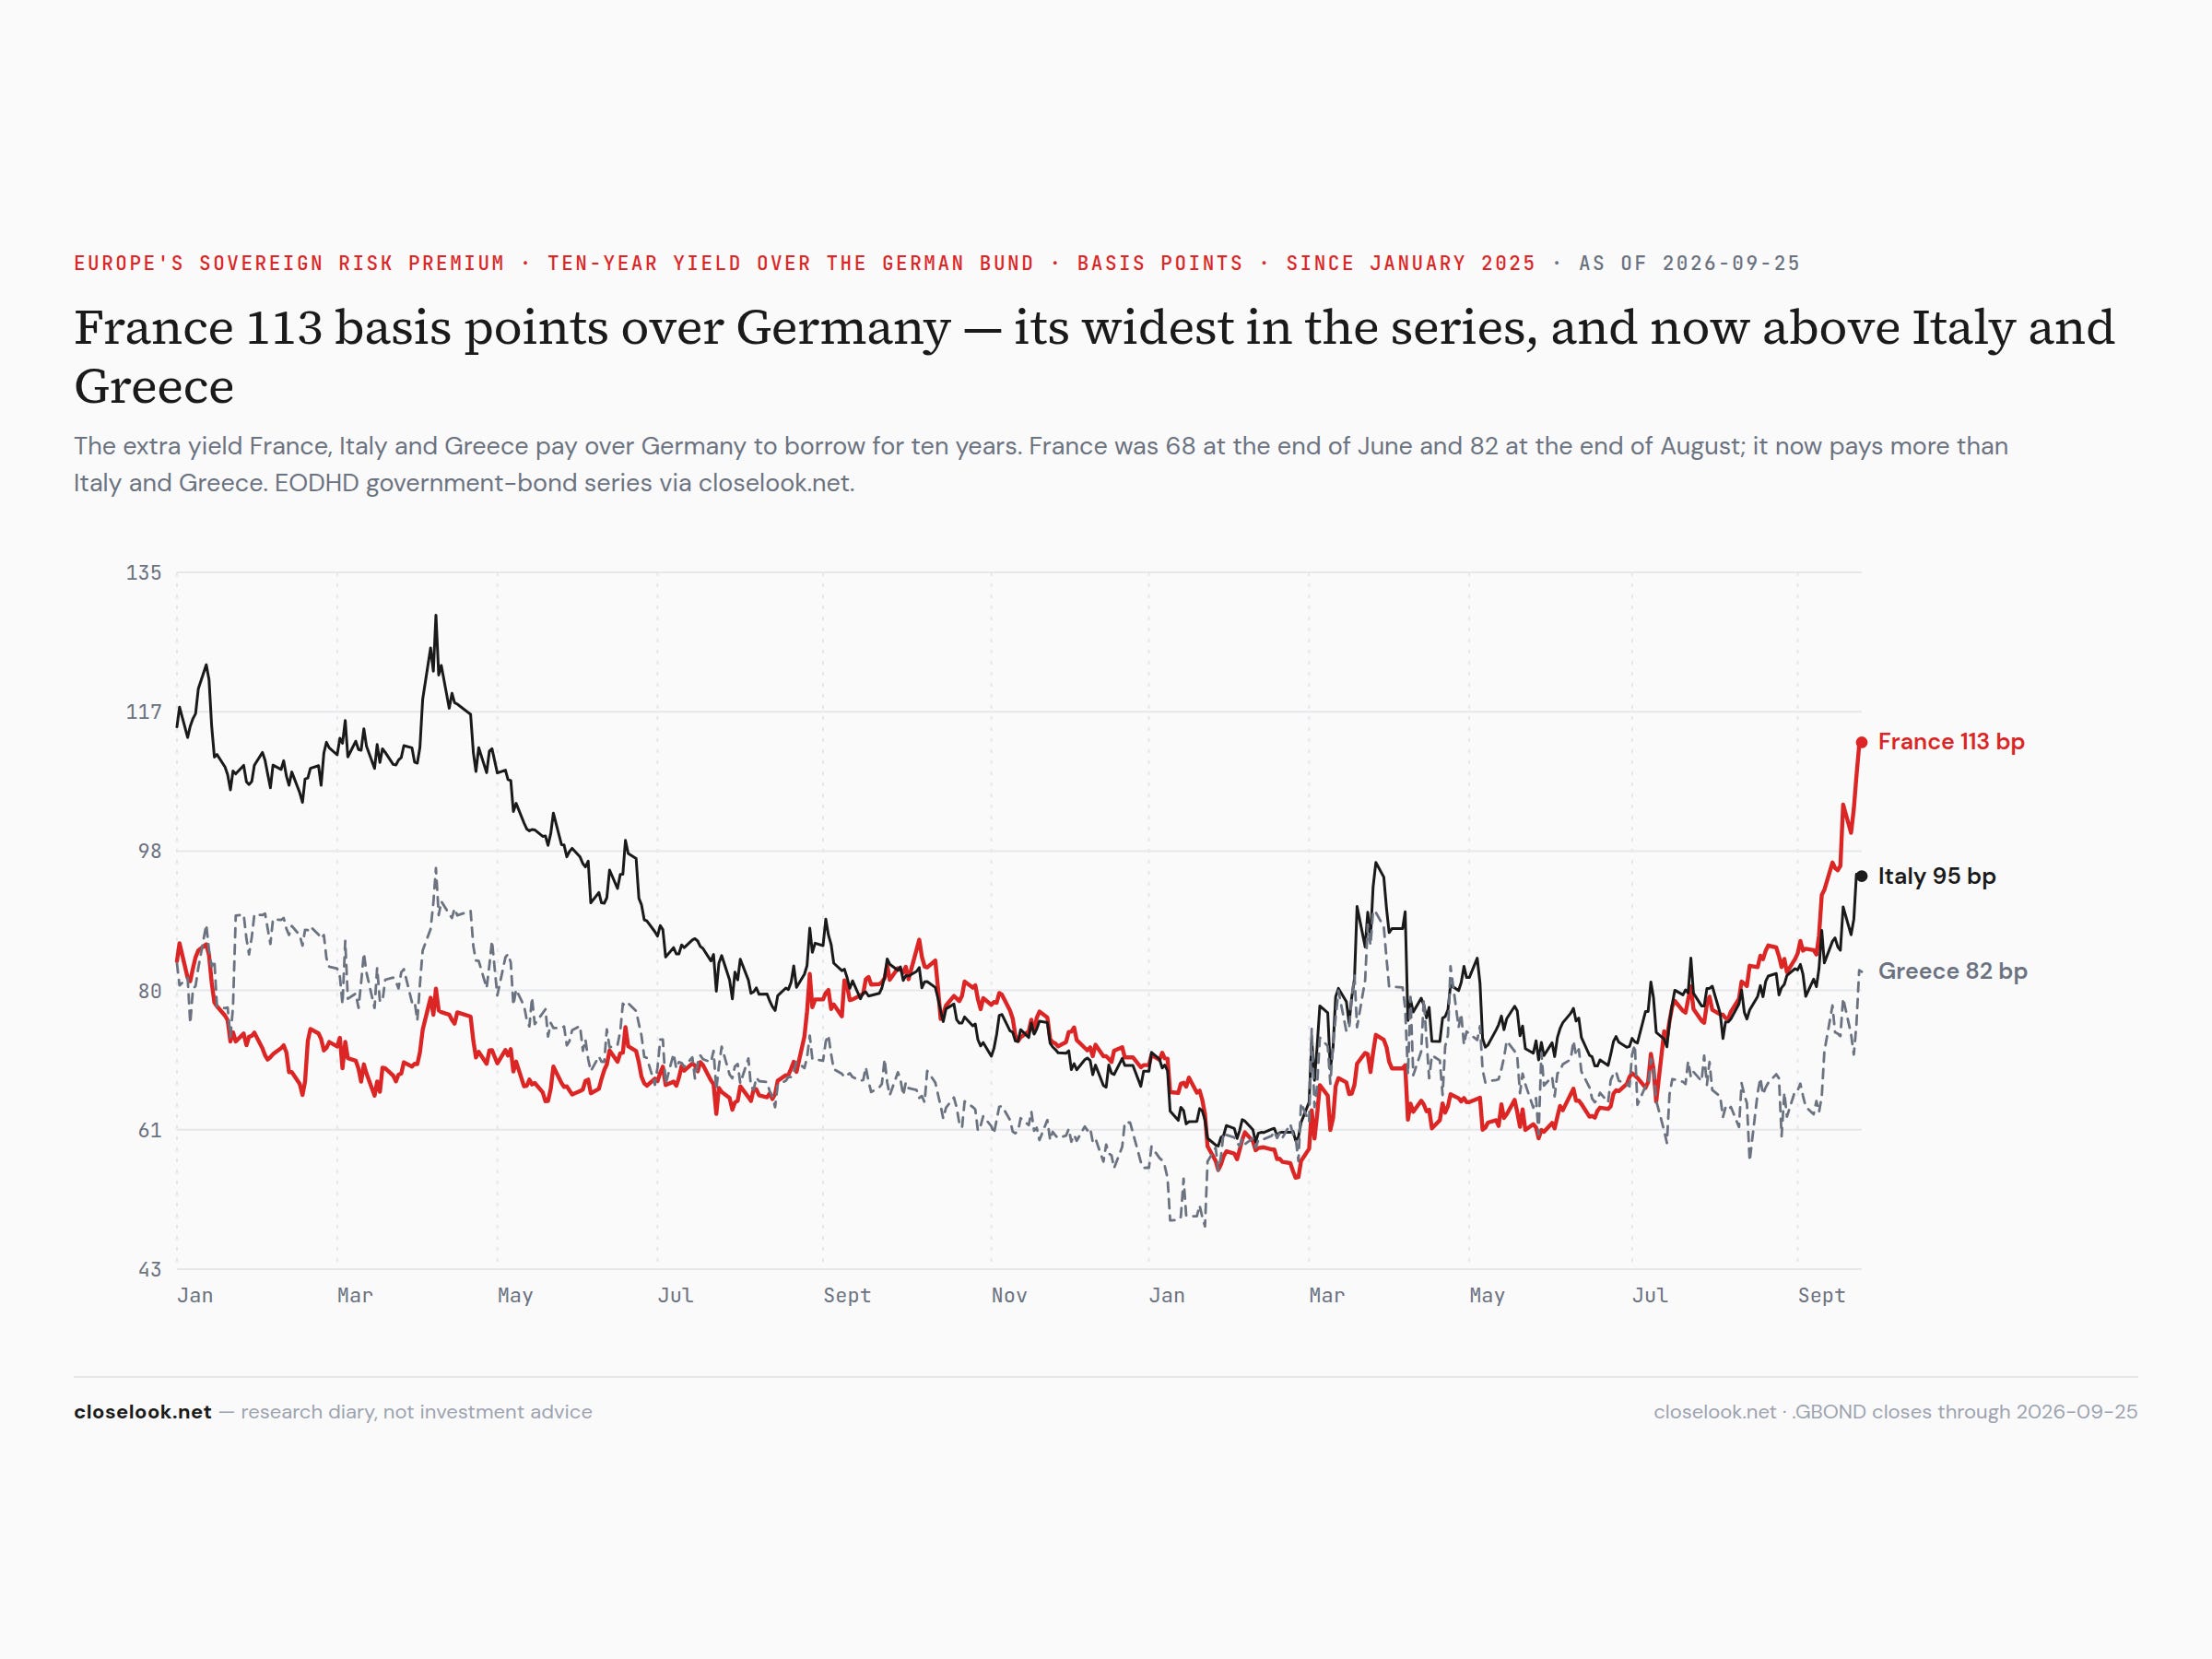
Where the next crisis may come from. This letter’s reading: the next funding crisis is more likely to start in Europe than in America, and France is the most likely place. The United States is paying more because it is growing; France is paying more because the market doubts its budget, and the country goes into a presidential election in the spring. Bond markets tend to pick their country before an election, not after it — the “bond vigilantes” test a government when its choices are still open. The French spread going vertical about seven months before the ballot is that test starting. Our own positioning follows from it: this diary stays away from the euro-area core and from France in particular. The exceptions are the parts of Europe with their own growth or their own shelter: central and eastern Europe — Poland +27.5% on the year, Austria +24.2% — the peripheral countries that have repaired their finances, Greece now borrowing cheaper than France, and Switzerland as the safe haven, whose fund rose 1.0% on a week the long ends sold off everywhere. The Global ETFs book already reads that way: its only European country funds are Poland and Switzerland, none in the euro-area core. This is a diary’s positioning, not advice.
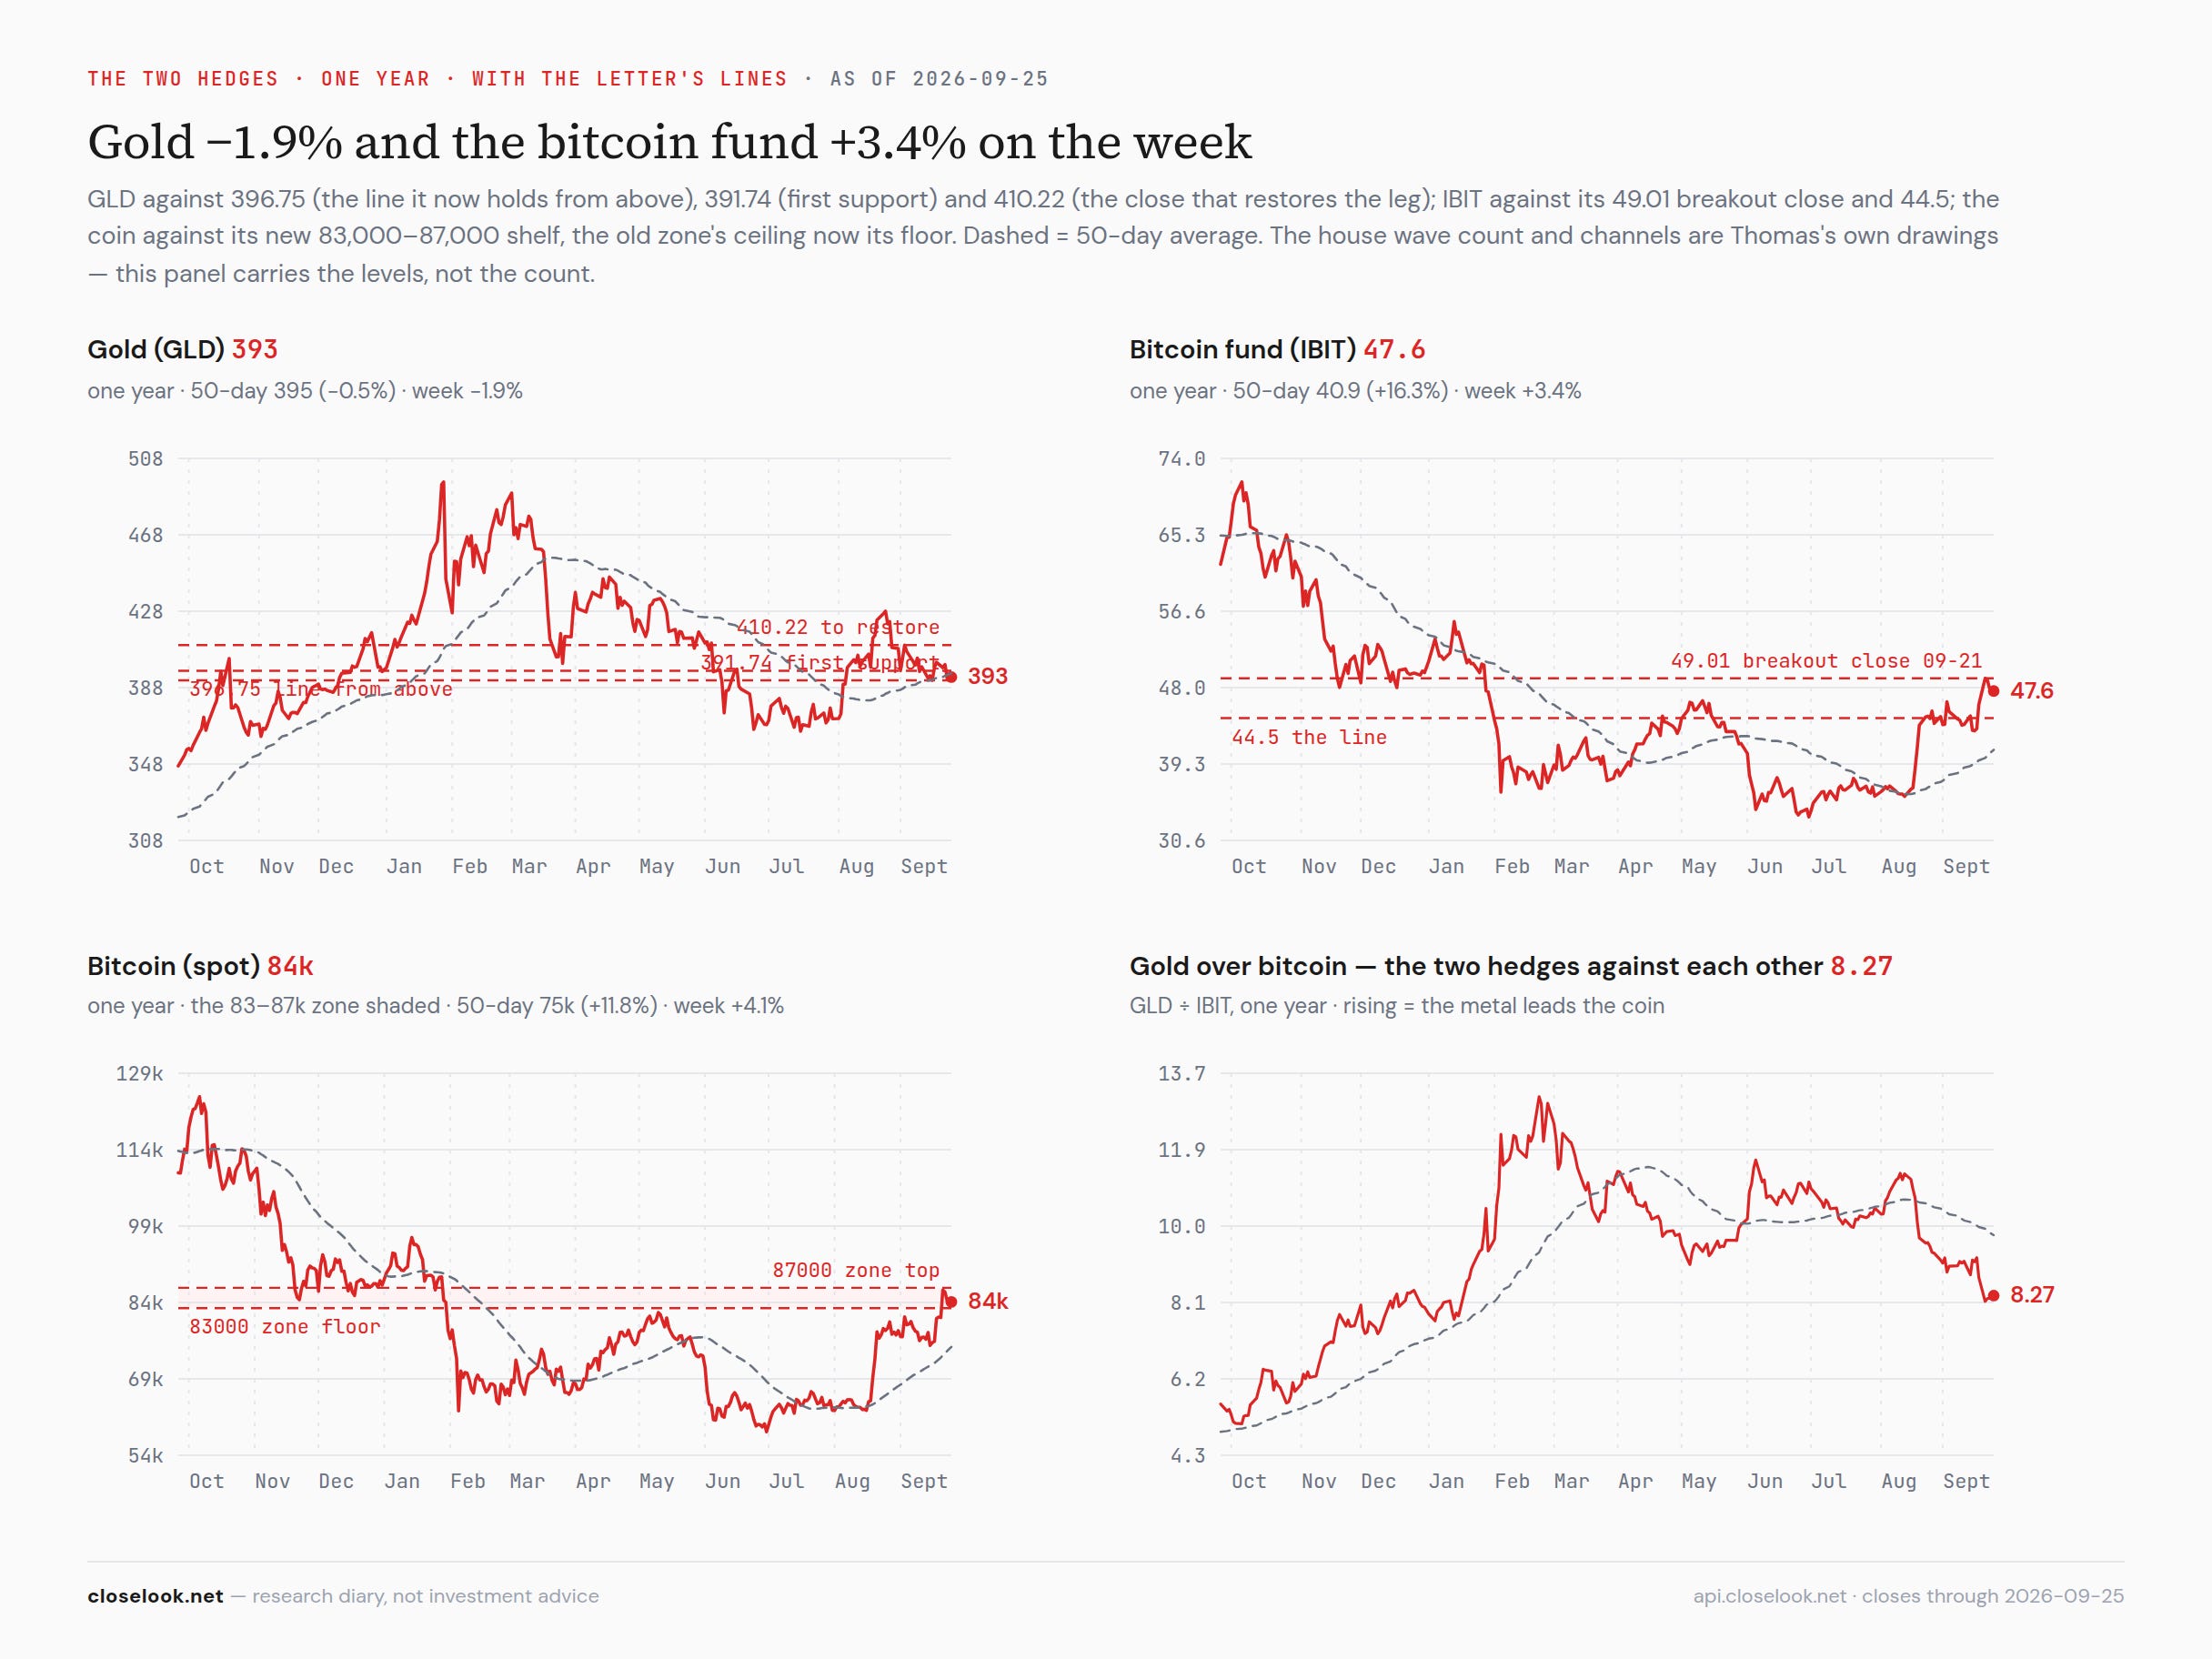
The hard assets split in two — the coin broke out, the metal broke down. Bitcoin closed Monday at 86,603, through the 83,000 ceiling of the zone this letter has used since August, on a rising-rate week; the high was 87,364; it closed Friday at 84,218 and stood near 84,000 on Saturday. The fund closed 49.01 on Monday and 47.57 on the week, +3.37%. Gold did the opposite: GLD −1.93% to 393.41, three daily closes under the 396.75 line it now holds from above, and Thursday’s 391.69 five cents under the 391.74 first support. Silver −2.99%, copper miners −0.63%. A stronger dollar and higher real yields are the textbook headwind for both. The coin rose through them and the metal did not — the market is treating bitcoin as a growth asset this month, not as a hedge.
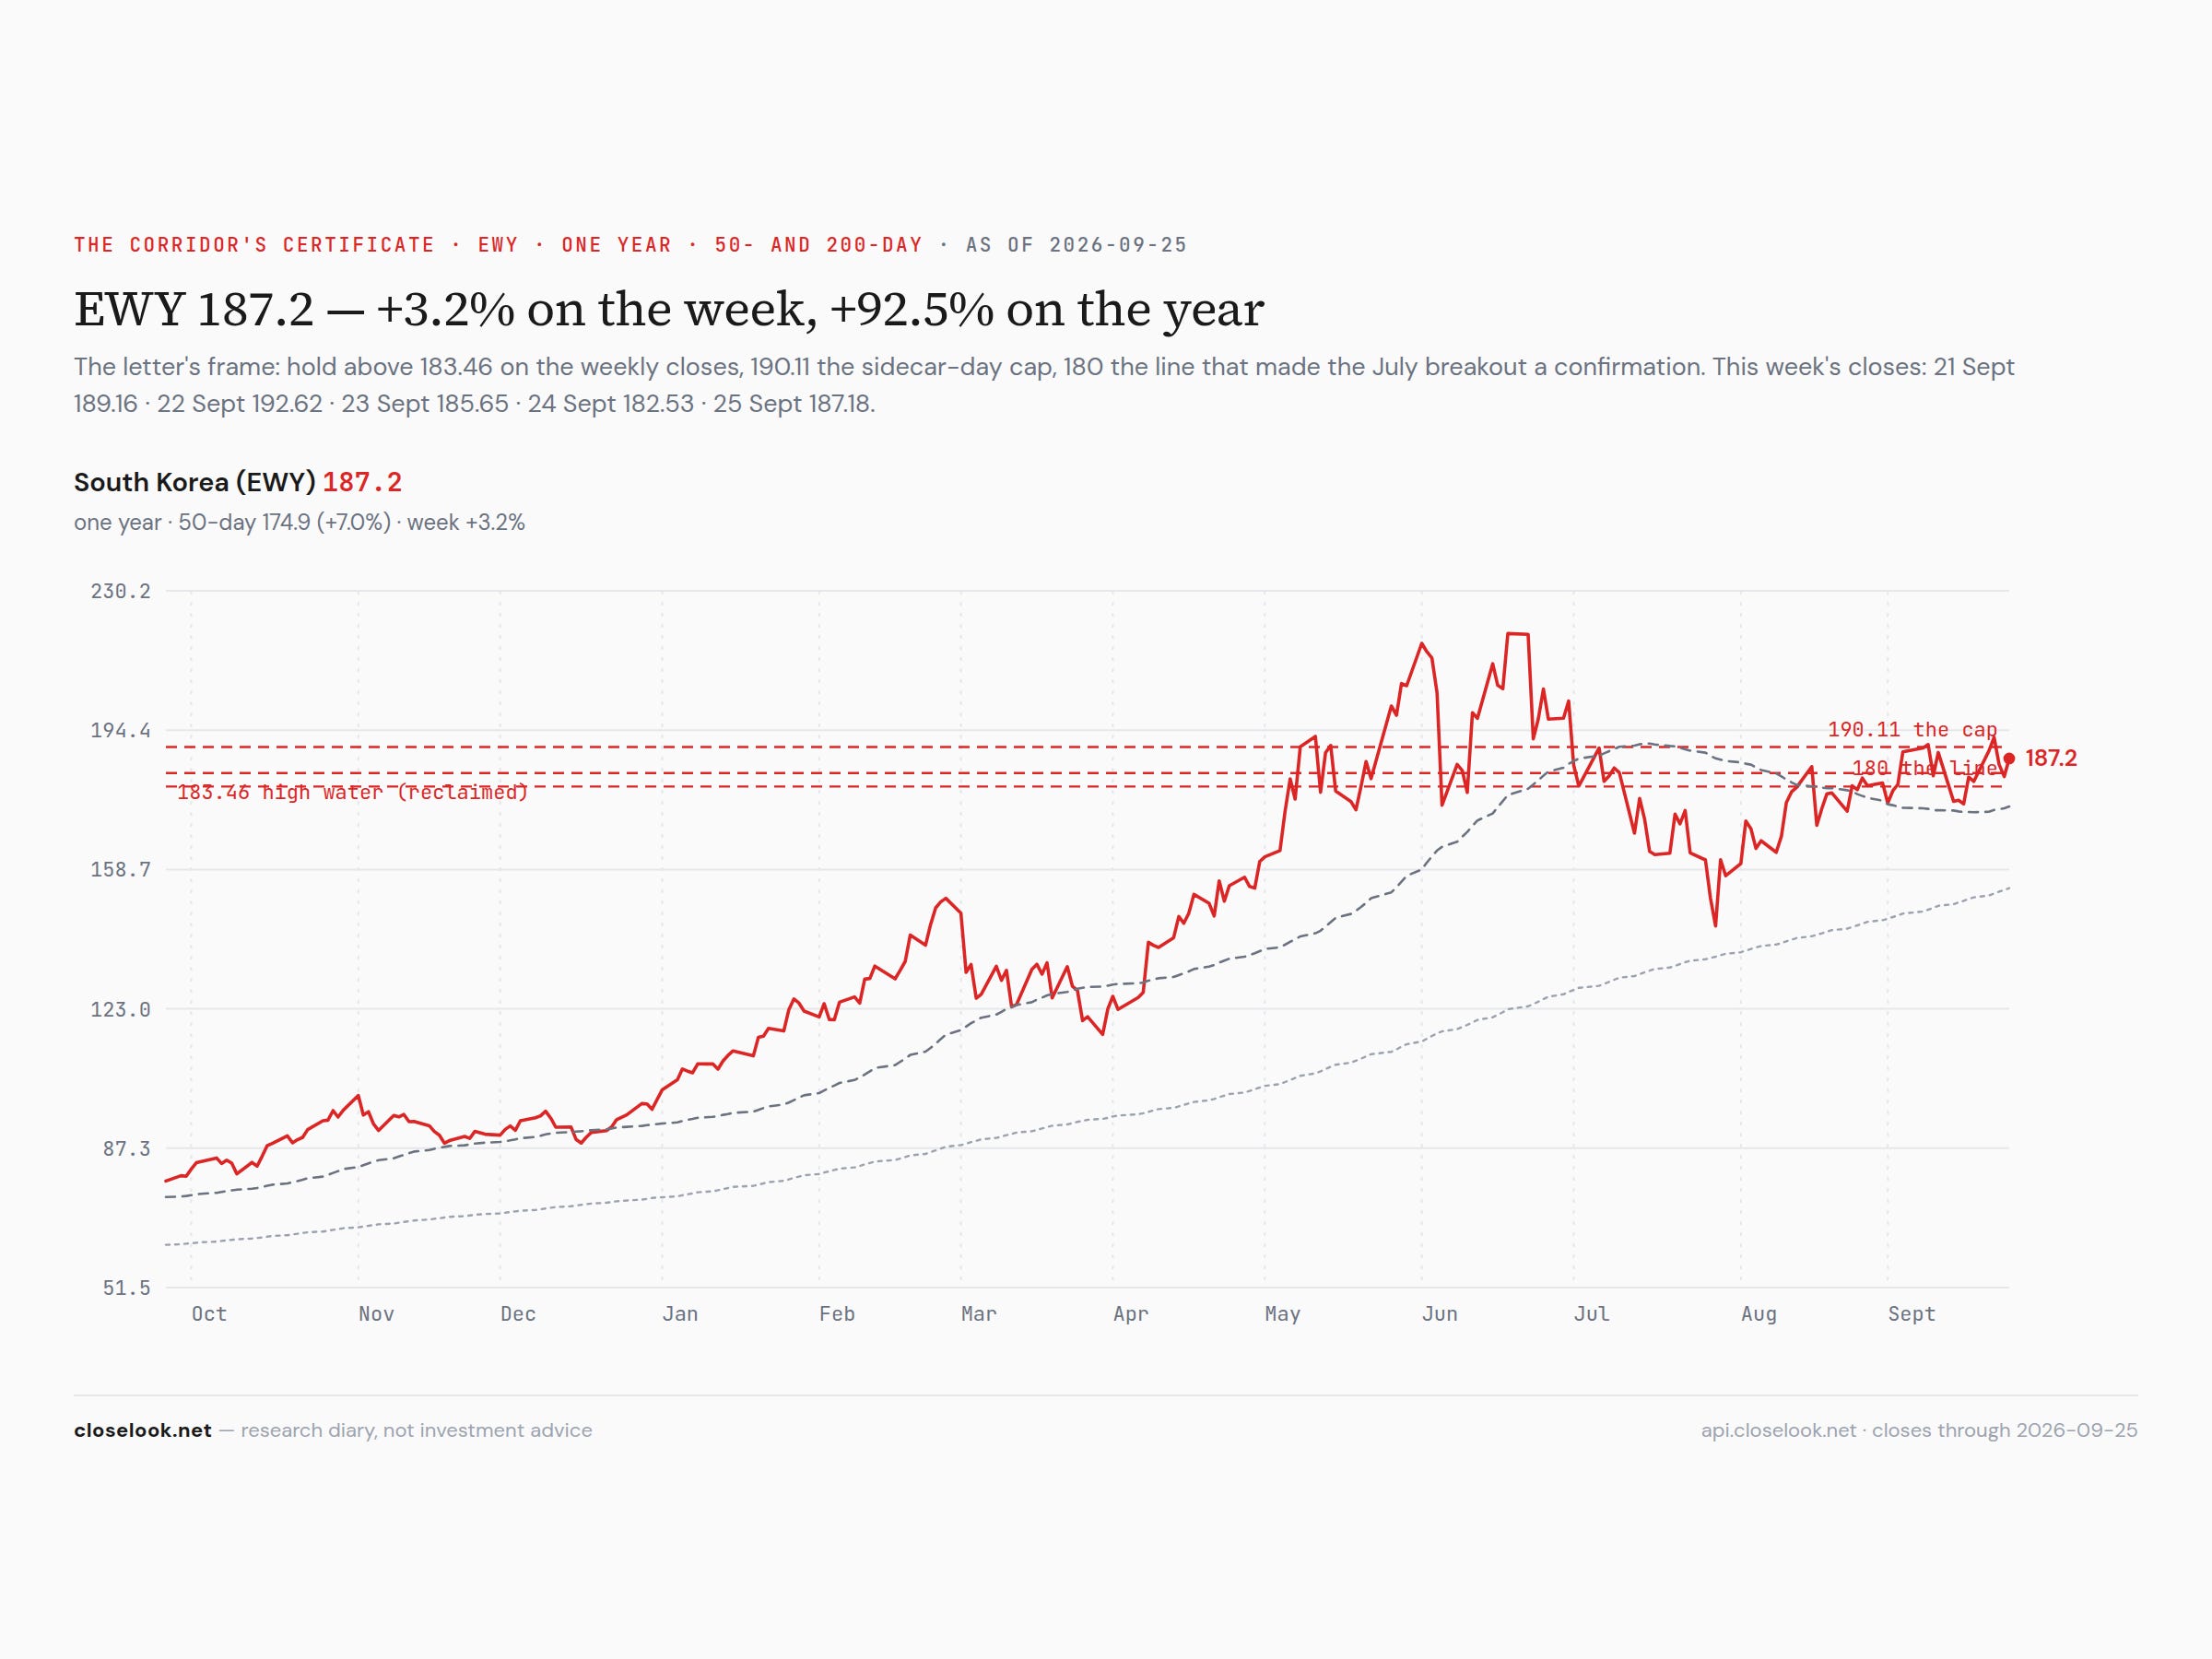
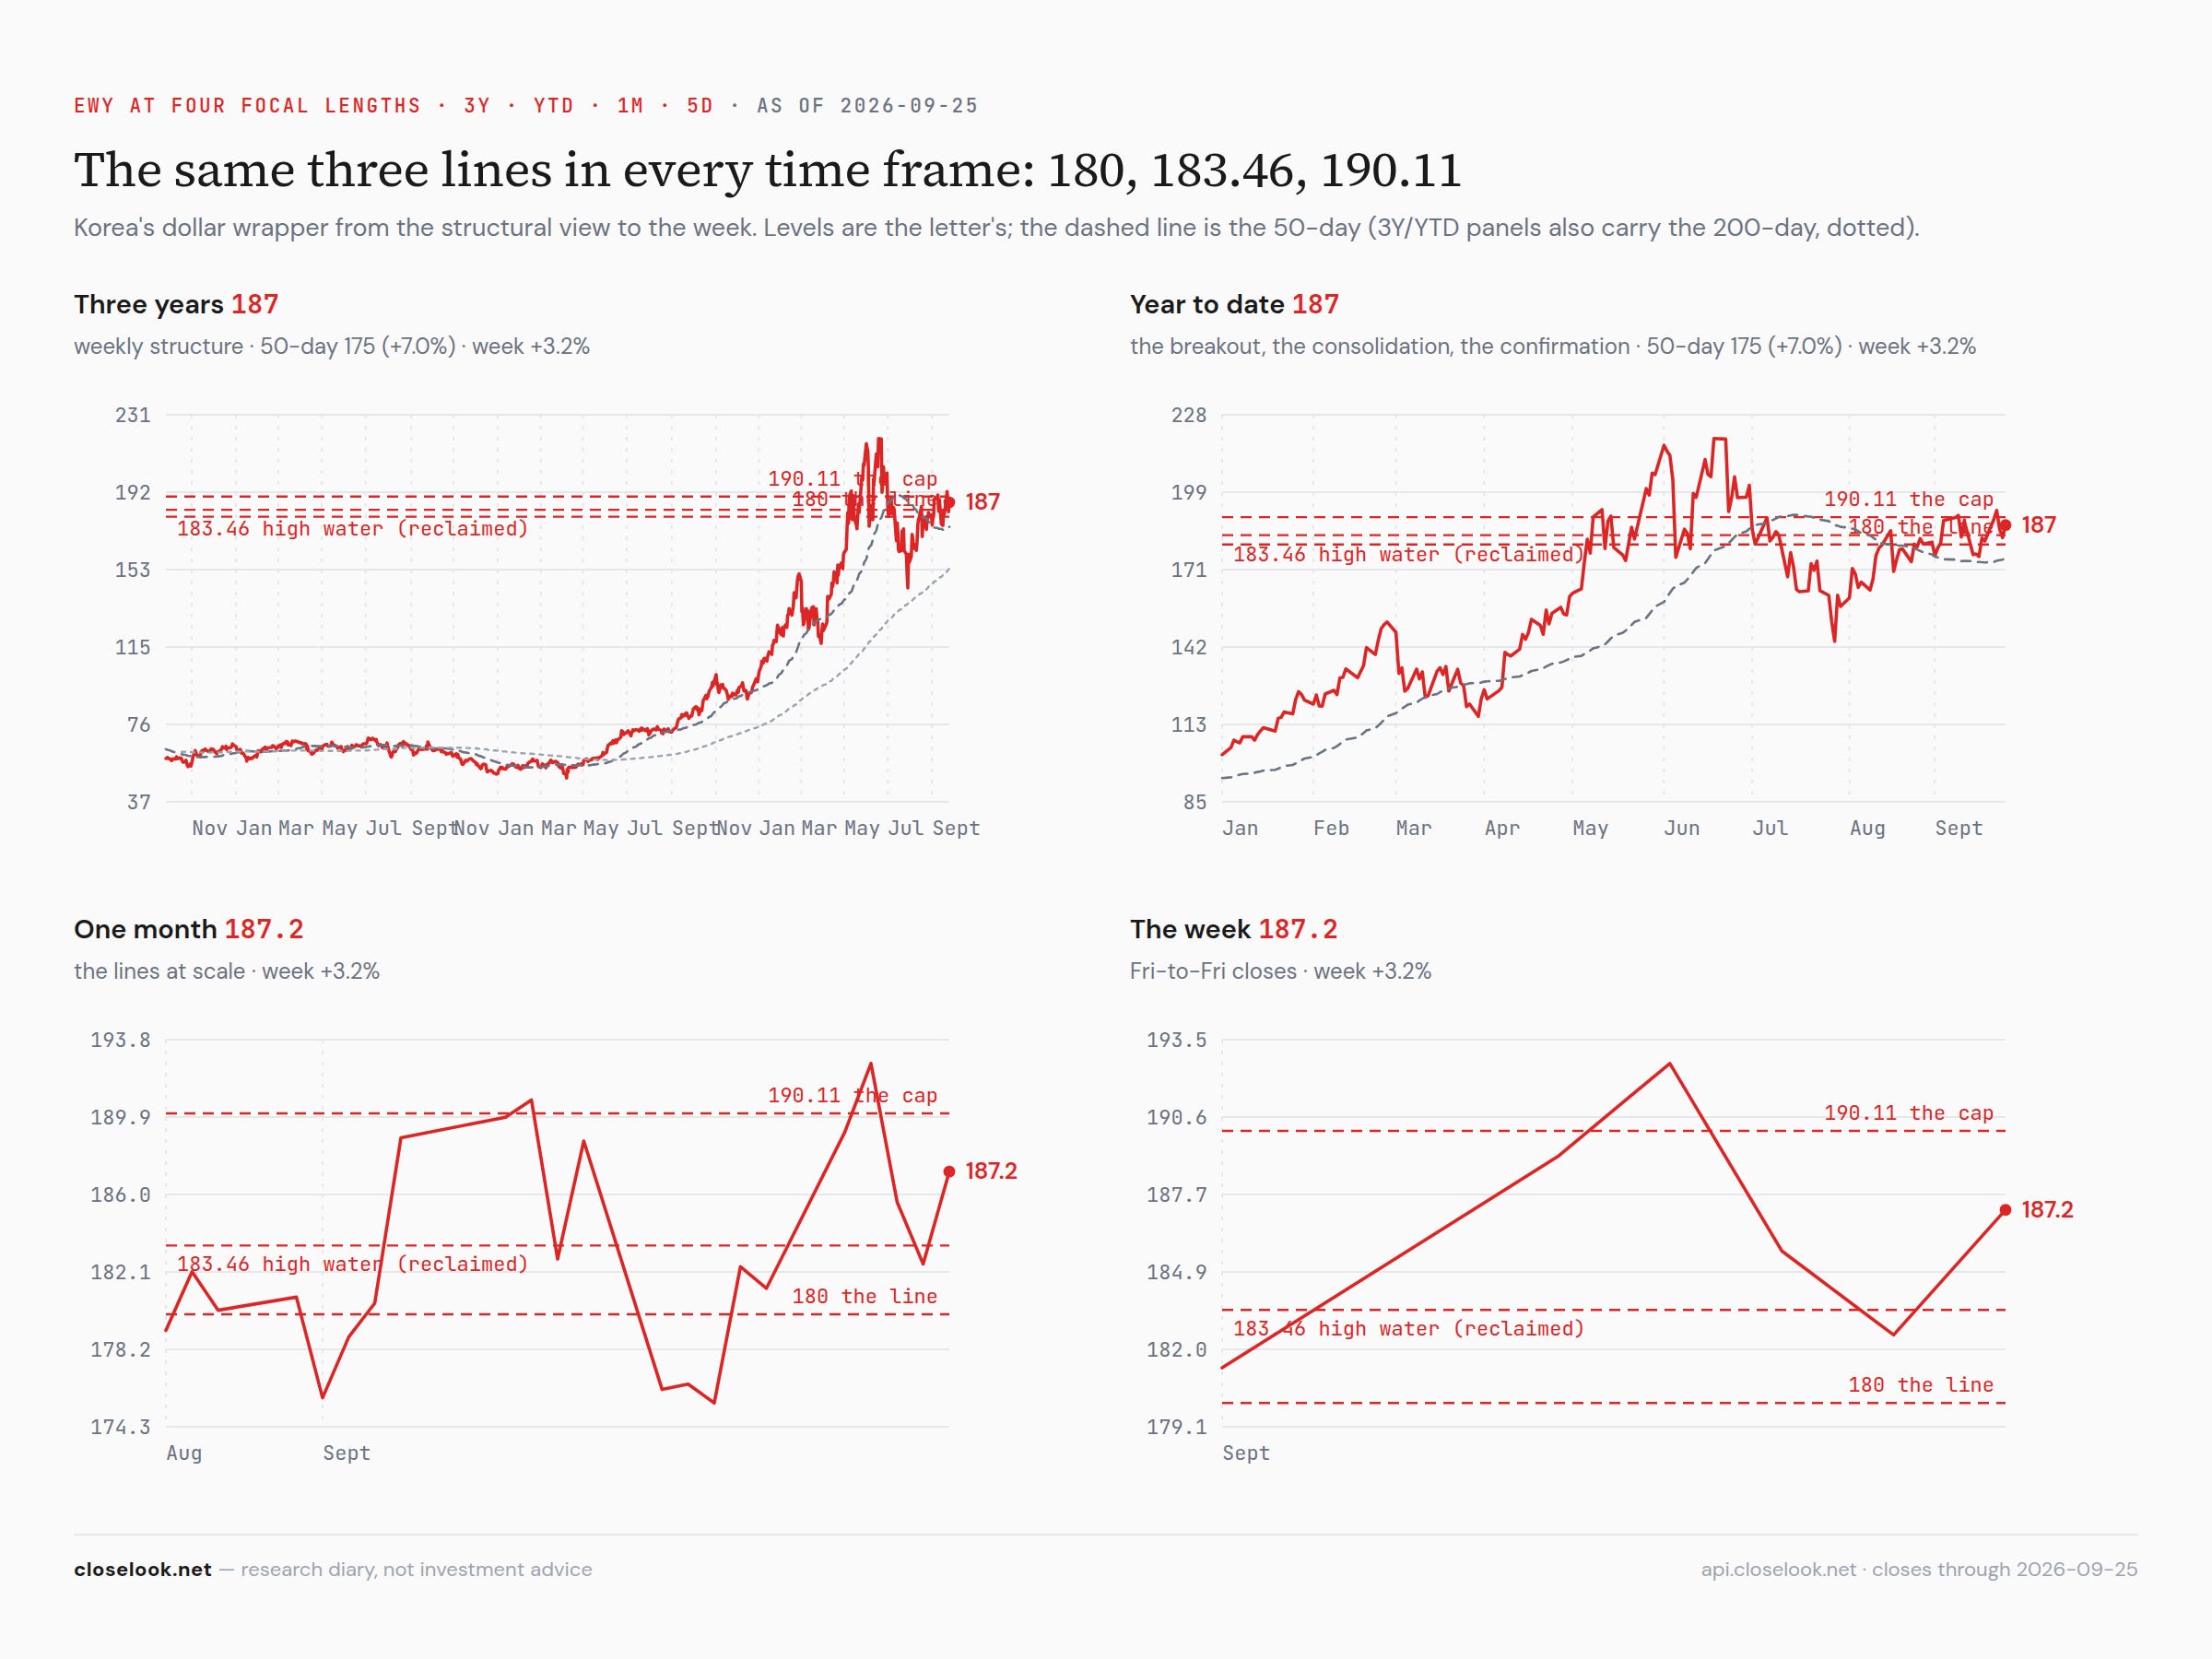
Seoul: the high water retaken, the cap touched. The fund walked 181.31 → 189.16 (+4.3% Monday) → 192.62 — a daily close above the 190.11 cap for the first time since the confirmation — → 185.65 → 182.53 → 187.18. The weekly close is above the 183.46 high water again and under the cap. The structural read — breakout, consolidation, double bottom, confirmation — has its second test: last week the high water lost, this week retaken, with one close through the cap. EWY is still 14.6% under its June 18 high of 219.20 and up 92.5% on the year.
Europe, two machines, and the weighing machine is the one that moved. The voting machine bought the small chip names and the Netherlands (+1.49%, ASML +3.8%), Austria (+2.28%) and Switzerland (+1.03%), and sold nothing hard; the weighing machine sold the long ends: the Bund thirty-year at 3.90%, the gilt at 5.85%. Euro-AI rose 1.84%, led by its chip architecture and cloud sub-index (+9.90%) and the semi-equipment layer (+4.34%). Europe’s part in the AI week was the equipment it sells to Asia.
The macro print. The week’s two numbers were a survey and a sentence: the flash PMI’s five-year high in US output and Governor Barr’s “further increases.” Both argue for a higher rate path, and the market priced it where it prices first — the long end — while paying up for growth. Micron’s order book and the core inflation reading arrive on Wednesday. Those two decide whether this week’s rate rise stays a growth rate rise.
Hold both halves. The equity boards resolved up — the world index back over its first lost line, twenty-two green on the regional board, every chip wrapper up five to eight percent, the Magnificent Seven at a record, tech green in every region. The funding tells resolved down — the belly and the long end at new lows, the long ends higher everywhere, the dollar at a high, gold through its support. The equities won this round. They have not won a round like this for long before, and the letter’s lines below say where it would stop.
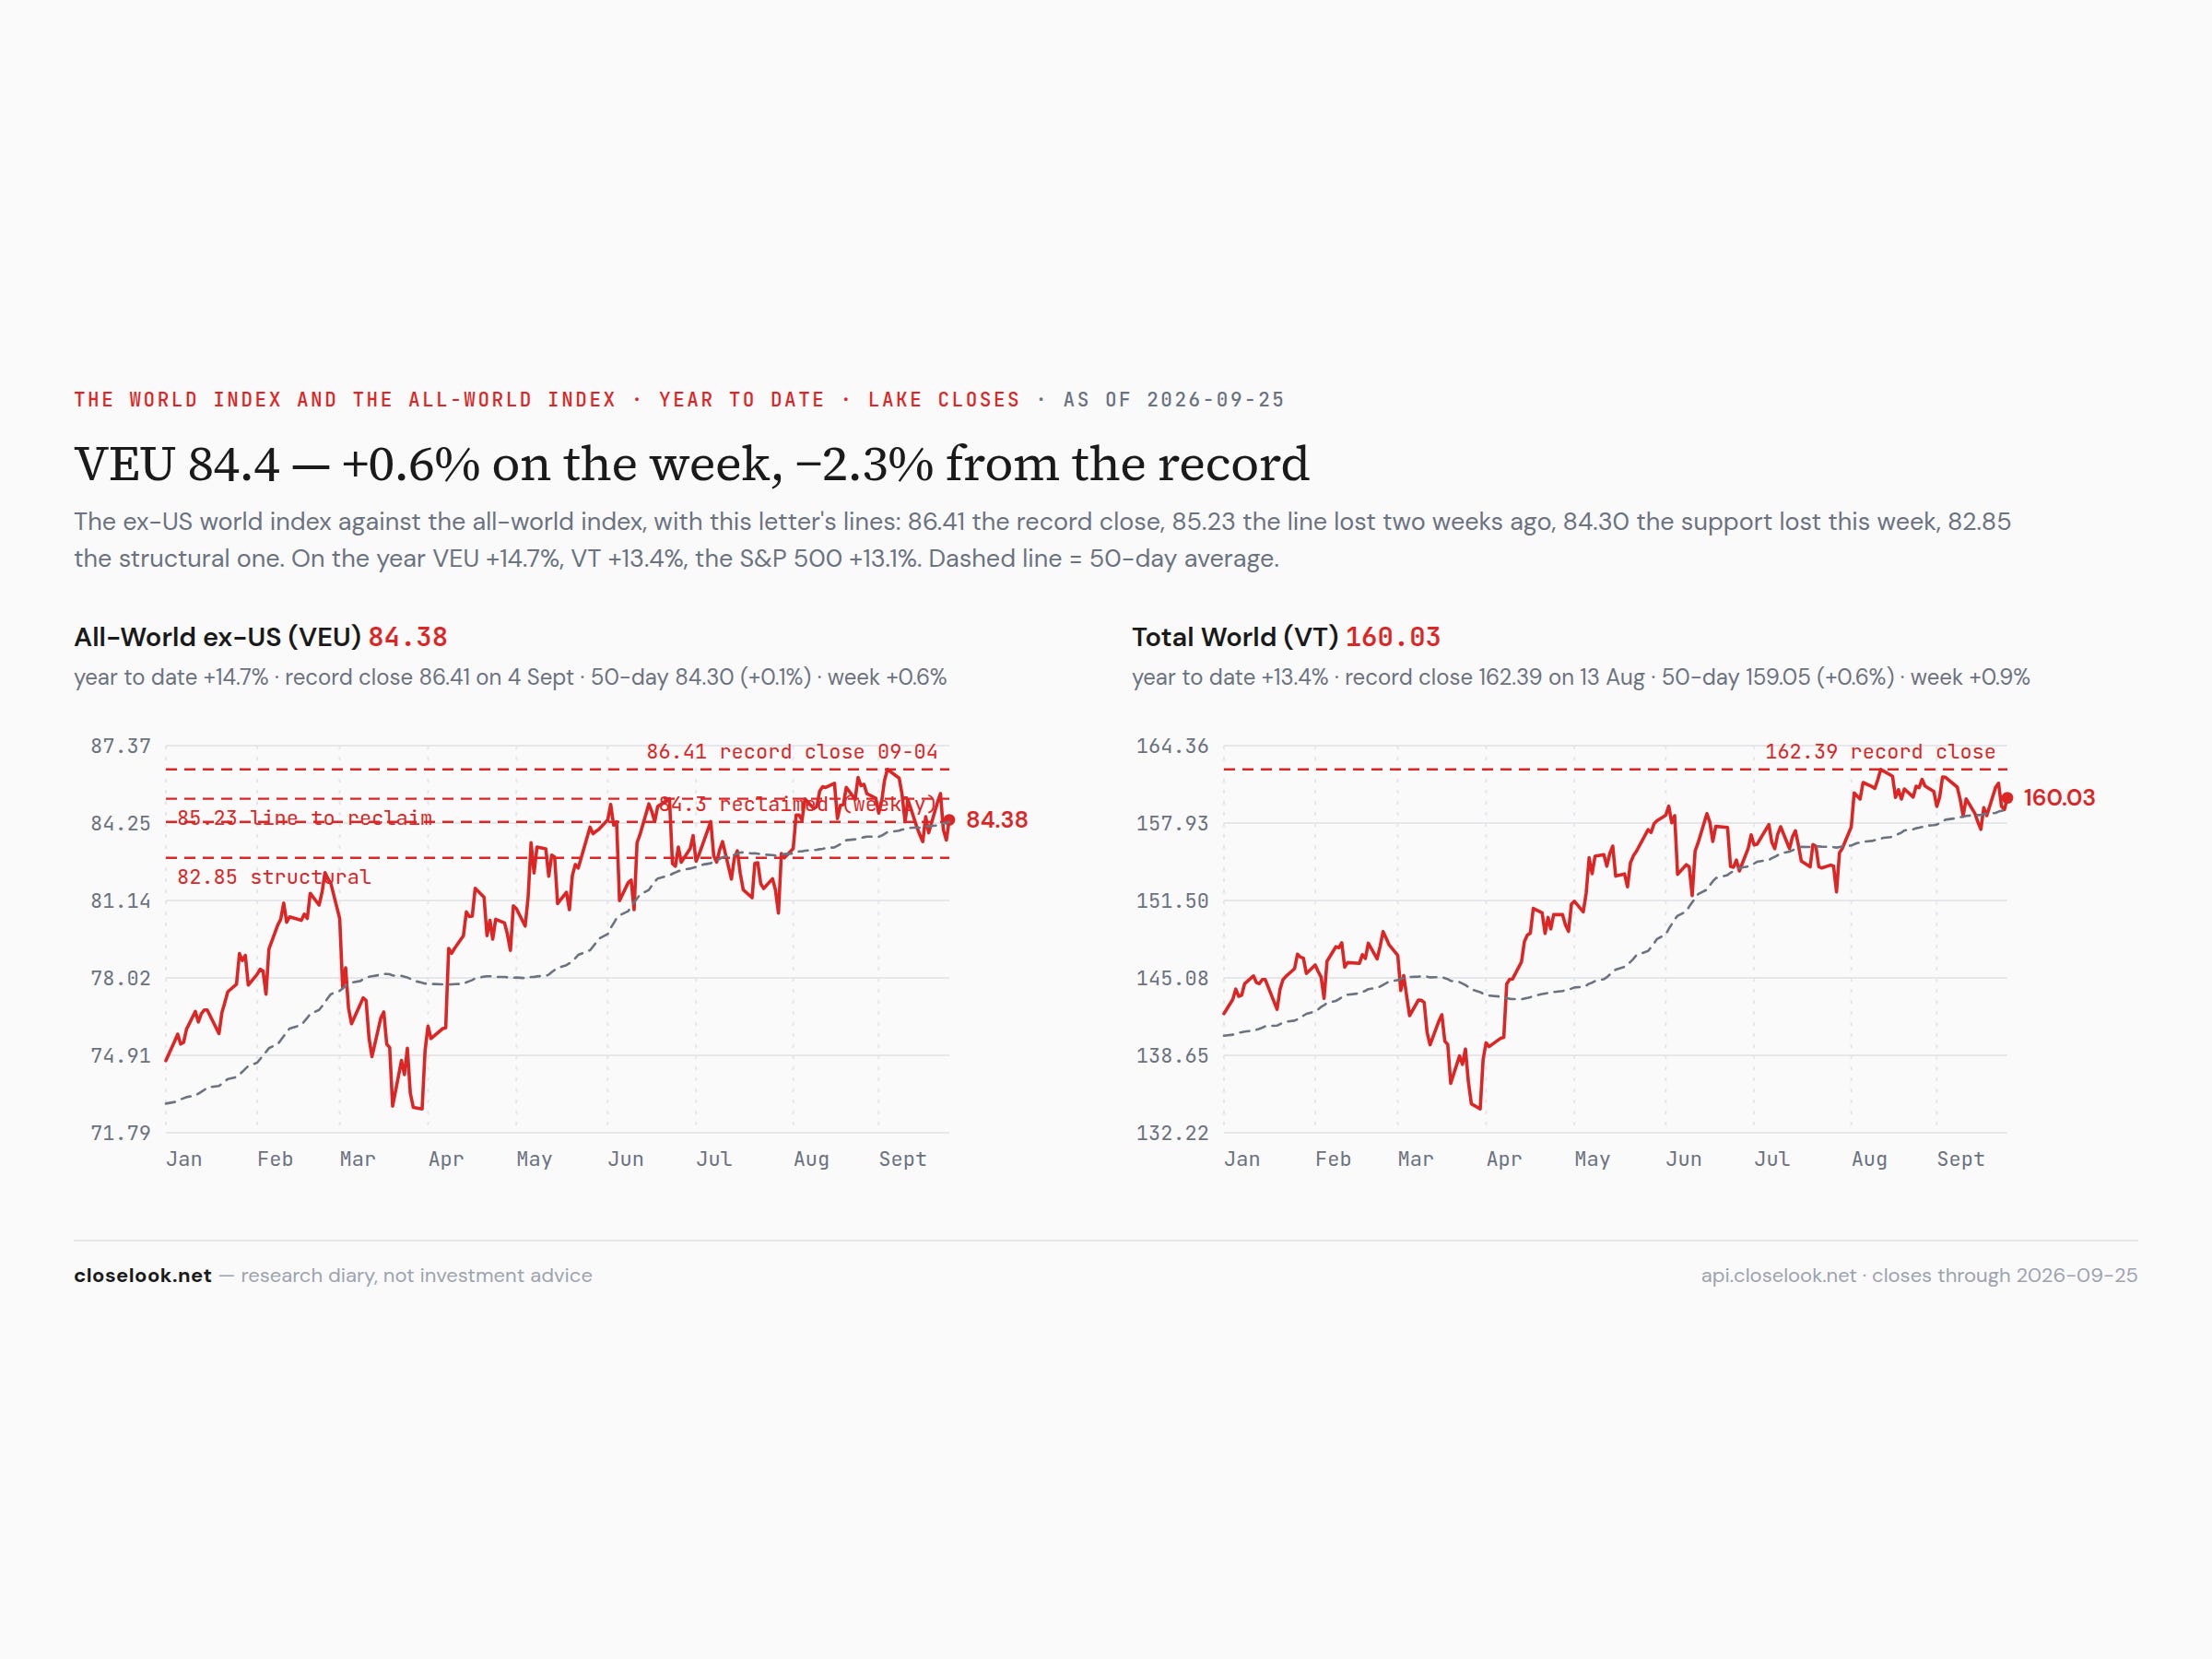
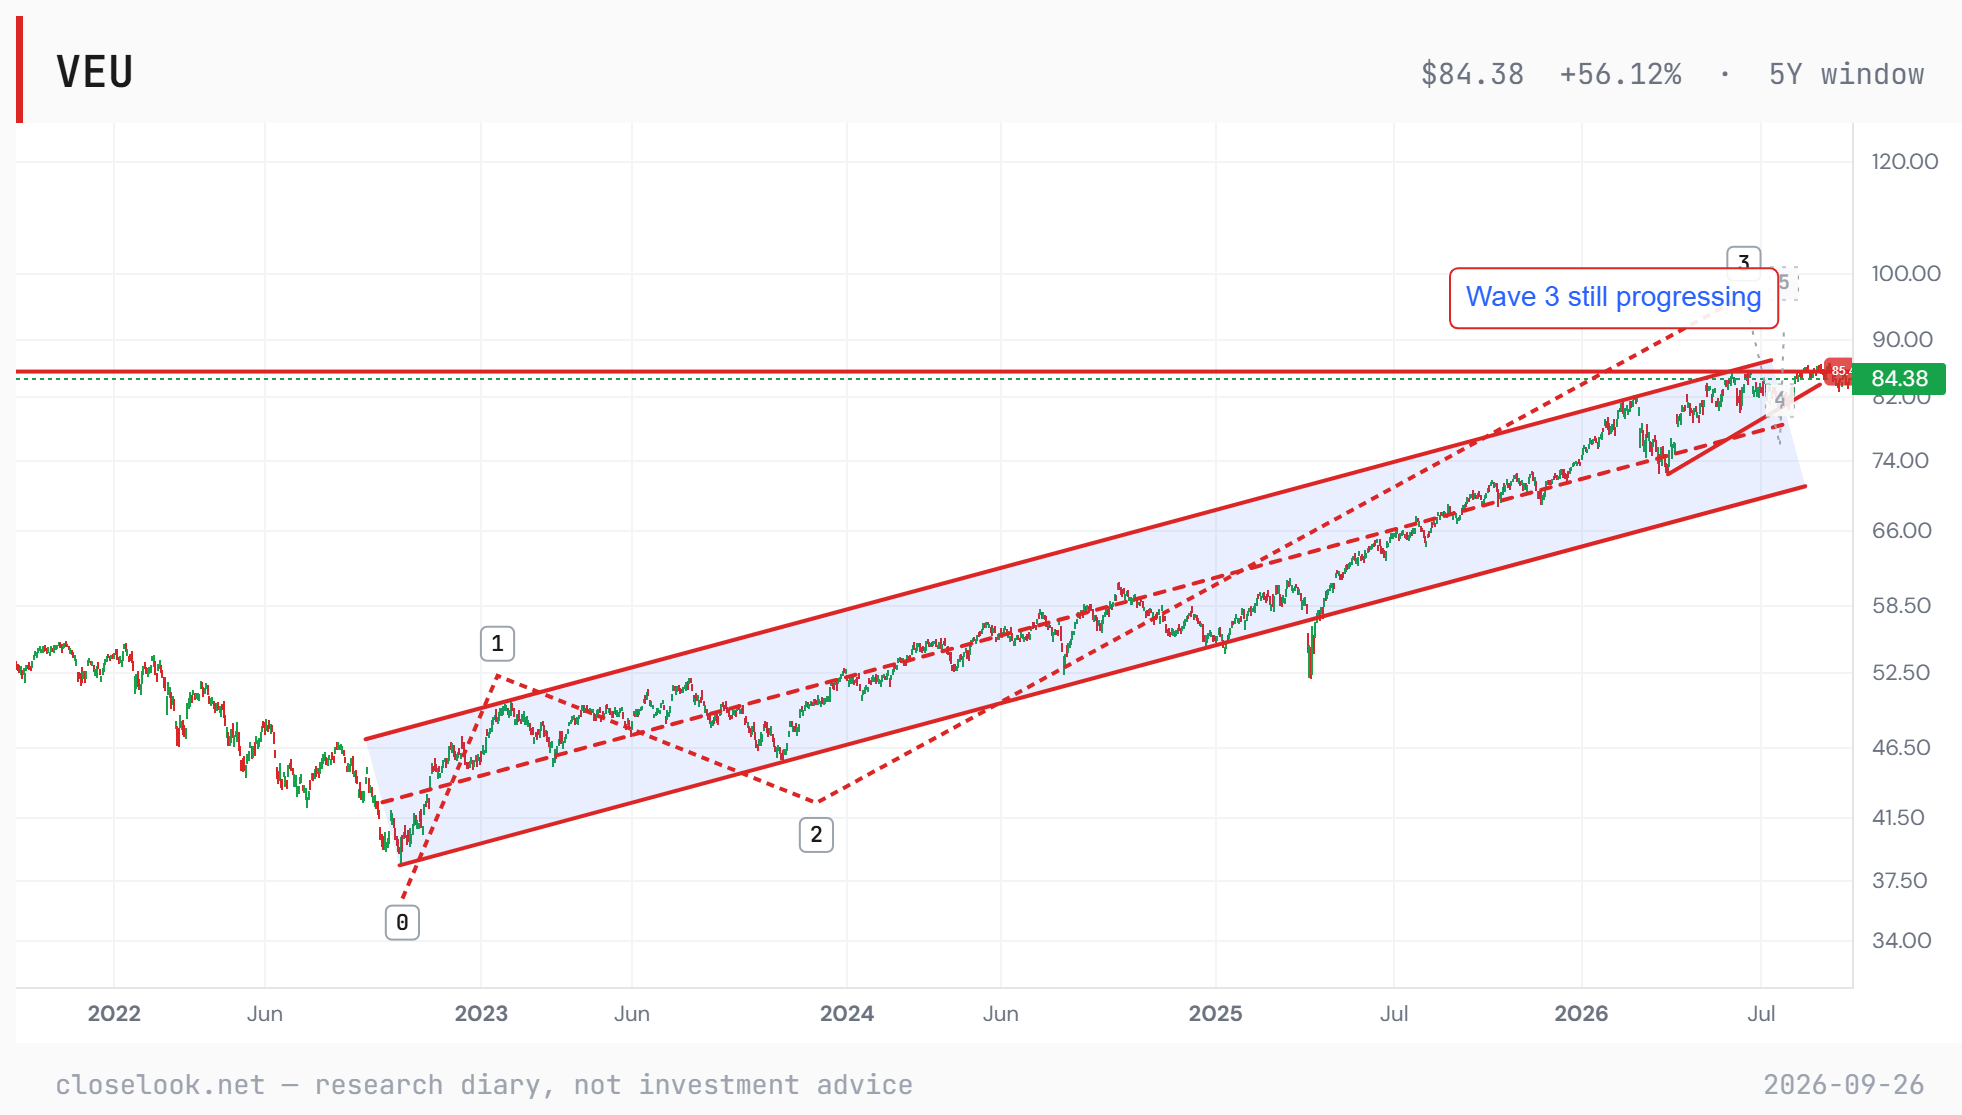
The structural read — the wave count, five years up, unchanged. From the October 2022 low the house count on the world ex-US reads waves 1 and 2 complete and wave 3 still progressing — price in the upper half of a four-year channel, the September 4 record a new high inside the advance. The count does not change this week. On it, the 2.4% from the record is a pause in a third wave; it is falsified by a weekly close under 82.85 and confirmed by a weekly close above 86.41.
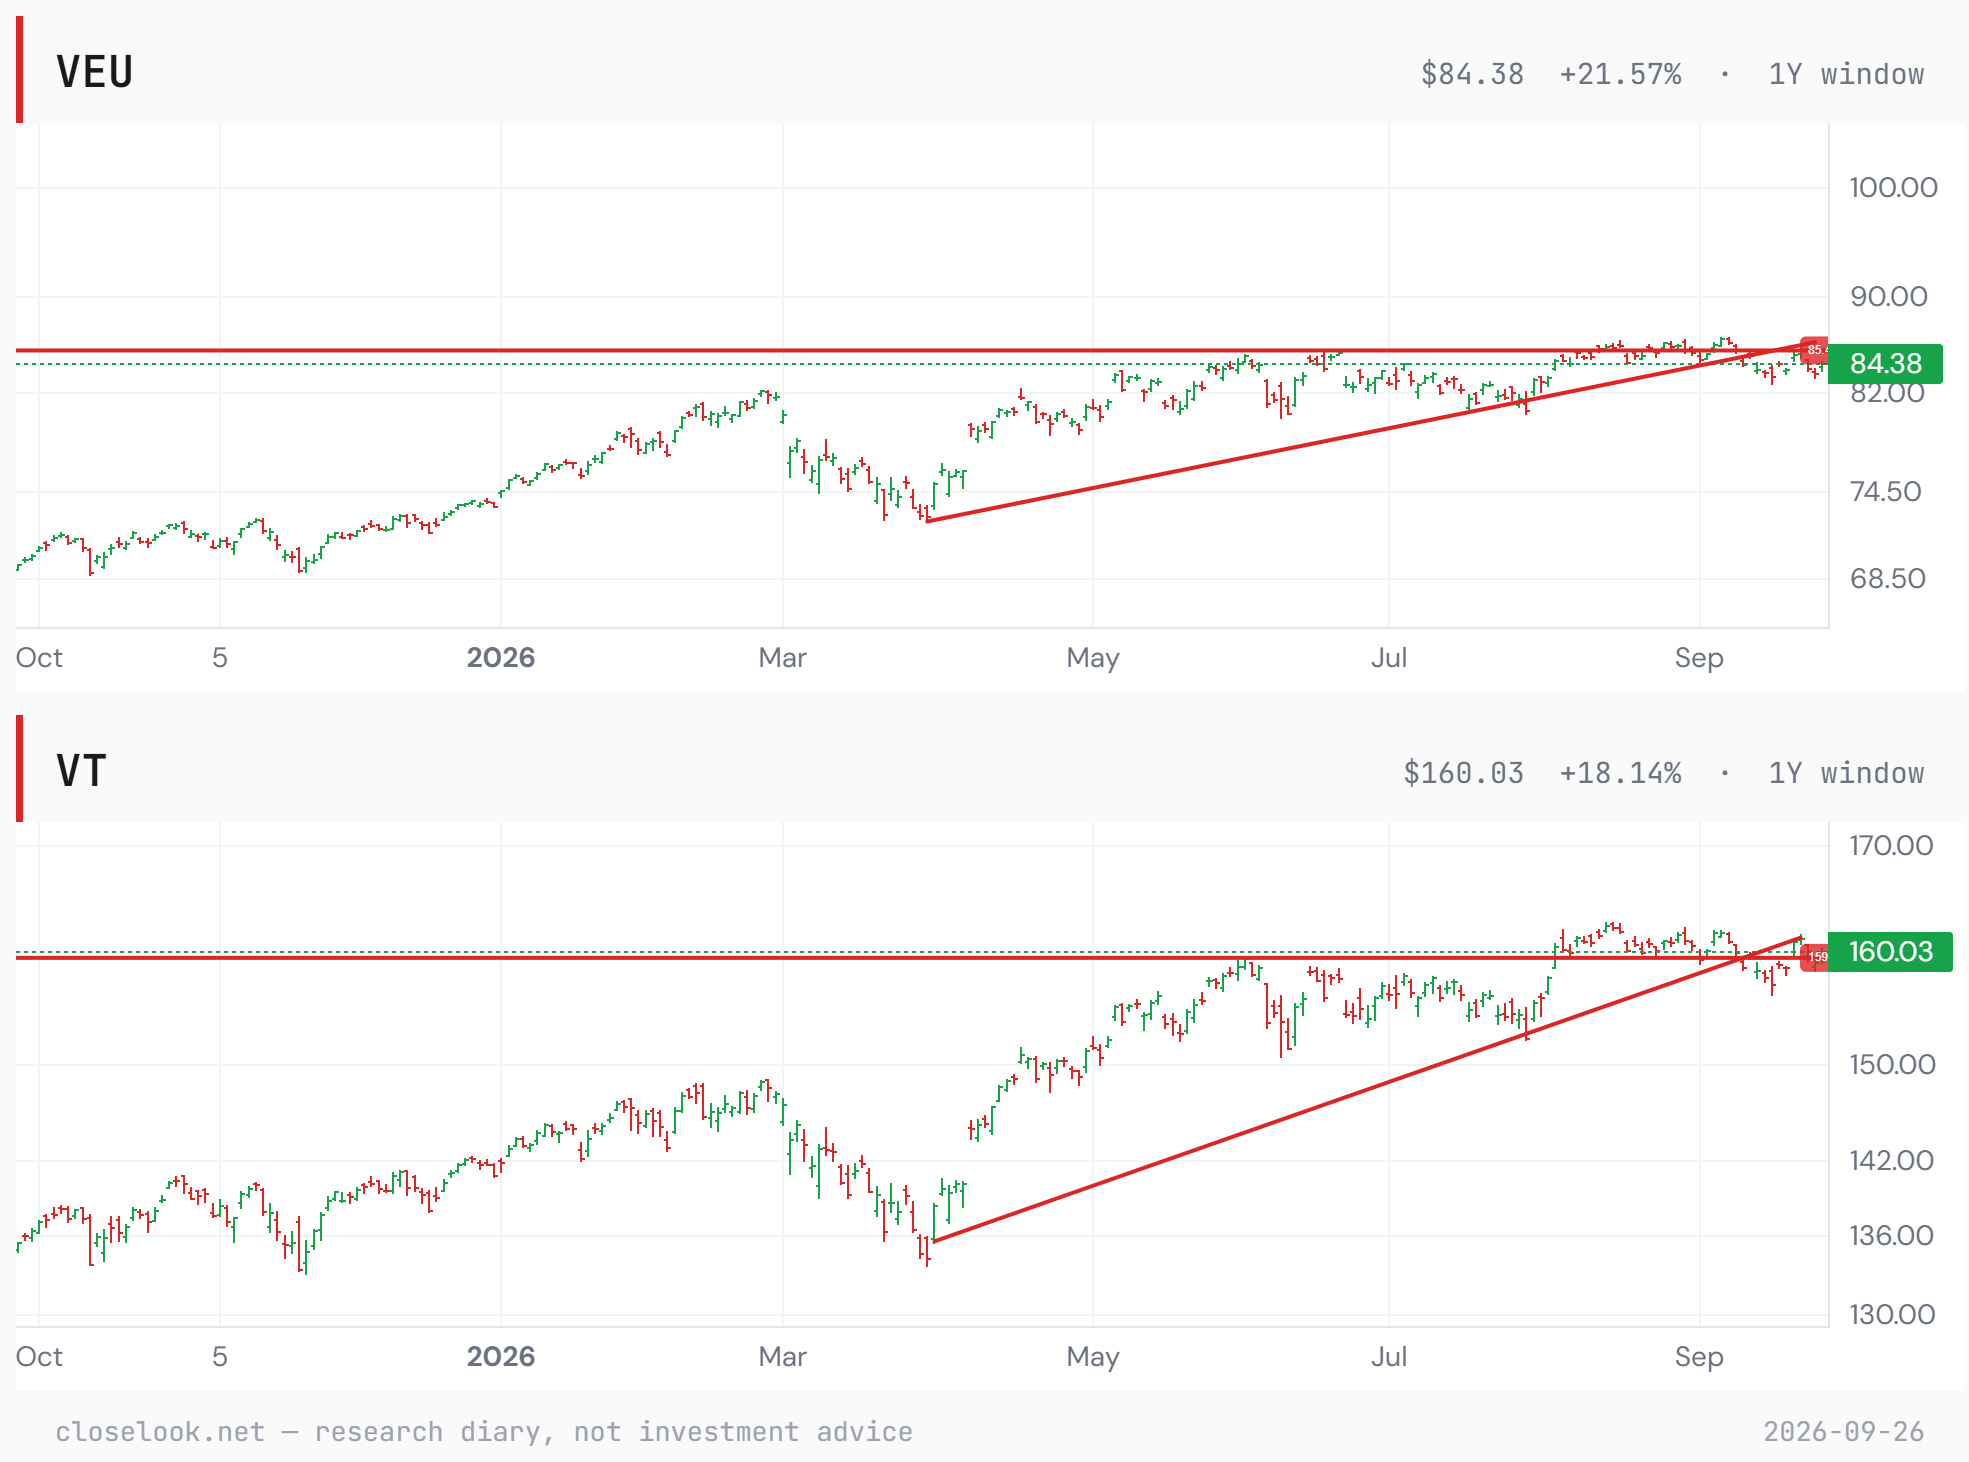
VEU and VT side by side — a warning, not yet a break. The editor’s two charts put the world ex-US and the all-world fund next to each other, and they carry a caution the weekly gain does not. Neither has broken out: VEU is 2.4% under its September record and VT 1.5% under its August high, and both have spent September going sideways under those highs rather than through them. And the steep line both have followed since the spring — the 2026 up-trend drawn from the March low — has been left behind: in September both funds slipped under it, and both now sit on the flat line of the summer breakout, VEU at 84.38 just under its 85.2 shelf, VT at 160.03 just above its 159.9 shelf. That is a potential invalidation of the steep 2026 trend, not yet a break of the breakout. The long-term channel and the count are intact. The steep 2026 trend inside them is not confirmed, and a third week without a breakout makes it weaker. What decides it is not in the equity chart: it is in TLT and IEF. The long bond at a new low and the belly under its line for seven weeks are the pressure on the equity trend; a first weekly reclaim — 81.2 on TLT, 93.17 on IEF — would take the pressure off; a further leg lower in both, toward the 74 level the editor marks on the long-bond fund before the midterm elections, would be the break. The equities rose through the bond market this week. The chart says they have not yet risen away from it.
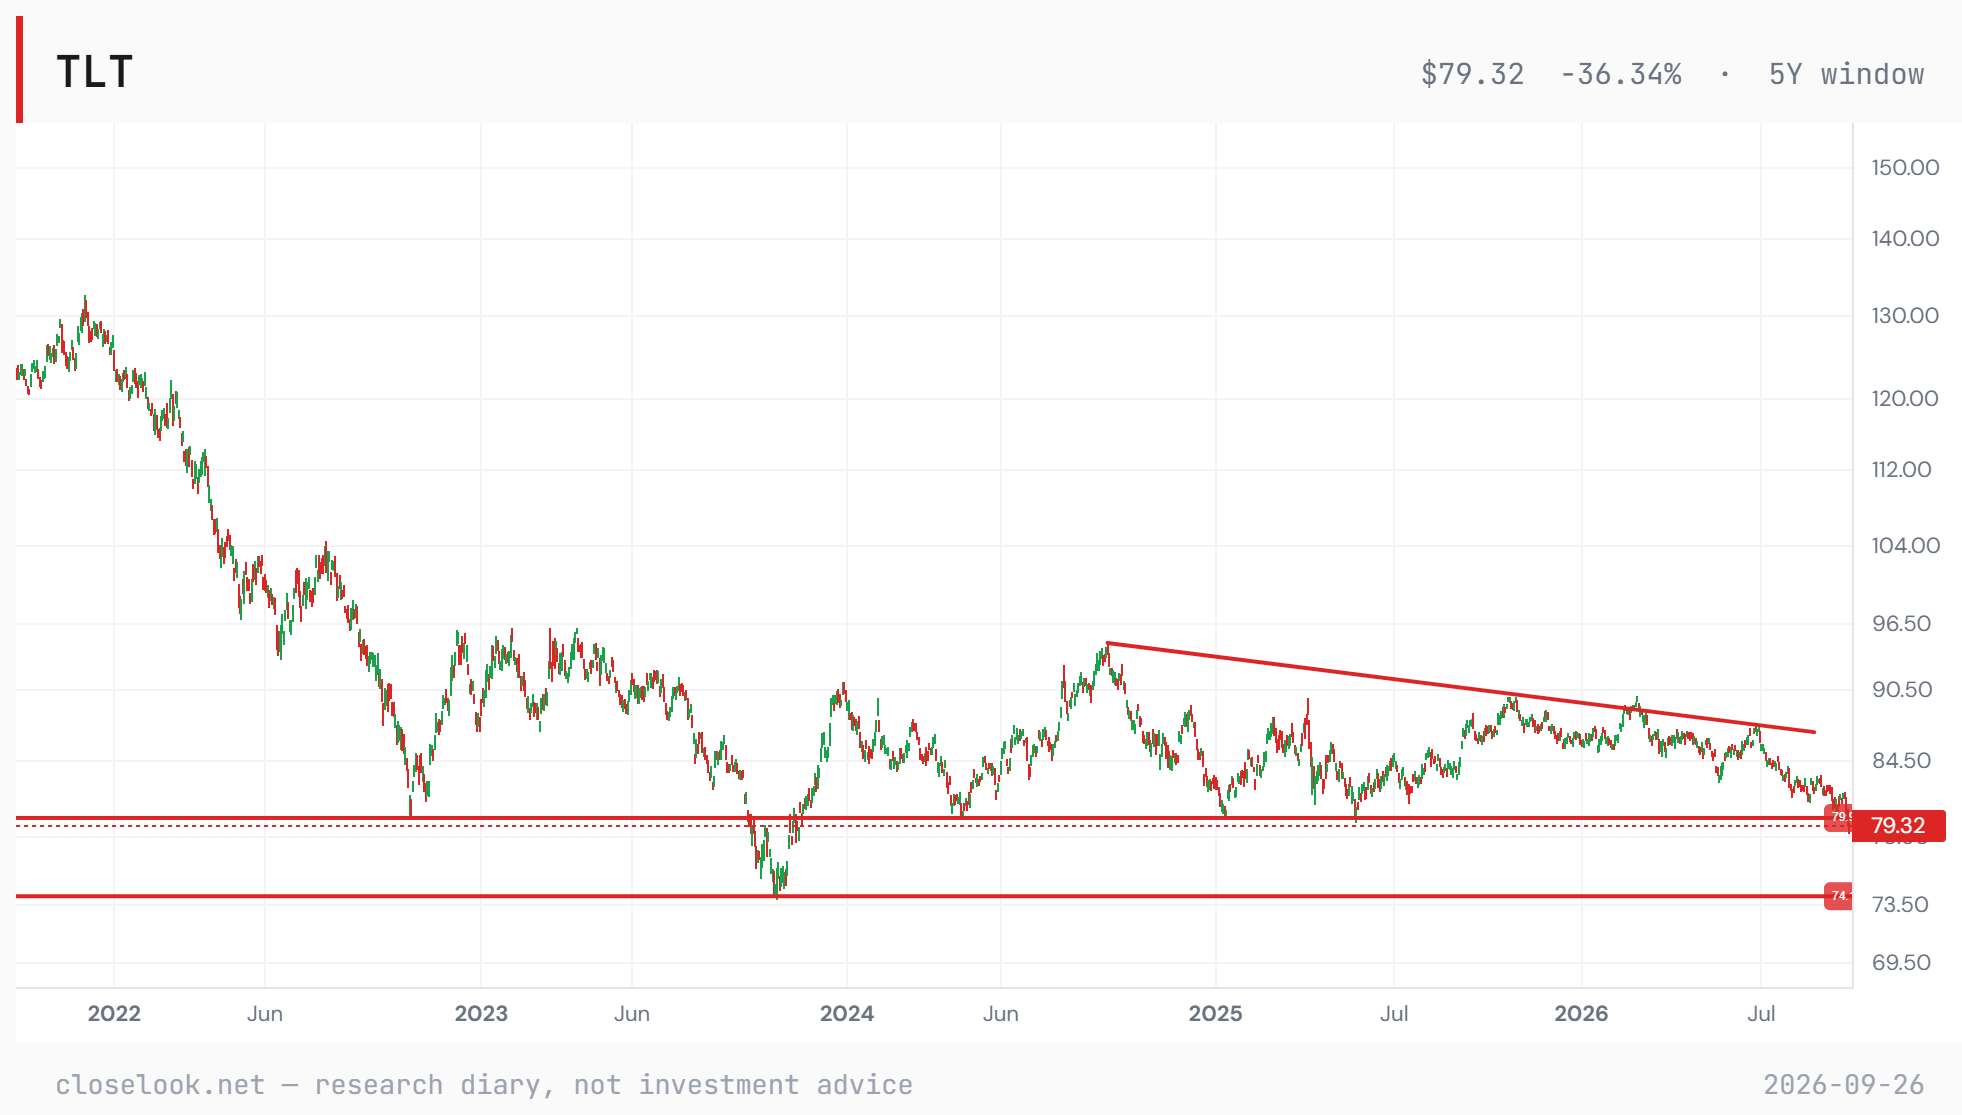
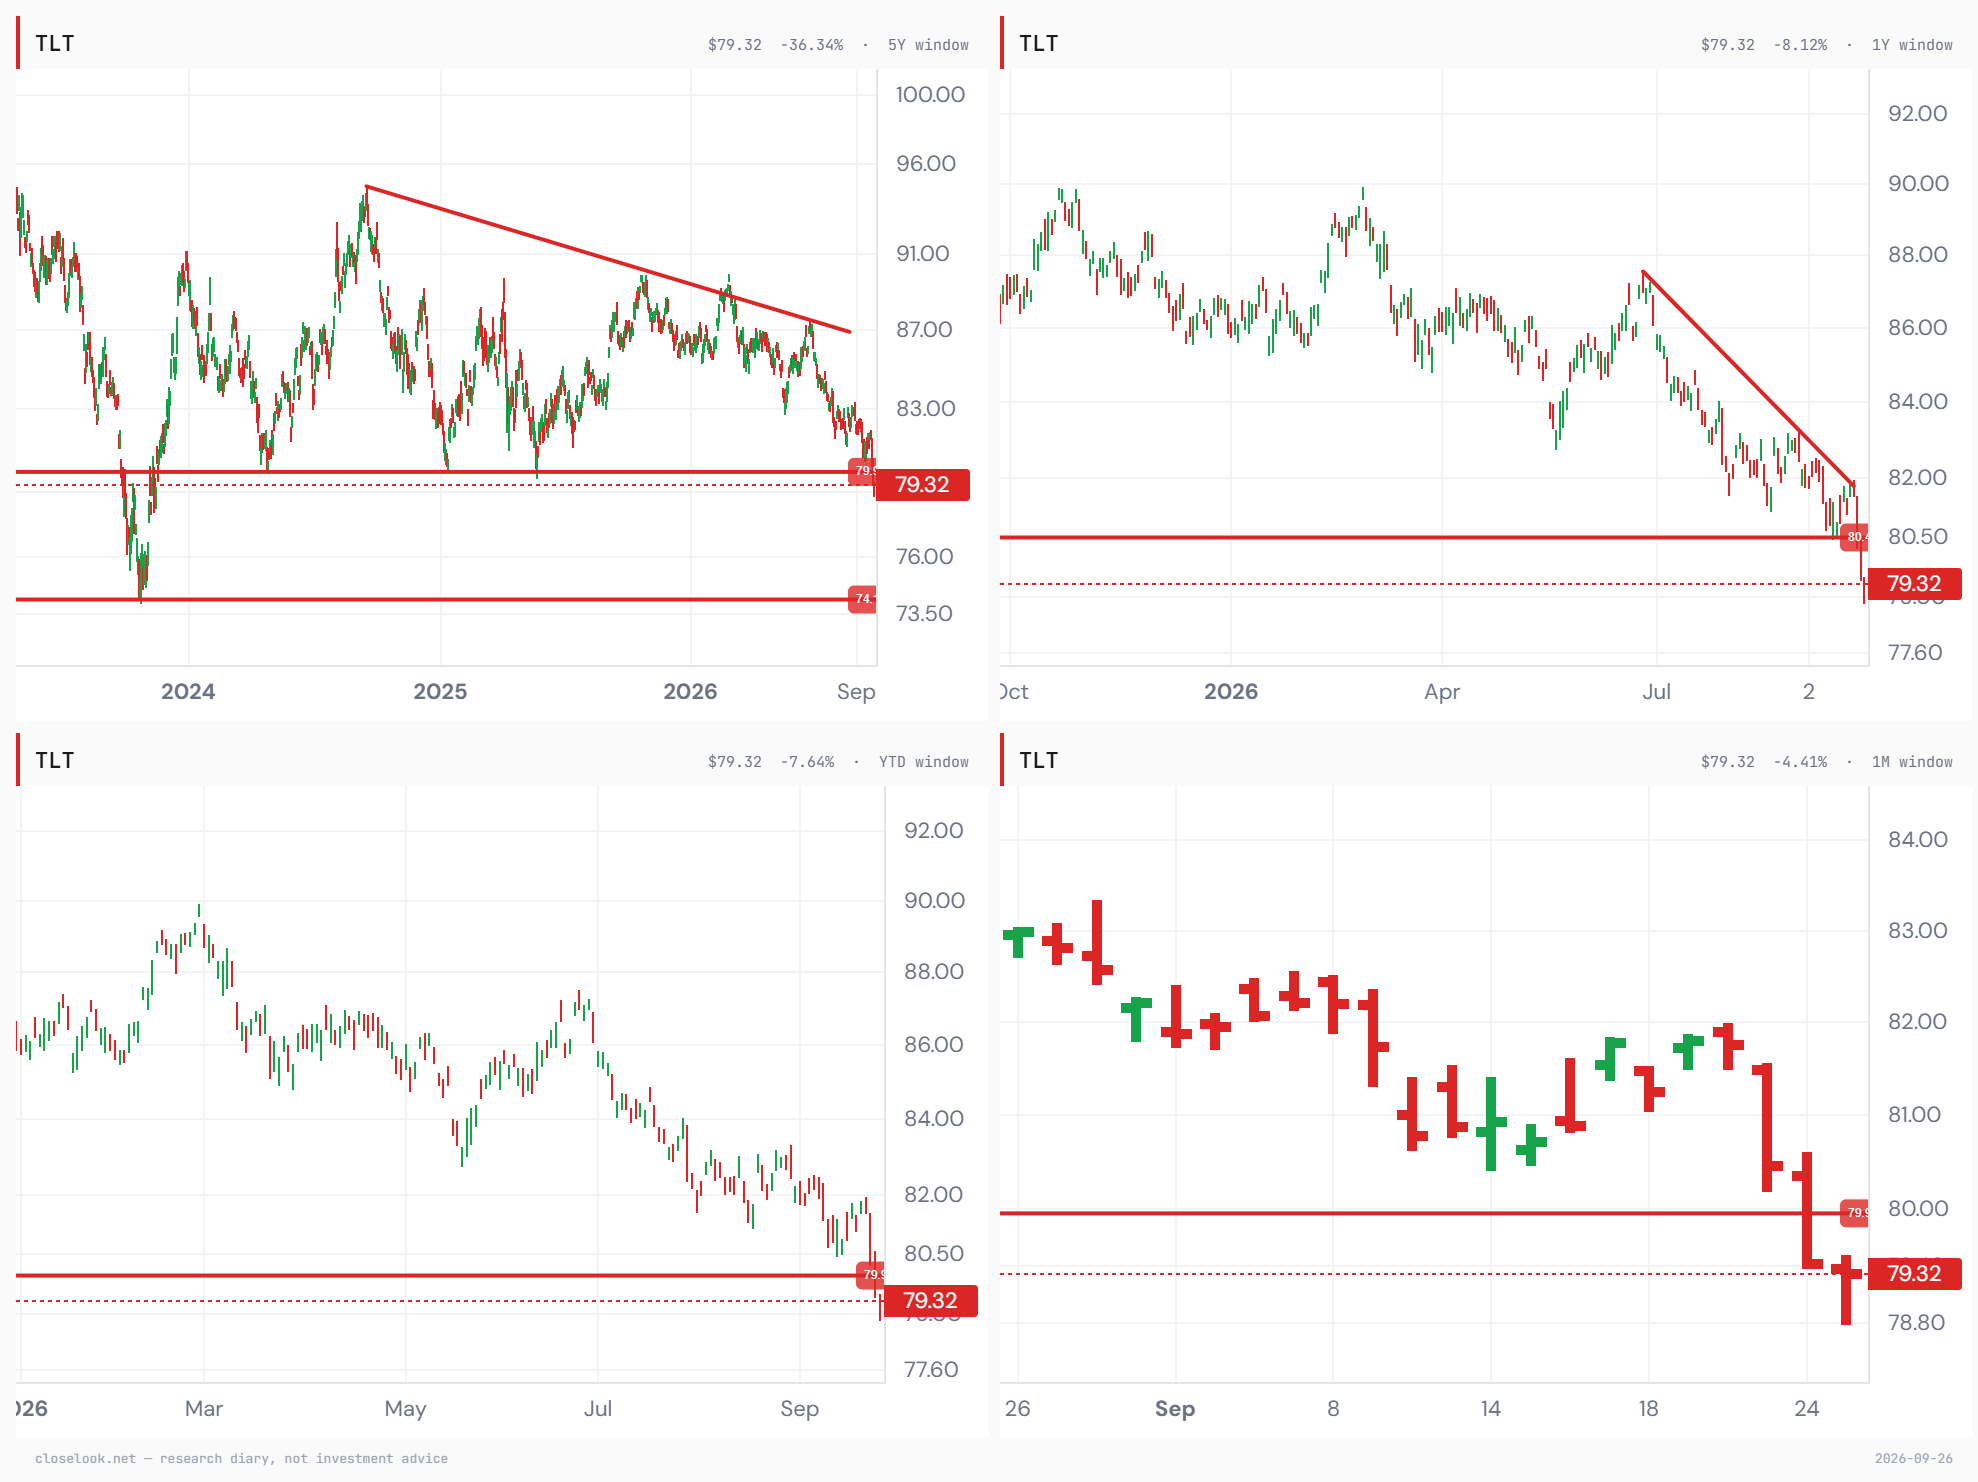
The long bond, in the editor’s charts — the floor gave way. Five years of TLT show one level more clearly than any other: a floor near 79.9 that held in October 2022, in the spring of 2024, and twice in 2025. Above it, a falling line from the 2024 high has capped every rally since. This week the fund closed under that floor, at 79.32, for the first time since the autumn of 2023. The next level on the chart is 74, the October 2023 low; the one-year window adds a second, steeper falling line from the June high that the fund has followed straight down. The four windows say the same thing at every scale: the support did not hold.