


basis point is a hundredth of a percentage point. This morning Japan’s ten-year government bond yield jumped to 3.08% in Tokyo’s first session after three days of holidays, and the German ten-year is at 3.57%, the highest of the past year. Rates are rising everywhere at once. The question that decides what this means for stocks is simple: are yields rising because the economy is strong, or because investors are starting to worry about how much the US government owes? Today’s diary entry runs the tests, maps the levels in the US, Europe and Japan, and reads what the futures market expects the Fed to do in 2026 and 2027.

The curve: the short end is doing the pushing
The yield curve is the line that joins the yields of short and long government bonds. Which end moves first tells you who is behind a sell-off. When short-dated yields rise fastest, investors are pricing a central bank that keeps raising rates, usually because growth and inflation are strong. When long-dated yields lead, investors are demanding extra pay for lending to the government for decades, and that is where debt worries show up.
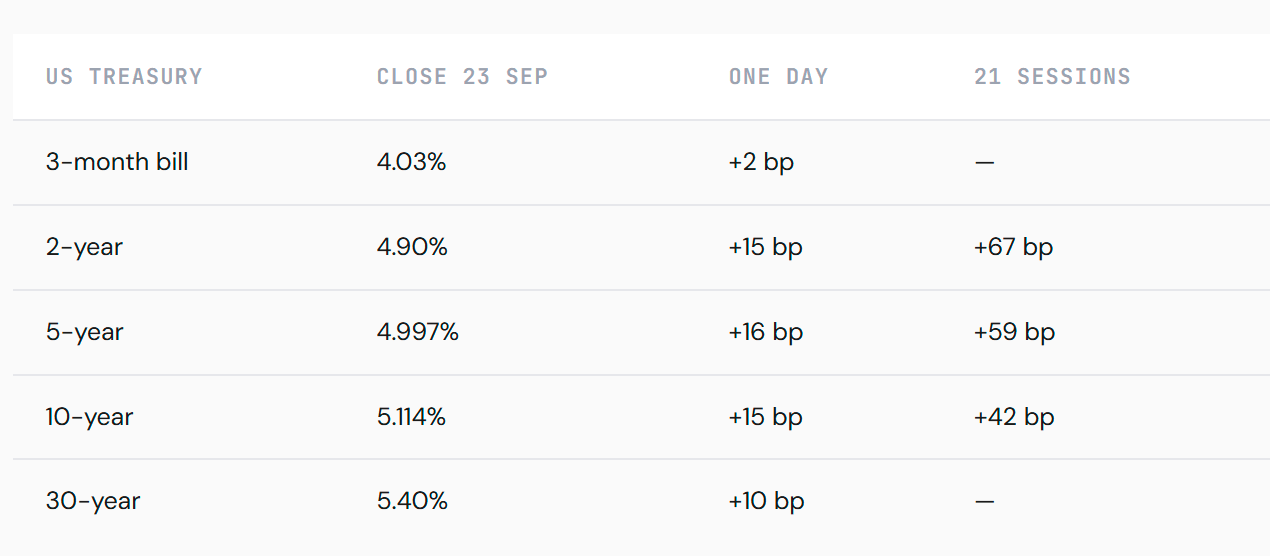
Every point on the curve, from the three-month bill to the thirty-year bond, closed Wednesday at its highest level of the past twelve months. The ten-year and the thirty-year closed at their highest since 2007; the five-year touched 5% for the first time since then.
Over the past month the two-year rose 67 basis points and the ten-year 42. The gap between them, the most-watched slope of the curve, narrowed from 47 basis points to 21. Economists call a curve that flattens while yields rise a bear flattener. It is the signature of a Fed that has started raising rates, which it did on 16 September for the first time since 2023, taking its range to 3.75–4.00%, and of a bond market that expects more. The two-year now sits about 90 basis points above the top of that range.
Closelooknet on Google
Get our reads first in Top Stories and AI answers. One tap, no account needed here.
Growth or debt stress: five tests
There is no single number that answers the question, so we use five readings. Each one leans toward “the economy is strong” or “the government’s borrowing is the problem”.
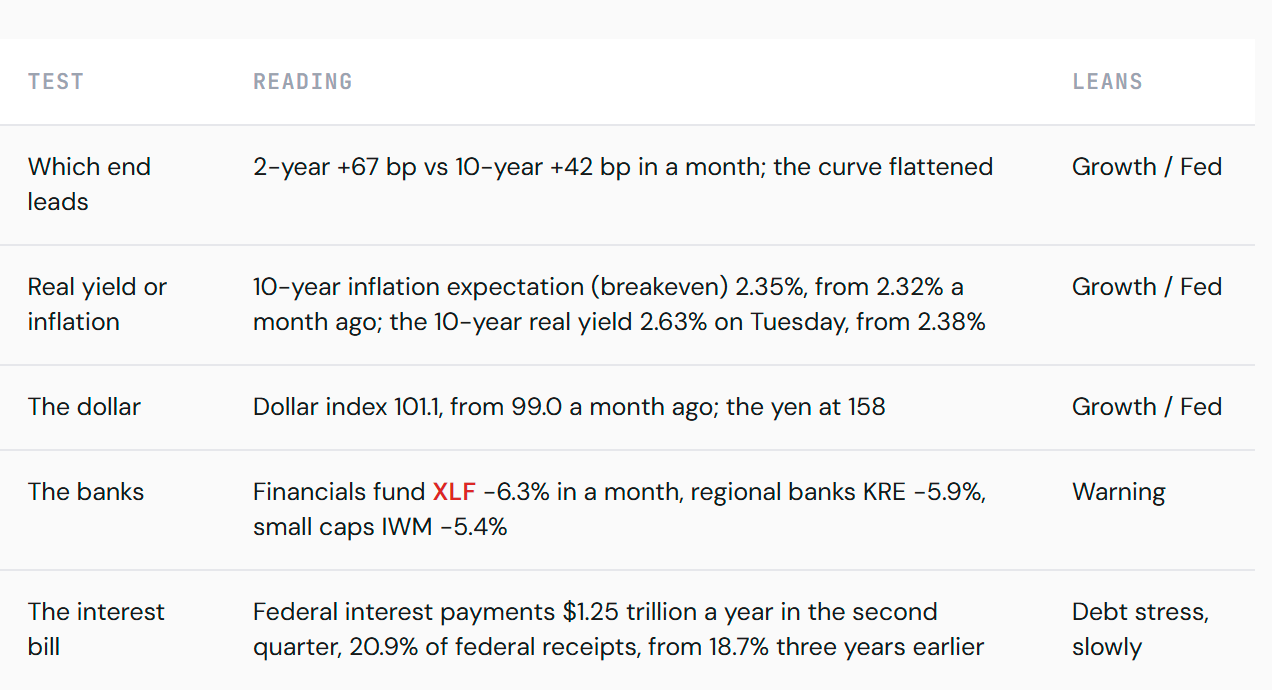
Three of five lean toward growth. The rise is in the real yield, the part of the yield left after expected inflation; inflation expectations have barely moved. That is what a strong economy and a tightening Fed look like. Wednesday’s purchasing managers’ survey at 58.4 showed the fastest US output growth in more than five years. And the dollar is rising with yields. In a true debt scare, foreign investors sell Treasuries and dollars together, so yields go up while the dollar goes down. That happened in April 2025. It is not happening now.
Two readings are amber. Banks usually do well when rates rise, because they lend at higher rates. They have fallen for a month. A flatter curve squeezes the gap between what banks pay on deposits and what they earn on loans, and higher rates raise the risk that borrowers struggle. Small companies that borrow at floating rates have fallen too. The second amber light is the interest bill. At $1.25 trillion a year, interest takes about one dollar in five the federal government collects, and every refinancing at 5% pushes that share higher. It is not a crisis signal today. It is the reason the long end has less room to fall than it did in past cycles.
The levels: US, Europe, Japan
Support and resistance on a yield chart work like they do on a stock chart. Resistance is a level where earlier rallies in yield stopped; support is where declines stopped. All levels are closing yields from the past twelve months.
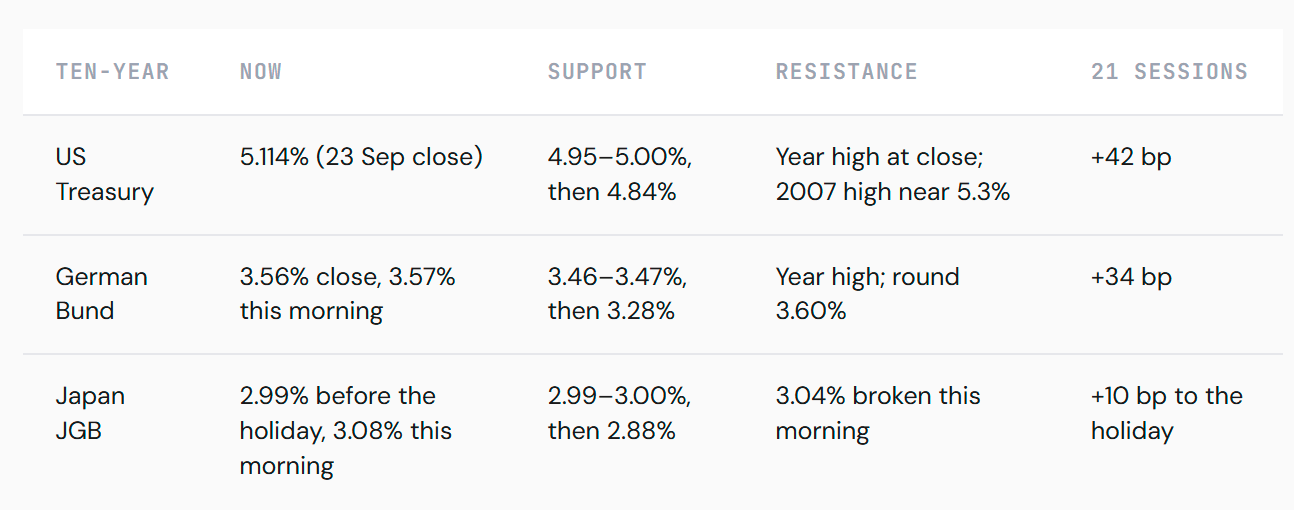
United States. The ten-year spent a week either side of 5% after the Fed’s increase, with closes of 4.95% to 5.02%, and Wednesday broke out of that range. As long as closes stay above 5%, the breakout holds. A close back below 4.95% would say Wednesday was a one-day event. Above, the only reference on a long chart is the 2007 high near 5.3%.
Europe. The Bund’s rise is quieter but steady: 3.22% a month ago, 3.56% on Wednesday. More telling is the German two-year at 3.34%, about 84 basis points above the European Central Bank’s 2.50% deposit rate. Economists polled before this month’s increase called it the last one. The two-year is not pricing that. Europe’s outliers sit in the ten-year spreads: France at 4.64%, above Italy at 4.51%, and the UK at 5.35%, the highest ten-year in the G7.
Japan. The Bank of Japan raised its policy rate to 1.25% on 18 September, a 31-year high. The ten-year had stalled at 2.99% into the holidays and broke above its 3.04% high as Tokyo reopened. The Japanese two-year at 1.85% is 60 basis points above the policy rate, so the market expects more increases here too. This matters for the US: Japanese investors are the largest foreign holders of Treasuries, and every rise in yields at home makes the trip abroad less worth it. That is a slow drain on demand for long US bonds, not a sudden one. For now the weak yen keeps the carry trade running, which is the reading from our 18 September Pulse.
What the futures price for 2026 and 2027
Fed funds futures let investors bet on the average Fed rate in a given month. The price is 100 minus the expected rate, so the contracts read like a schedule. These are Wednesday’s settlements.
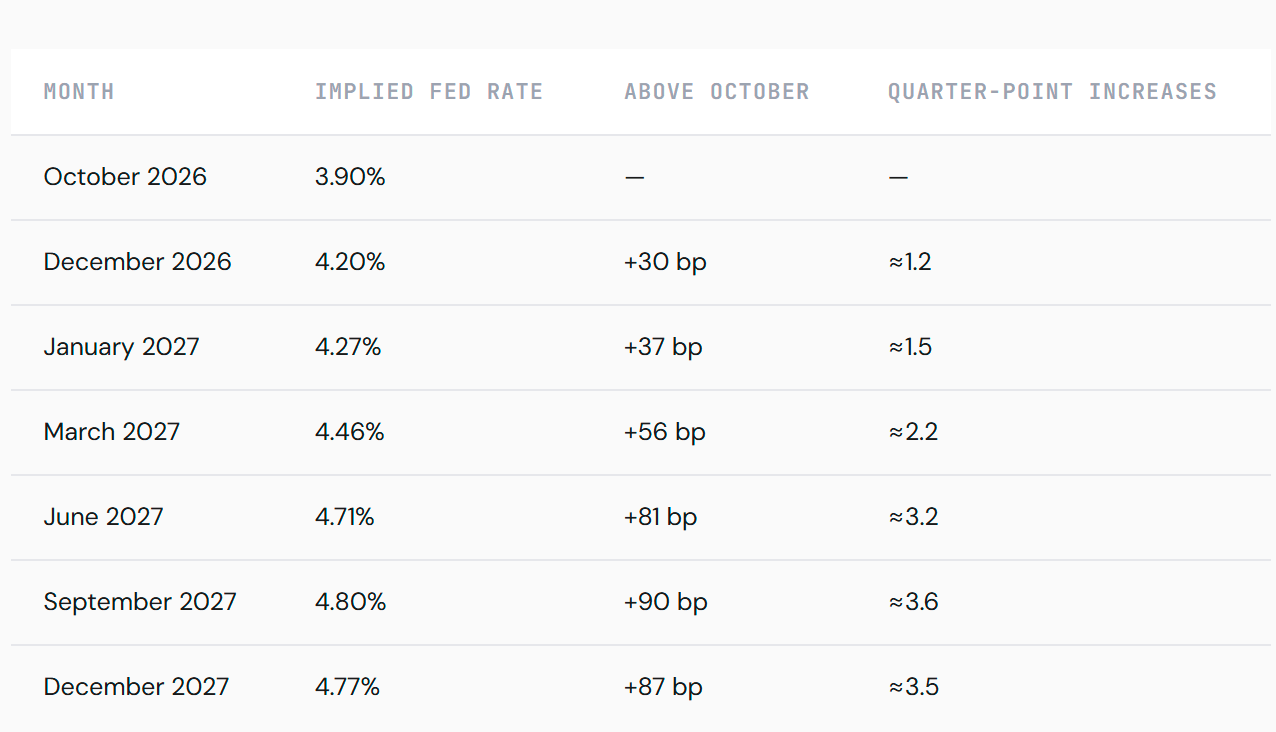
2026: one more increase is fully priced for the two remaining meetings, 28 October and 9 December, and a second is about a coin toss. 2027: about two more in the first half, and a peak near 4.8% by the autumn. After that the curve goes flat: December 2027 prices slightly below September, the first hint that the market sees an end. In total, three to four more quarter-point increases, on top of the one the Fed has already made.
Two cautions. Futures are prices, not forecasts, and they include some payment for uncertainty, so they tend to overstate the path when rates are rising. And the path can move fast: a single weak jobs report can take a whole increase out of 2027.