

Risk-On Broadens — Memory Leads the Build-Out
Small-caps and equal-weight join the megacaps as the Rubin Build-Out extends to ~6x the Nasdaq; bond vol eases and the wave-3 read holds.

Edition / 2026-05-24 / CW 21
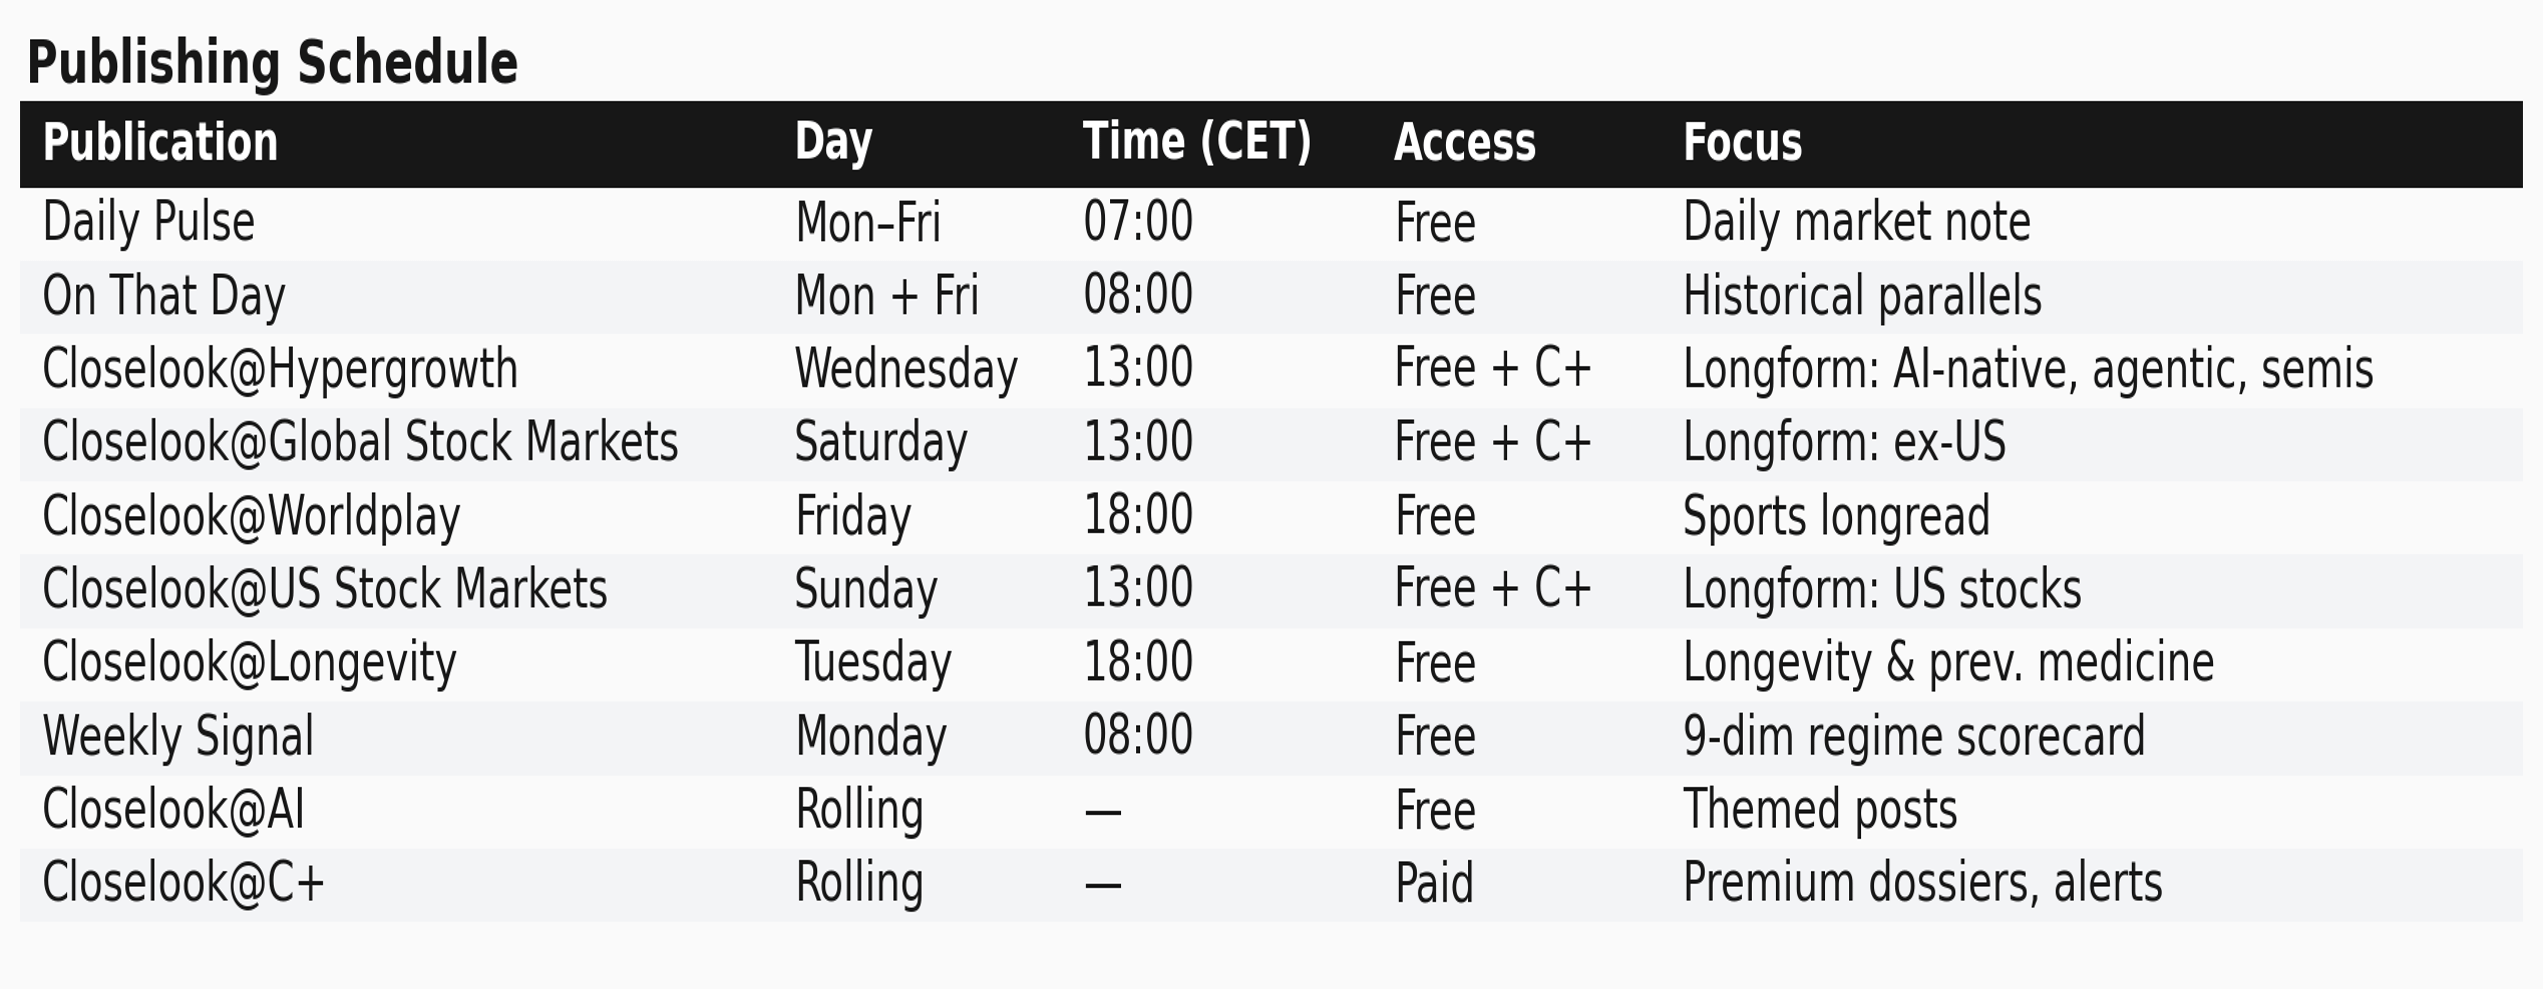
Thank you for reading this week’s edition of Closelook@US Stock Markets. The next edition will be published next Sunday, 31 May. For the schedule of our other publications, please see the end of this document.
In This Edition
(1) This Week’s Action
(2) Overview: The US Market Map
(3) The State
(4) The Outlook
(5) What May Lie Ahead: Macro Setup
(6) What May Lie Ahead: Technical Setup
(7) The AI Build-Out Portfolio: What We Did
(8) The AI Build-Out Portfolio: What We Plan To Do
(9) Knowledge Corner
(10) Upcoming Transactions: Be Informed
(11) What May Go Wrong: Risk & Change Triggers
(12) Final Words
(1) This Week’s Action
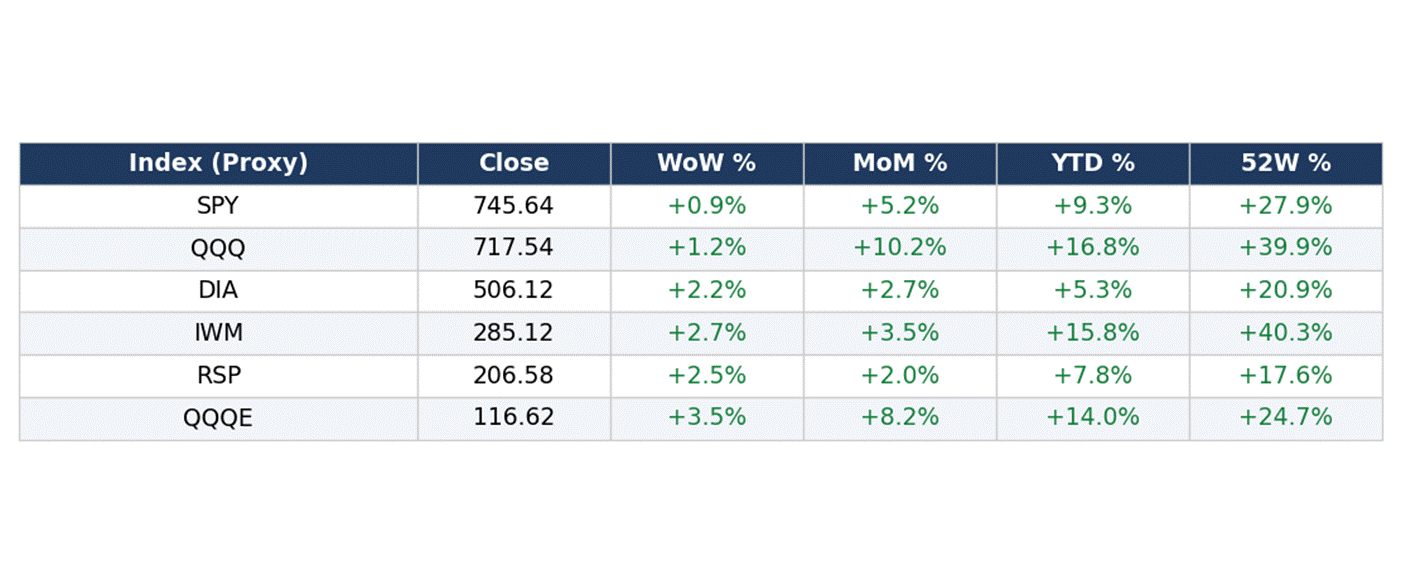
Risk-on broadened this week. Small-caps (IWM +2.7%) and the equal-weight tape (RSP +2.5%, QQQE +3.5%) outran cap-weight (SPY +0.9%, QQQ +1.2%) — participation was widening, not narrowing.
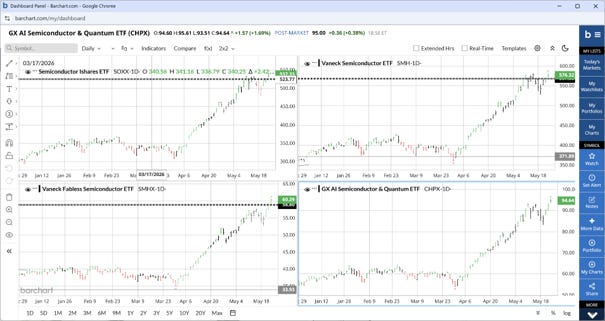
Semiconductors led again (SOXX +5.7%, SMH +3.6%) and the Closelook Rubin Build-Out 100 index extended its run (+5.4% on the week, equal-weight, +103.4% YTD momentum-weight).
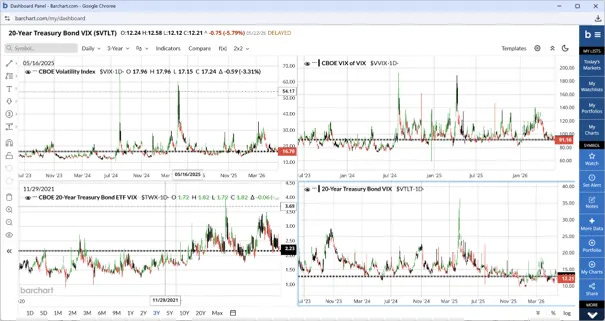
Volatility eased broadly — the VIXY equity-vol proxy fell 5.6% on the week, and bond volatility came down as well.
The Week at a Glance — US Index Proxies
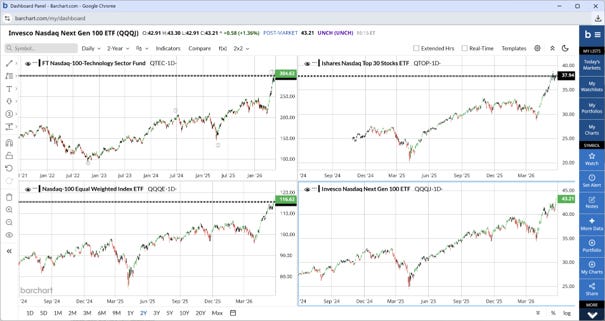
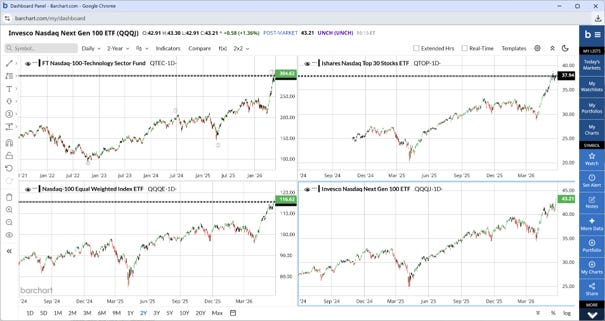
QTEC, QTOP, QQQE, and QQQU recorded new ATHs. Nasdaq 100 tech stocks continued their outperformance vs. non-tech stocks.
US index proxies, Friday 2026-05-22 (etf_closingprices).
The Russell 2000 iShares ETF (IWM) is now up more than 40% over the past 52 weeks while outperforming QQQ. Price action is not aligned with any top full of negative divergences, but rather the opposite.
It is also not aligned with rising interest rates, which will end the bull soon.
R2K tends to perform worse than large-cap U.S. indices during rising-rate regimes, especially when rates rise because of tighter Fed policy, higher real yields, or refinancing stress.
But it is not automatic. The key distinction is:
Rising rates + strong growth = Russell 2000 can hold up.
Rising rates + tighter credit/recession risk = Russell 2000 usually underperforms.
What Happened
On an ETF-proxy basis, every major US gauge closed higher on the week: DIA +2.2%, IWM +2.7%, QQQ +1.2%, and SPY +0.9%, with the equal-weight Nasdaq-100 (QQQE) up 3.5%.
Year-to-date, the proxies sit at QQQ +16.8%, IWM +15.8%, SPY +9.3%, and DIA +5.3%. The headline remains semiconductors: SMH +60.0% and SOXX +78.4% YTD.
On the underlying cash indices, the Friday closes were: S&P 500 7,473.47 (+0.9% on the week, +9.2% YTD), Nasdaq-100 29,481.64 (+1.2% week, +16.8% YTD), Nasdaq Composite 26,343.97 (+0.5% week, +13.3,% YTD) and the Dow 50,579.70 (+2.1% week, +5.2% YTD).
The VIX closed at 16.70 (-9.4% on the week) — the calm tape underneath the broadening.
Week Winners
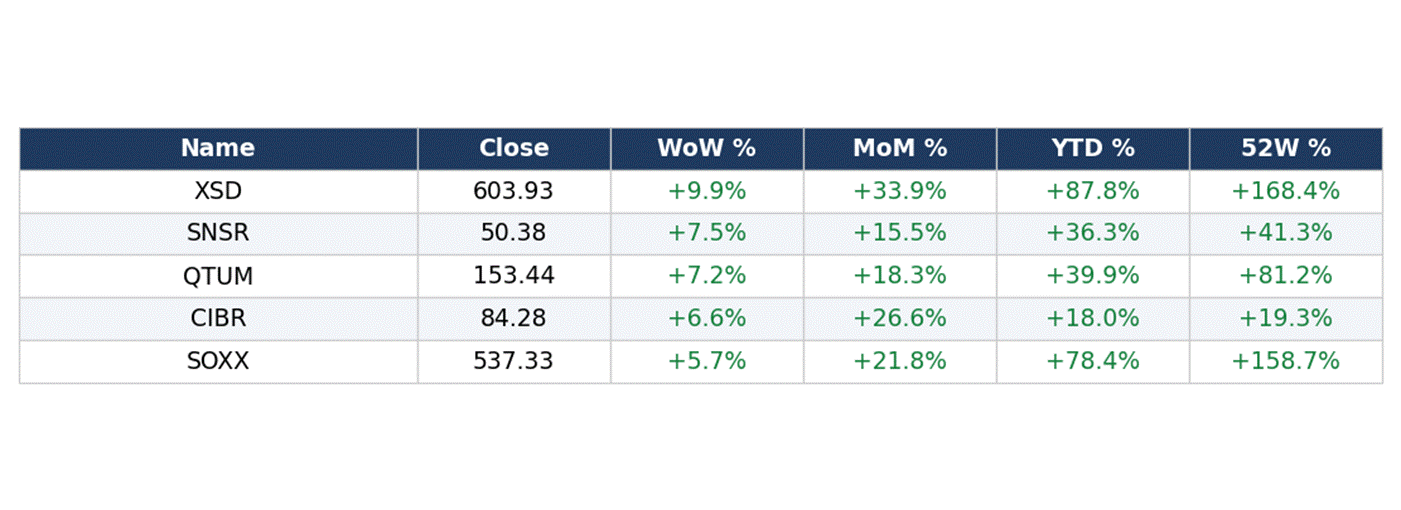
Weekly winner sections included semiconductors, quantum computing, cybersecurity, and the internet of things sector.
Week winners - top 5 by WoW (60-ETF pool, 2026-05-22; MGK excluded).
Week Losers
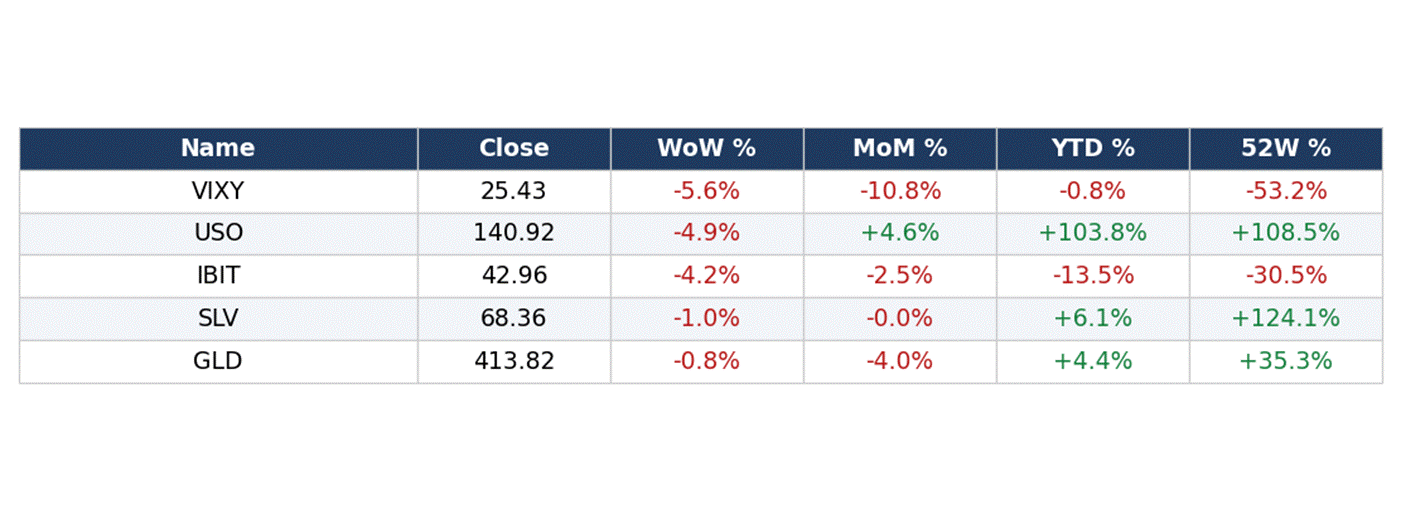
Week losers - bottom 5 by WoW (60-ETF pool, 2026-05-22).
Leadership sat firmly in the silicon/cyber complex — semi-equipment (XSD +9.9%), IoT sensors (SNSR +7.5%), quantum (QTUM +7.2%), cyber (CIBR +6.6%), and broad semis (SOXX +5.7%).
The bleed was in hedges and cross-assets: the vol proxy (VIXY -5.6%), oil (USO -4.9%), bitcoin (IBIT -4.2%, and a soft metals tape (SLV -1.0%, GLD -0.8%).
(2) Overview: The US Market Map
The Closelooknet Rubin build-out index continued to outperform the standard SP 500 Info Tech, Nasdaq 100, or Nasdaq indices.
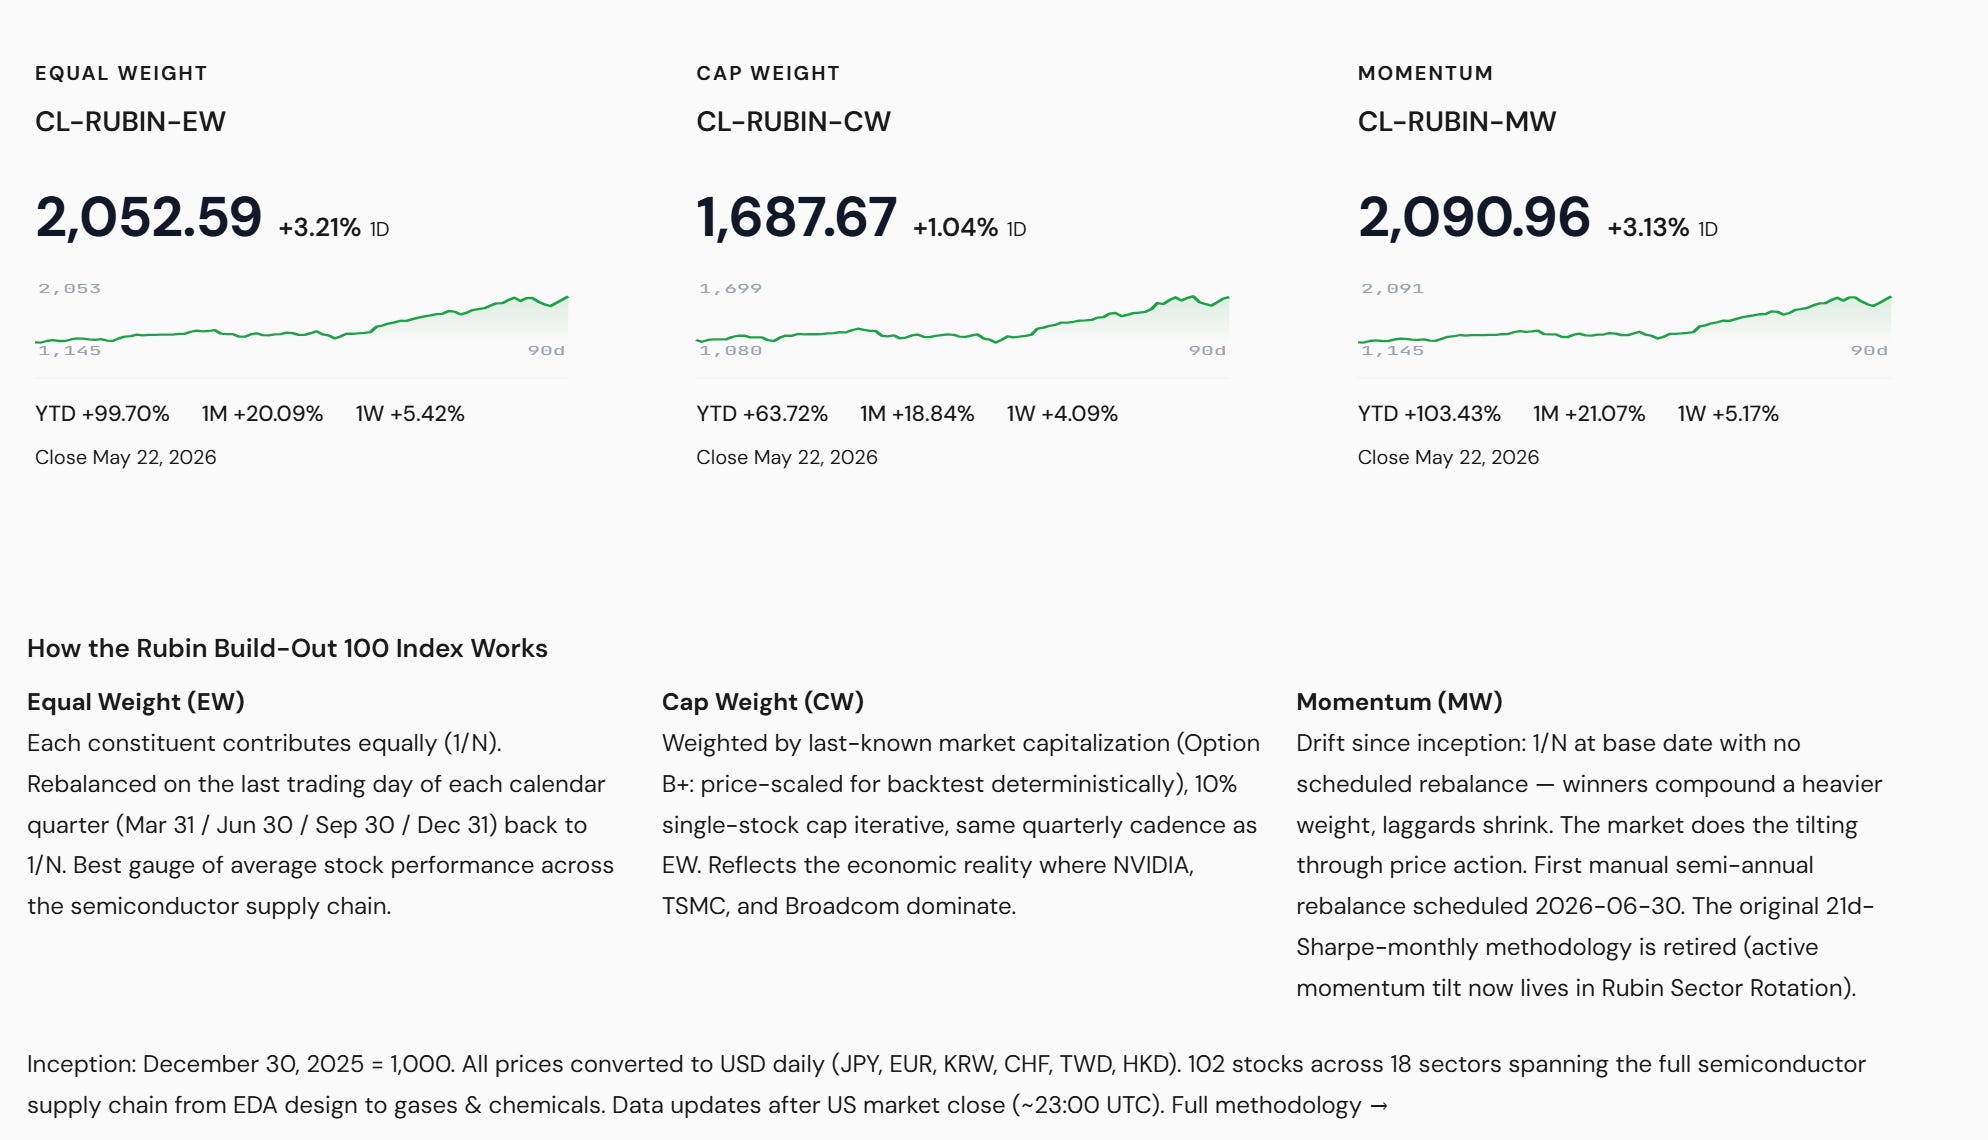
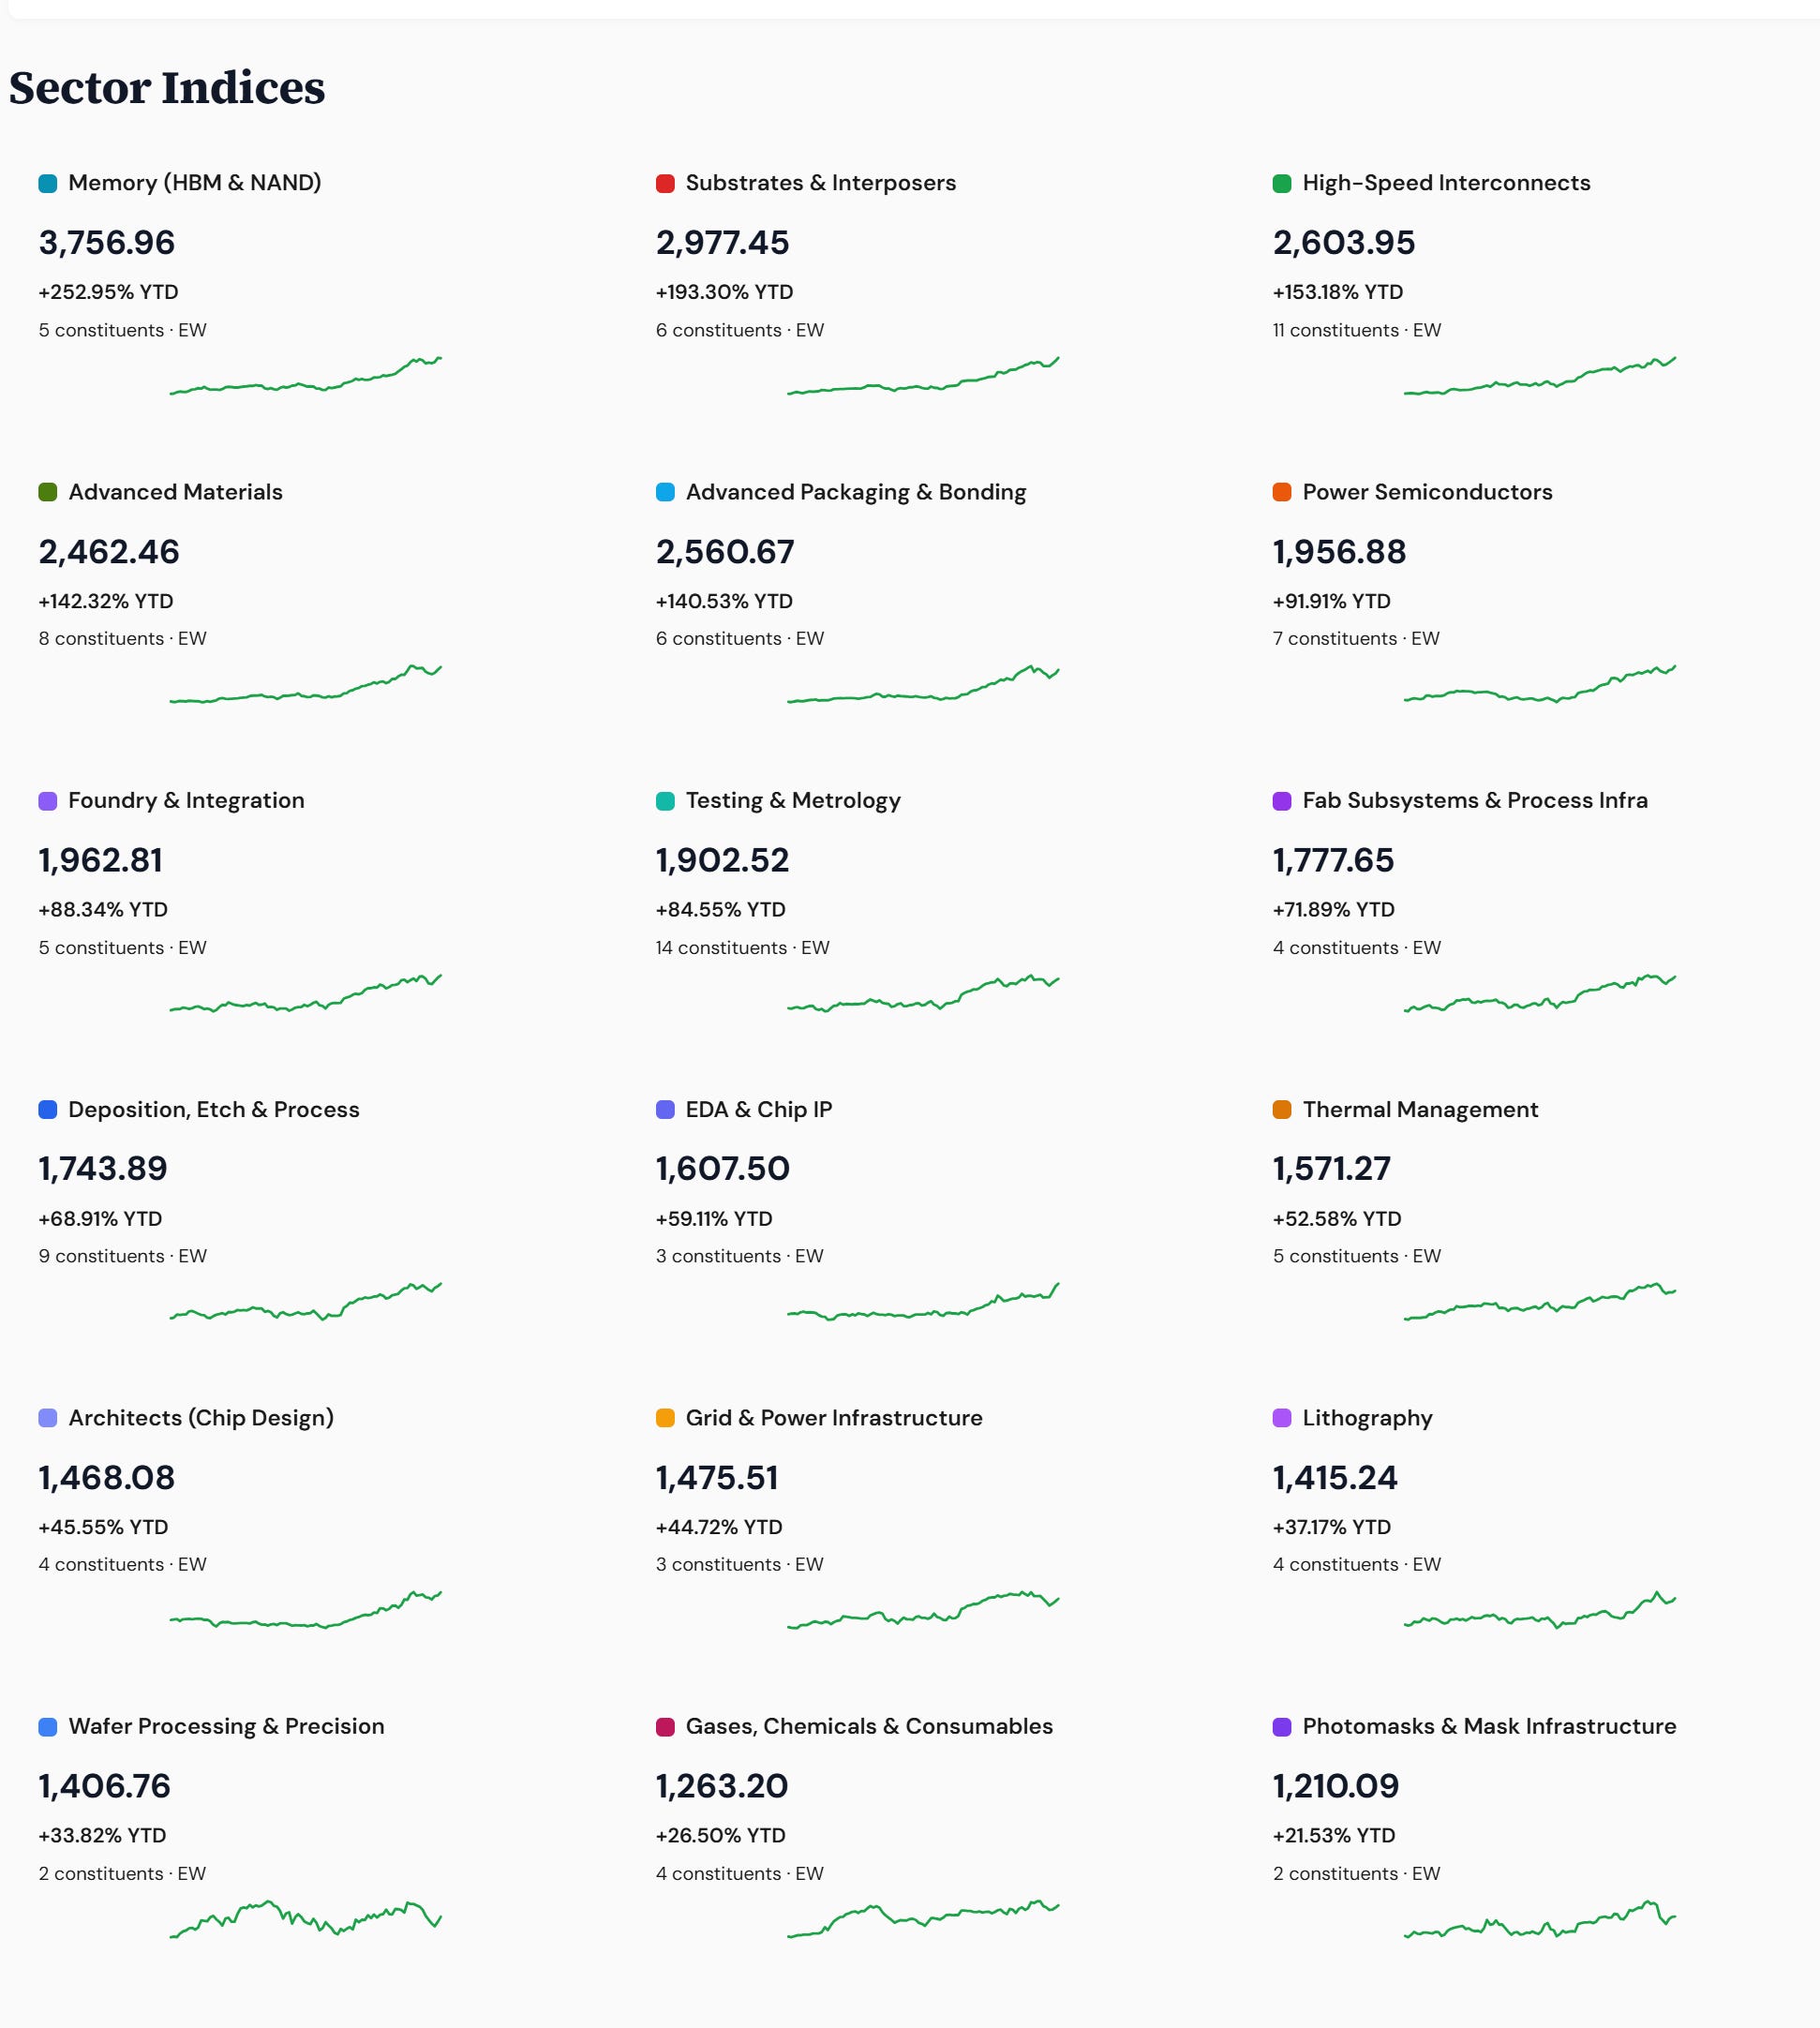
Memory, Substrates, and Connect remained the top-performing ytd sectors within the 18-sector Rubin universe.
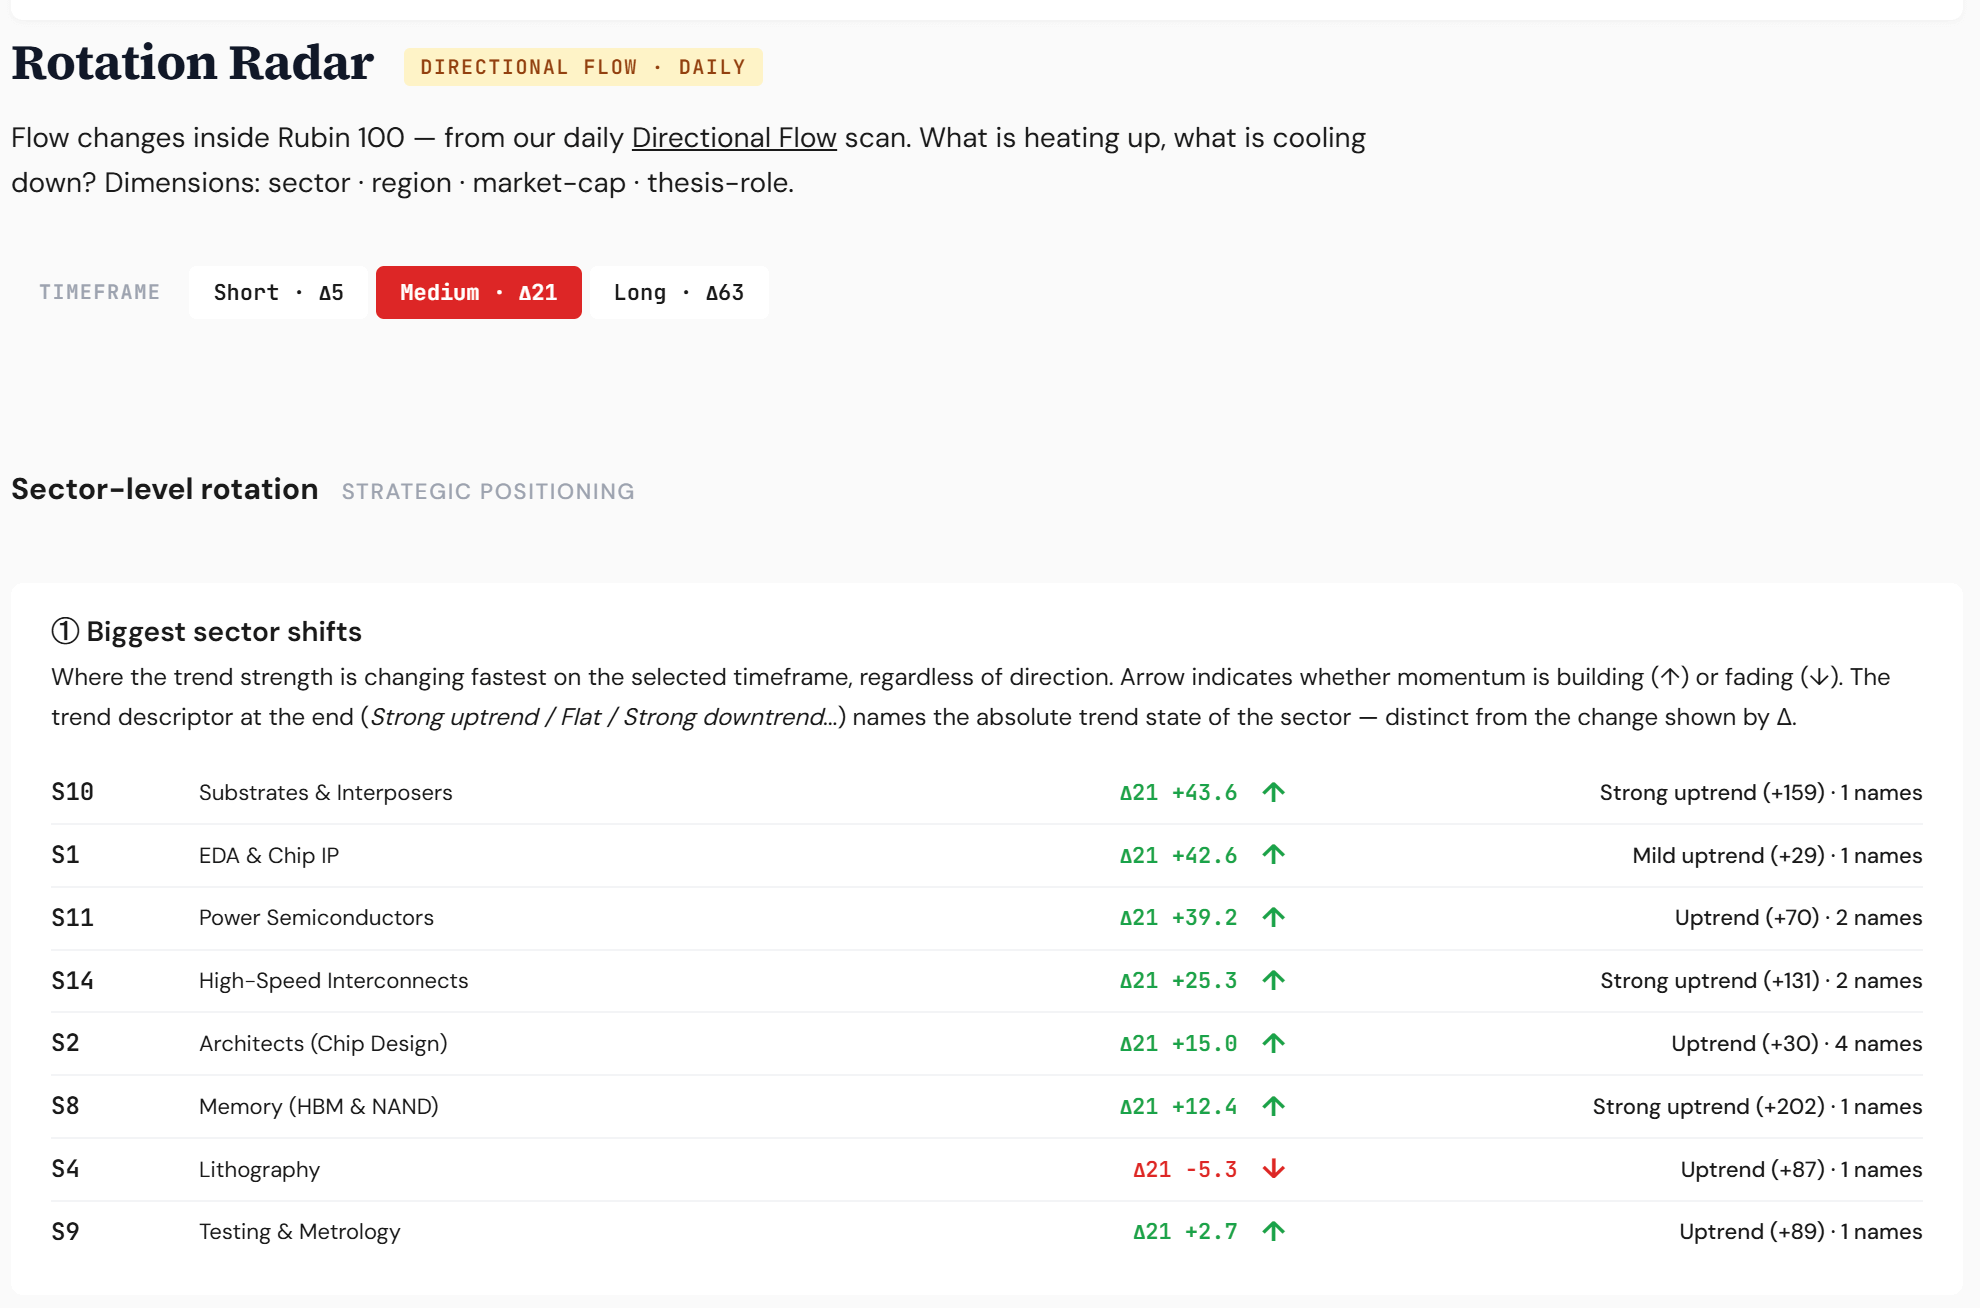
The biggest trend-strength sector shifts (upside) could be seen in the substrates/interposers and EDA/Chip Design sectors. Testing/Metrology lagged alongside Lithography.
(3) The State
The regime reads Risk-On and broadening. Money Temperature sits at 61 — the Transition band, a ‘Risk-on rally’ reading.
Leadership remains concentrated in the AI hardware build-out, but this week, participation widened across the cap scale.
Closelook Functional Indices
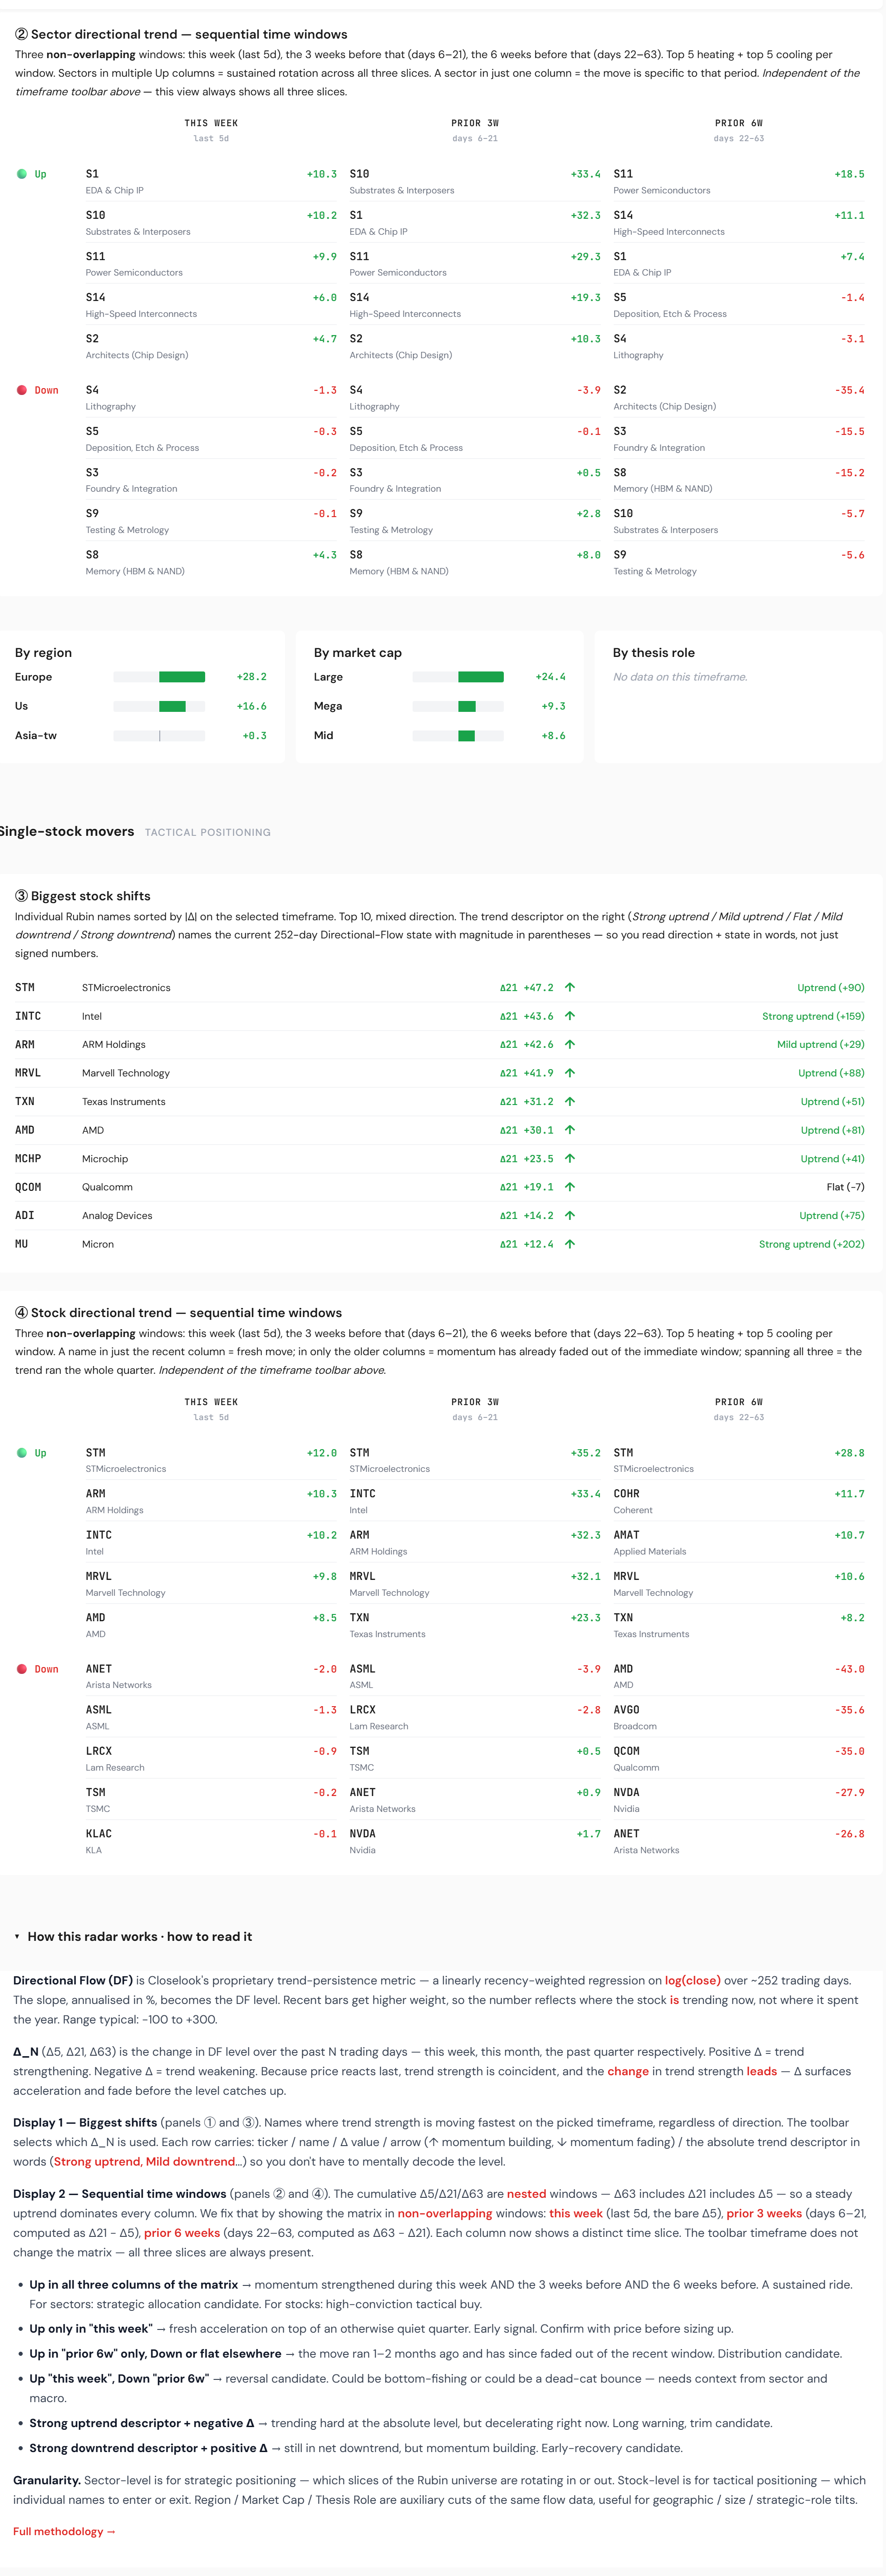
After Nvidia's earnings call, stocks such as Qualcomm, Arm, Intel, SoftBank, Cloudflare, and Lattice strengthened as potential agentic build-out winners.
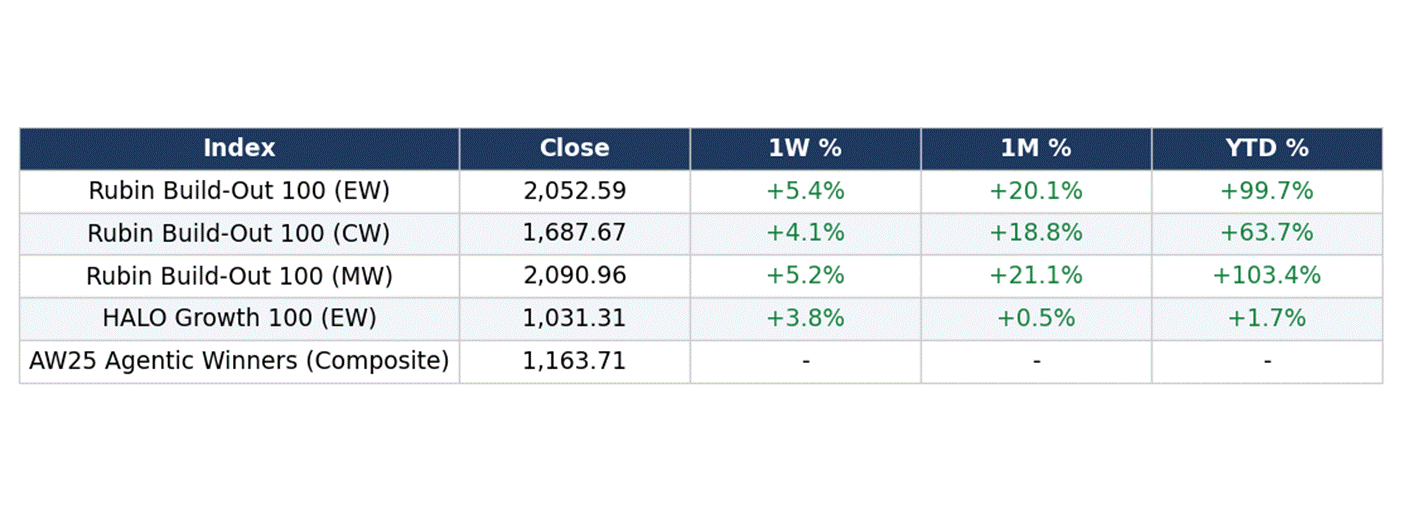
The Thesis — The Build-Out Widens, Memory in Front
The spread tells the story. The Rubin Build-Out 100 is +99.7% YTD equal-weight and +103.4% momentum-weight against QQQ at +16.8% — roughly a 6x lead, and it extended again into Friday (+5.4% on the week, equal-weight).
The lead is structural: it isolates the AI-infrastructure layer, the broad index dilutes, with leadership concentrated in the memory and chip-design layers.

The Software Question — Stabilizing, Not Yet Confirmed
At the index level, software is not cracking: IGV +2.4% on the week, though still -11.1% YTD, while cyber outperformed (CIBR +6.6%). T
The single names confirm the split — a strong relief week sitting on top of deep year-to-date damage: [IMAGE 09]
Software single names, EODHD 2026-05-22 (sorted by week).
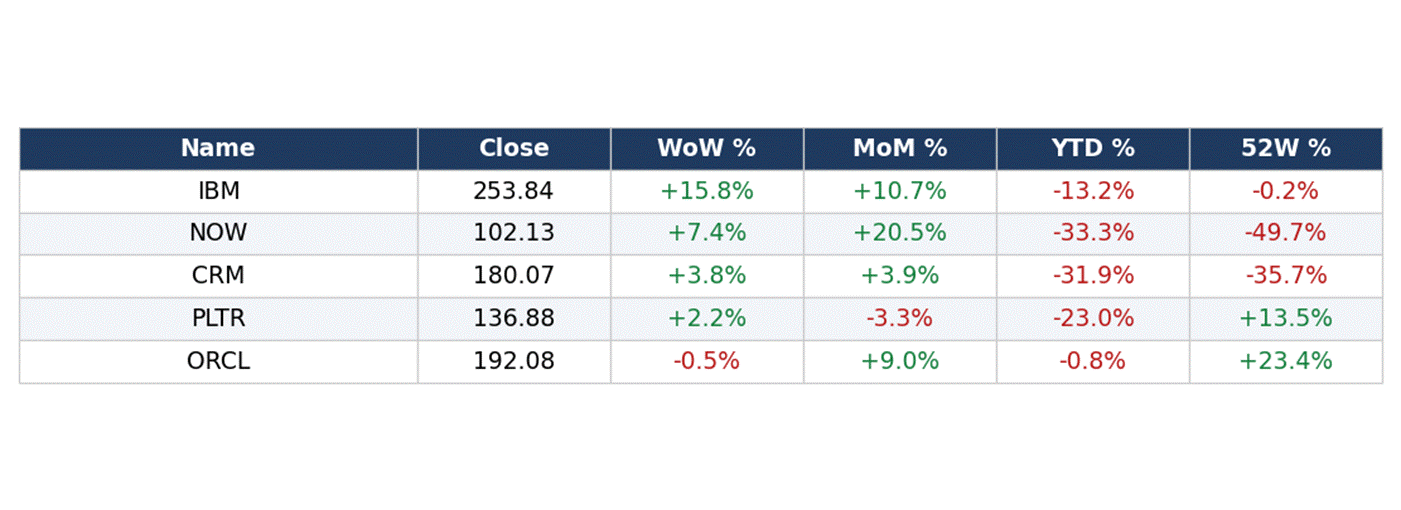
Verdict: stabilizing, not yet fully confirmed. The bounce was real and broad — IBM +15.8% on the week, ServiceNow +7.4%, Salesforce +3.8% — but it is a bounce off deep year-to-date holes (NOW -33.3%, CRM -31.9%, PLTR -23.0% YTD).
Oracle is the relative anchor at roughly flat for the year (-0.9% YTD).
Read together: the SaaS complex is confirming a bottom, with splits between agentic winners and stocks at risk of disruption.
It remains to be seen how this will play out at the IGV ETF level. We keep the verdict pending until IGV reclaims its year-to-date downtrend — one strong week is necessary but not sufficient.
The Frame — Within-Tech, Not Out of Tech
Within-tech, not out of tech. The diagnostic split: semis vertical (SOXX +5.7%, SMH +3.6% on the week; +78.4% and +60.0% YTD) against software flat-to-soft (IGV +2.4% week, -11.1% YTD).
Capital is rotating between tech layers, not leaving tech.
Single-Name Dispersion — Within-Silicon Rotation
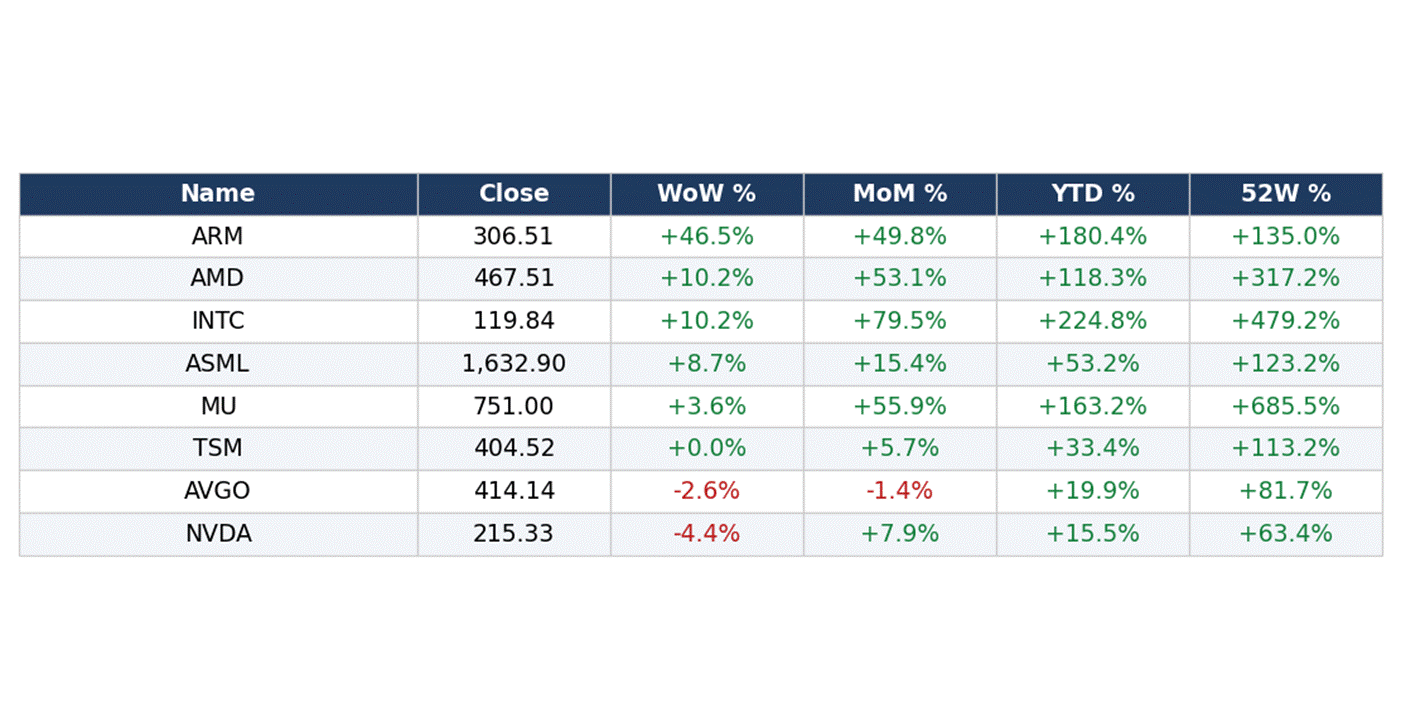
Under the semis umbr,ella the leadership rotated hard this week. Arm led the complex with an earnings-driven +46.5% on the week, with Intel +10.2% and AMD +10.2%, ASML, +8.7% and Micron +3.6% — while the prior front-runners cooled: Nvidia -4.4% and Broadcom -2.6%.
That is healthy rotation within the complex, not a top: capital is broadening across the silicon layers rather than crowding into a single mega-cap. The deep-cycle laggards leading and the leader resting is the classic mid-cycle signature.
Semis single names, EODHD 2026-05-22 (sorted by week). Arm move is earnings-driven.
Seasonality Setup
Seasonality backs the constructive read. On the Nasdaq-100’s seasonal record (Barchart, $IUXX), May-June-July is the strongest three-month stretch of the calendar year - averaging roughly +7% combined (May +1.9%, June +1.3%, July +4.1%).
July is the single best month of the year: +4.1% average with a 93.75% positive hit rate, the highest of any month.
The negative average month does occur until September (-0.35%). With the index already +16.8% YTD in 2026, the calendar tailwind into summer aligns with the within-tech rotation read.
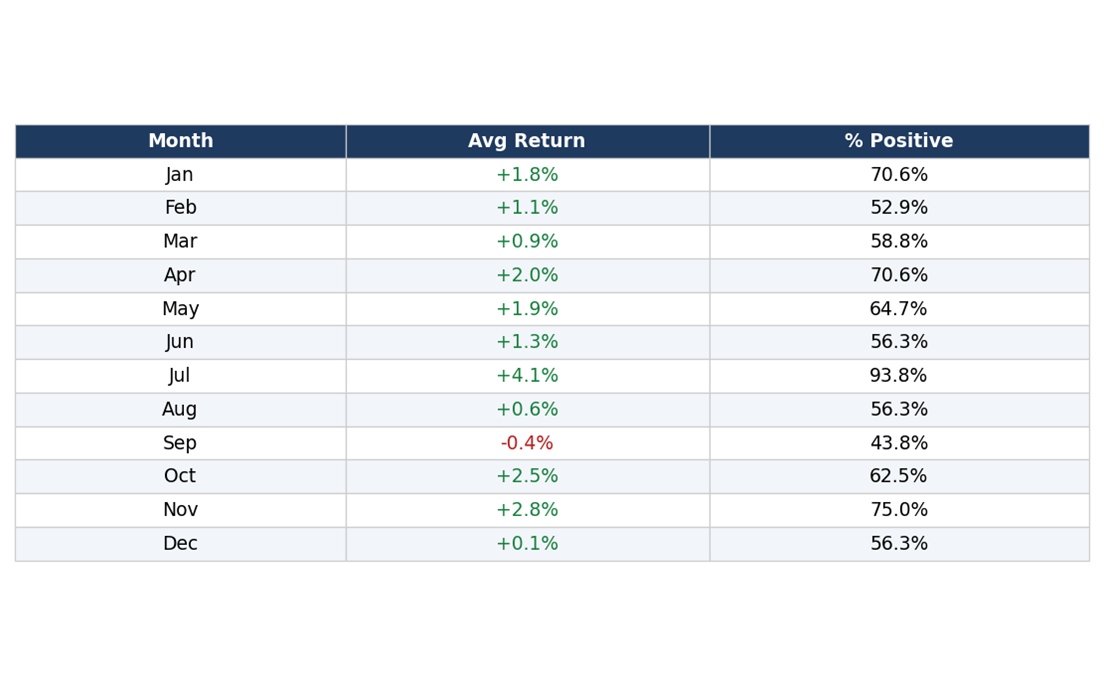
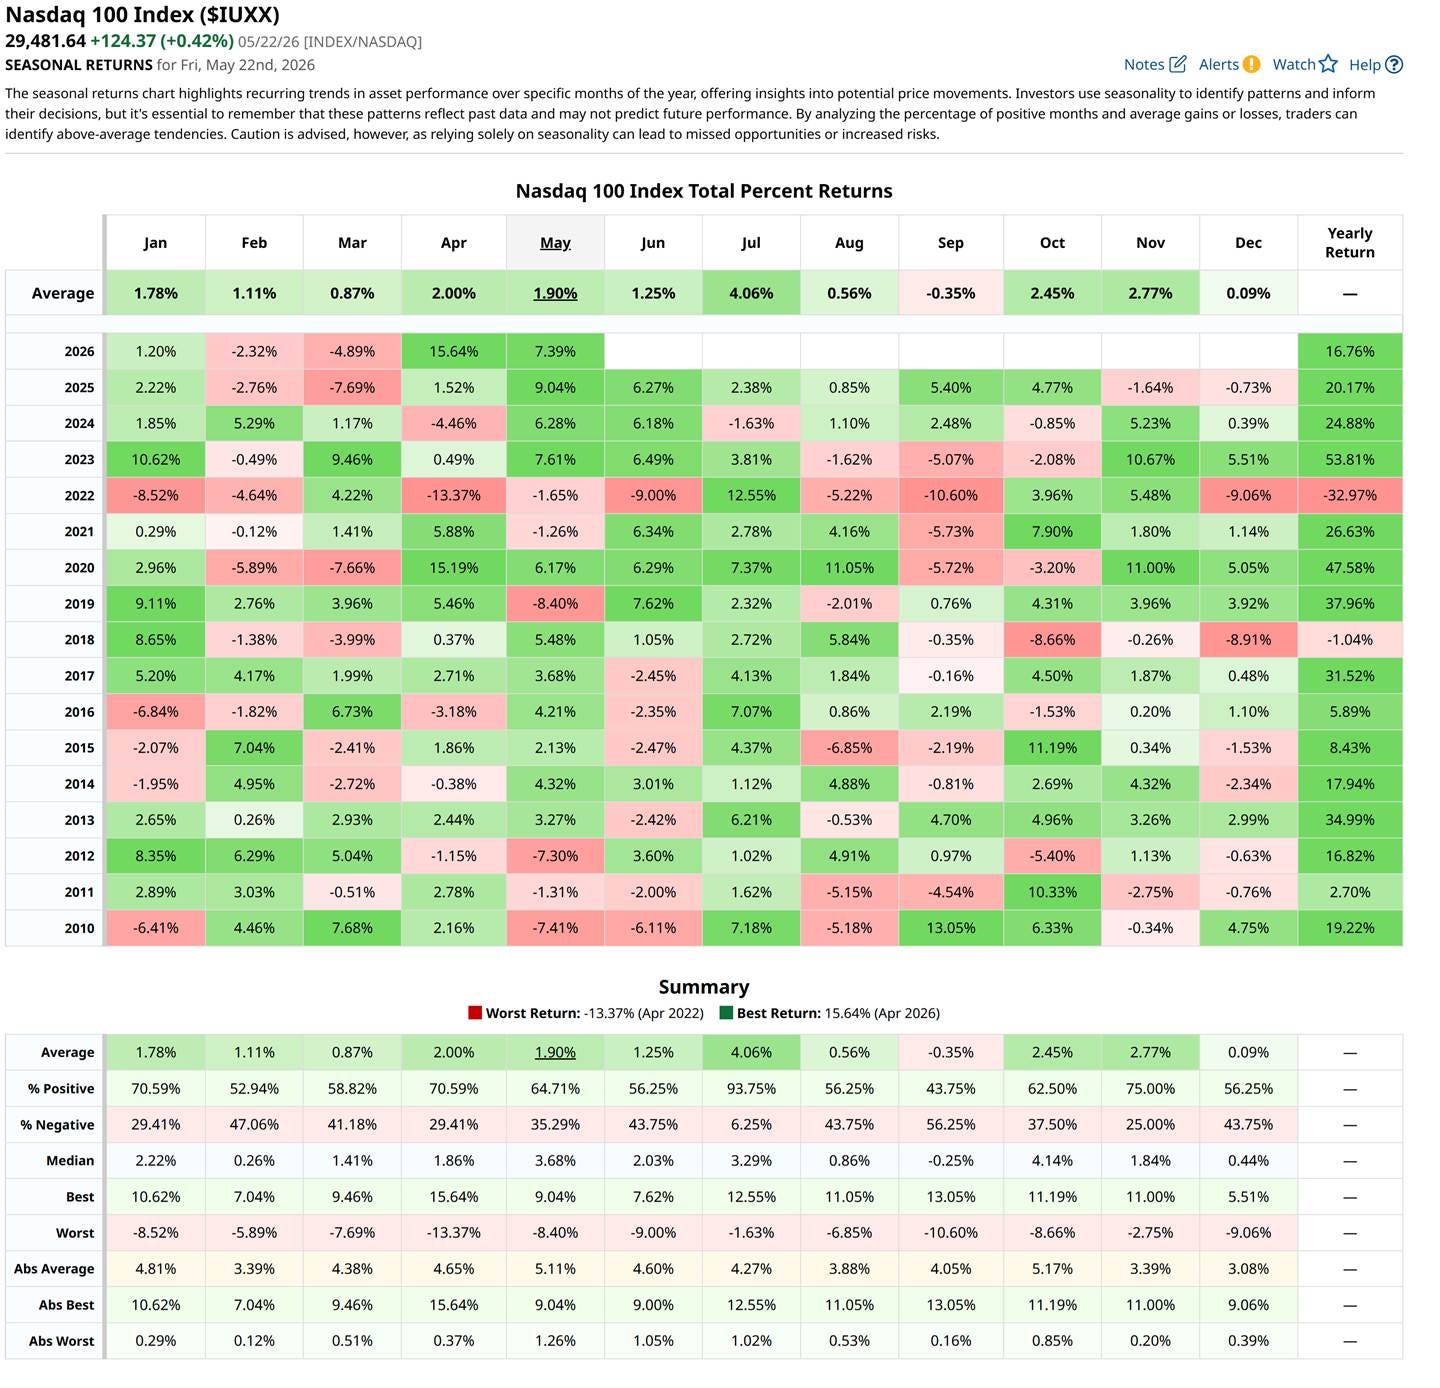
Seasonal-Returns-Matrix - Nasdaq 100 Index ($IUXX), Barchart.
(4) The Outlook
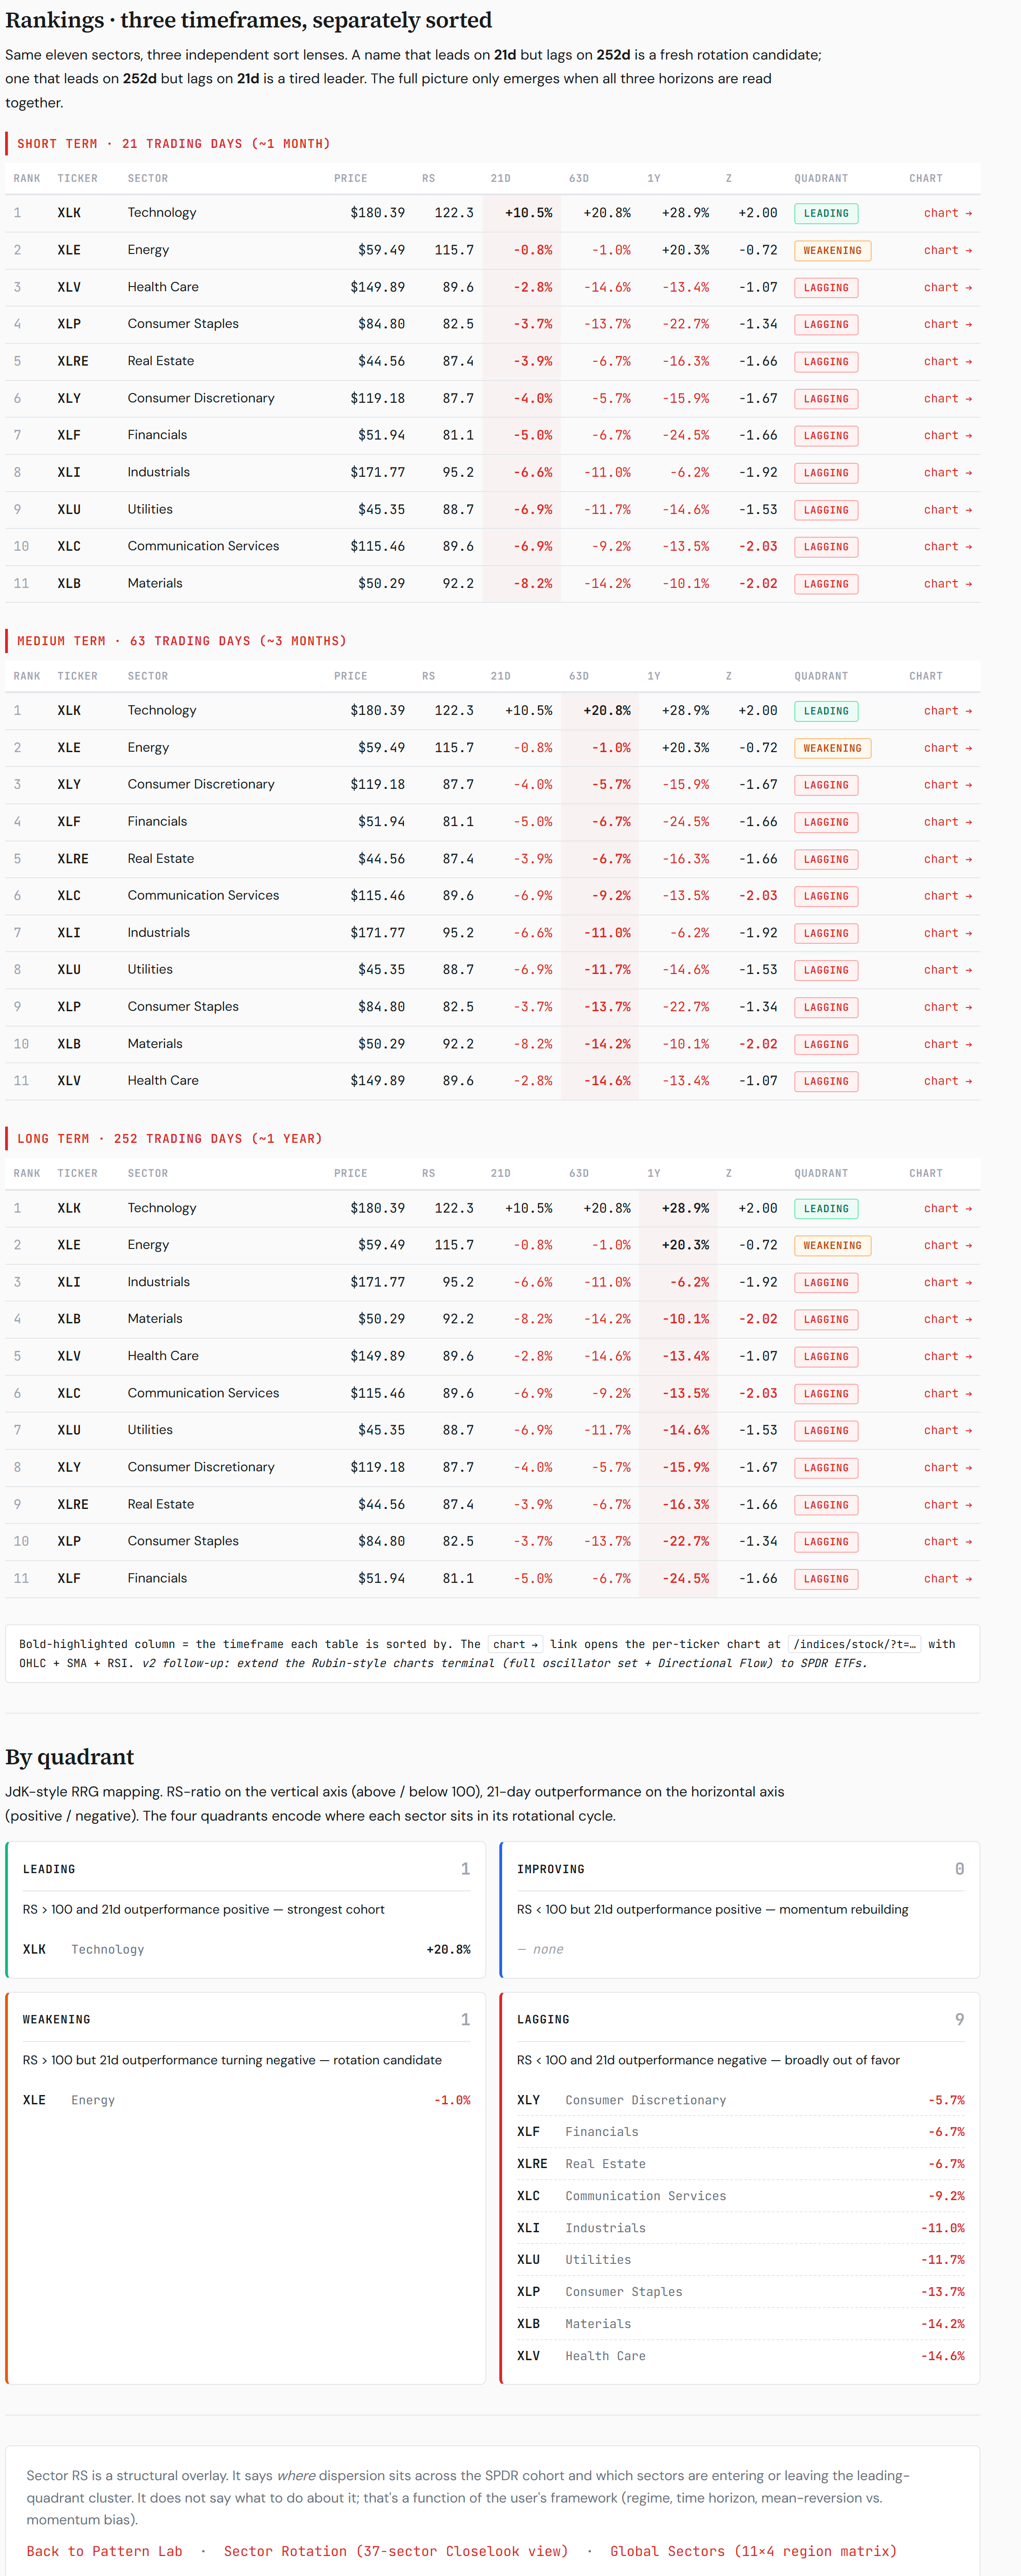
Forward Reads — Indices, Sectors, Thematics
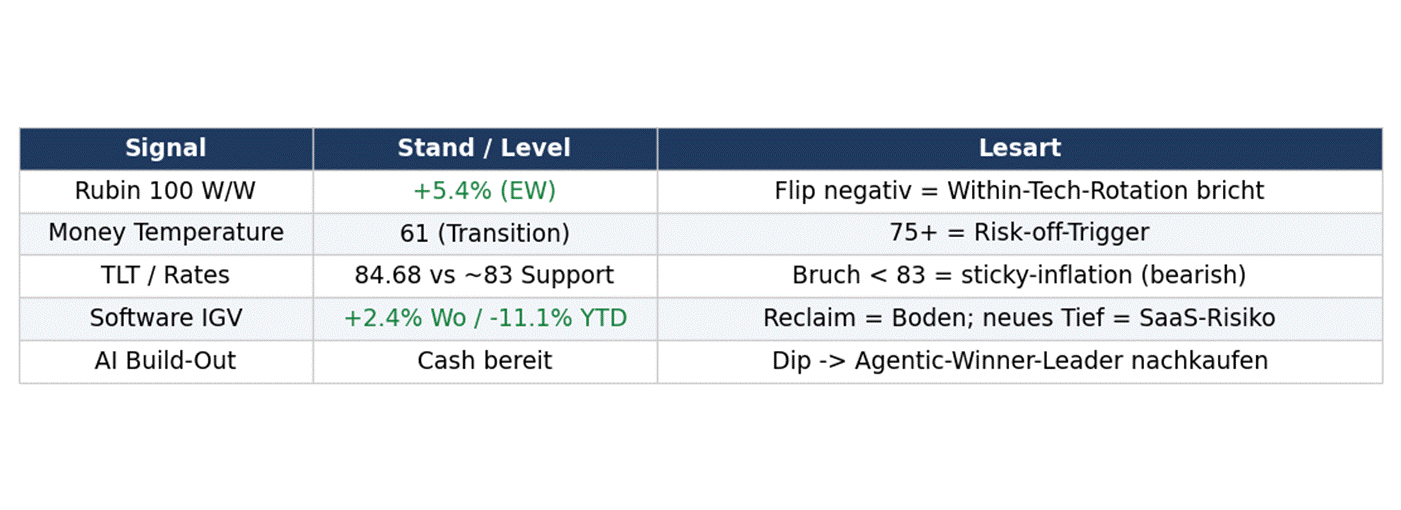
QQQ (+1.2% week) carries a modest edge over SPY (+0.9%), and the broadening signal — QQQE +3.5%, RSP +2.5%, IWM +2.7% — argues participation is widening into the tape.
Sector-wise, the bid was defensive-plus-rate-sensitive this week (Utilities +3.4%, Health Care +3.3%, Real Estate +3.1%), with Energy (+0.1%) and Materials (-0.0%) lagging.
(5) What May Lie Ahead: Macro Setup
On Friday, the equity-vol proxy eased (VIXY -5.6% on the week) while the dollar was flat (UUP +0.0%), long bonds firmed (TLT +1.2%), gold softened (GLD -0.8%), oil fell (USO-4.9%), and bitcoin slipped (IBIT -4.2%).
Bond volatility eased too, and a bid in long duration alongside softer gold reads as a mild duration-seeking tone rather than a clean risk-on impulse.
Macro Snapshot
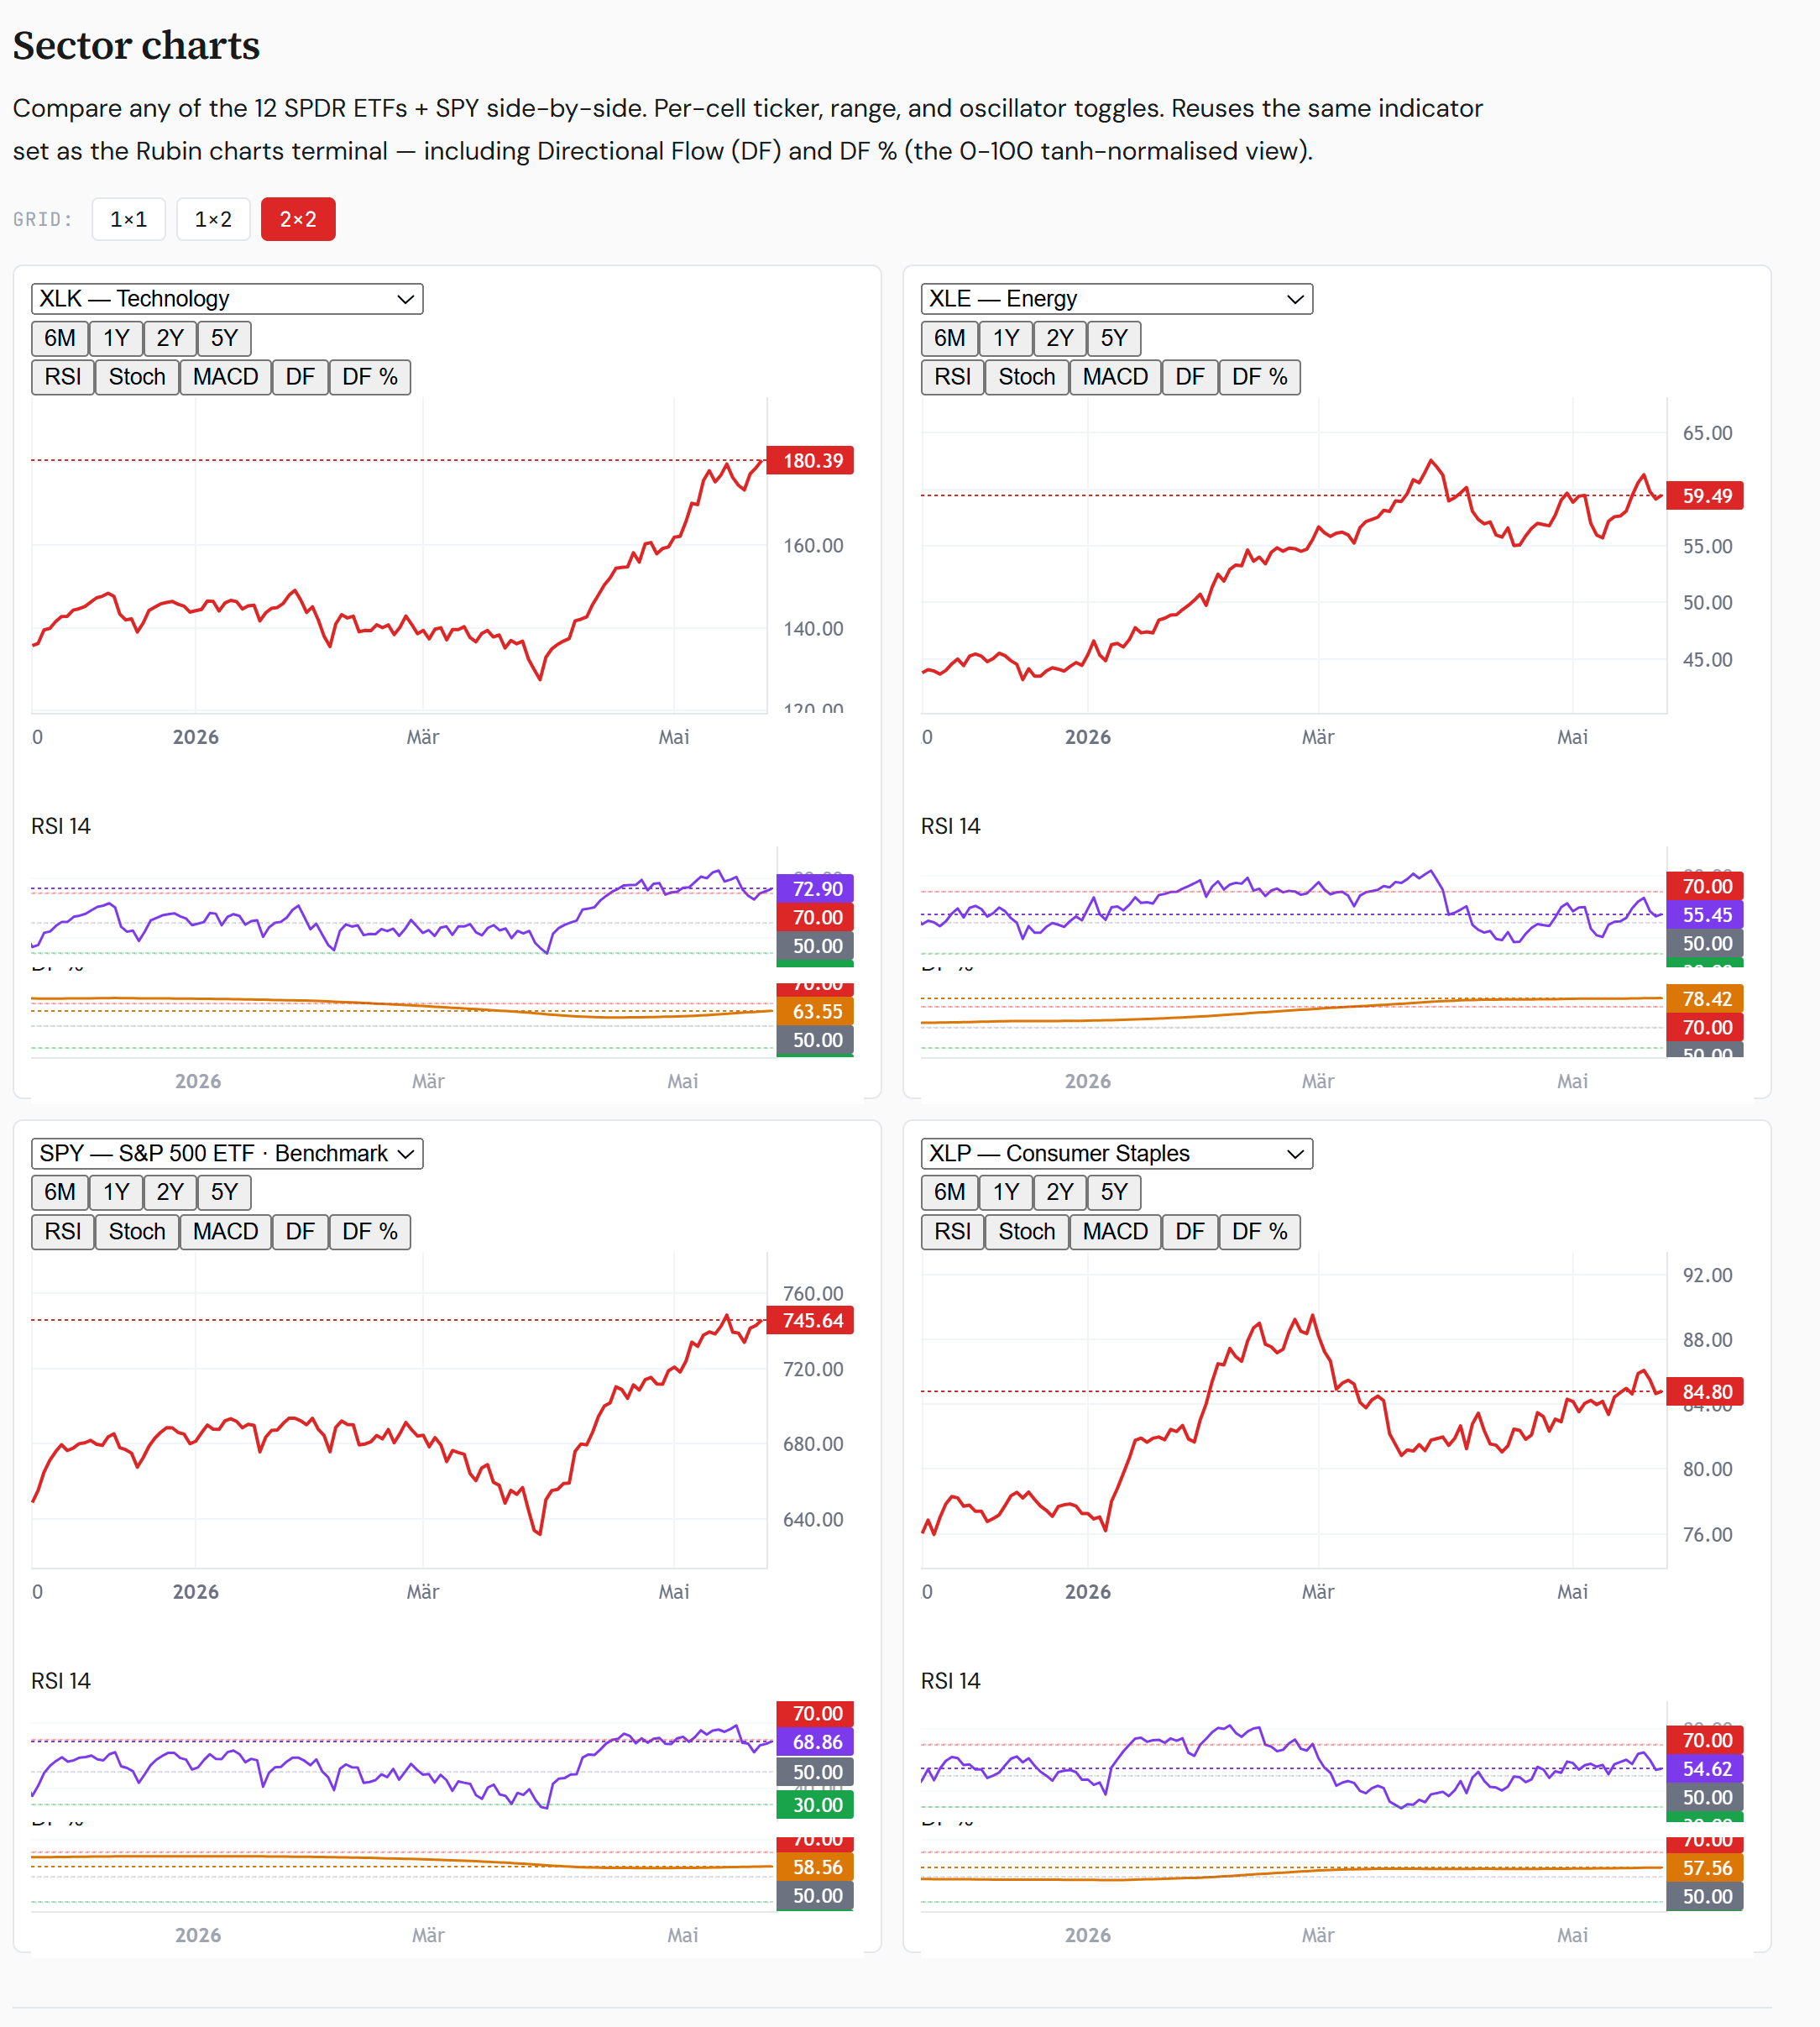
Macro snapshot (Friday ETF proxies), 2026-05-22.
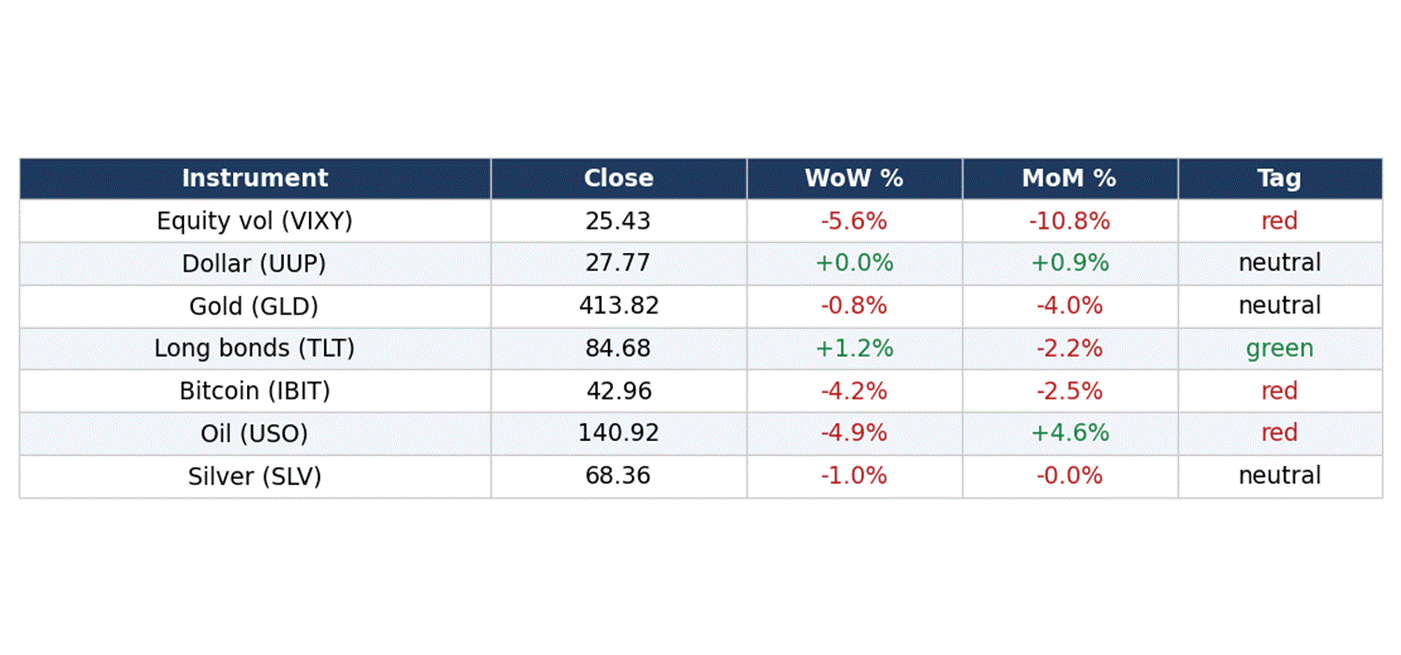
Watchlist — What Would Flip the Read
The signals we are watching into next week:
The Rates Pivot — TLT at Multi-Year Support
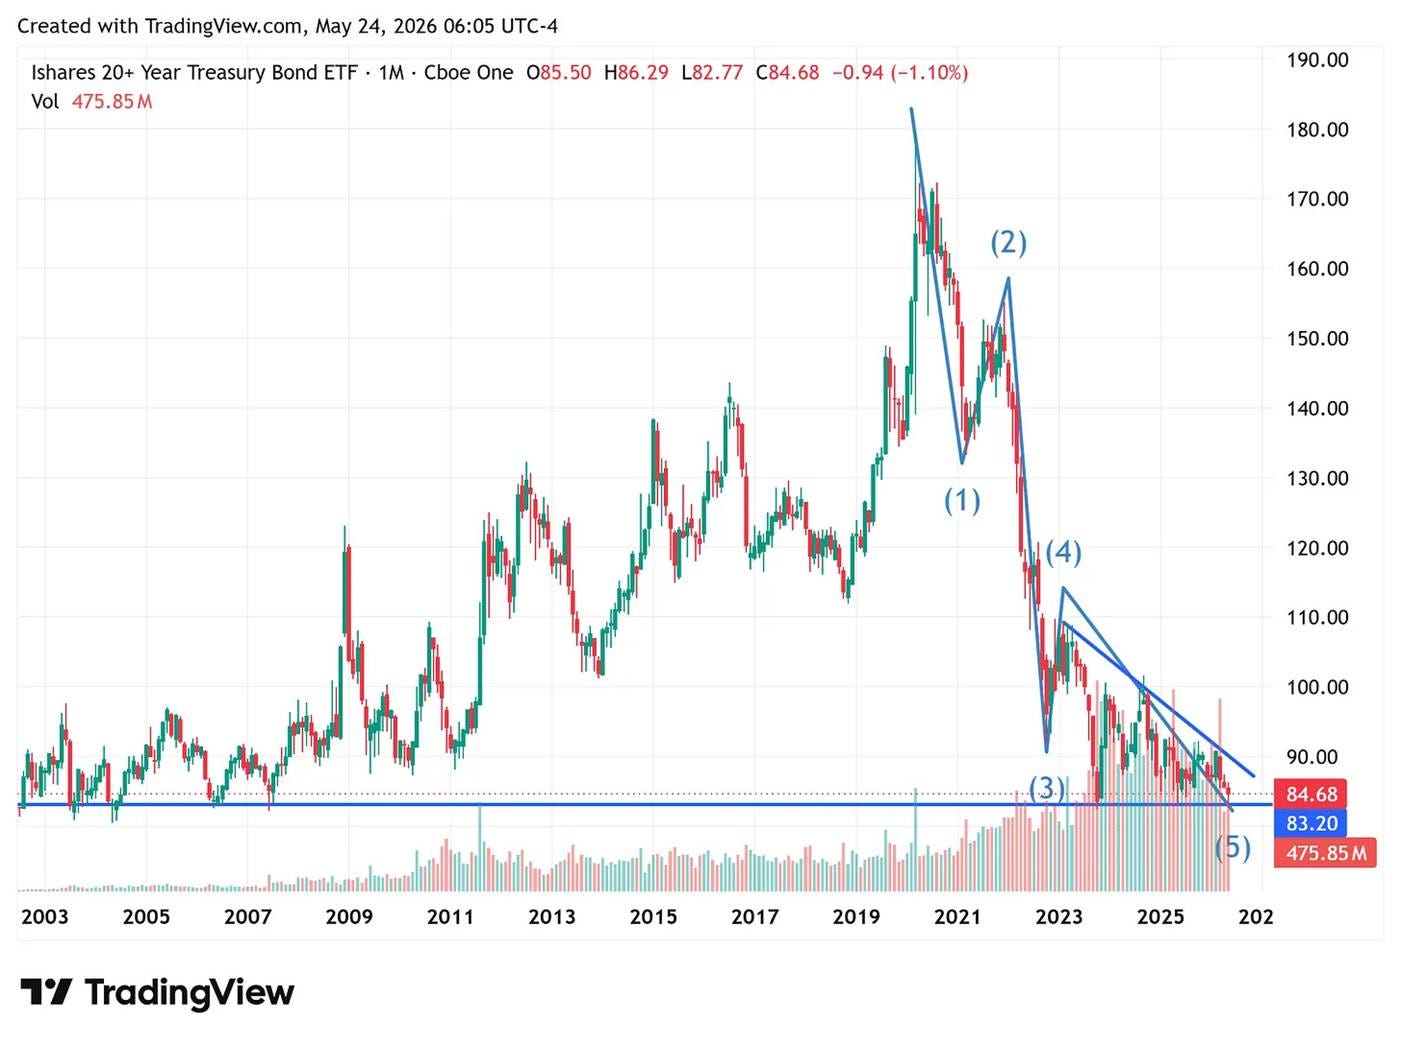
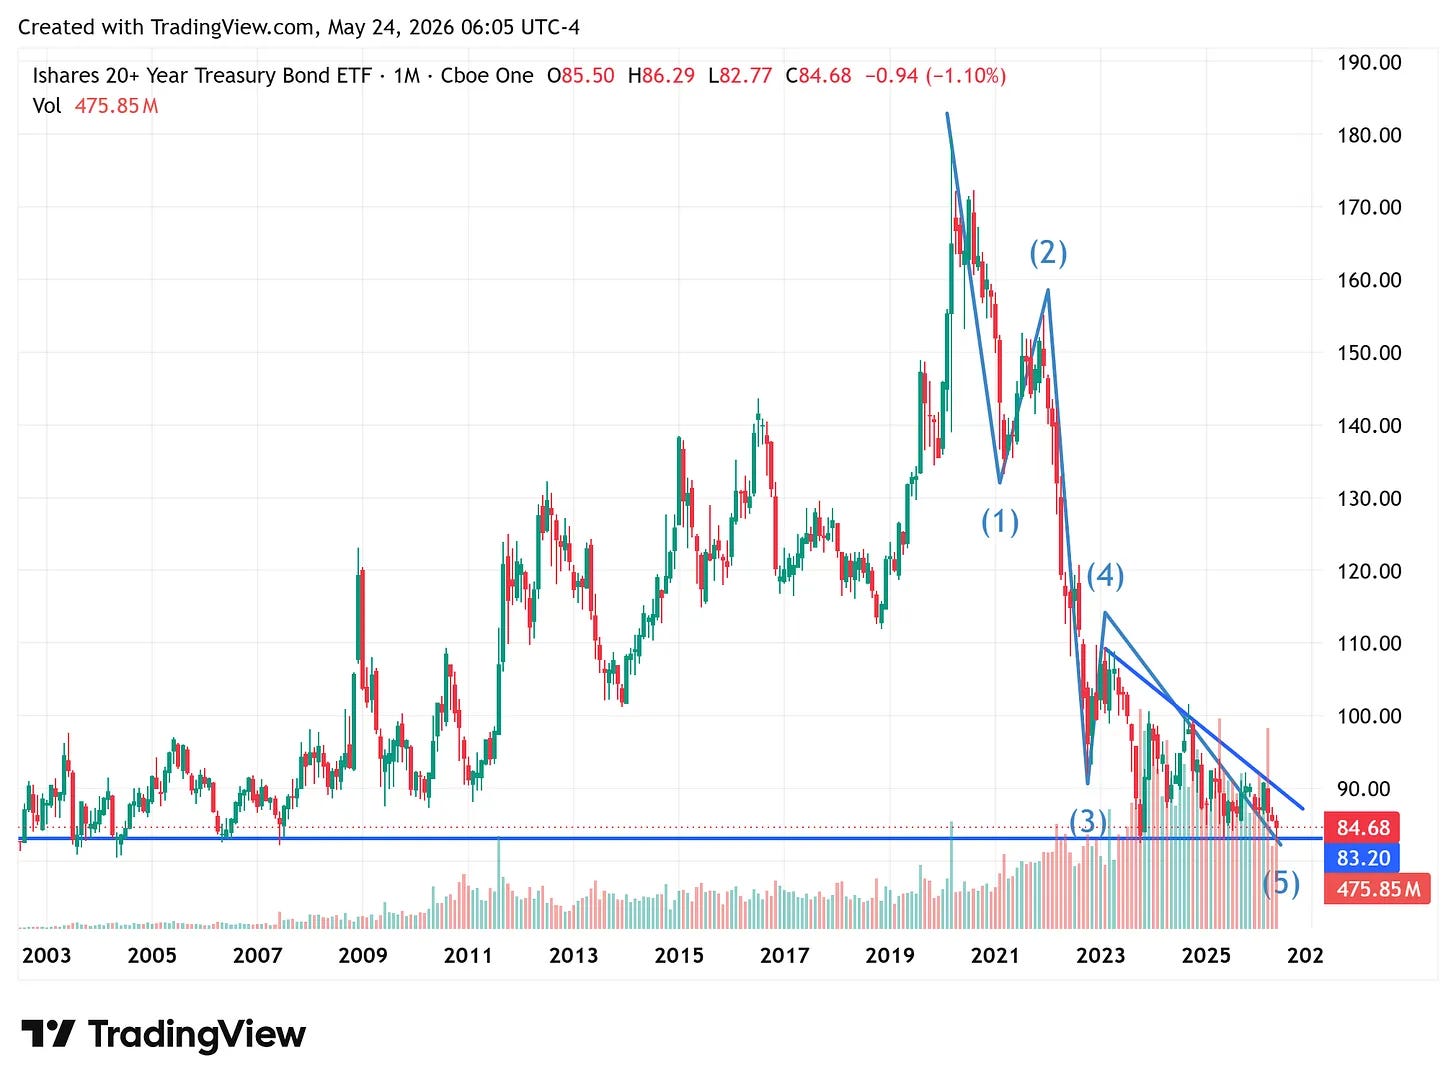
TLT (20+ year Treasuries) closed Friday at 84.68, above the multi-year support near 83 that has held since 2003.
On a monthly Elliott read, the decline from the 2020 high (~183) looks like a completed five-wave structure — which, if it holds, marks a major bottom in long-bond prices and a major top in long-end yields.
That is the bullish case: peak yields, a tailwind for duration, and a multiple-expansion tailwind for the AI-infrastructure trade.
The bearish mirror image is a decisive monthly break below ~83 — a new, structurally sticky-inflation regime, higher-for-longer. We lean to the former but stay wary; the 83 line is what settles it. [IMAGE 17]
TLT 20+yr Treasuries, monthly (TradingView) - 5-wave down, multi-year support ~83.
Central Bank Pulse
Fed: With Kevin Warsh now installed as chair, the next FOMC meeting is the focus — his framing on the rate path and disinflation progress is the key tell.
BoJ: Japan’s core inflation (ex-fresh-food) eased to 1.4% in April — its lowest since March 2022, below both the 1.7% consensus and March’s 1.8%.
Headline also slipped to 1.4% (from 1.5%), a fourth straight month under the BoJ’s 2% target; the ‘core-core’ rate (ex food and energy) fell to 1.9% from 2.4%, and energy dropped 3.9% (vs -5.7% in March) amid the Iran war. The softer print weakens the case for an early BoJ rate hike — yen-carry-supportive at the margin.
Macro Commentary
Inflation backdrop (our read, not official guidance): we view the 2026 inflation spike in the US — and a similar move in Europe — as largely transitory- and d war/energy-related rather than structural.
Set against the softening Japanese prints above, our interpretation is that the inflation impulse is cresting rather than entrenching — which, if correct, tilts the TLT/rates debate toward the bullish ‘yields topping’ scenario over the sticky-inflation one. This is an editorial opinion, not a central bank forecast.
(6) What May Lie Ahead: Technical Setup
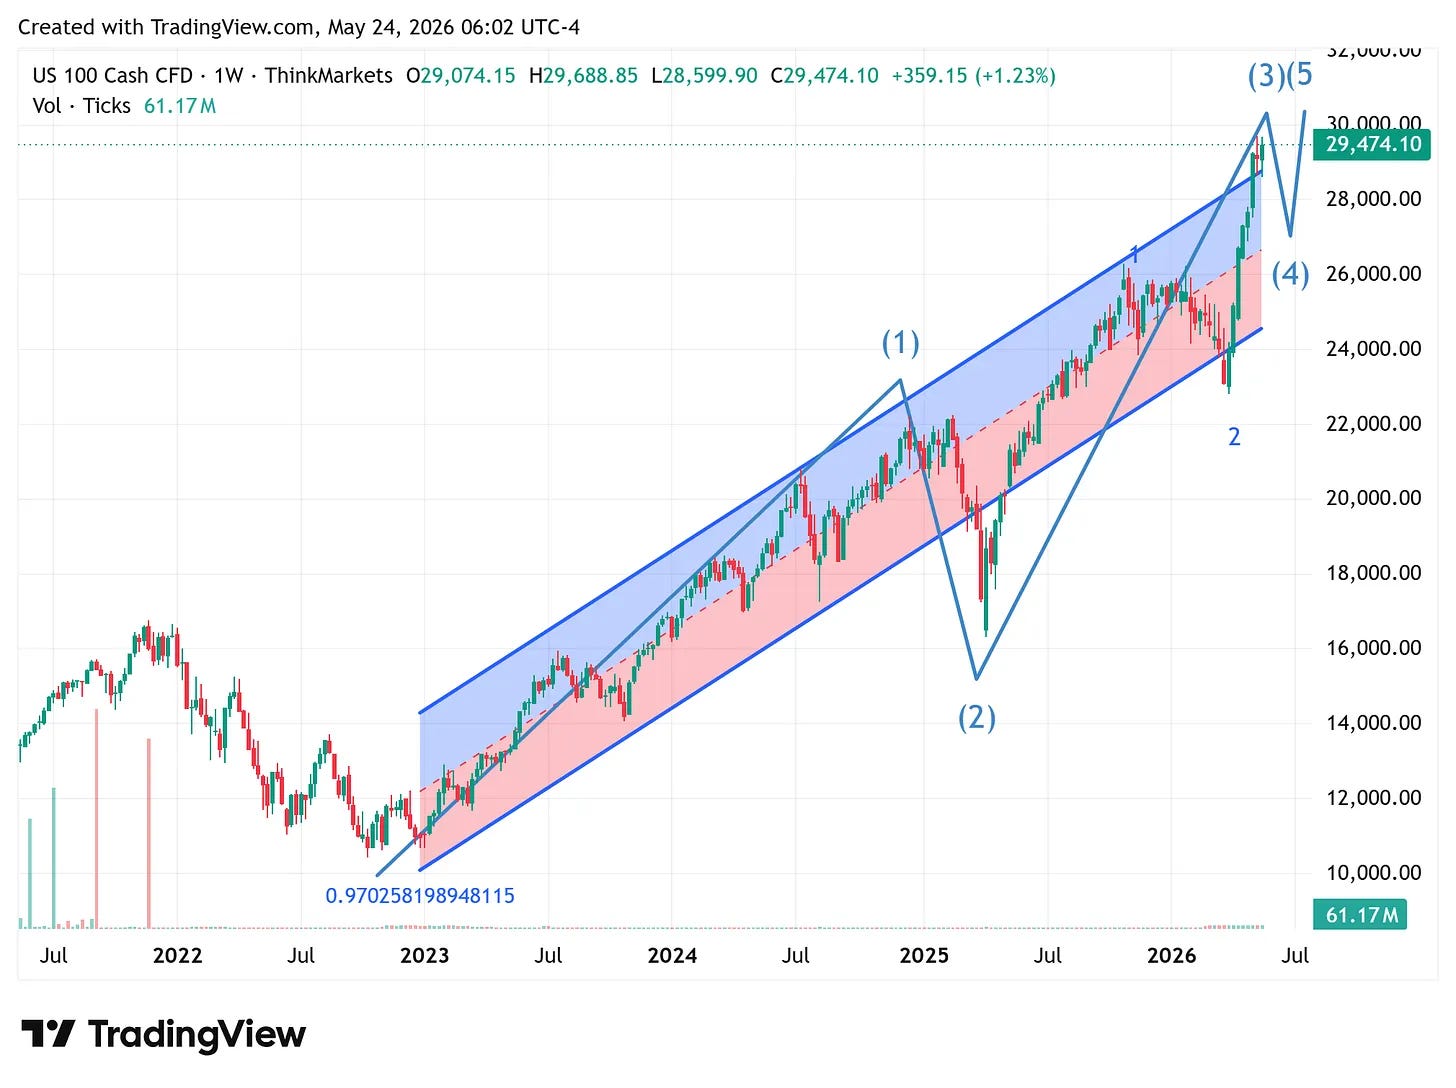
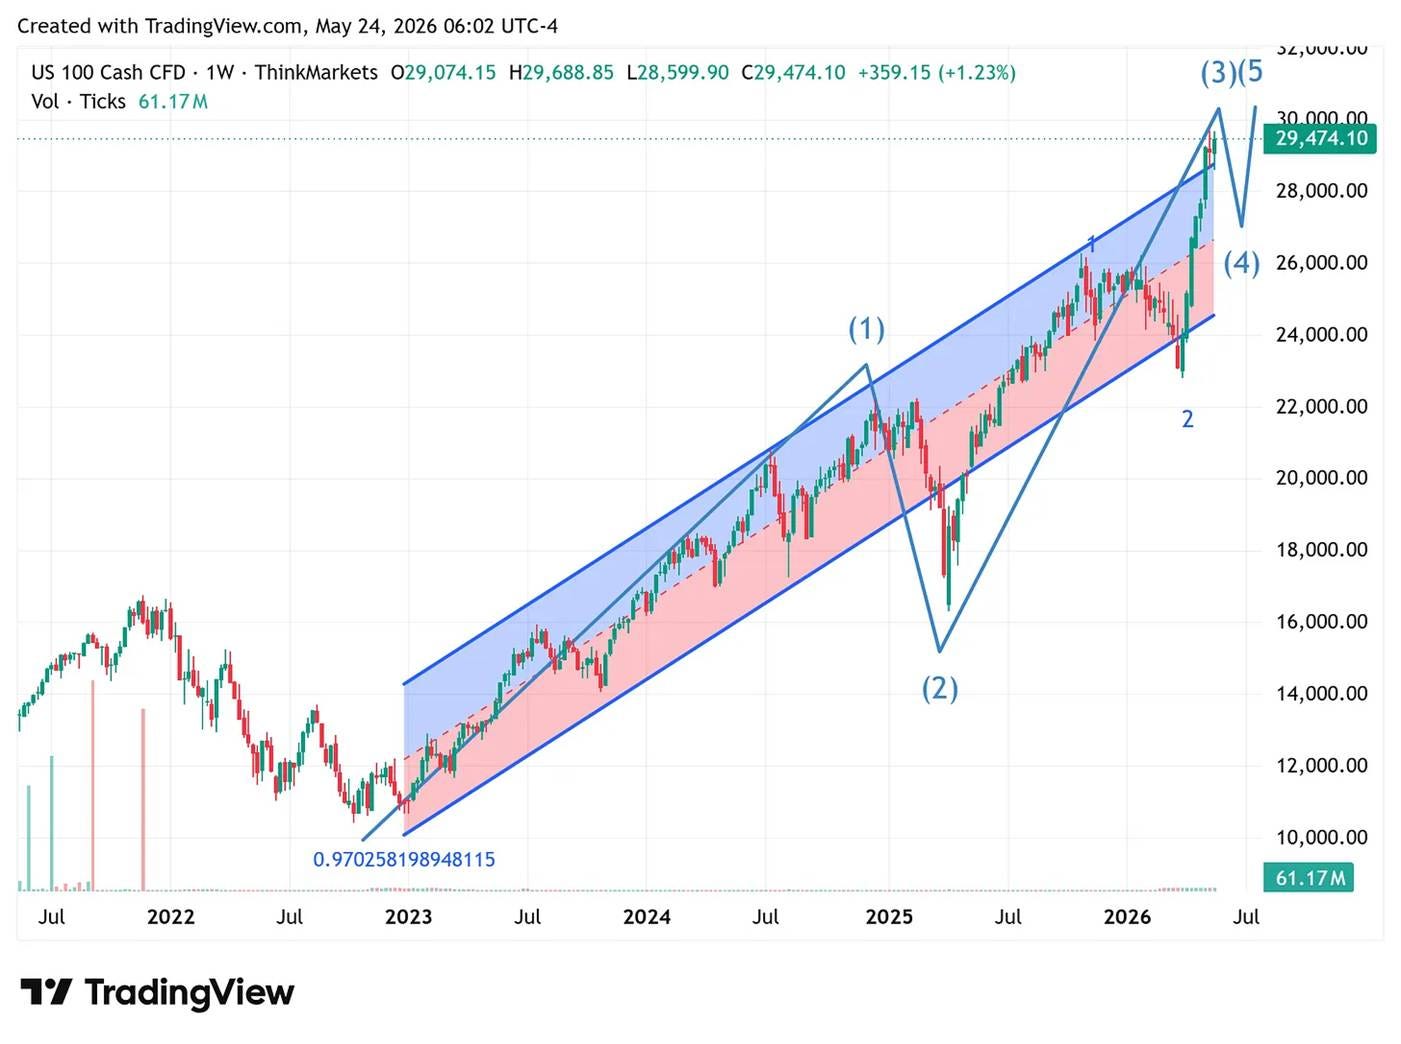
The weekly Nasdaq-100 closed near 29,474 (US 100 Cash CFD, +1.2% on the week) and continues to ride the multi-year ascending channel off the 2022-23 low.
The Technical Reading
On an Elliott-wave read, the Nasdaq-100 may be in wave 3 of 3 — the longest, strongest, next, and most persistent leg of the cycle, the heart of a bull market.
The roadmap from here would be a wave (4) consolidation toward the channel’s lower half (roughly 26,000-27,000) before a final wave (5) extension toward the channel top near 30,000+. A decisive weekly close back below the channel would put the count in question.
Nasdaq-100 weekly Elliott channel (TradingView) - possible wave 3 of 3.
Breadth Confirmation
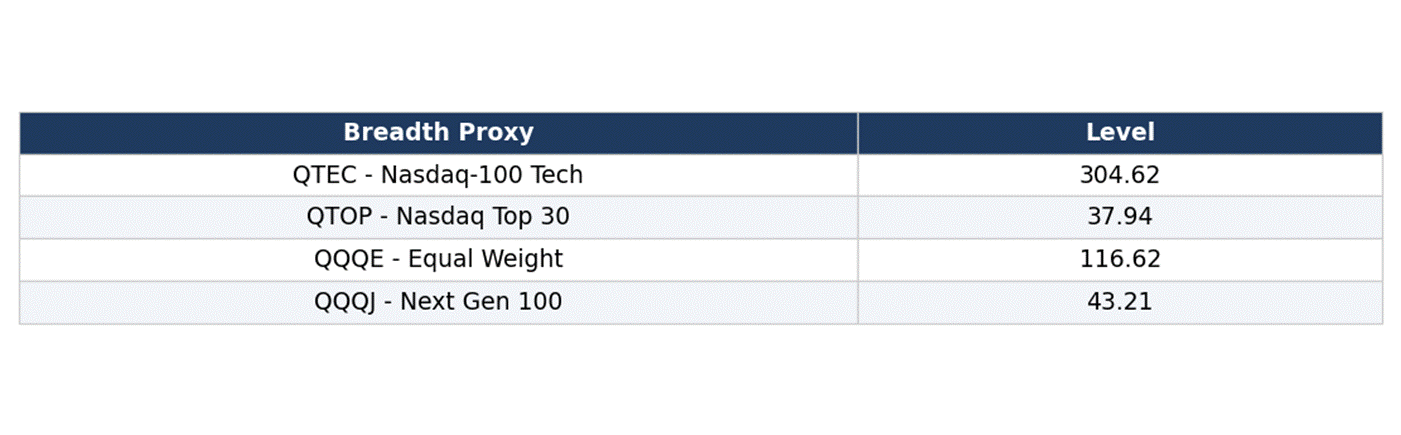
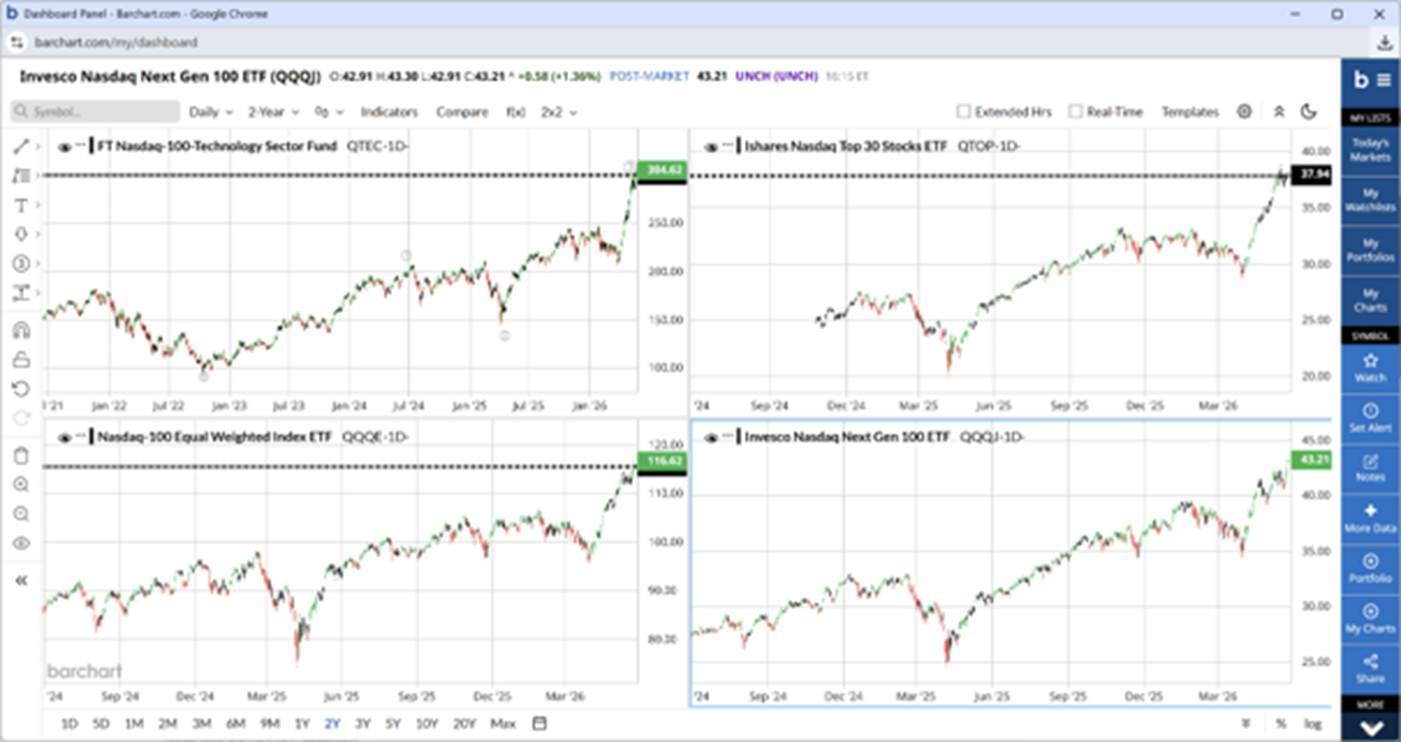
Breadth confirms the advance rather than contradicting it. Across the Nasdaq complex, the equal-weighted index (QQQE 116.62), the next-gen tier (QQQJ 43.21, +1.4%), the top-30 megacaps (QTOP 37.94), and the tech sub-index (QTEC 304.62) are all trading near highs — broad participation, not a narrow mega-cap melt-up. That is the kind of breadth that accompanies a third-wave impulse rather than a late-stage blow-off.
Nasdaq breadth proxies, 2026-05-22 (QTEC/QTOP/QQQE/QQQJ).
Breadth dashboard - bullish confirmation.
Alignment Check
Alignment check: Technical / Macro / Seasonality.
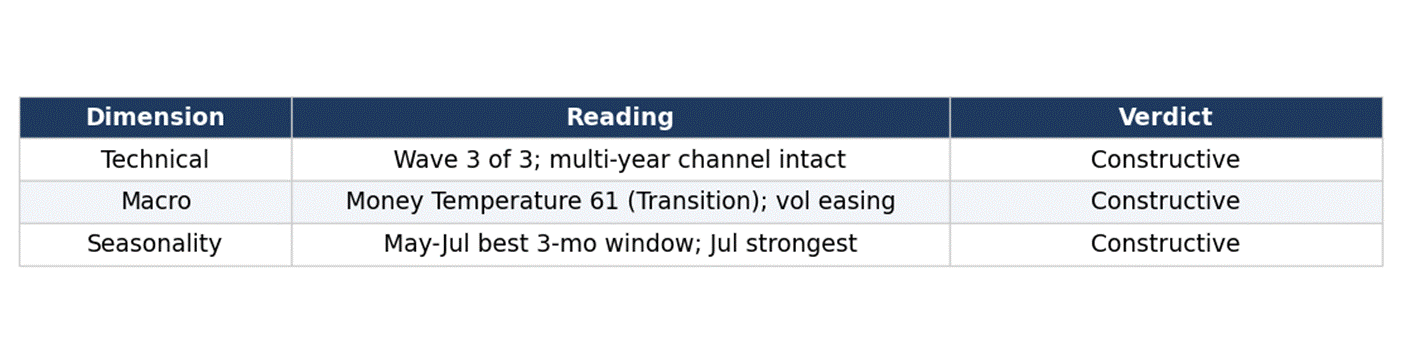
All three pillars line up constructively — technical (wave 3 of 3), macro (Temperature 61, vol ea, sing), and seasonality (May-Jul tailwind).
The read is a confluent bullish one; the risk-off trigger would be a Temperature spike or a decisive weekly break of the channel.
(7) The AI Build-Out Portfolio: What We Did
No transactions this week — the AI Build-Out book was unchanged. It stands at +34.56% YTD (33 positions; benchmark: QQQ; inception: 13 Feb 2026 at USD 500,000), structurally tilted upstream — lithography, memory, testing, foundry — with the layers as the broad underweights.
AI Build-Out
Multi-currency equity reference portfolio tracking the AI capital cycle — lithography, memory, testing, foundry, software, and healthcare AI.
Since inception+34.56%From Feb 13, 2026
Holdings 33; Benchmark QQQ, Currencies CHF · EUR · USD
Inception Feb 13, 2026, USD 500,000 starting capital
Thesis
The AI Build-Out Reference Portfolio implements Closelook’s Rubin Build-Out thesis in concrete positions. The structural bet: the next decade of technology growth runs on a capital cycle that starts at the lithography layer (ASML, Applied Materials), runs through memory (Samsung, Micron, SK Hynix), testing (Advantest, Teradyne), and foundry (TSMC), and only then reaches the software and application layers that most investors focus on.
Skin-in-the-game is held across all layers — the portfolio is not an infrastructure-only fund, but it’s structurally tilted toward the upstream layers that are most underweight.
Multi-currency exposure (USD, EUR, CHF) is deliberate — Europe has the only non-US pure-play lithography franchise, and Swiss industrials provide adjacent infrastructure plays without direct semiconductor concentration.
The portfolio holds roughly 30 positions, with sector caps to keep sector concentration in check rather than on a single name.
Rebalancing is event-driven rather than calendar-driven. Temperature regime shifts, Rubin sentinel trigger events (ASML/Advantest/Micron), and cross-asset cointegration breakdowns are the primary reasons positions move.
Top 10 Holdings by Weight
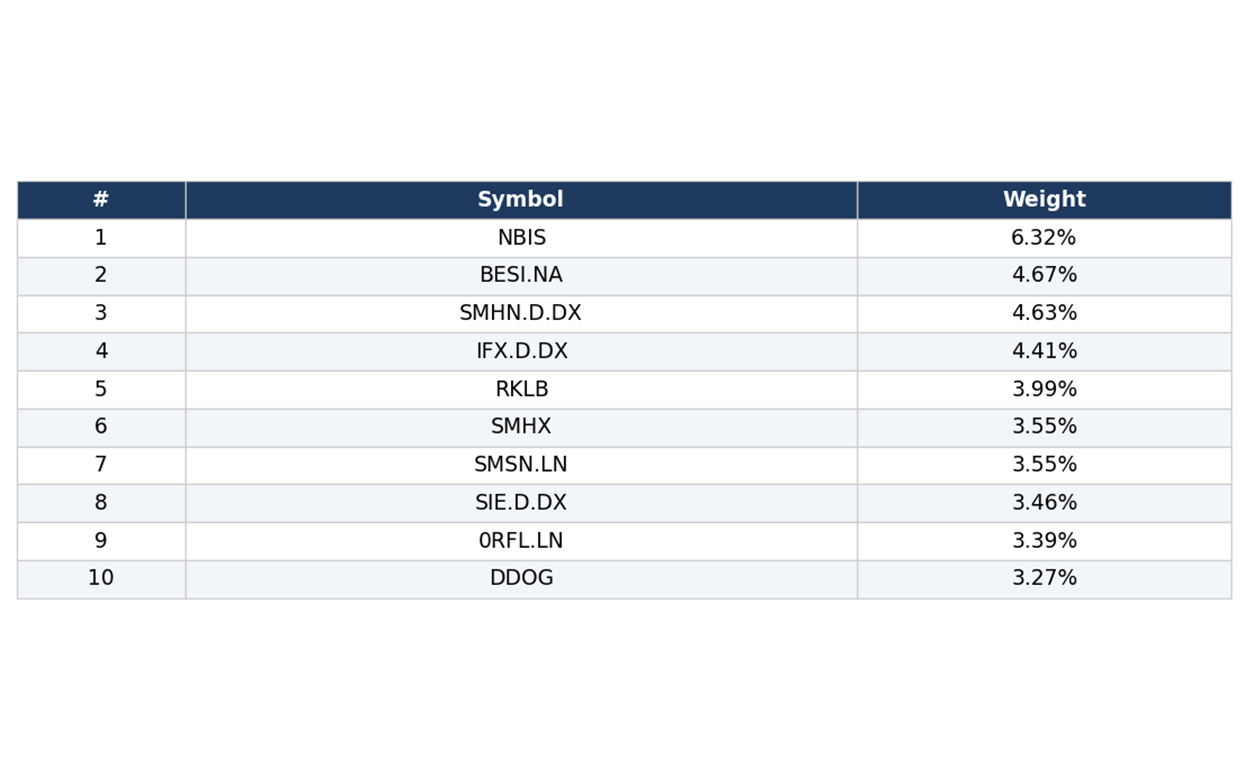
Full composition with per-position cost basis and P&L is C+ subscriber-only. Reference portfolio, not investment advice.
Systematic Sleeve - Rubin Sector Rotation
The active Rubin Sector Rotation sleeve (T3b sector-rank tilts, inception 1 May 2026) shows +91.81% YTD 2026 across 61 positions, benchmark Rubin EW. The signal has concentrated the book into the leading memory and substrate names - Kioxia tops the weights at 27.85% and Ibiden at 11.34% - the same memory leadership the index is flagging.
Rubin Sector Rotation - Top 10 by Weight
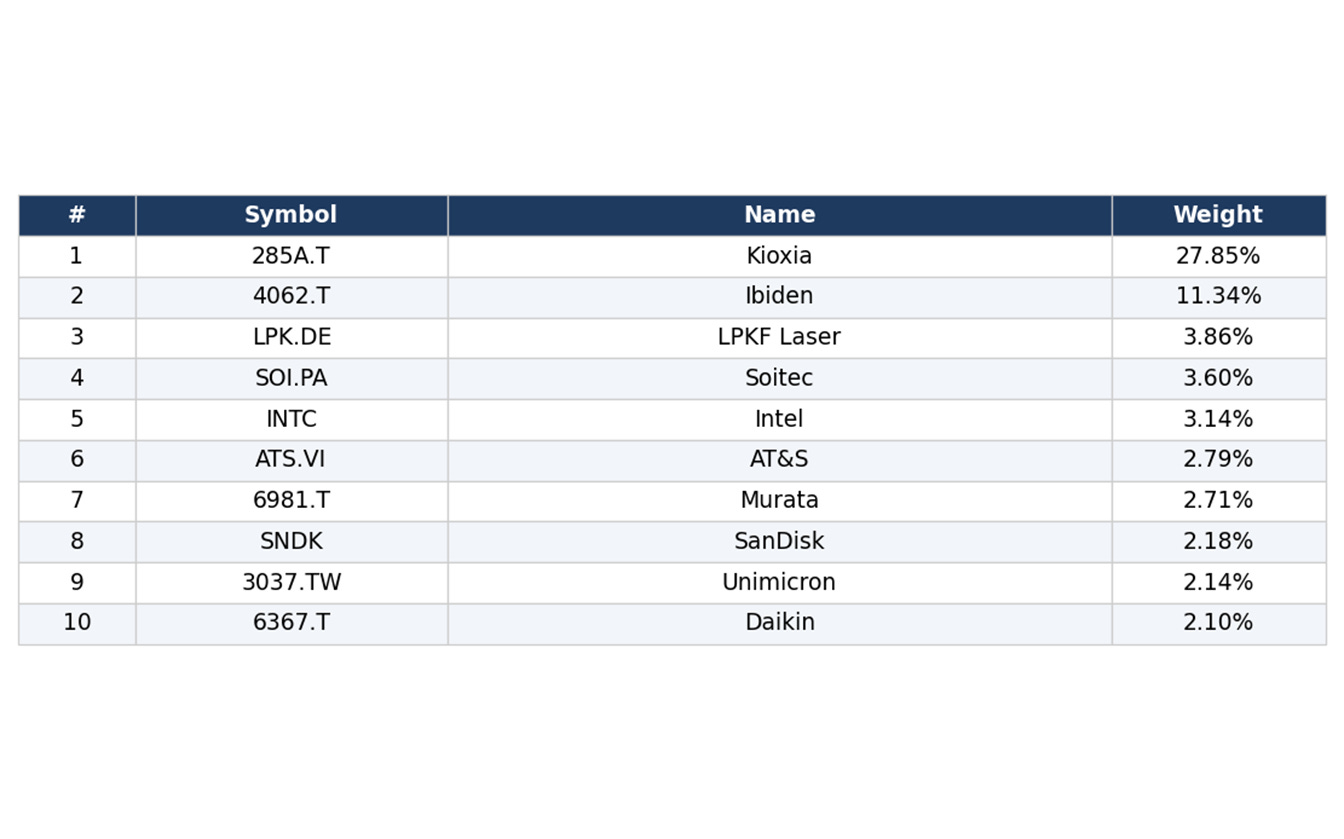
Full composition + per-position P&L is C+ subscriber-only. Reference portfolio, not investment advice.
Rubin Sector Rotation
Active sector-tilt portfolio driven by T3b top-sector-change signals—notional 500k USD.
Since inception +20.86%
Holdings 61, BenchmarkCL-RUBIN-EW
Currencies USD · EUR · TWD · HKD · CHF
Inception May 1, 2026, USD 500,000 starting capital
Thesis
Rubin Sector Rotation is the active counterpart to the two passive Rubin portfolios. It starts from an equal-weight base across all Rubin-Index sectors, then applies tilts based on the T3b sector-rank signal: top-3 sectors by 5-day mean return get 1.5× weight, rank 4–6 stay neutral, rank 7–end get 0.5×, and bottom-3 sectors go to zero. Rebalances fire on every top-3 or bottom-3 sector-rank-change event — event-driven, not calendar-driven.
Over time, er time the portfolio concentrates exposure in whatever is leading the Rubin universe and cuts what’s lagging, with a cooldown rule to prevent whipsaw.
See the Tape for the underlying T3b signal history. Expect more turnover than the passive variants and a return profile that reflects the T3b-signal quality — this is active management with a specific, reproducible rulebook.
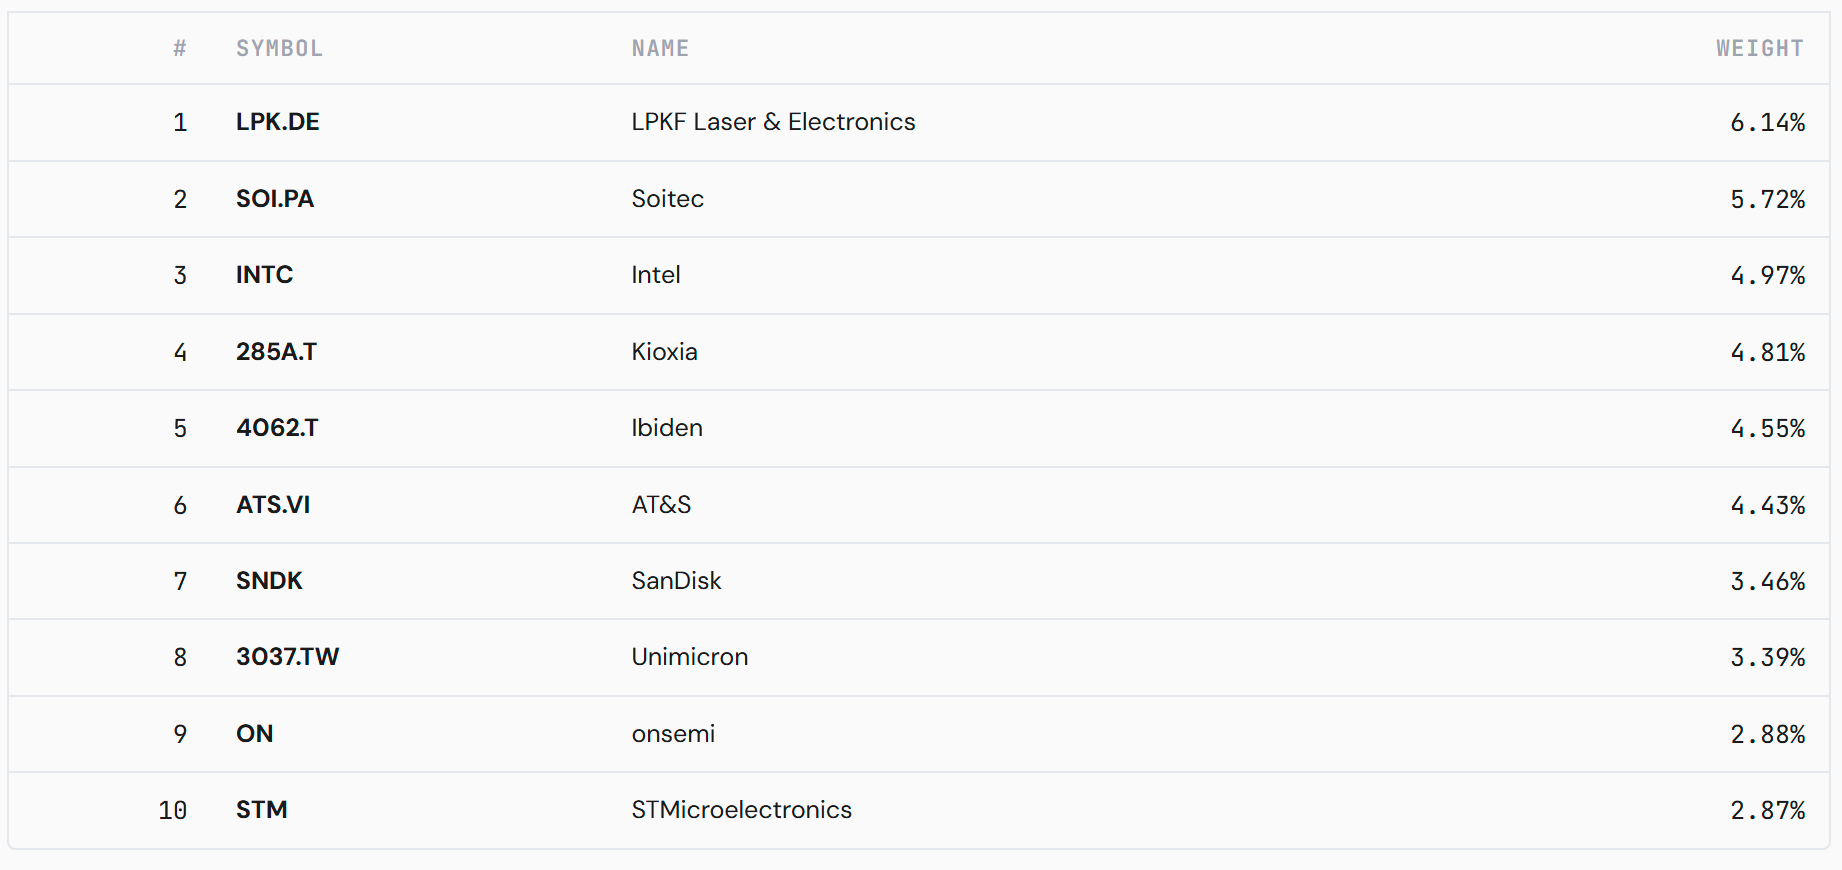
Top Holdings
61 total positions — top 10 by weight shown. Tracker portfolio — prices and constituents from the Rubin index worker.
(8) The AI Build-Out Portfolio: What We Plan To Do
Nothing is scheduled for next week. The plan is to stay put unless the tape hands us a dip - in which case we would add a bit, focused on the agentic-winner leaders Jensen Huang flagged in NVIDIA’s earnings call (see our posts on the topic).
Mechanically, rebalancing stays event-driven, not calendar-driven: positions move on Money-Temperature regime shifts, Rubin sentinel events (ASML / Advantest / M,icron), and cross-asset cointegration breakdowns. With Temperature at 61 (Transition) and Rubin still extending, the upstream tilt is intact.
(9) Knowledge Corner
This Week’s Topic: The Memory Wall - Why HBM Remains A Big AI Constraint
This week, the Memory / HBM layer led the Rubin Build-Out - the constraint layer asserting its pricing power. Here is the structural why.
The Memory Wall is the widening gap between AI compute capability and memory bandwidth. Every GPU generation demands more high-bandwidth memory: NVIDIA’s Blackwell uses 192GB of HBM3E per GPU, up from 80GB on Hopper, and Rubin will require HBM4. Model sizes are growing faster than bandwidth improves, so memory - not raw compute - becomes the binding constraint.
HBM is hard to make. It stacks multiple DRAM dies vertically using through-silicon vias, then bonds the stack to the GPU via advanced packaging. Yields run below standard,d DRAM and capacity expansion takes 12-18 months - so supply stays in deficit while AI demand compounds. That deficit is the pricing power.
The supply side is effectively a duopoly: SK Hynix (first to HBM3E and NVIDIA’s preferred supplier) and Micron, with Samsung leaning on yield.
Micron is a Closelook Sentinel Ticker - its quarterly HBM pricing, allocation, and margin commentary is the most reliable public read on AI memory demand. Samsung and SK Hynix are portfolio stocks.
When HBM pricing holds or rises, it confirms the AI build-out; when it softens, it is an early CapEx-cliff warning. Memory sits at Layer 2 of the Closelook 6-Layer model.
(10) Upcoming Transactions: Be Informed
Two ways to stay close to Closelook’s portfolio moves - one free, one premium.
Free Access
Follow our work at no cost.
· LinkedIn Newsletter (Closelook@US Stock Markets)
· closelook.net - Free tier
Subscribe -> closelook.net/subscribe
Coming Soon - Paid
Real-time transaction alerts before they happen.
· Push notifications on portfolio moves
· C+ Premium Substack section
Join waitlist -> closelook.net/c-plus
(11) What May Go Wrong: Risk & Change Triggers
The falsification test: what would invalidate Sections 3, 5, and 6 - and how we would know.
(1) TLT
(2) Oil
x
(3) Nasdaq 100 and the AI Trade
The falsification test: what would invalidate Sections 3, 5, and 6 — and how we would know.
Macro Change Triggers
Rates regime — a decisive monthly TLT close below ~83 (multi-year support) would flag a sticky-inflation, higher-for-longer regime: bearish for duration and for the multiple-expansion leg of the AI trade. Holding above 83 keeps the completed five-wave / yields-topping read intact.
Software-Specific Triggers
At the index level, software flips on IGV: a reclaim of its YTD downtrend would confirm a bottoming software complex, while a fresh leg lower (IGV is -11.1% YTD, +2.4% on the week) keeps the SaaS-risk case alive.
On the single names, the levels to watch into next week: ServiceNow needs to hold its Friday 102.13 and build on the +7.4% week to validate the bounce; IBM at 253.84 (+15.8% week) is the relative-strength leader, and a failure to hold would be the first crack; Salesforce 180.07 and Palantir 136.88 are the deep-YTD laggards (-31.9% and -23.0%), where a fresh low confirms the SaaS-risk case. Oracle 192.08 (roughly flat YTD) is the complex’s anchor.
Technical Invalidation Levels
On the weekly Nasdaq-100 (29,481.64, +1.2% on the week), a decisive close back below the multi-year ascending channel would invalidate the wave-3 read; until then, the structure stays intact.
The wave-(4) roadmap targets the channel’s lower half near 26,000-27,000 — a clean break of that zone, not a touch of it, is what would put the count in question.
Indicator Shift Triggers
Rubin Build-Out W/W flipping negative while QQQ continues higher would break the within-tech rotation read. Currently, Rubin is +5.4% on the week (equal-weighted), so the trigger is not active.
(12) Final Words
The within-tech rotation read held again this week: the Rubin Build-Out tracked roughly 6x the Nasdaq-100 proxy year-to-date (around 100% equal-weight vs QQQ around 17%), semis extended, and breadth widened rather than narrowed.
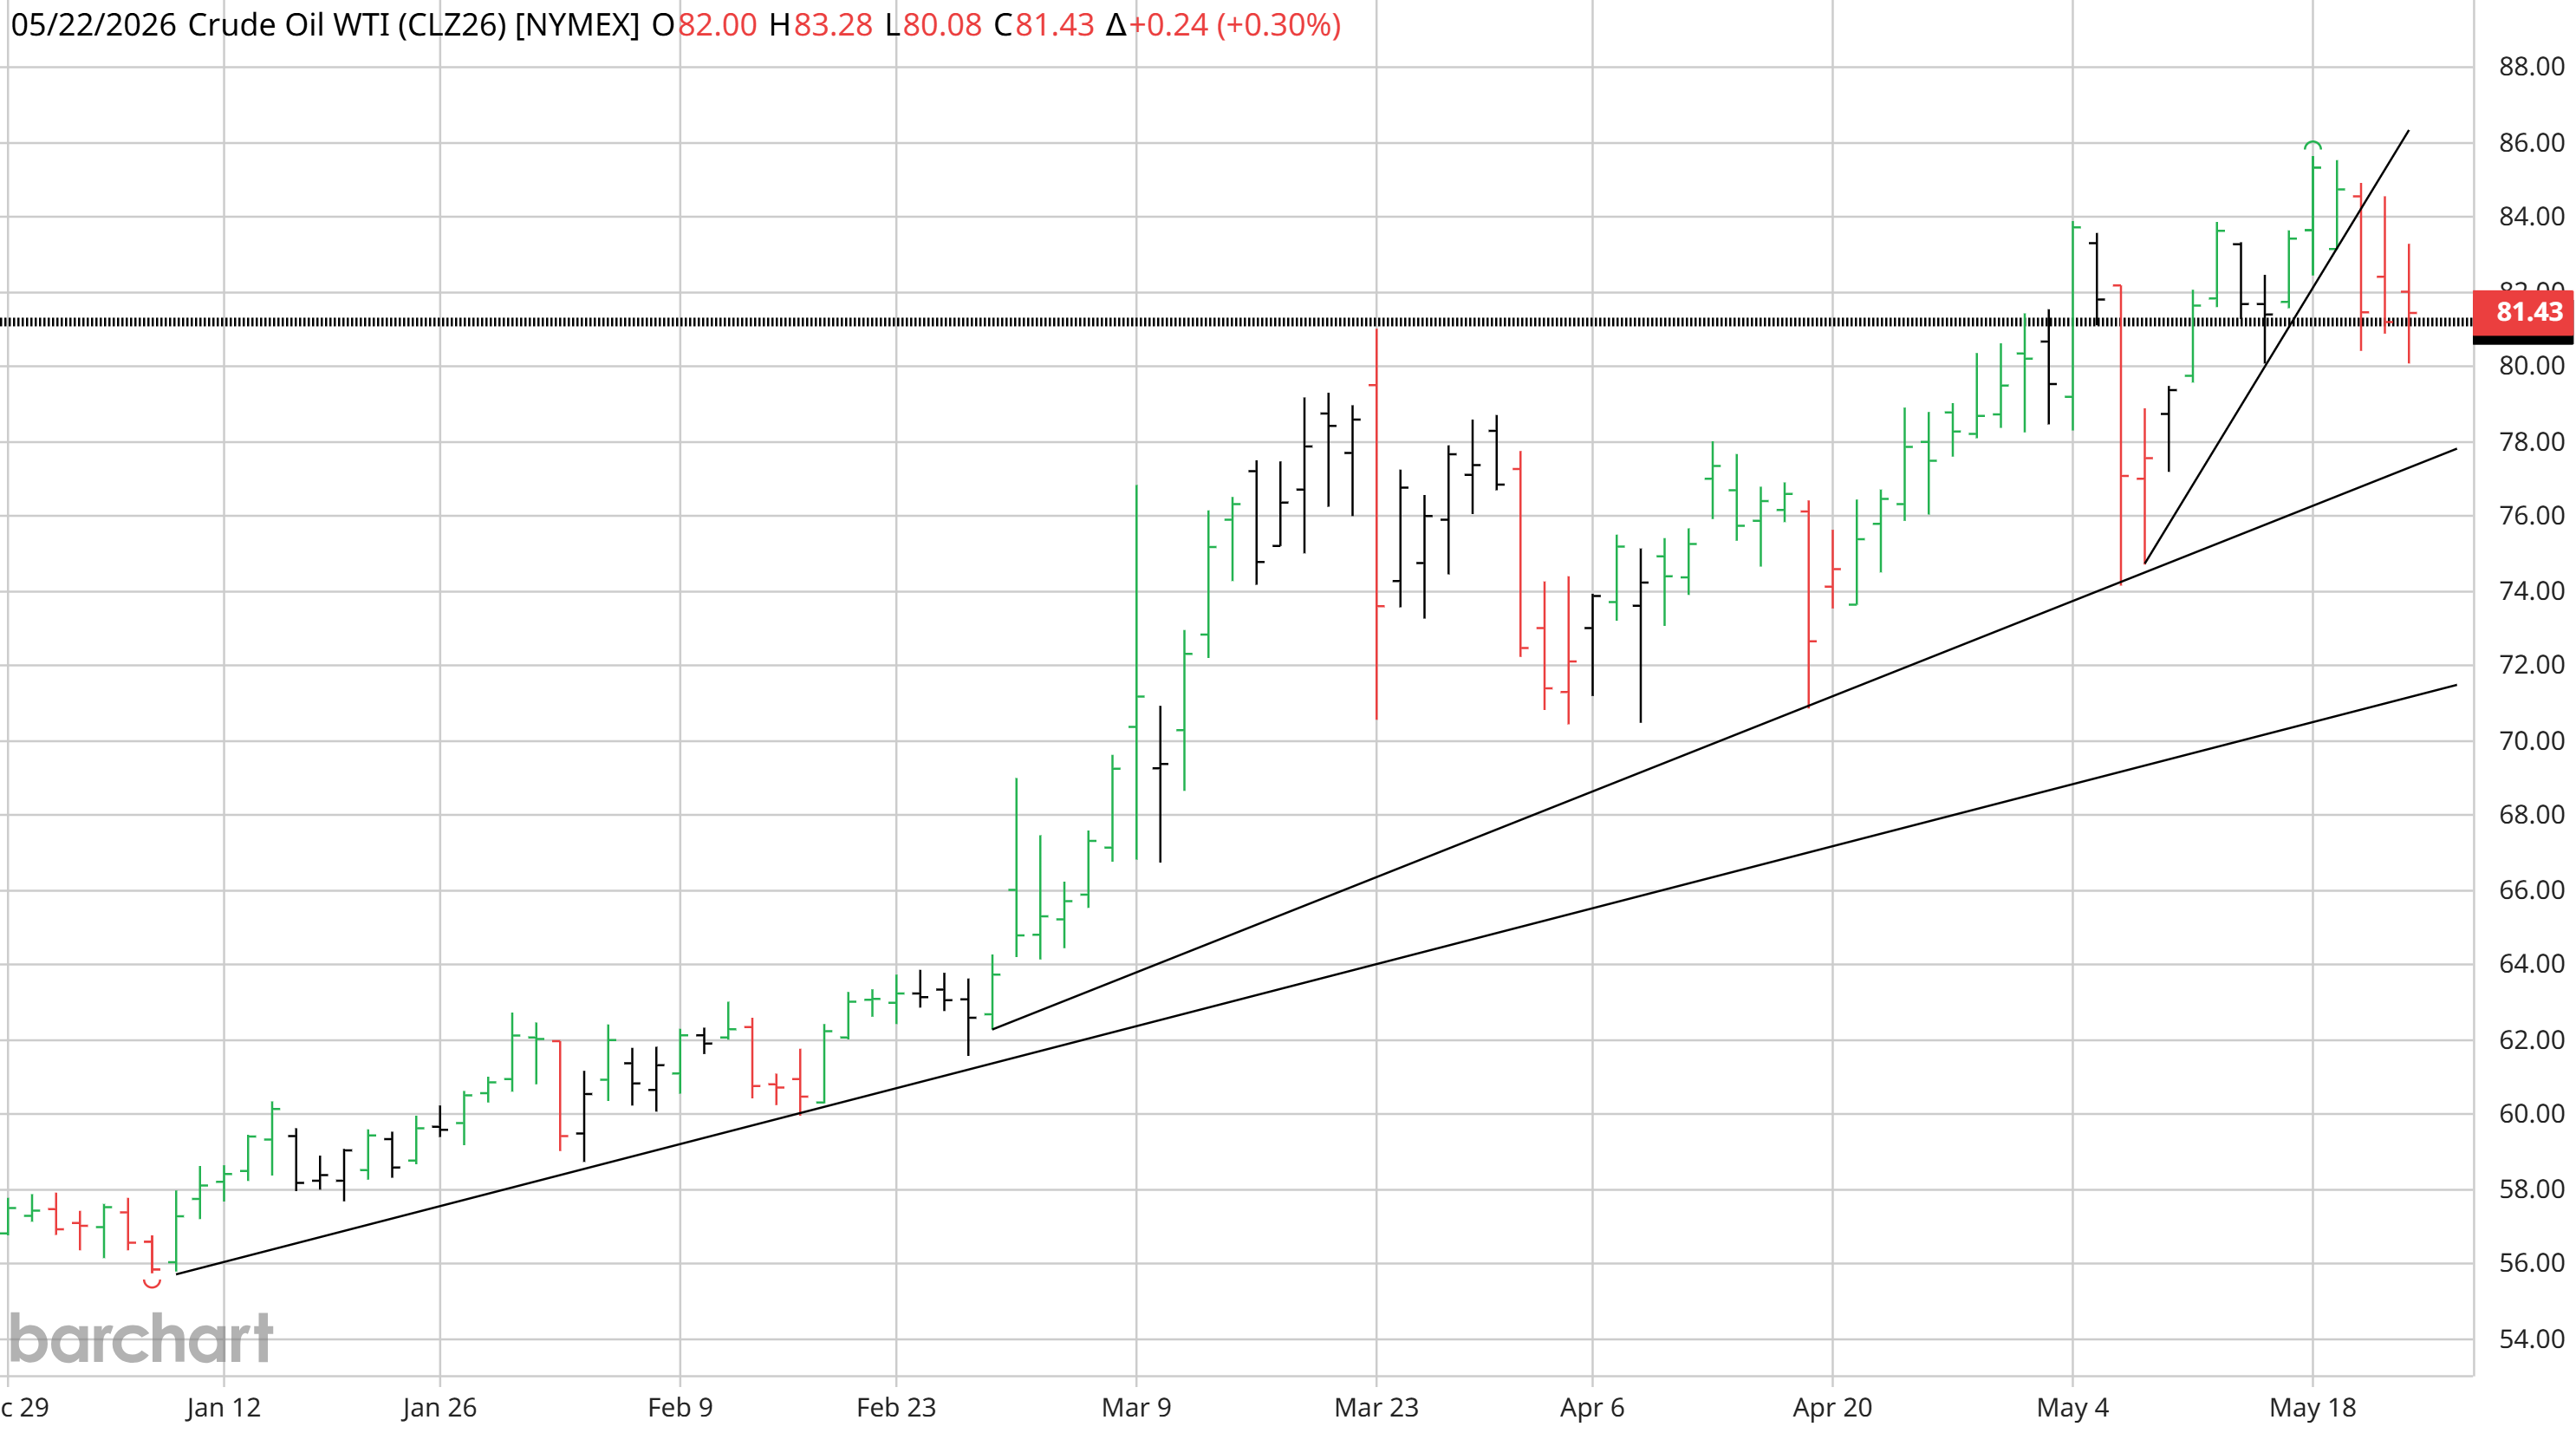
Stay close. Look beyond. For next week: At TLT and December oil specifically
Thank you for reading. See you next Sunday.
Annex - Further Reading at Closelook
Suggested navigation across Closelook’s own work.
This Week on the Pulse
Rubin surges as vol complex splits and Europe extends gains - Daily Pulse, 22 May (closelook.net/pulse/2026-05-22-rubin-surges-vol-splits-europe)
Layer-1 chips surge as Europe and US futures fade - Daily Pulse, 21 May (closelook.net/pulse/2026-05-21-layer1-chips-surge-futures-fade)
Narrow tape: Rubin leads as broad market softens - Daily Pulse, 20 May (closelook.net/pulse/2026-05-20-narrow-tape-rubin-leads-broad-market-softens)
Indices & Frameworks
Rubin Build-Out 100 - 100 stocks, 18 sectors, AI infrastructure (closelook.net/indices/rubin)
HALO Growth 100 - Physical-world growth, AI-safe sectors (closelook.net/indices/halo)
Euro-AI Sovereign 50 - European AI sovereignty play (closelook.net/indices/euro-ai)
Agentic Winners 25 - Tactical agentic infrastructure index (closelook.net/indices/aw25)
Money Temperature - 8-instrument macro regime scoring (closelook.net/lab/temperature)
Cointegration Monitor - Engle-Granger pairs + cascade tracker (closelook.net/lab/cointegration)
ABR Framework - Agent Beneficiary Ratio for AI disruption (closelook.net/indices/abr)
Portfolios
Global ETFs - ex-US regional + sector ETF portfolio (closelook.net/portfolios/global-etfs)
AI Build-Out - Rubin-index-aligned single-stock portfolio (closelook.net/portfolios/ai-buildout) (this newsletter)
Hypergrowth - 16 AI-native names + covered-calls layer (closelook.net/portfolios/hypergrowth)
Global Tech 50 - Non-US tech, passive long-horizon (closelook.net/portfolios/global-tech-50)
Derivatives - Covered calls, cash-secured puts overlay (closelook.net/portfolios/derivatives)
Editorial
Weekly Signal - 9-dimensional market regime scorecard (closelook.net/weekly)
Daily Pulse - Daily market notes archive (closelook.net/pulse)
Research Dossiers - Deep-dive reports (closelook.net/reports)
Closelook 101 - Concepts, frameworks, methodology (closelook.net/101)
Glossary - Terms, definitions (closelook.net/glossary)
Publishing Schedule
.