


The chip fund fell 11.8%, software 7.4%, CrowdStrike 17.3%, Oracle 9.3%; the Nasdaq 100 fund lost 5.5% and closed under the rising line that had held since the 30 March low. Underneath, seven of eleven sectors rose — consumer staples +5.0% to their best close since March, health care +3.5% after a one-year high on Thursday, energy +4.9%. The equal-weight S&P rose, the Nasdaq without its tech stocks rose for a second week, and the ten-year yield fell to 5.10% despite hot inflation numbers. Money did not leave the market. It left the winners.

1 · This Week’s Action
The winners were sold — all of them, and hardest into Friday. It started with the chips and did not stay there. The chip fund SOXX fell 11.8% to 493.39, its eighth down day in a row on Friday. Software joined on Wednesday and again on Friday: the software fund IGV fell 7.4%, 4.8% of it on Friday alone; CrowdStrike −17.3%, Palo Alto −18.3%, Snowflake −16.8%, Palantir −11.0%. And the hyperscalers went with them: Oracle −9.3%, Amazon −4.7%, Alphabet −3.1%, Microsoft −1.1%, with Alphabet −2.5%, Meta −3.7% and Microsoft −1.9% on Friday alone. Nvidia fell 6.6% to 214.13. This was not one sector’s bad week. It was broad profit-taking in everything that had carried the year.
The index and the market under it. The S&P 500 fund fell 1.97% to 763.25. The Nasdaq 100 fund fell 5.52% to 709.80. But the equal-weight S&P rose 0.49% — the average stock was up in a week the index was down two percent and the Nasdaq five. The Nasdaq 100 without its tech stocks rose 0.82% to 98.95, its second week up; the tech half of the Nasdaq 100 fell 9.15%. Small caps fell 3.05%.
The tech bull channels broke. Since the 30 March low every dip in the tech funds stopped on a rising line, drawn from that low through the late-July low. This week QQQ closed under it — the line runs at about 729 to 732 now, the fund closed Friday at 709.80. Wednesday and Thursday it closed right on the line, at 728.95 and 728.00; Friday’s 2.5% drop took it through. The tech sector fund XLK closed at 183.47 against a line at about 193; the chip fund SMH at 539.79 against about 601. Software is the one that kept its spring line — IGV at 104.34 sits above the line from the April low through the June low, near 100 — but it fell through the steeper line it had followed since August.
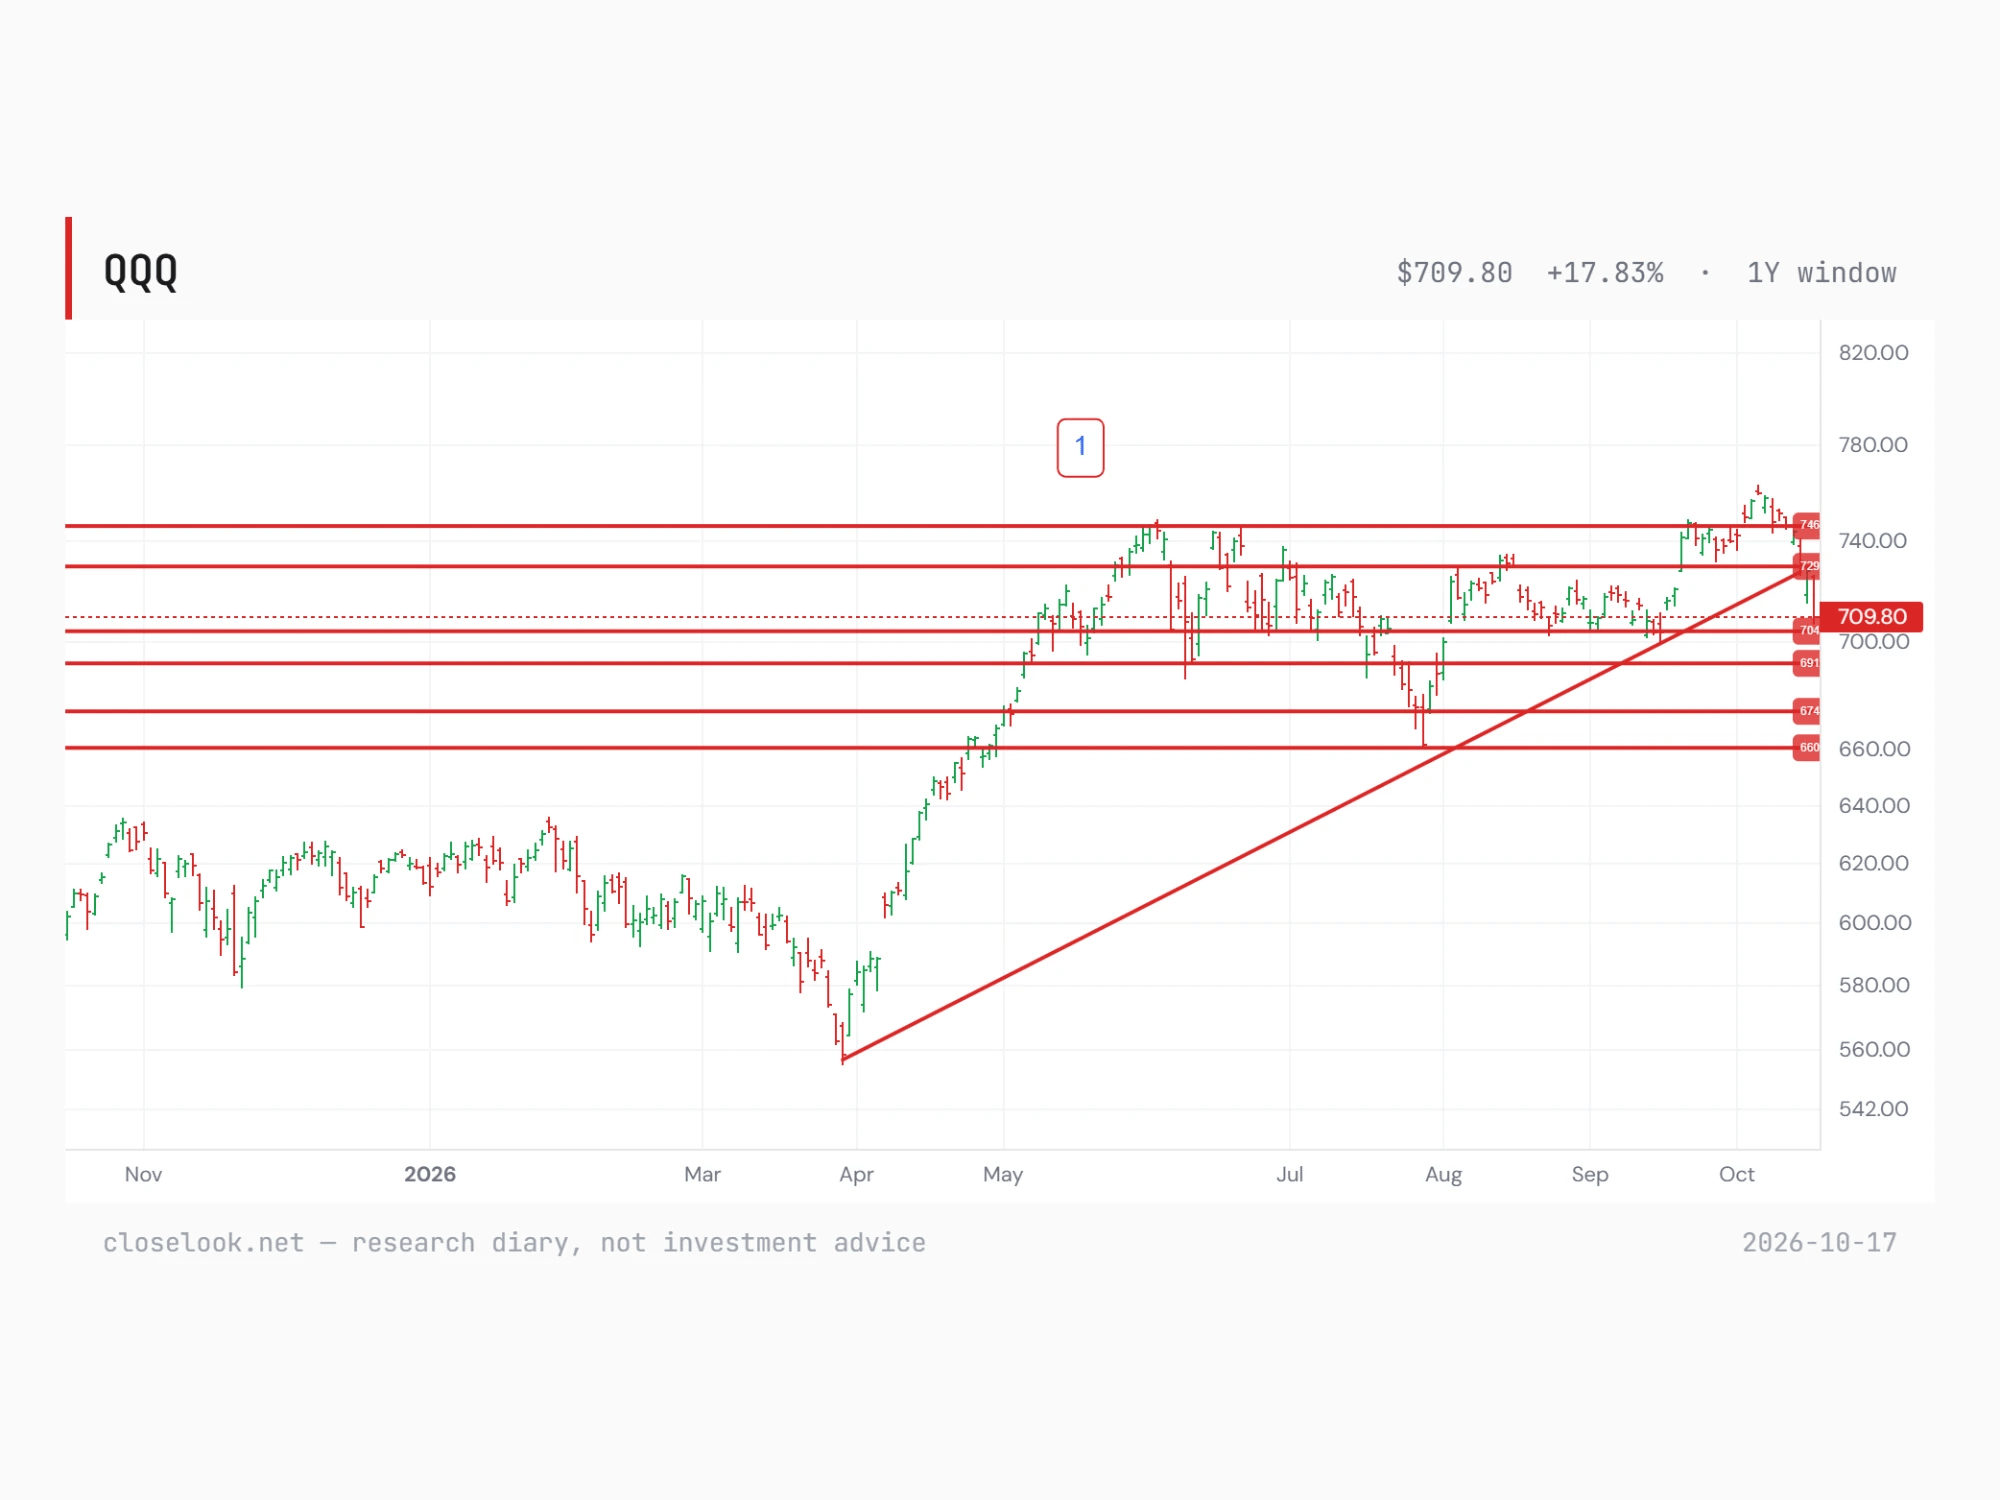
The editor’s chart: QQQ over one year — the rising line from the 30 March low through the late-July low, broken on Friday at 709.80; horizontal lines at 746, 729, 704, 691, 674 and 660; the editor marks the June top as wave 1.
The levels under it, from the editor’s chart. 746 — last week’s confirmation line — was lost on Monday by twelve cents and never regained. 729 went on Friday. The next lines are 704, the area of the September low (704.54 on 15 September, 700.00 intraday the day after), then 691, 674 and 660 — the last the July low that the rising line was drawn through.
The eleven S&P 500 sectors
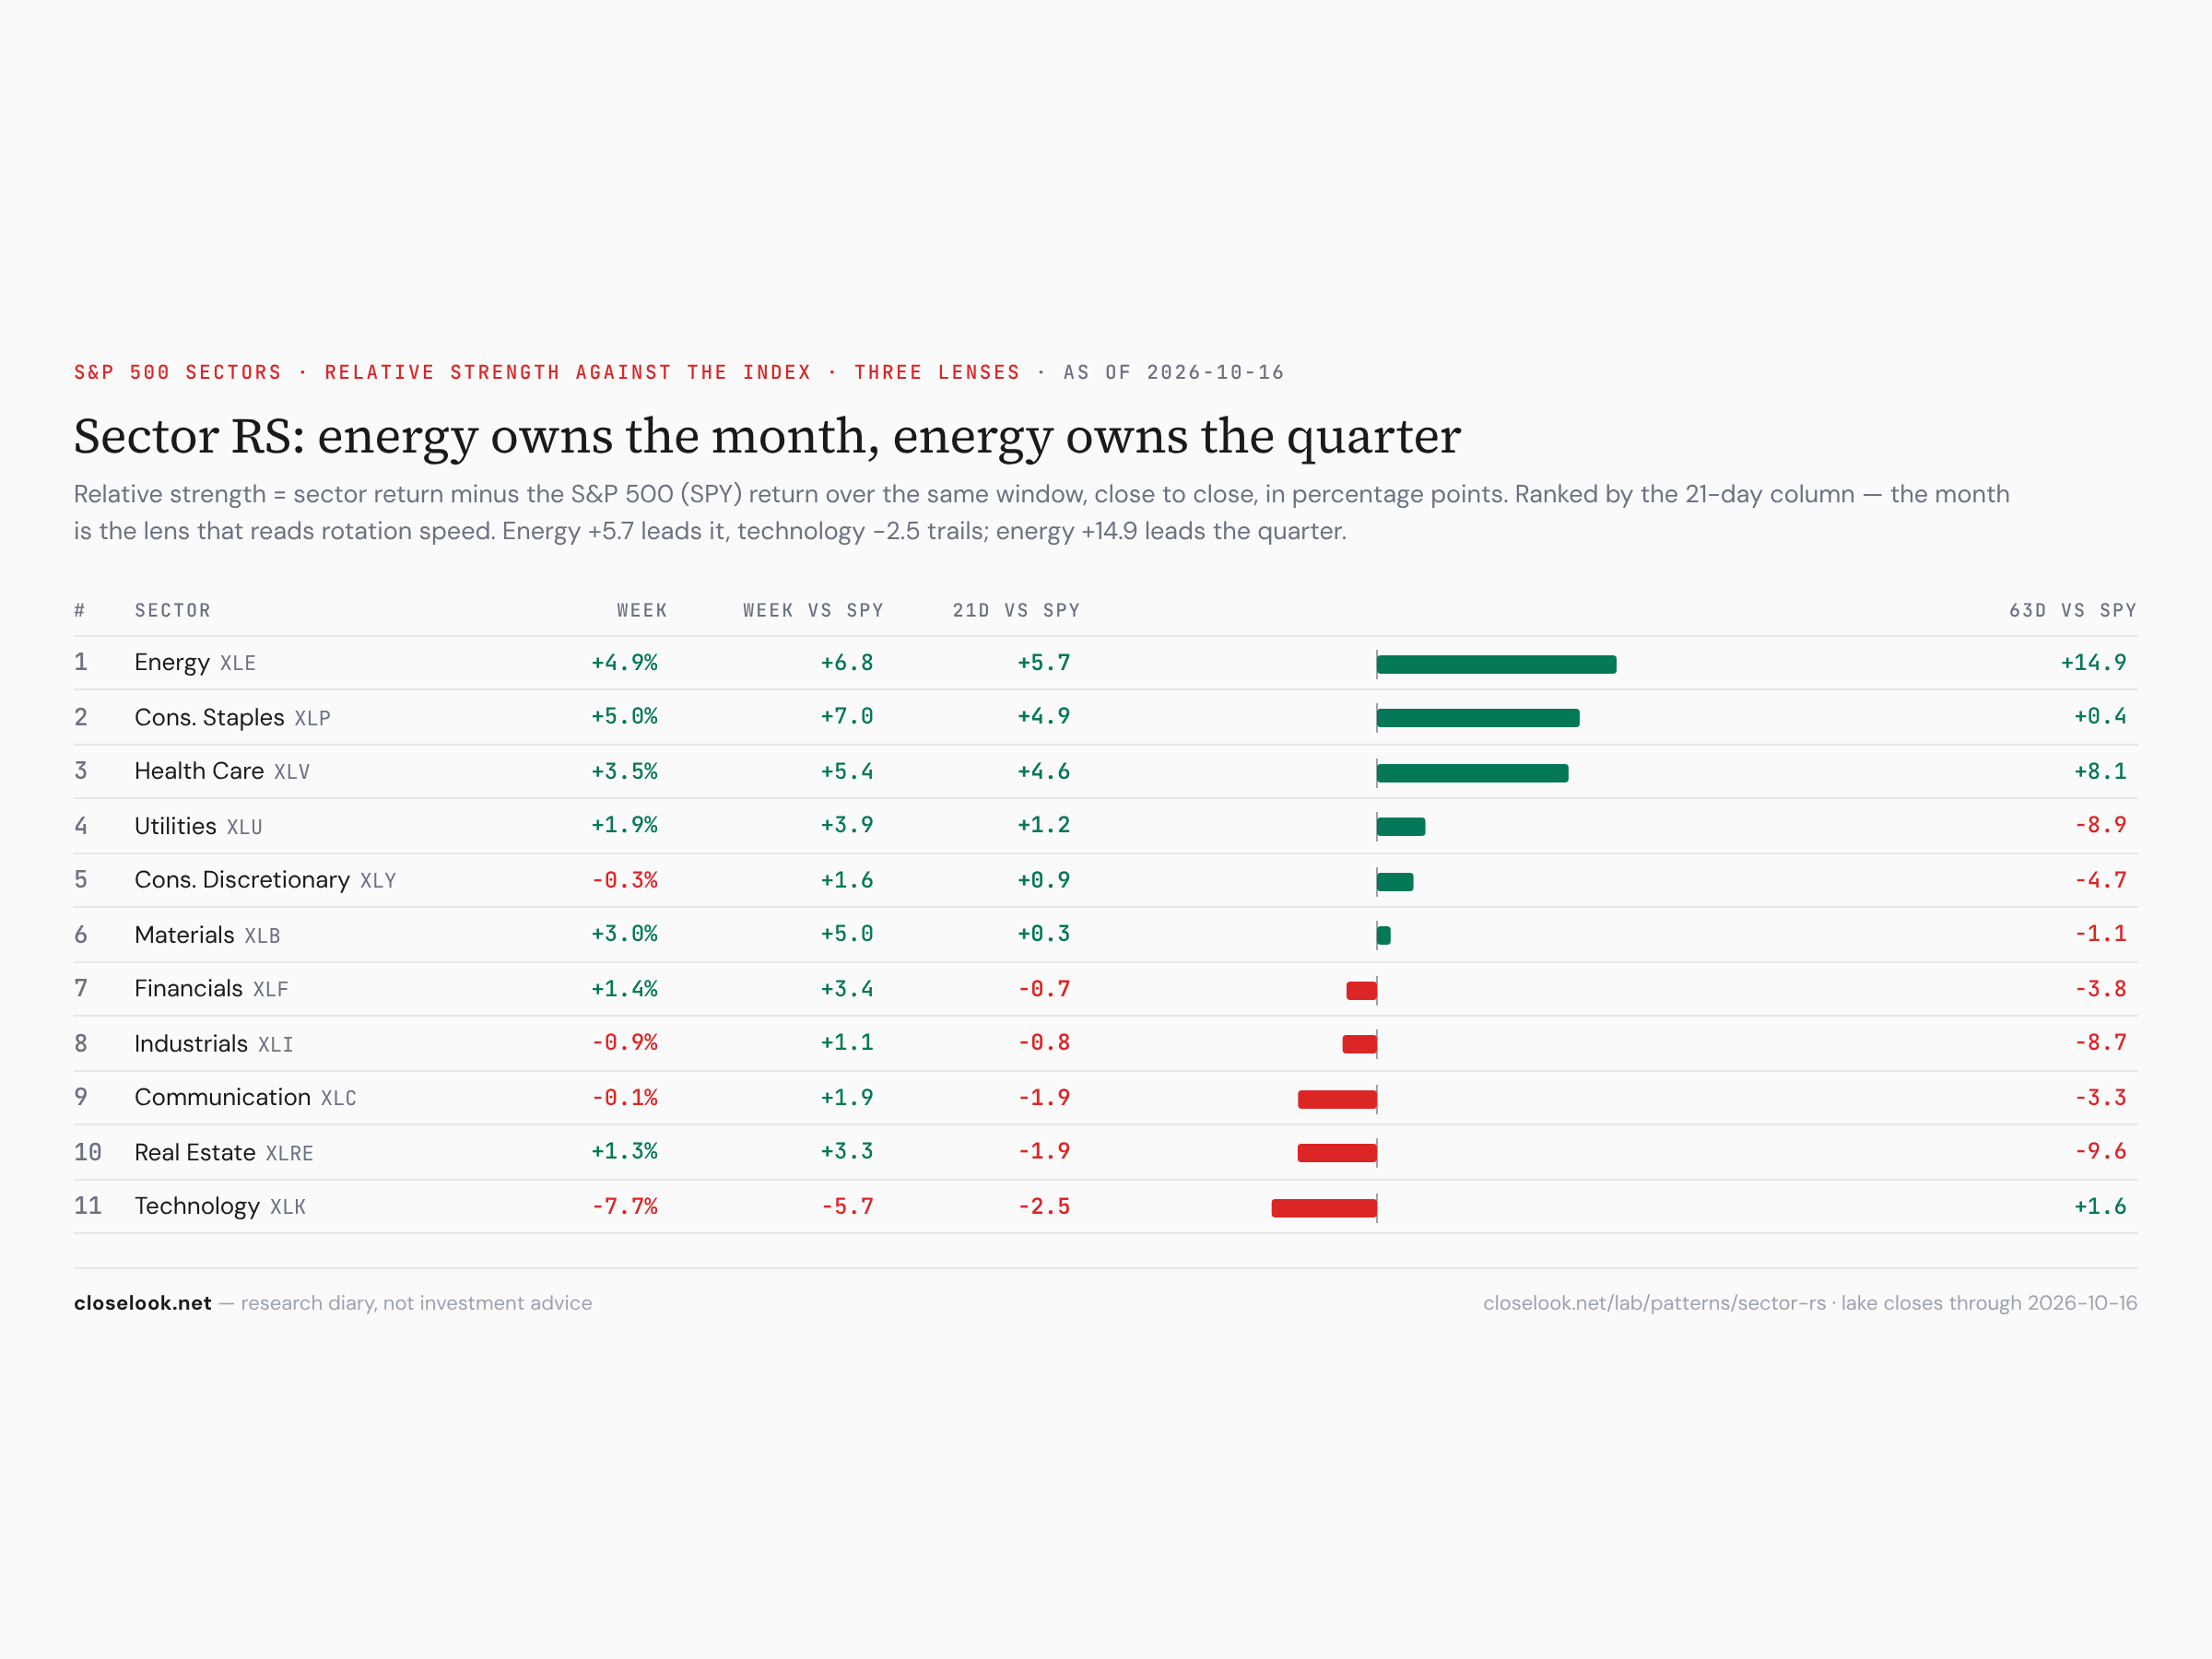
Seven of eleven up — in a week the Nasdaq fell 5.5%. Consumer staples +5.02% to 87.62, their highest close since 3 March. Energy +4.86%. Health care +3.45% to 176.71, after a one-year closing high of 177.19 on Thursday. Materials +3.01%, utilities +1.93%, financials +1.44%, real estate +1.32%. Communications −0.05%, consumer discretionary −0.35%, industrials −0.88% — and technology −7.70%, the only sector with a real loss and still +27.4% on the year.
The shape of it: defensive growers. Staples and health care are the companies that keep growing when the economy slows — food, soap, medicine. Friday’s Pulse put it in one line: out of chips, into pills and soap. Since the 6 October record health care is up 6.0% and staples 6.0%, technology down 6.3%, chips 12.7%. Against the S&P this week staples beat it by 7.0 points, energy by 6.8, health care by 5.4; technology trailed by 5.7.
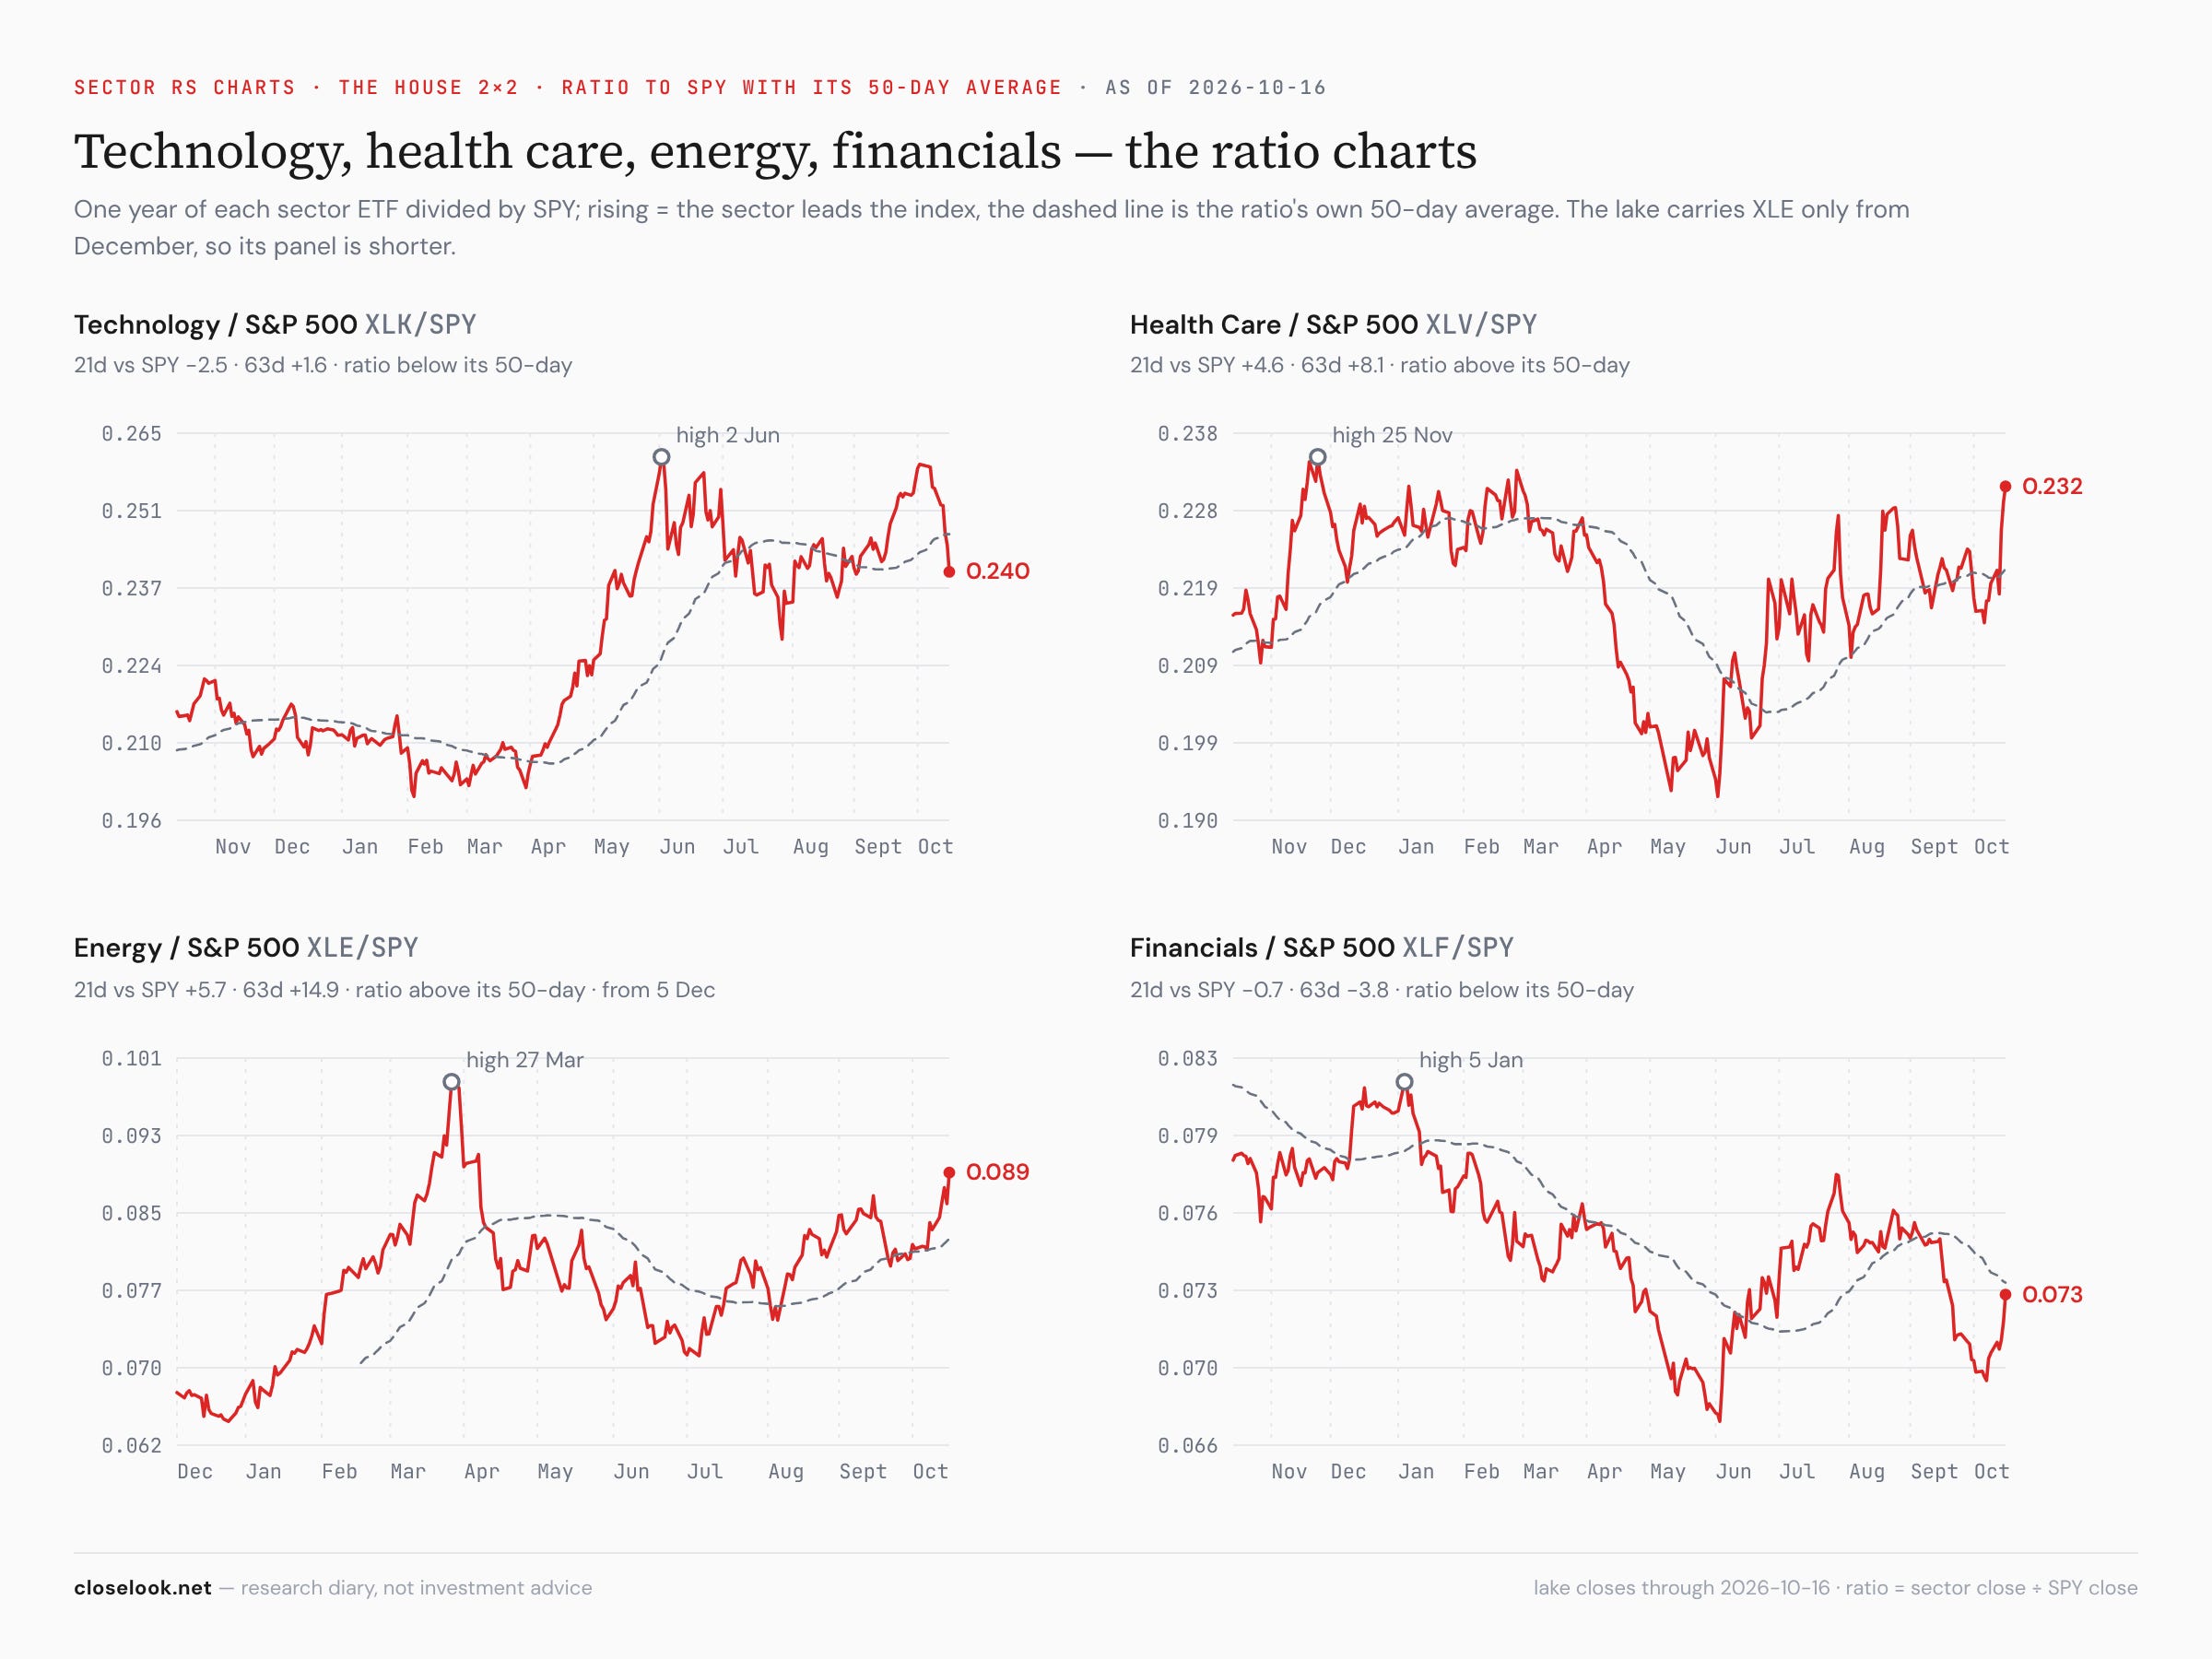
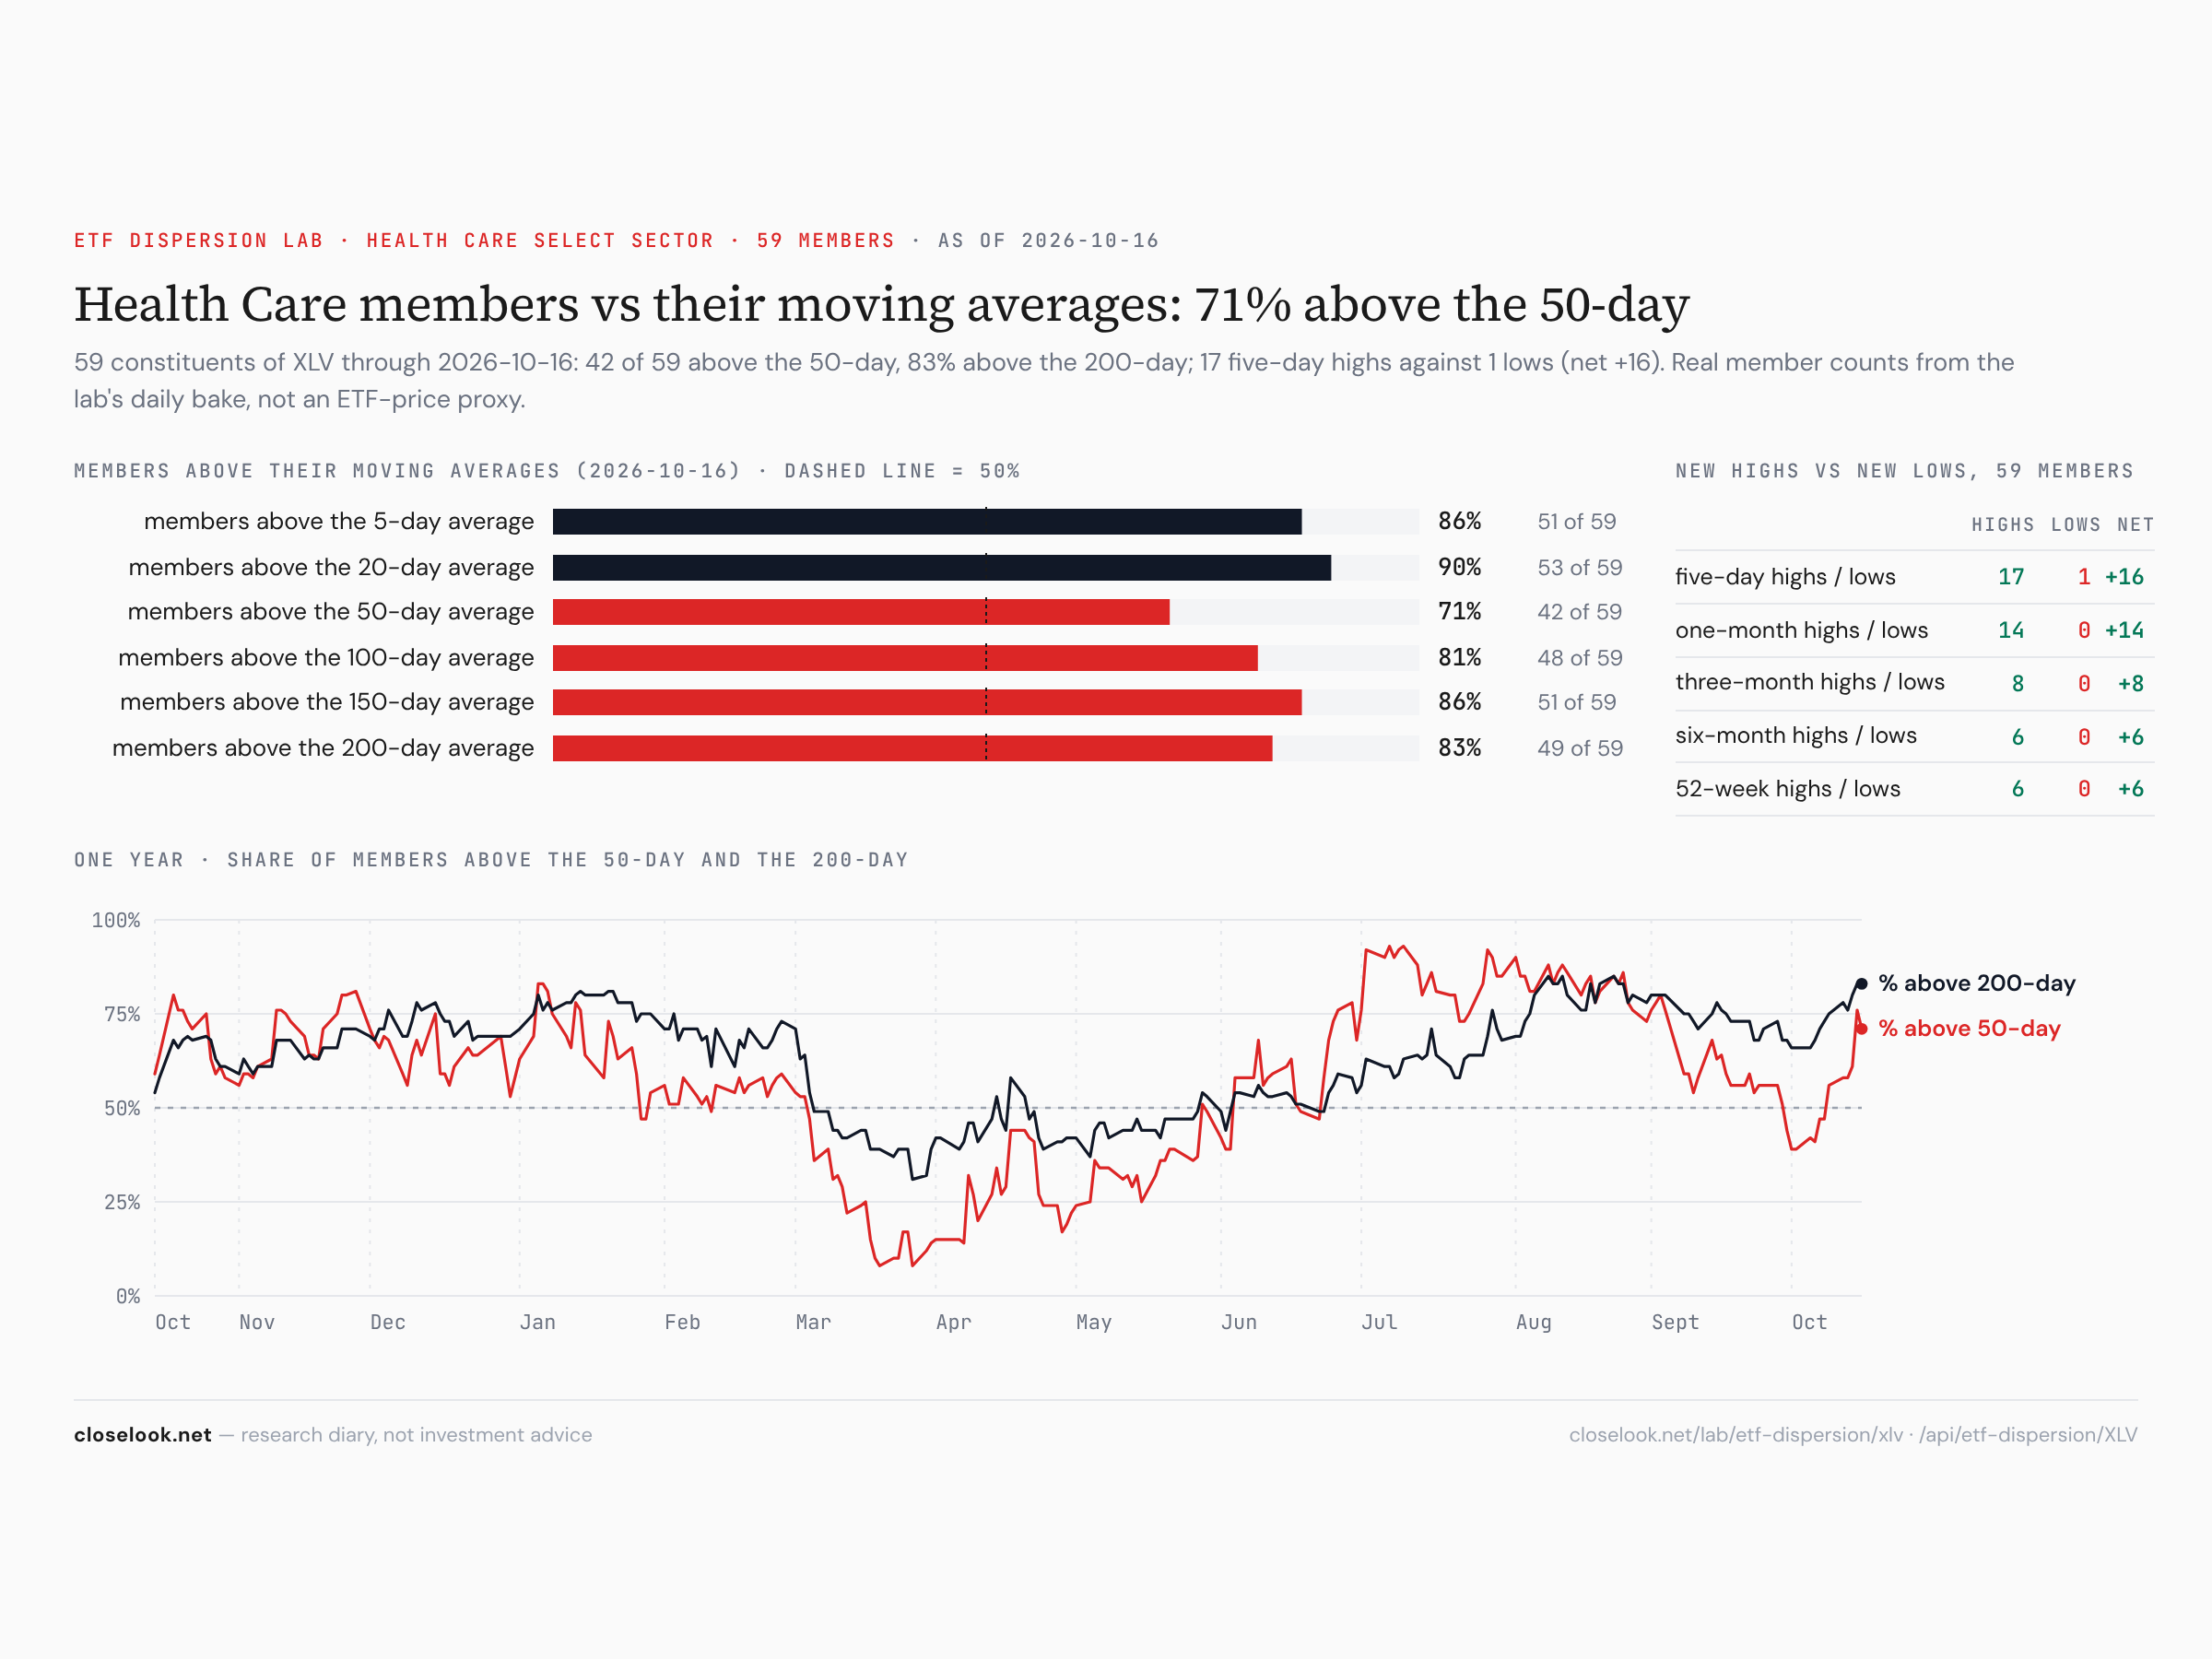
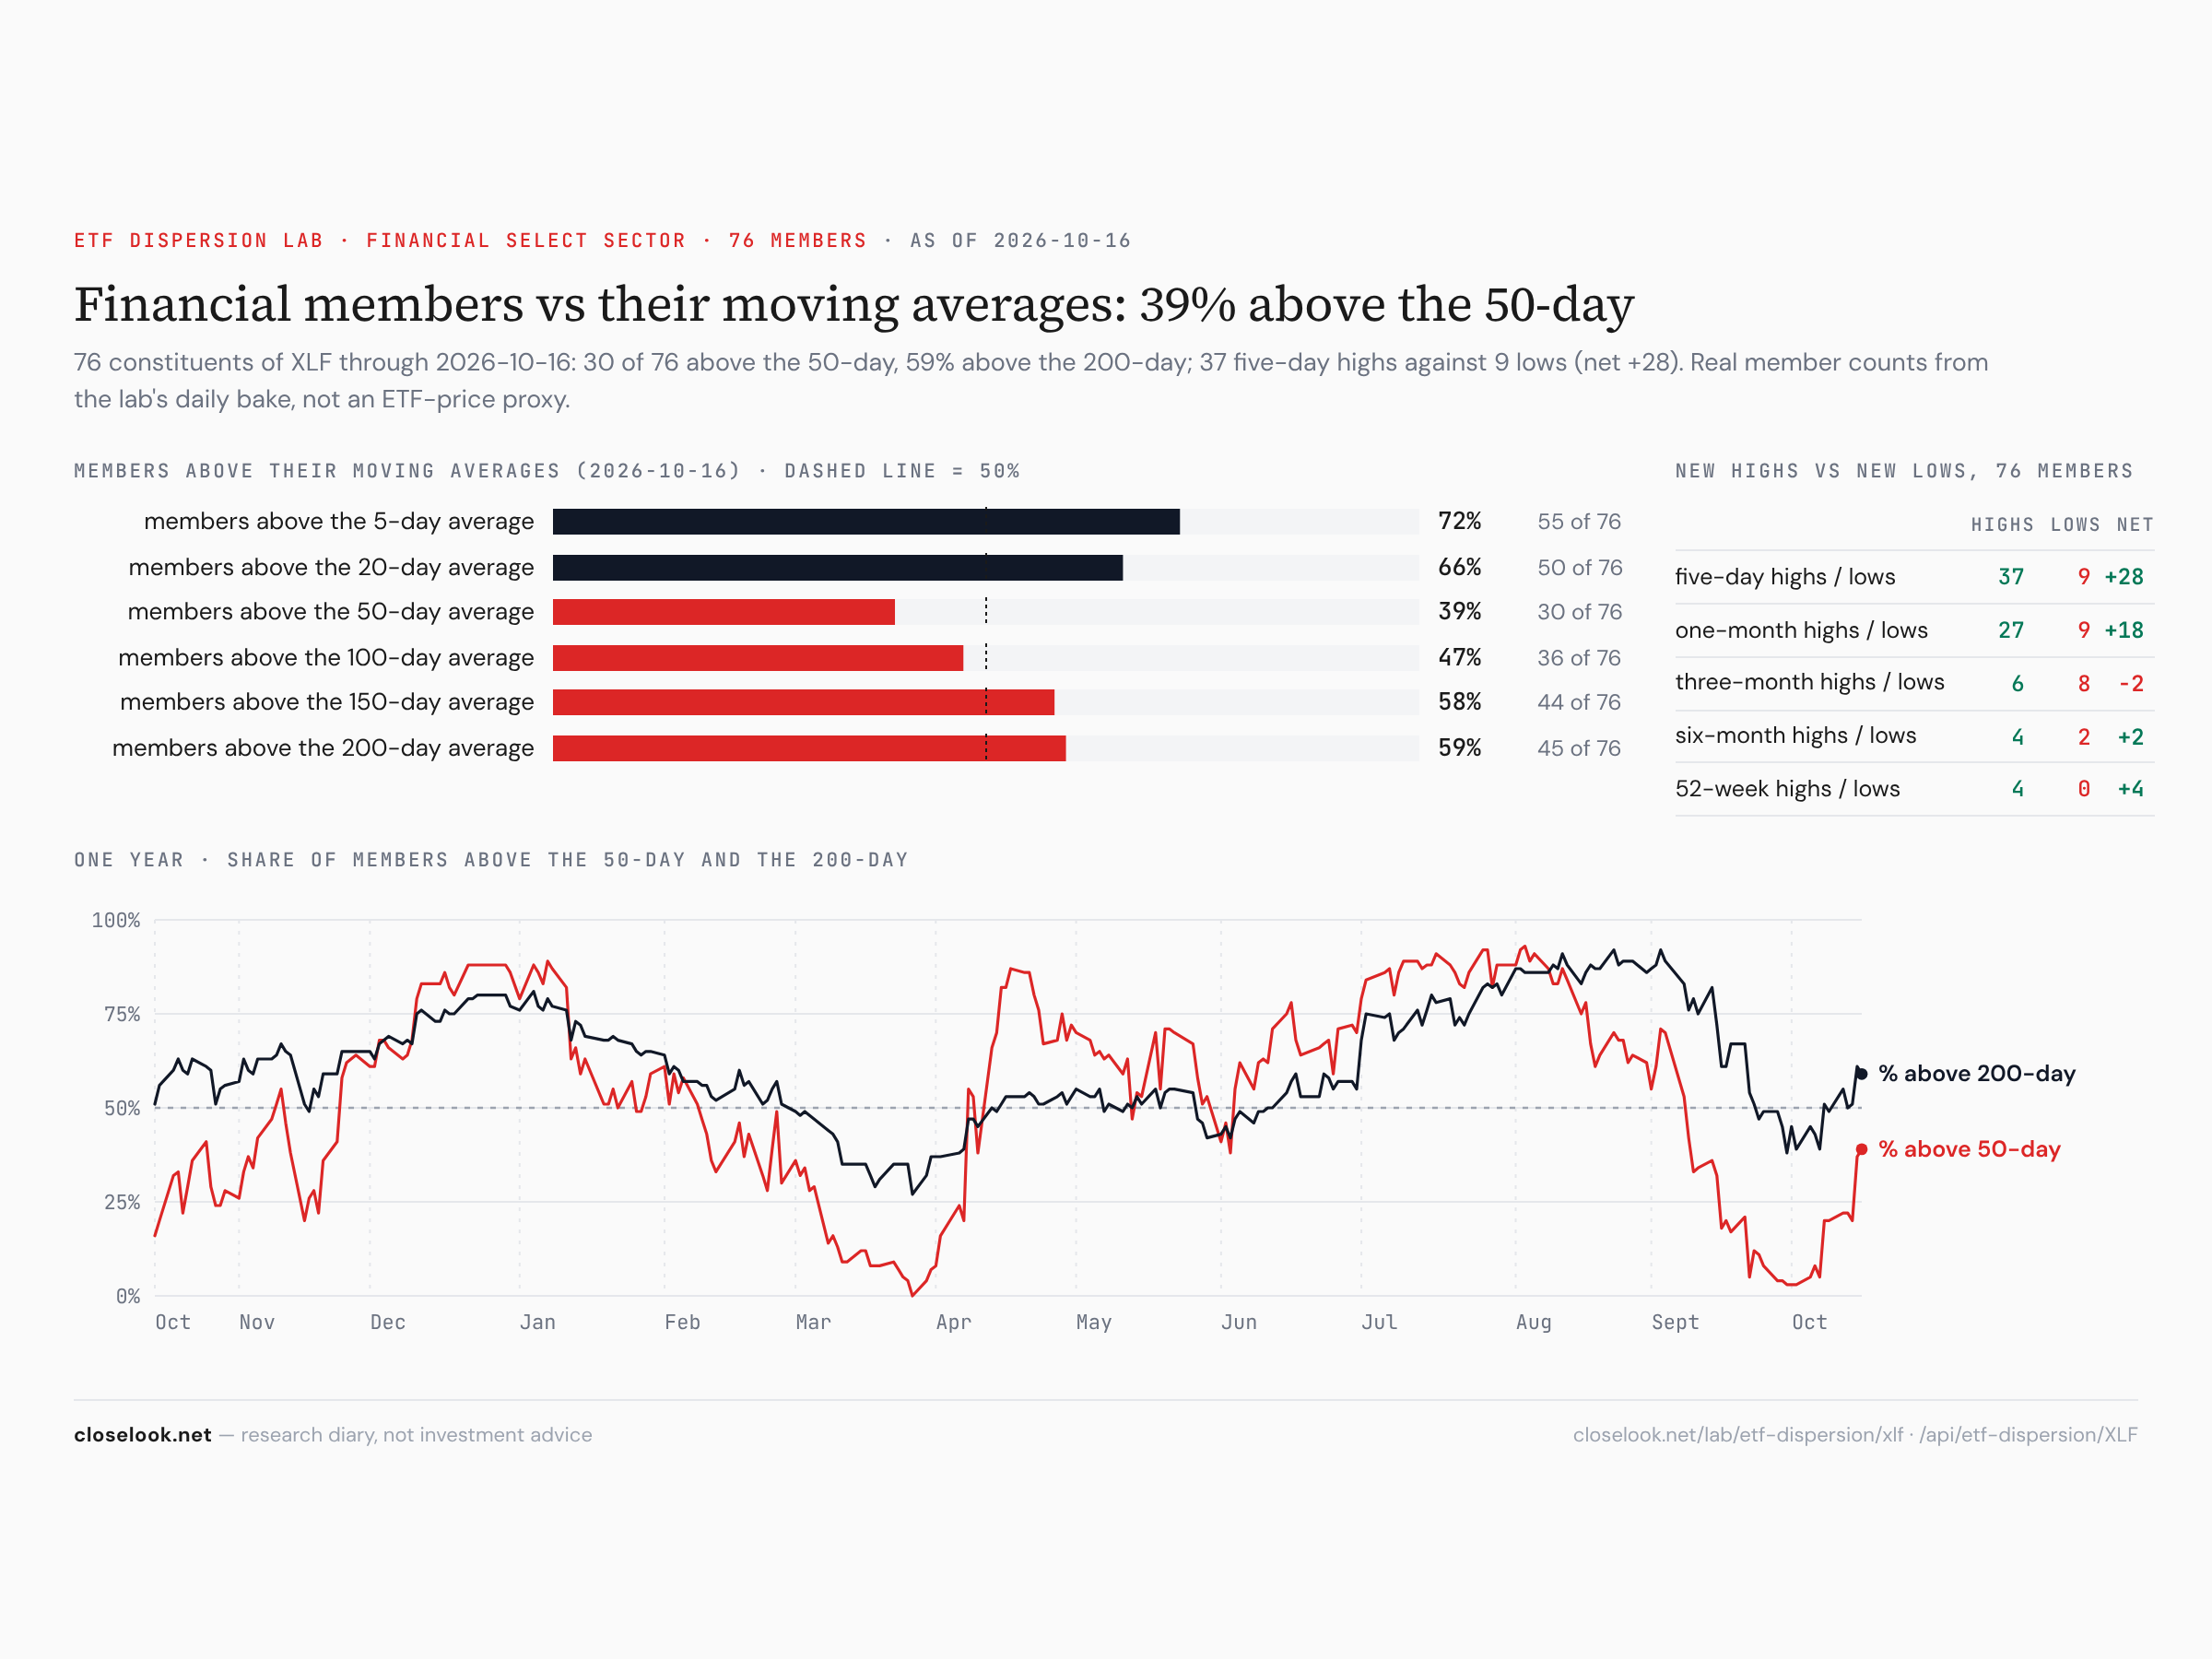
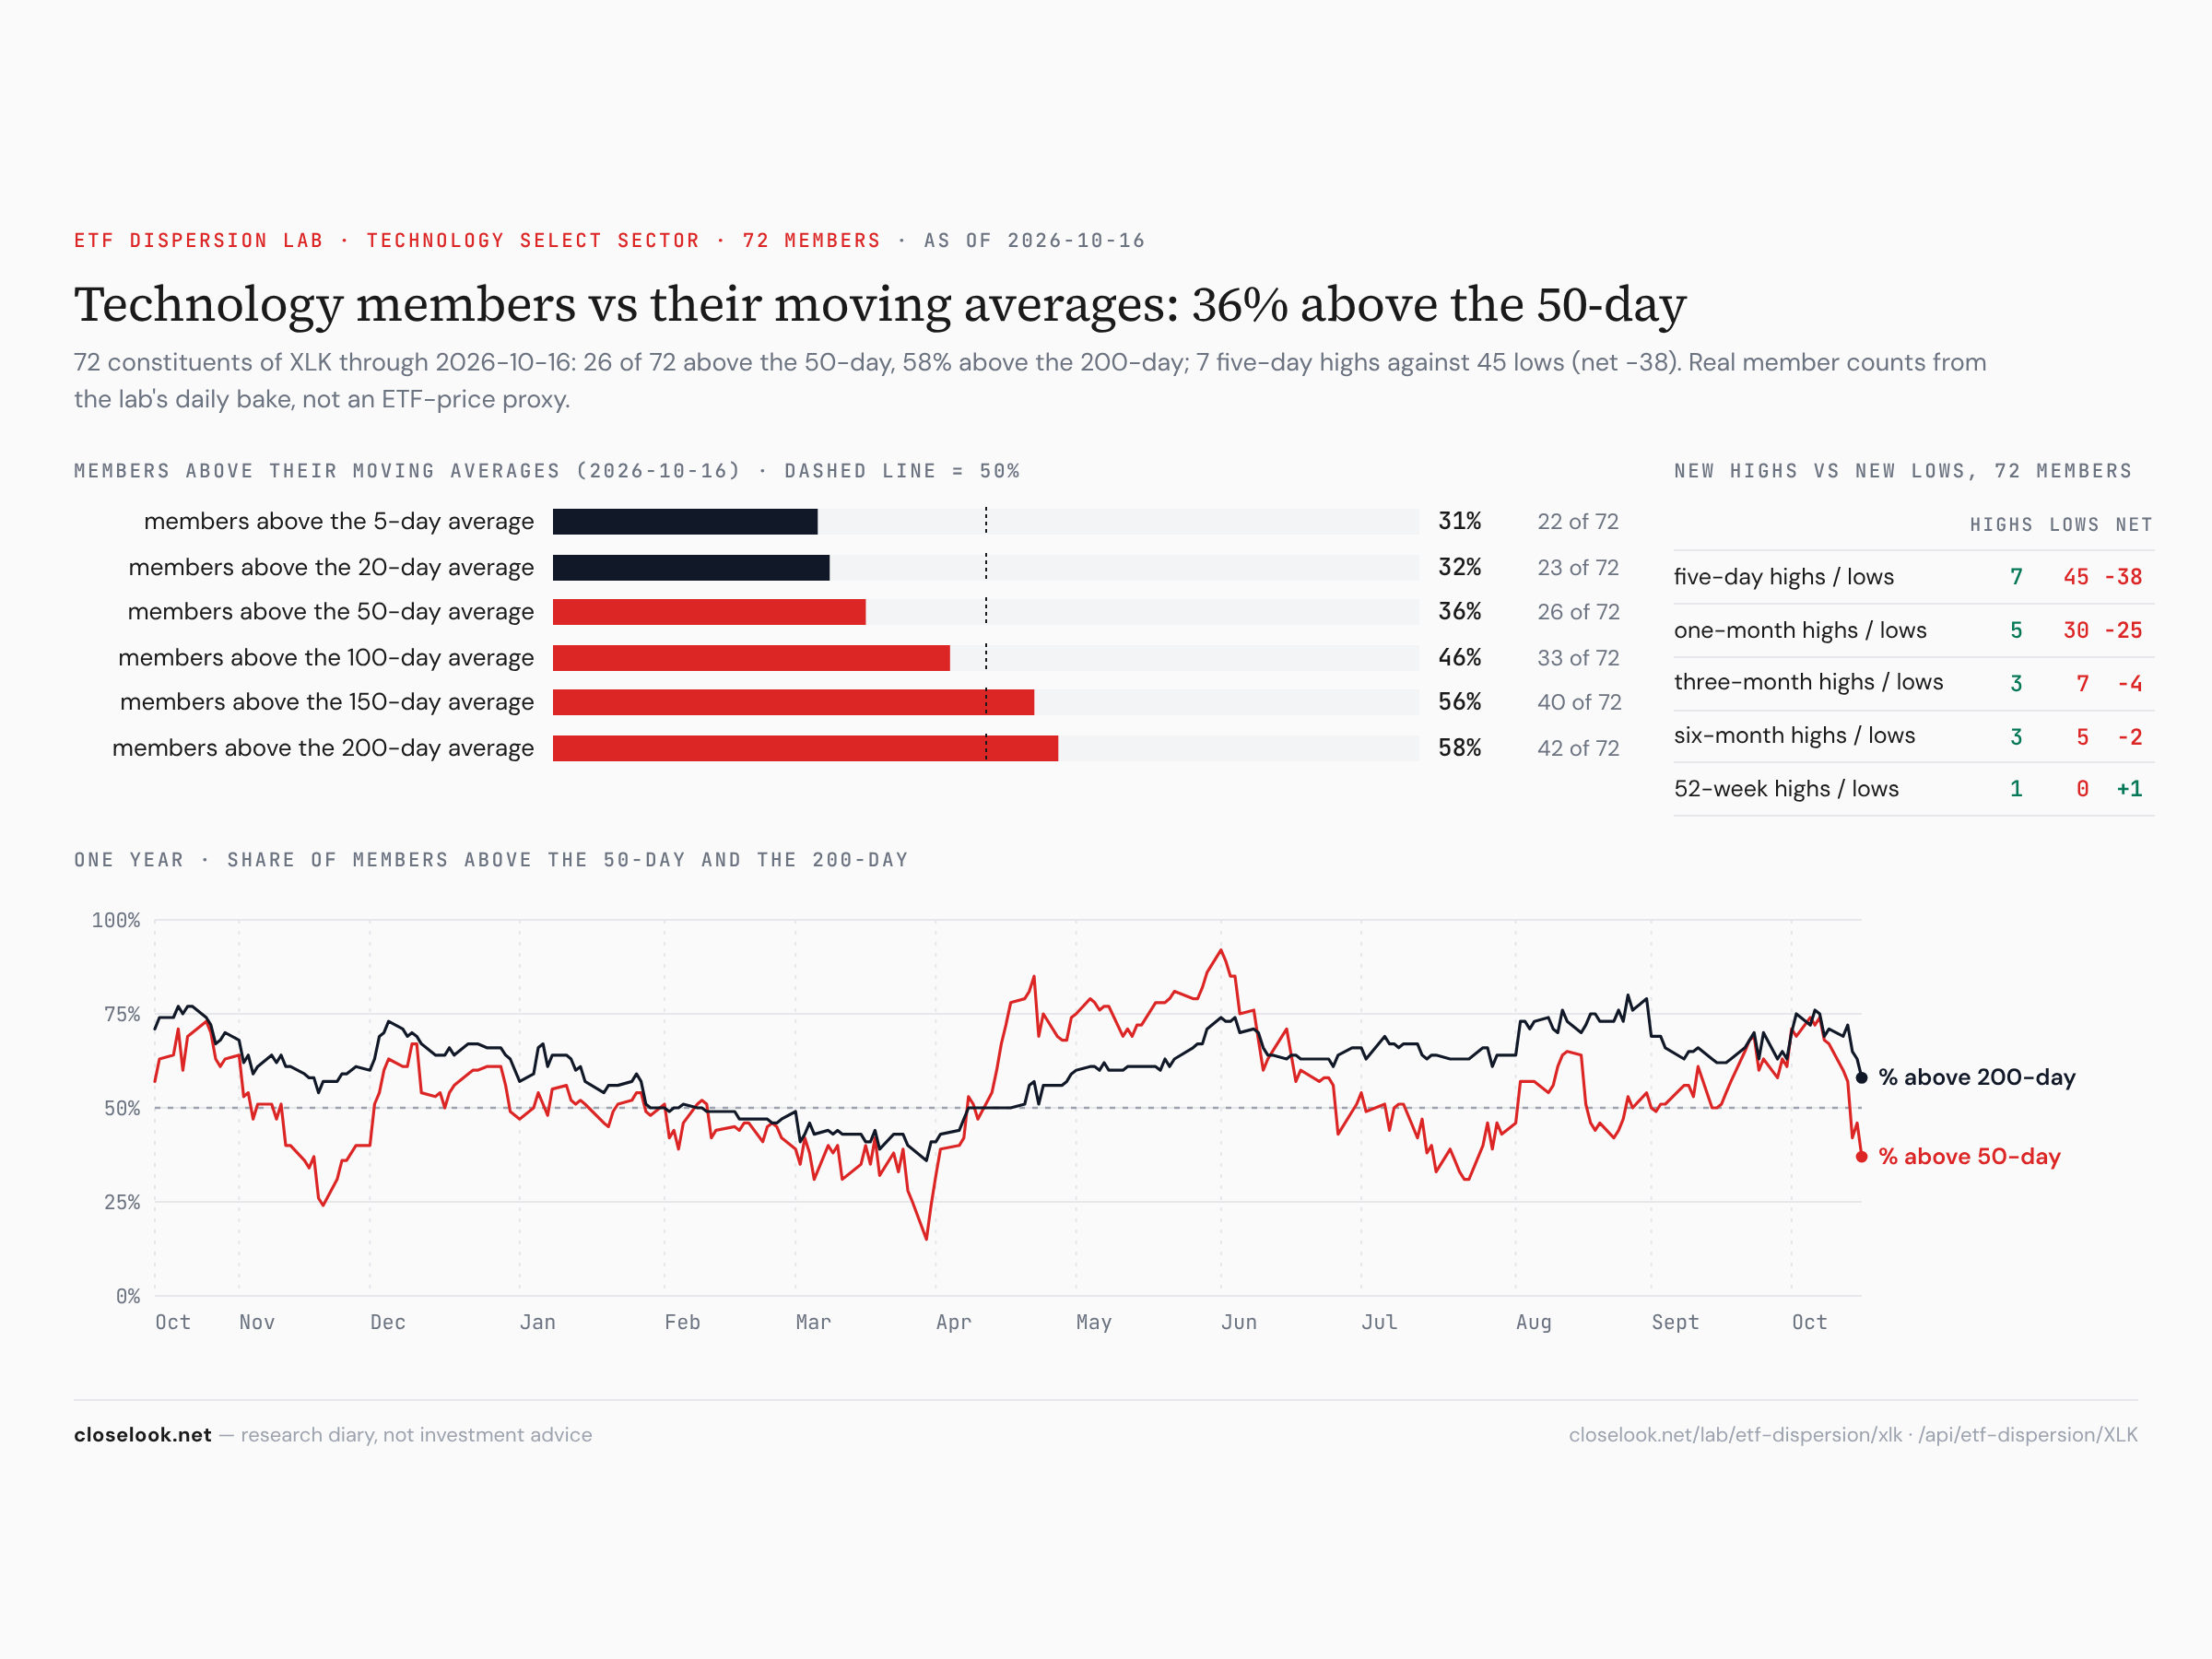
Breadth — health care and energy strong, tech thin. In health care 51 of 59 members closed above their 5-day average and 42 above the 50-day, with 17 new five-day highs against one low. In energy 16 of 21 are above the 50-day. In financials 55 of 76 are above the 5-day, 30 above the 50-day — up from none above the 20-day two weeks ago. Technology is the mirror: 26 of 72 above the 50-day, 45 new five-day lows against 7 highs.
The Nasdaq 100, cut six ways
The week: the Nasdaq 100 without tech +0.82%, the S&P 500 without tech +1.04%, the S&P without the Magnificent Seven −1.65%, the S&P −1.97%, the Magnificent Seven fund −3.38%, the Nasdaq 100 −5.52%, the Nasdaq tech sector −9.15%. On the year: Nasdaq tech +30.8% (from +44.0% a week ago), the Nasdaq 100 +15.5%, the S&P +11.9%, the S&P without tech +6.7%, the Nasdaq without tech −0.4%. Thirteen points of the tech half’s year went in five sessions.
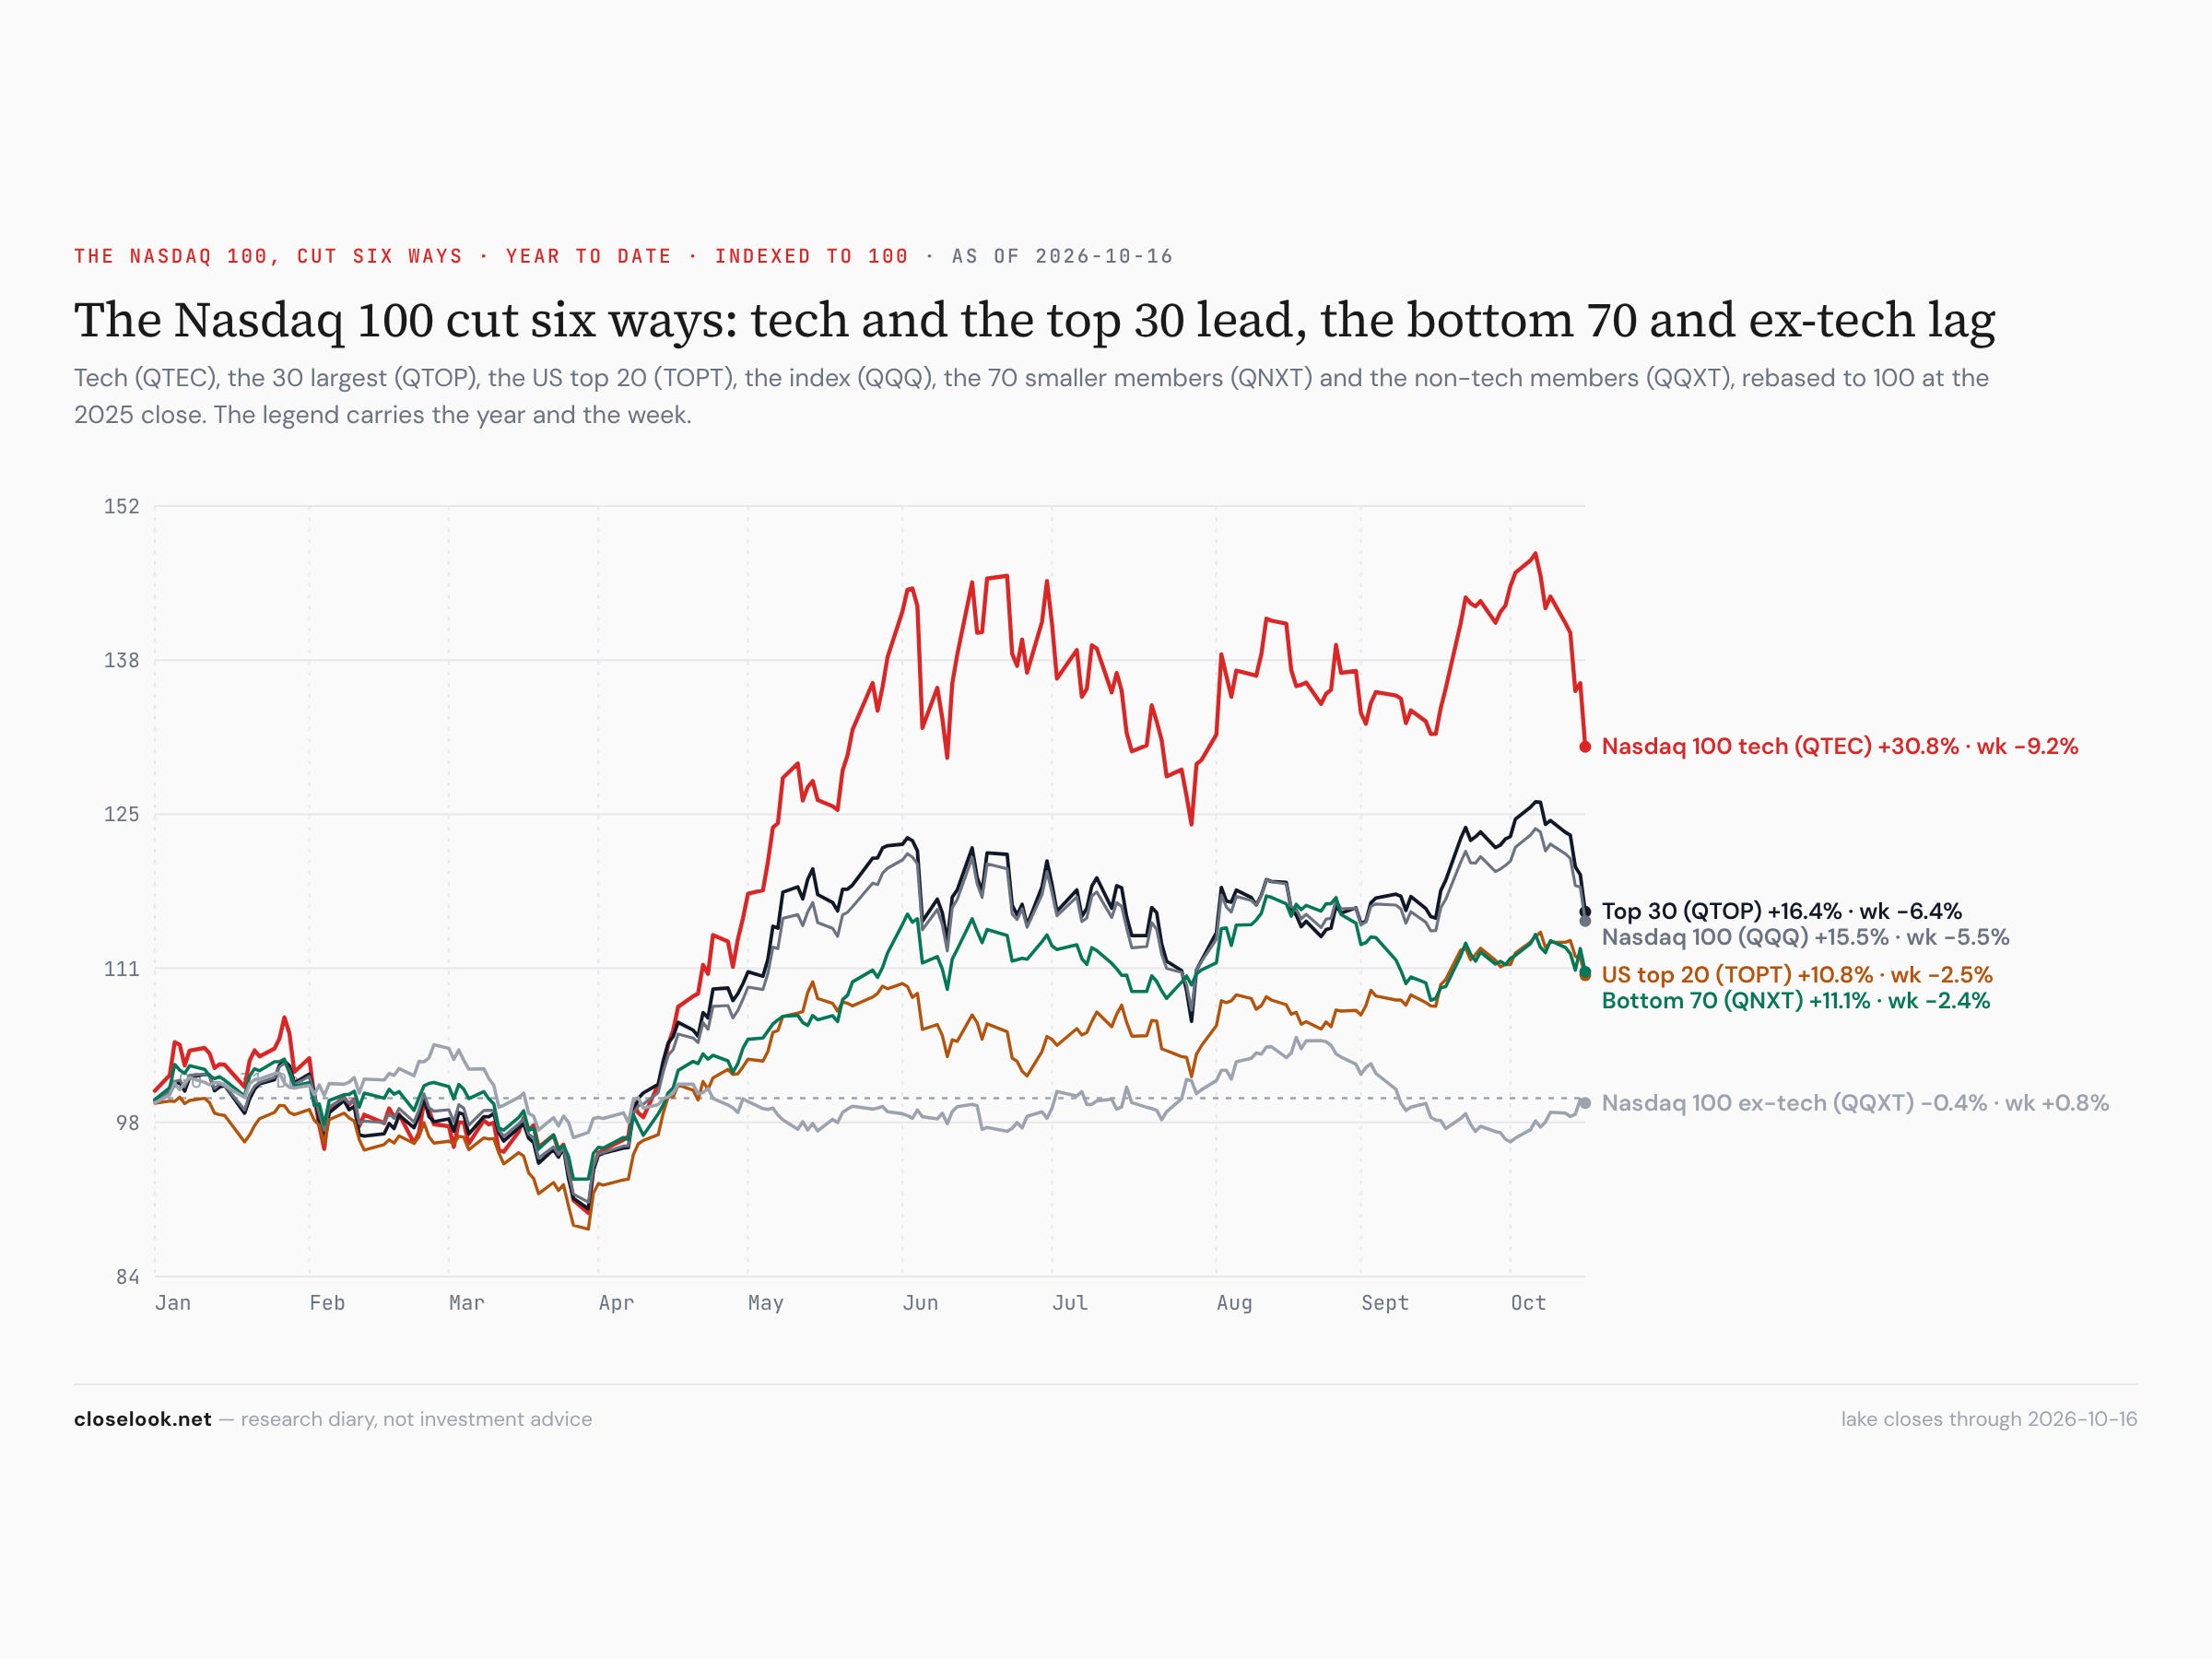
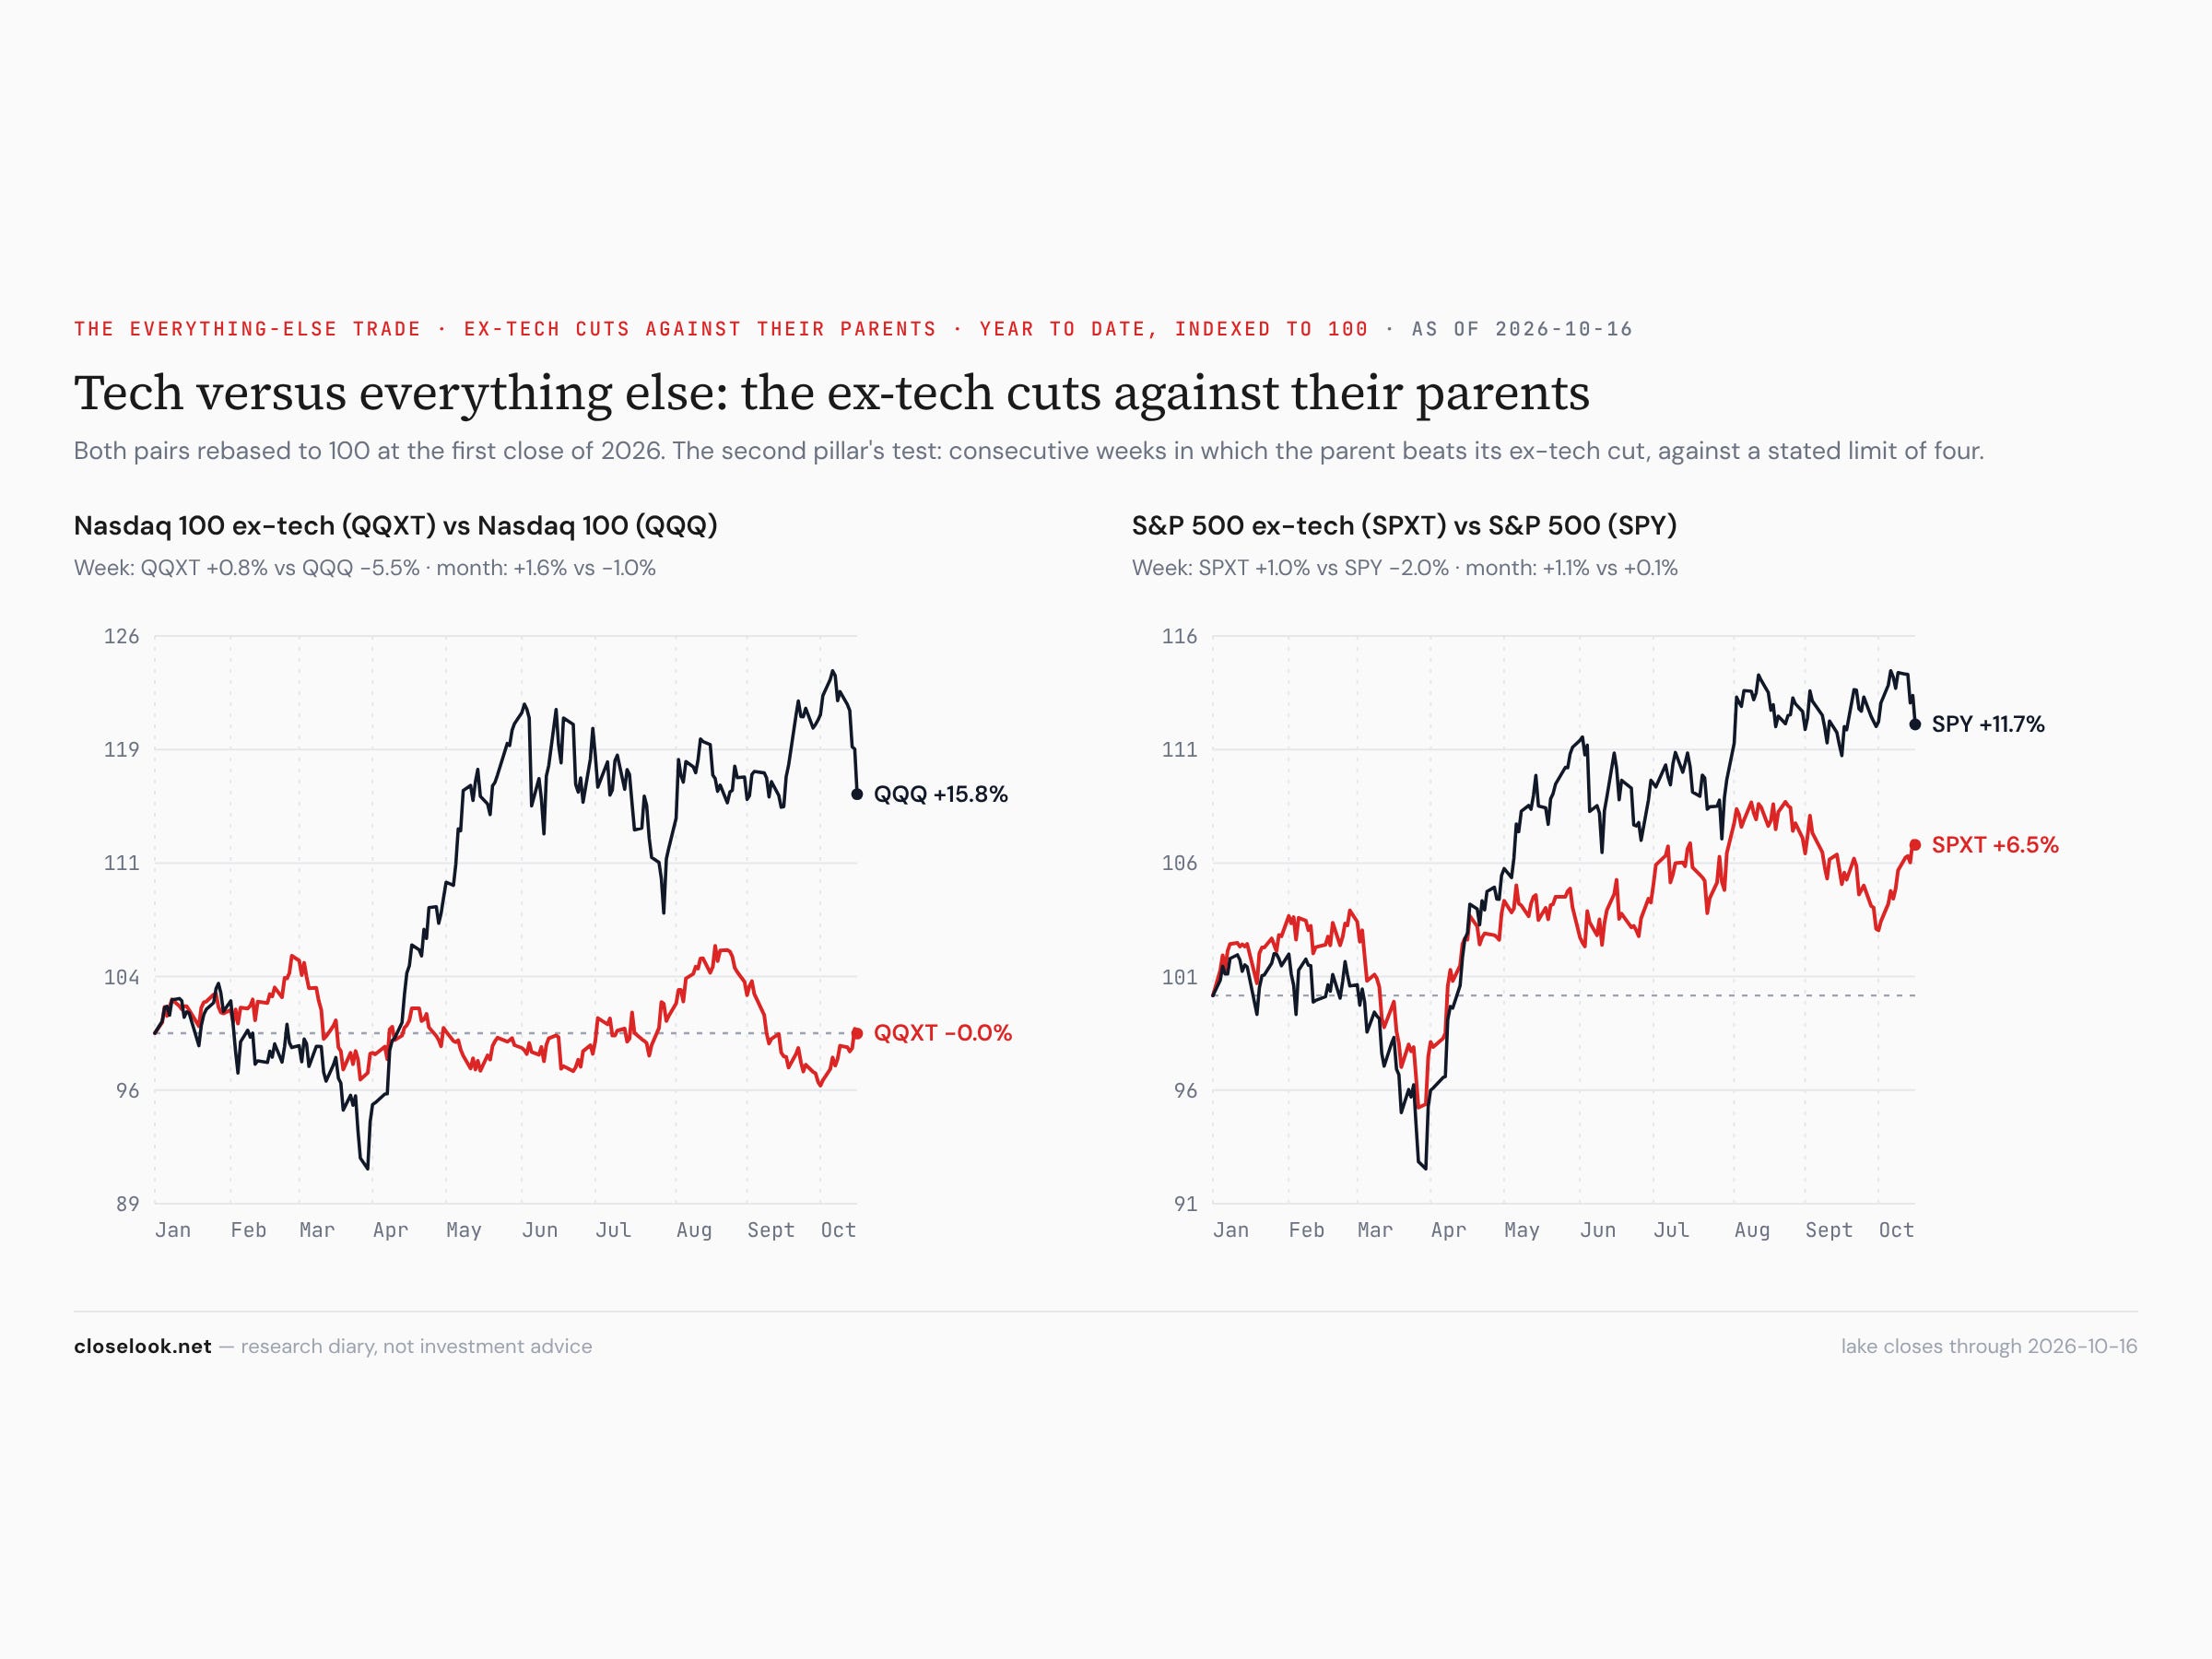
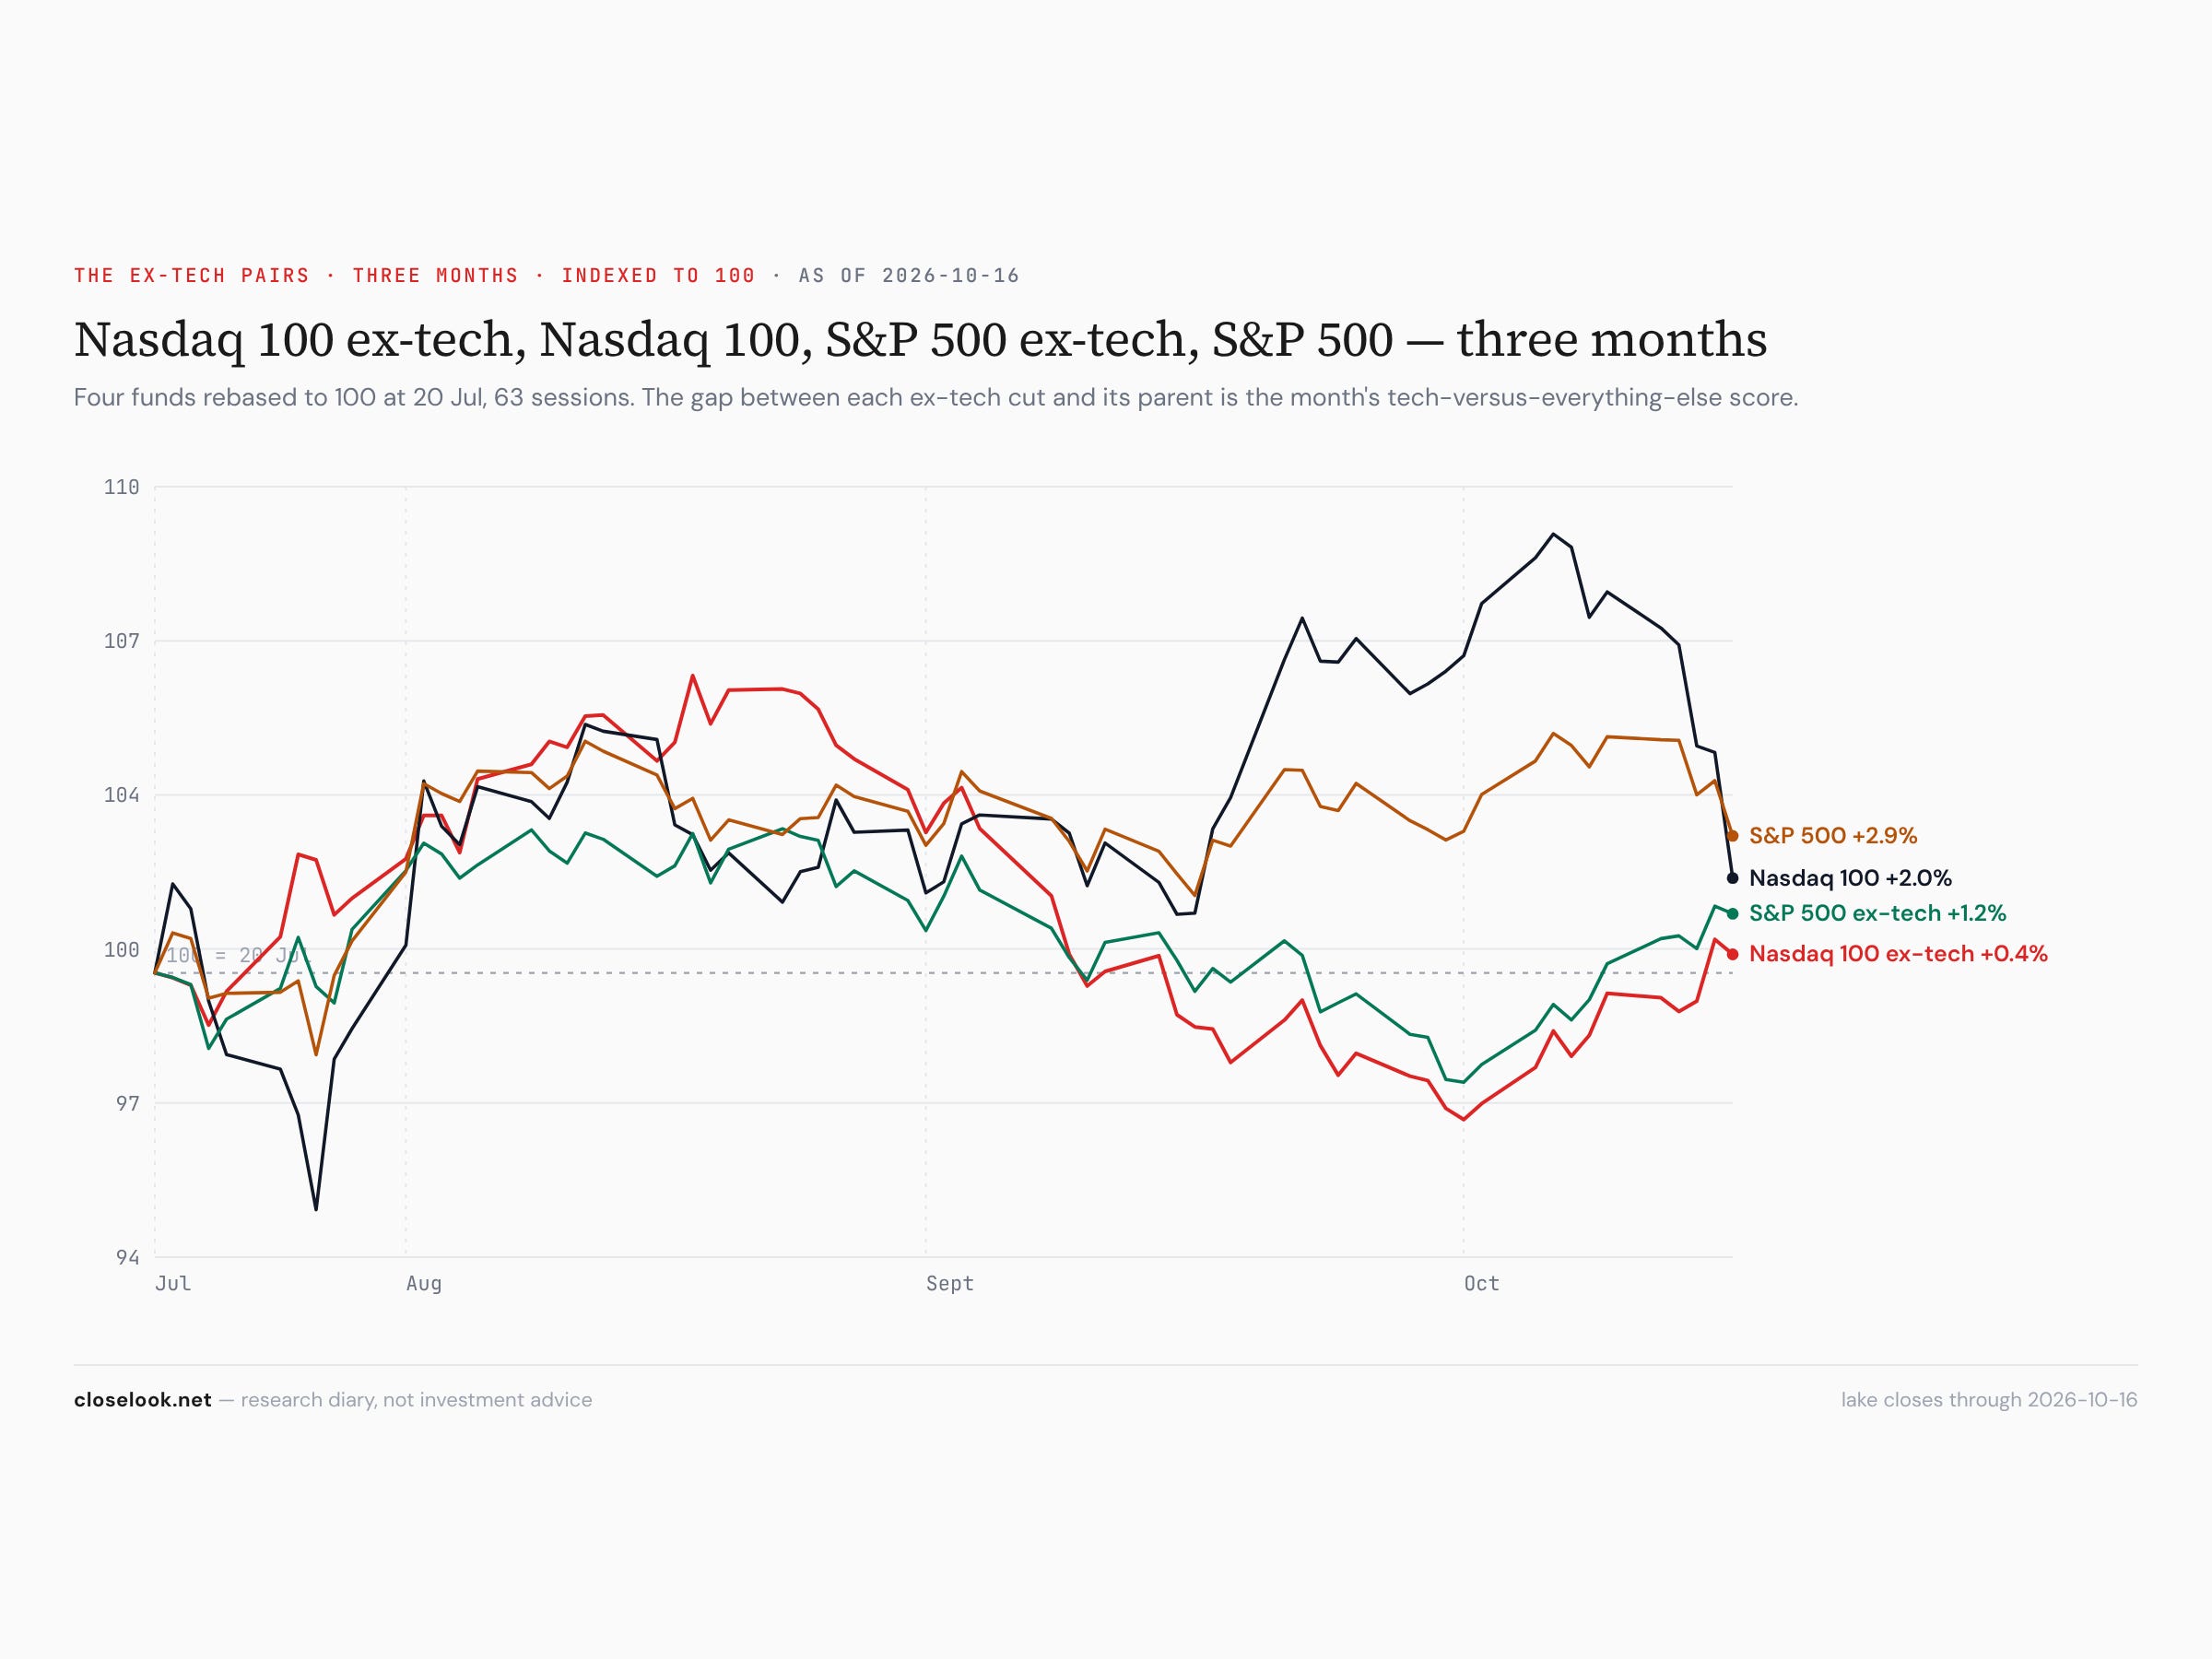
The counterpoint: the Nasdaq without tech is green. QQXT closed at 98.95 — its low of the year was 95.56 on 1 October, and it closed at 99.26 on Thursday, the best close since the low. In the week the tech half fell 9%, the other half of the same index rose. That is rotation inside the Nasdaq, not a sell-everything week: the money that left Nvidia, CrowdStrike and Oracle went to the drug makers, the retailers and the food companies in the same index.
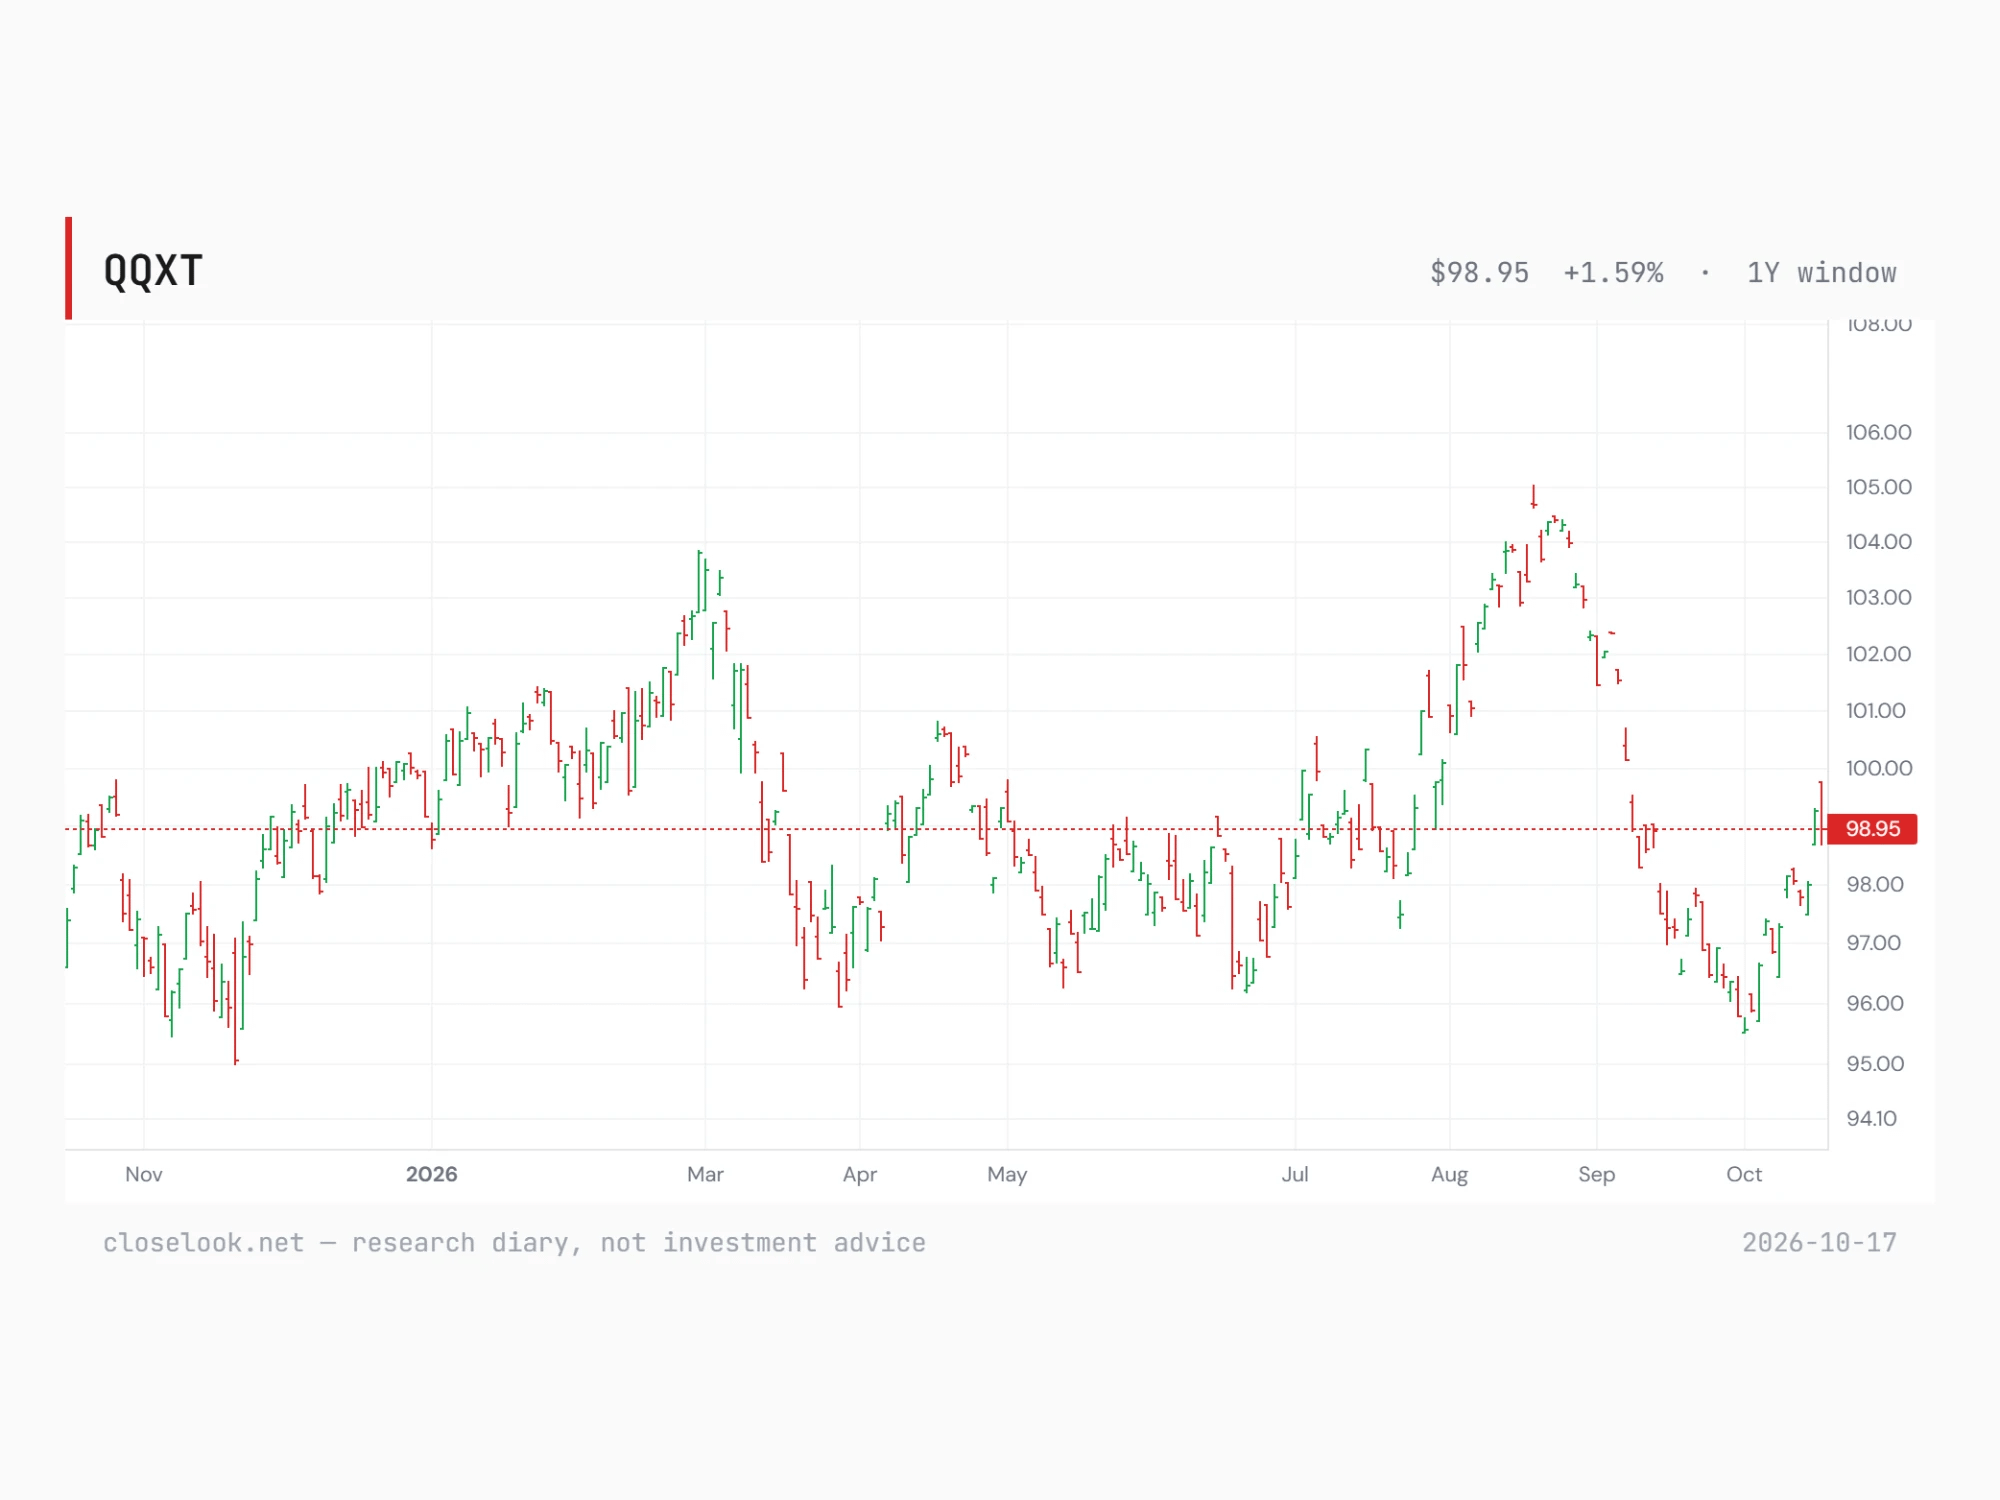
The editor’s chart: the Nasdaq 100 without tech over one year — at 98.95, two weeks off its early-October low near 95.5 and still under its August high near 105.
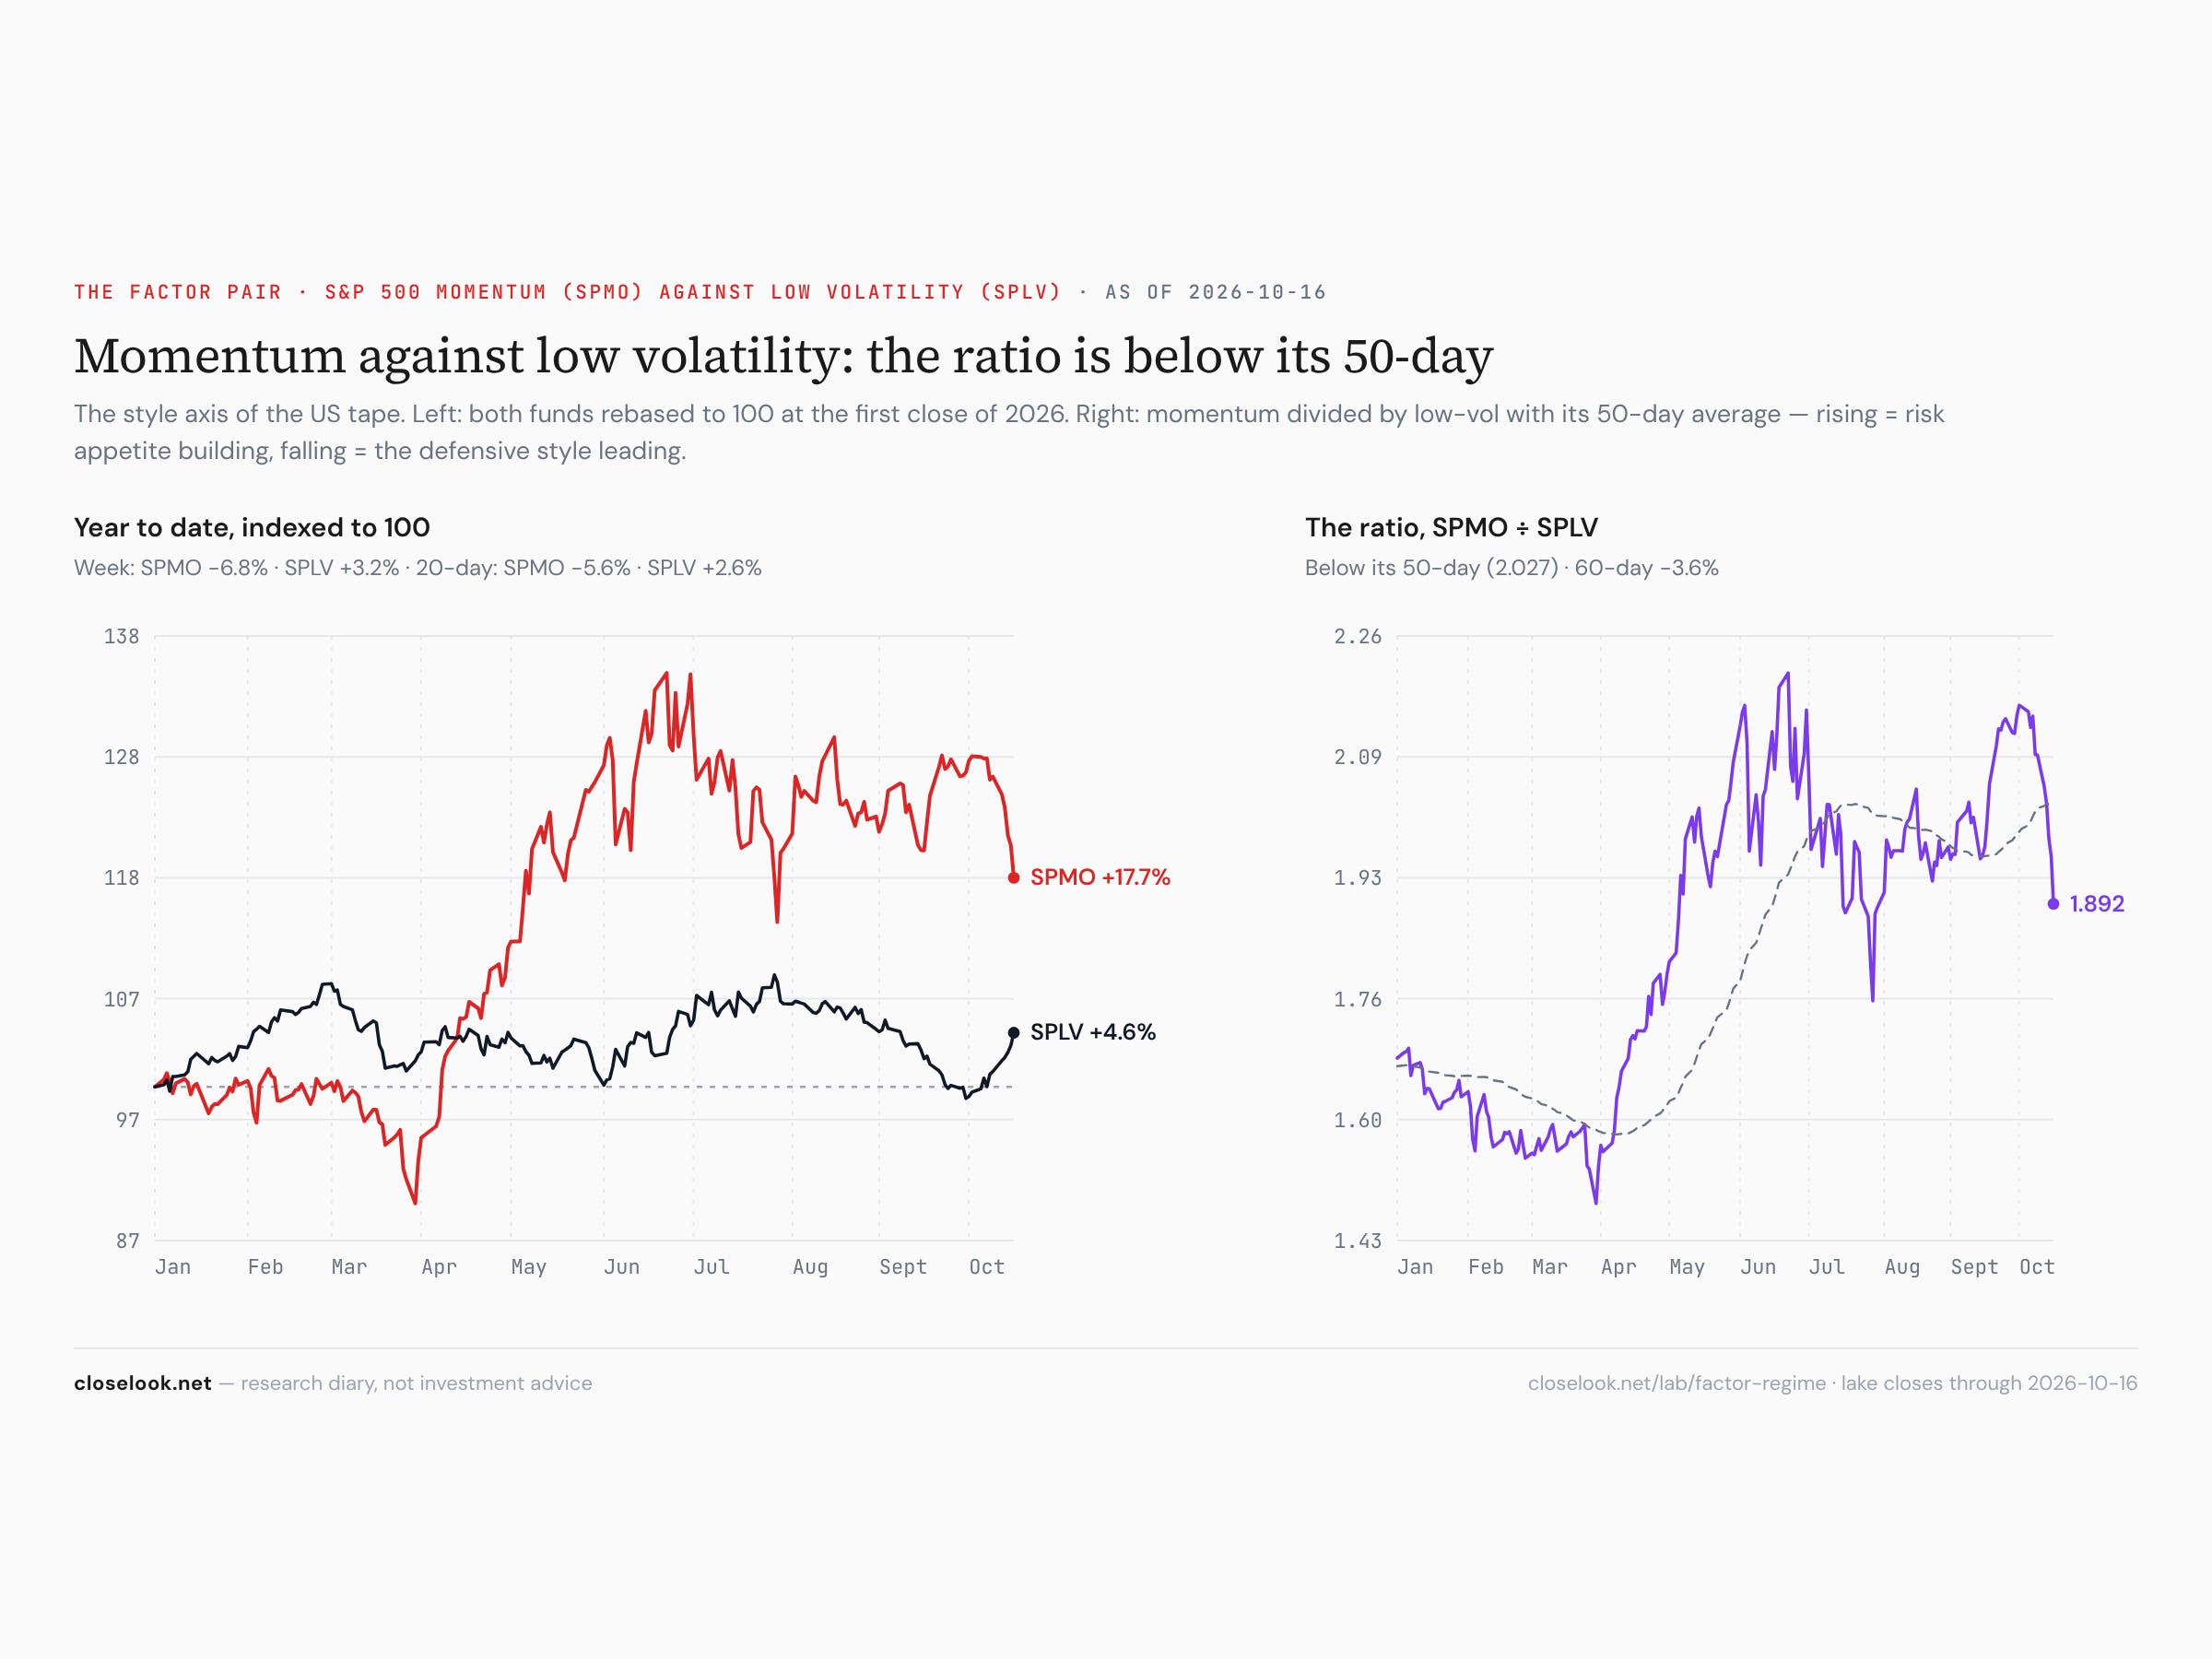
Momentum against low volatility — the turn. Momentum fell 6.79%, low volatility rose 3.24%. The ratio dropped below its 50-day average — from an indexed 166.4 to 150.2 — and the factor board now reads “defensive rotation — low-vol leading, regime-change watch.” It is still in the 82nd percentile of its range. One week does not end a momentum regime; it does mark the first real crack in it.
The tech ETFs we carry
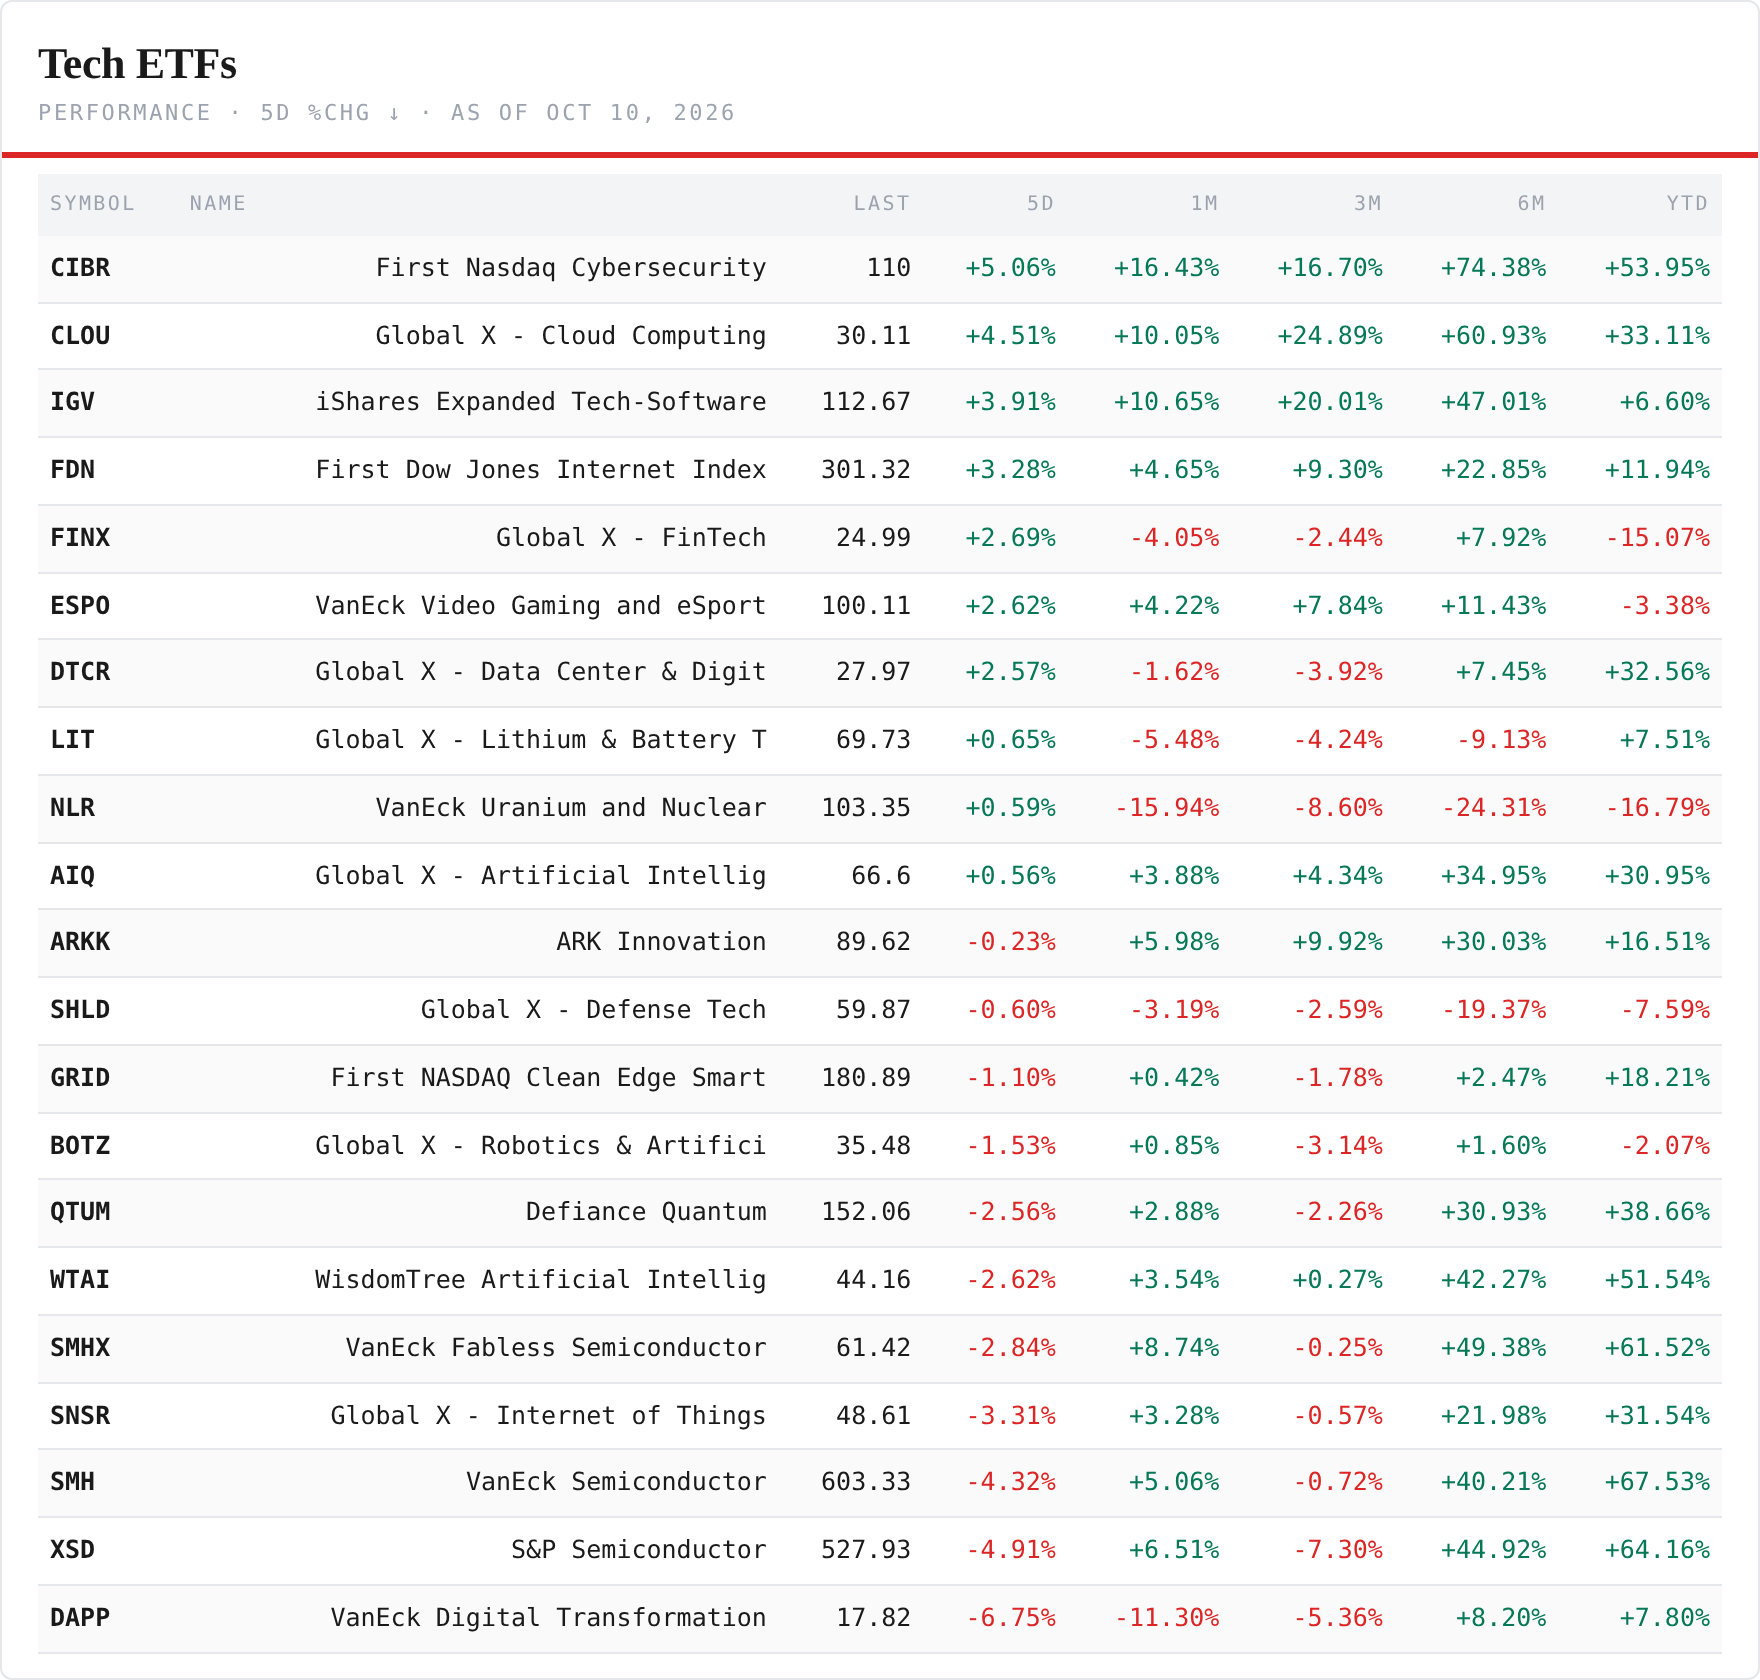
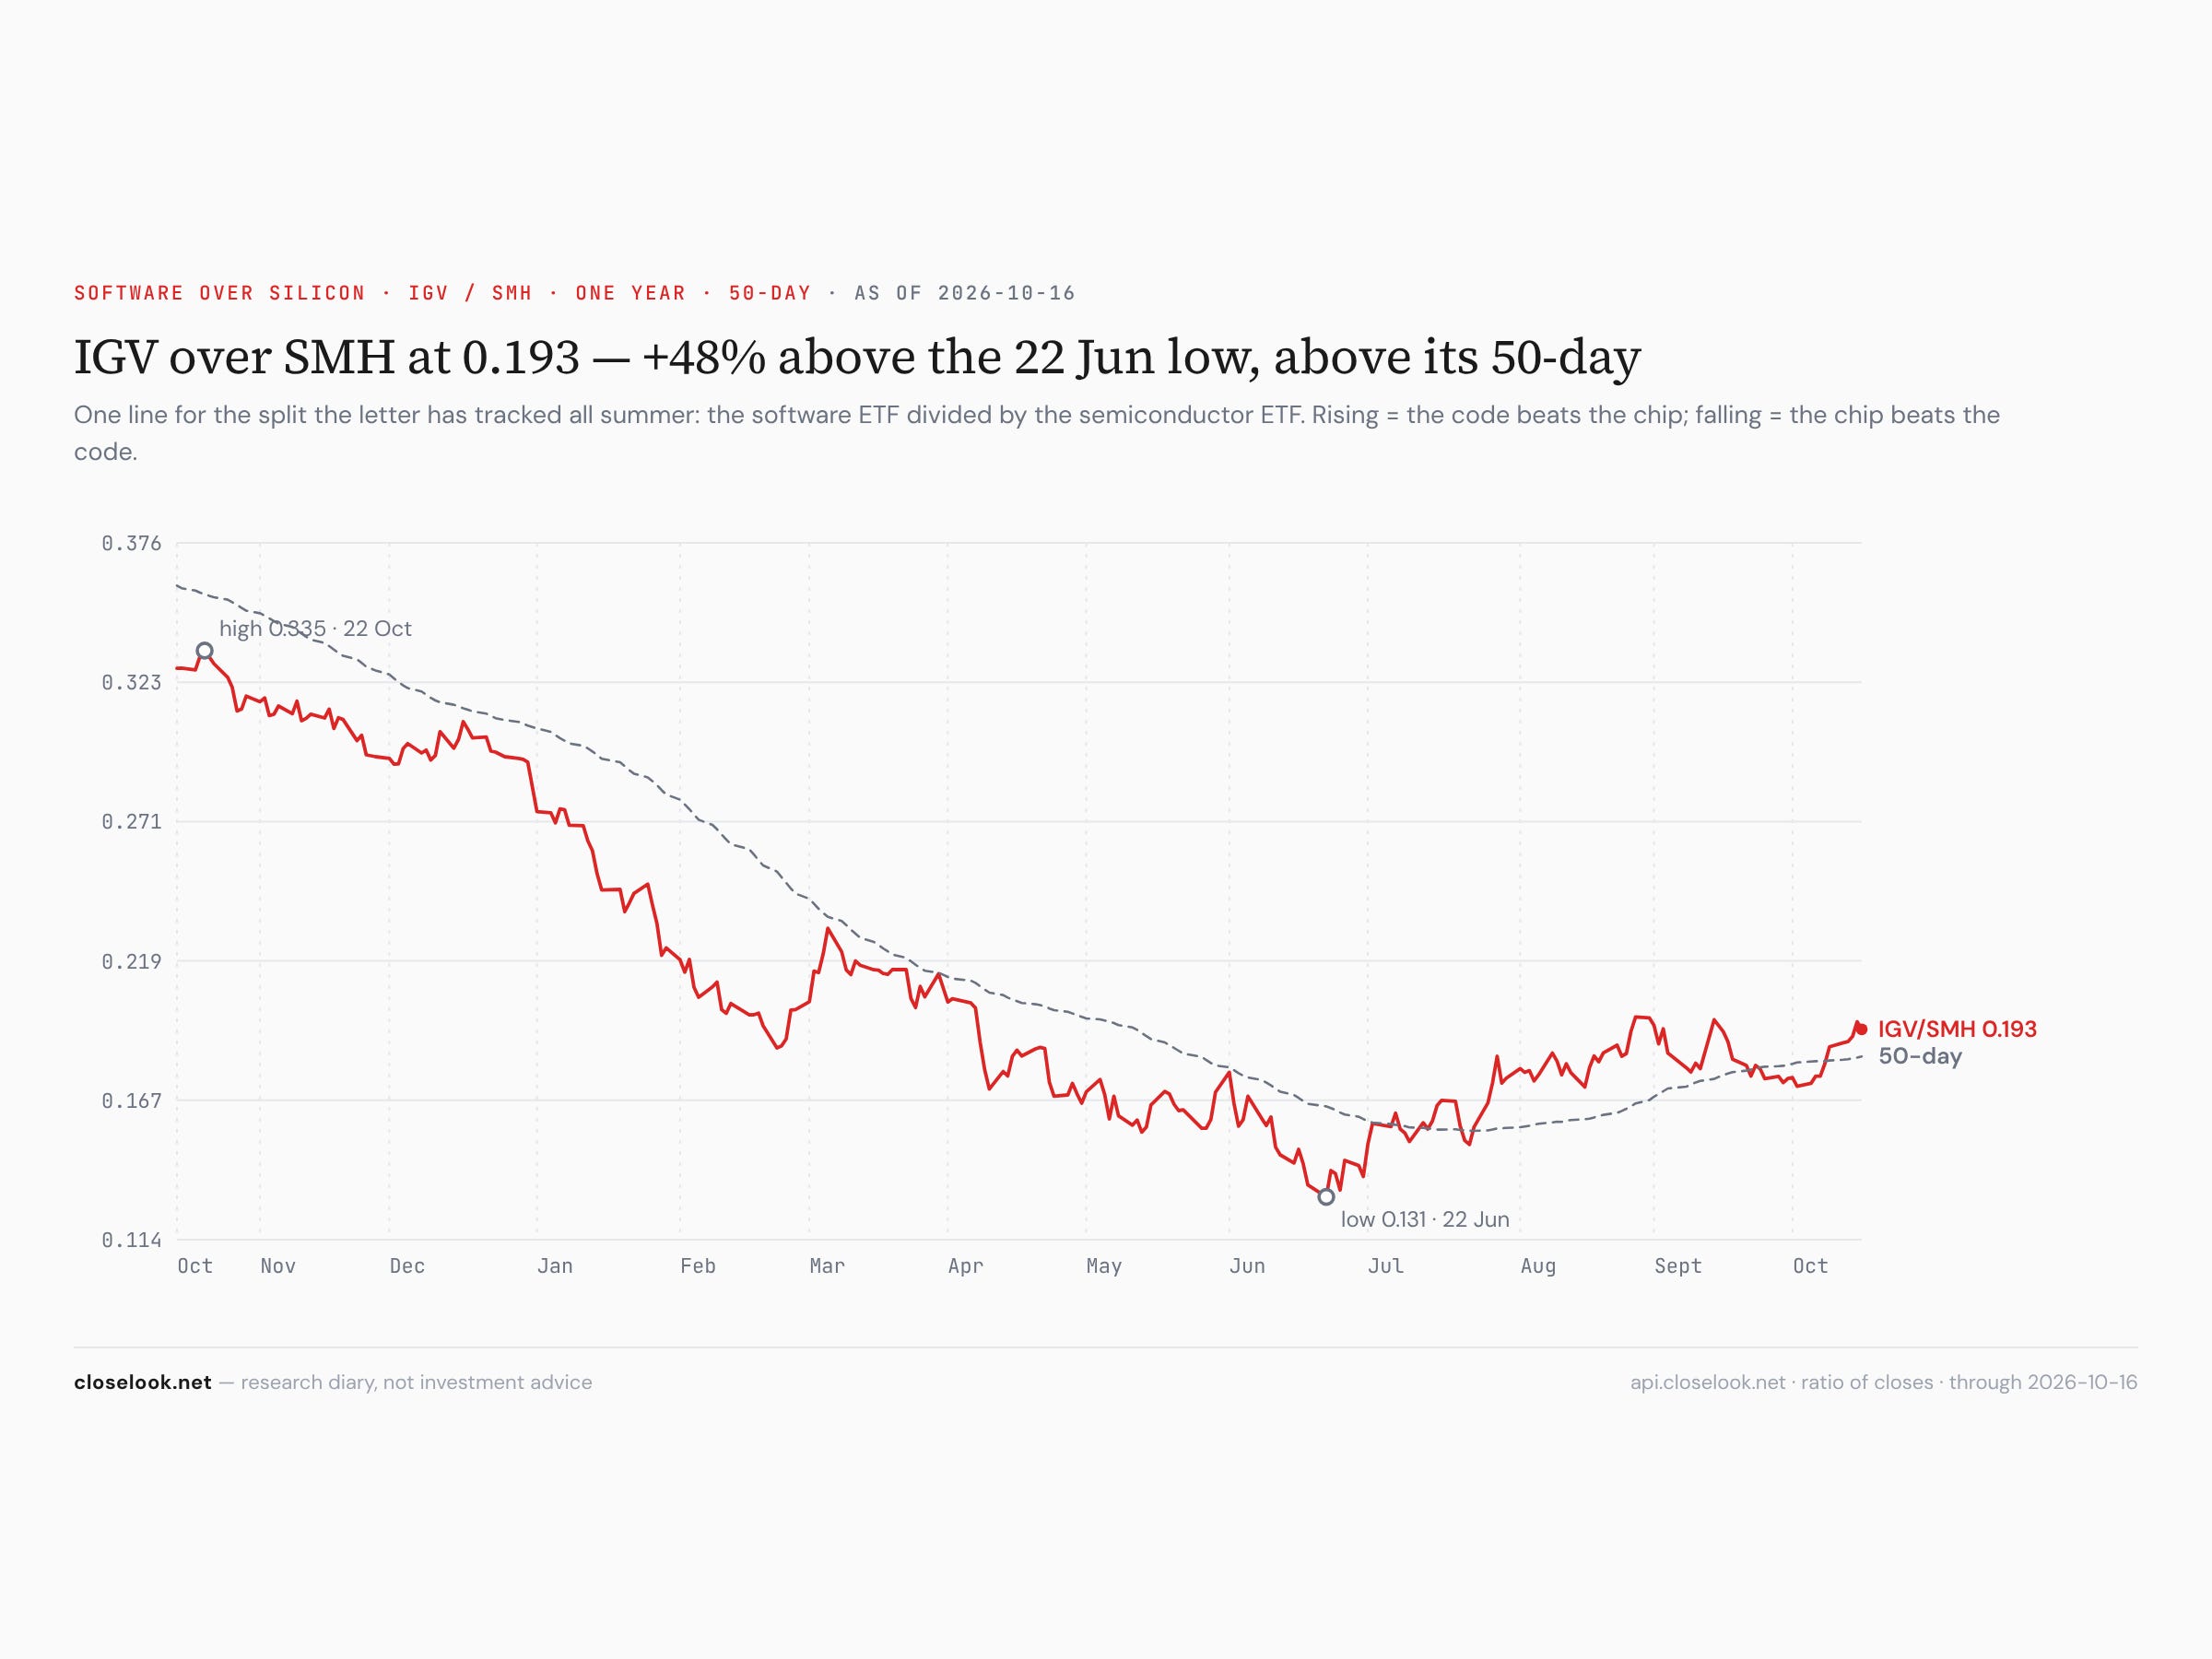
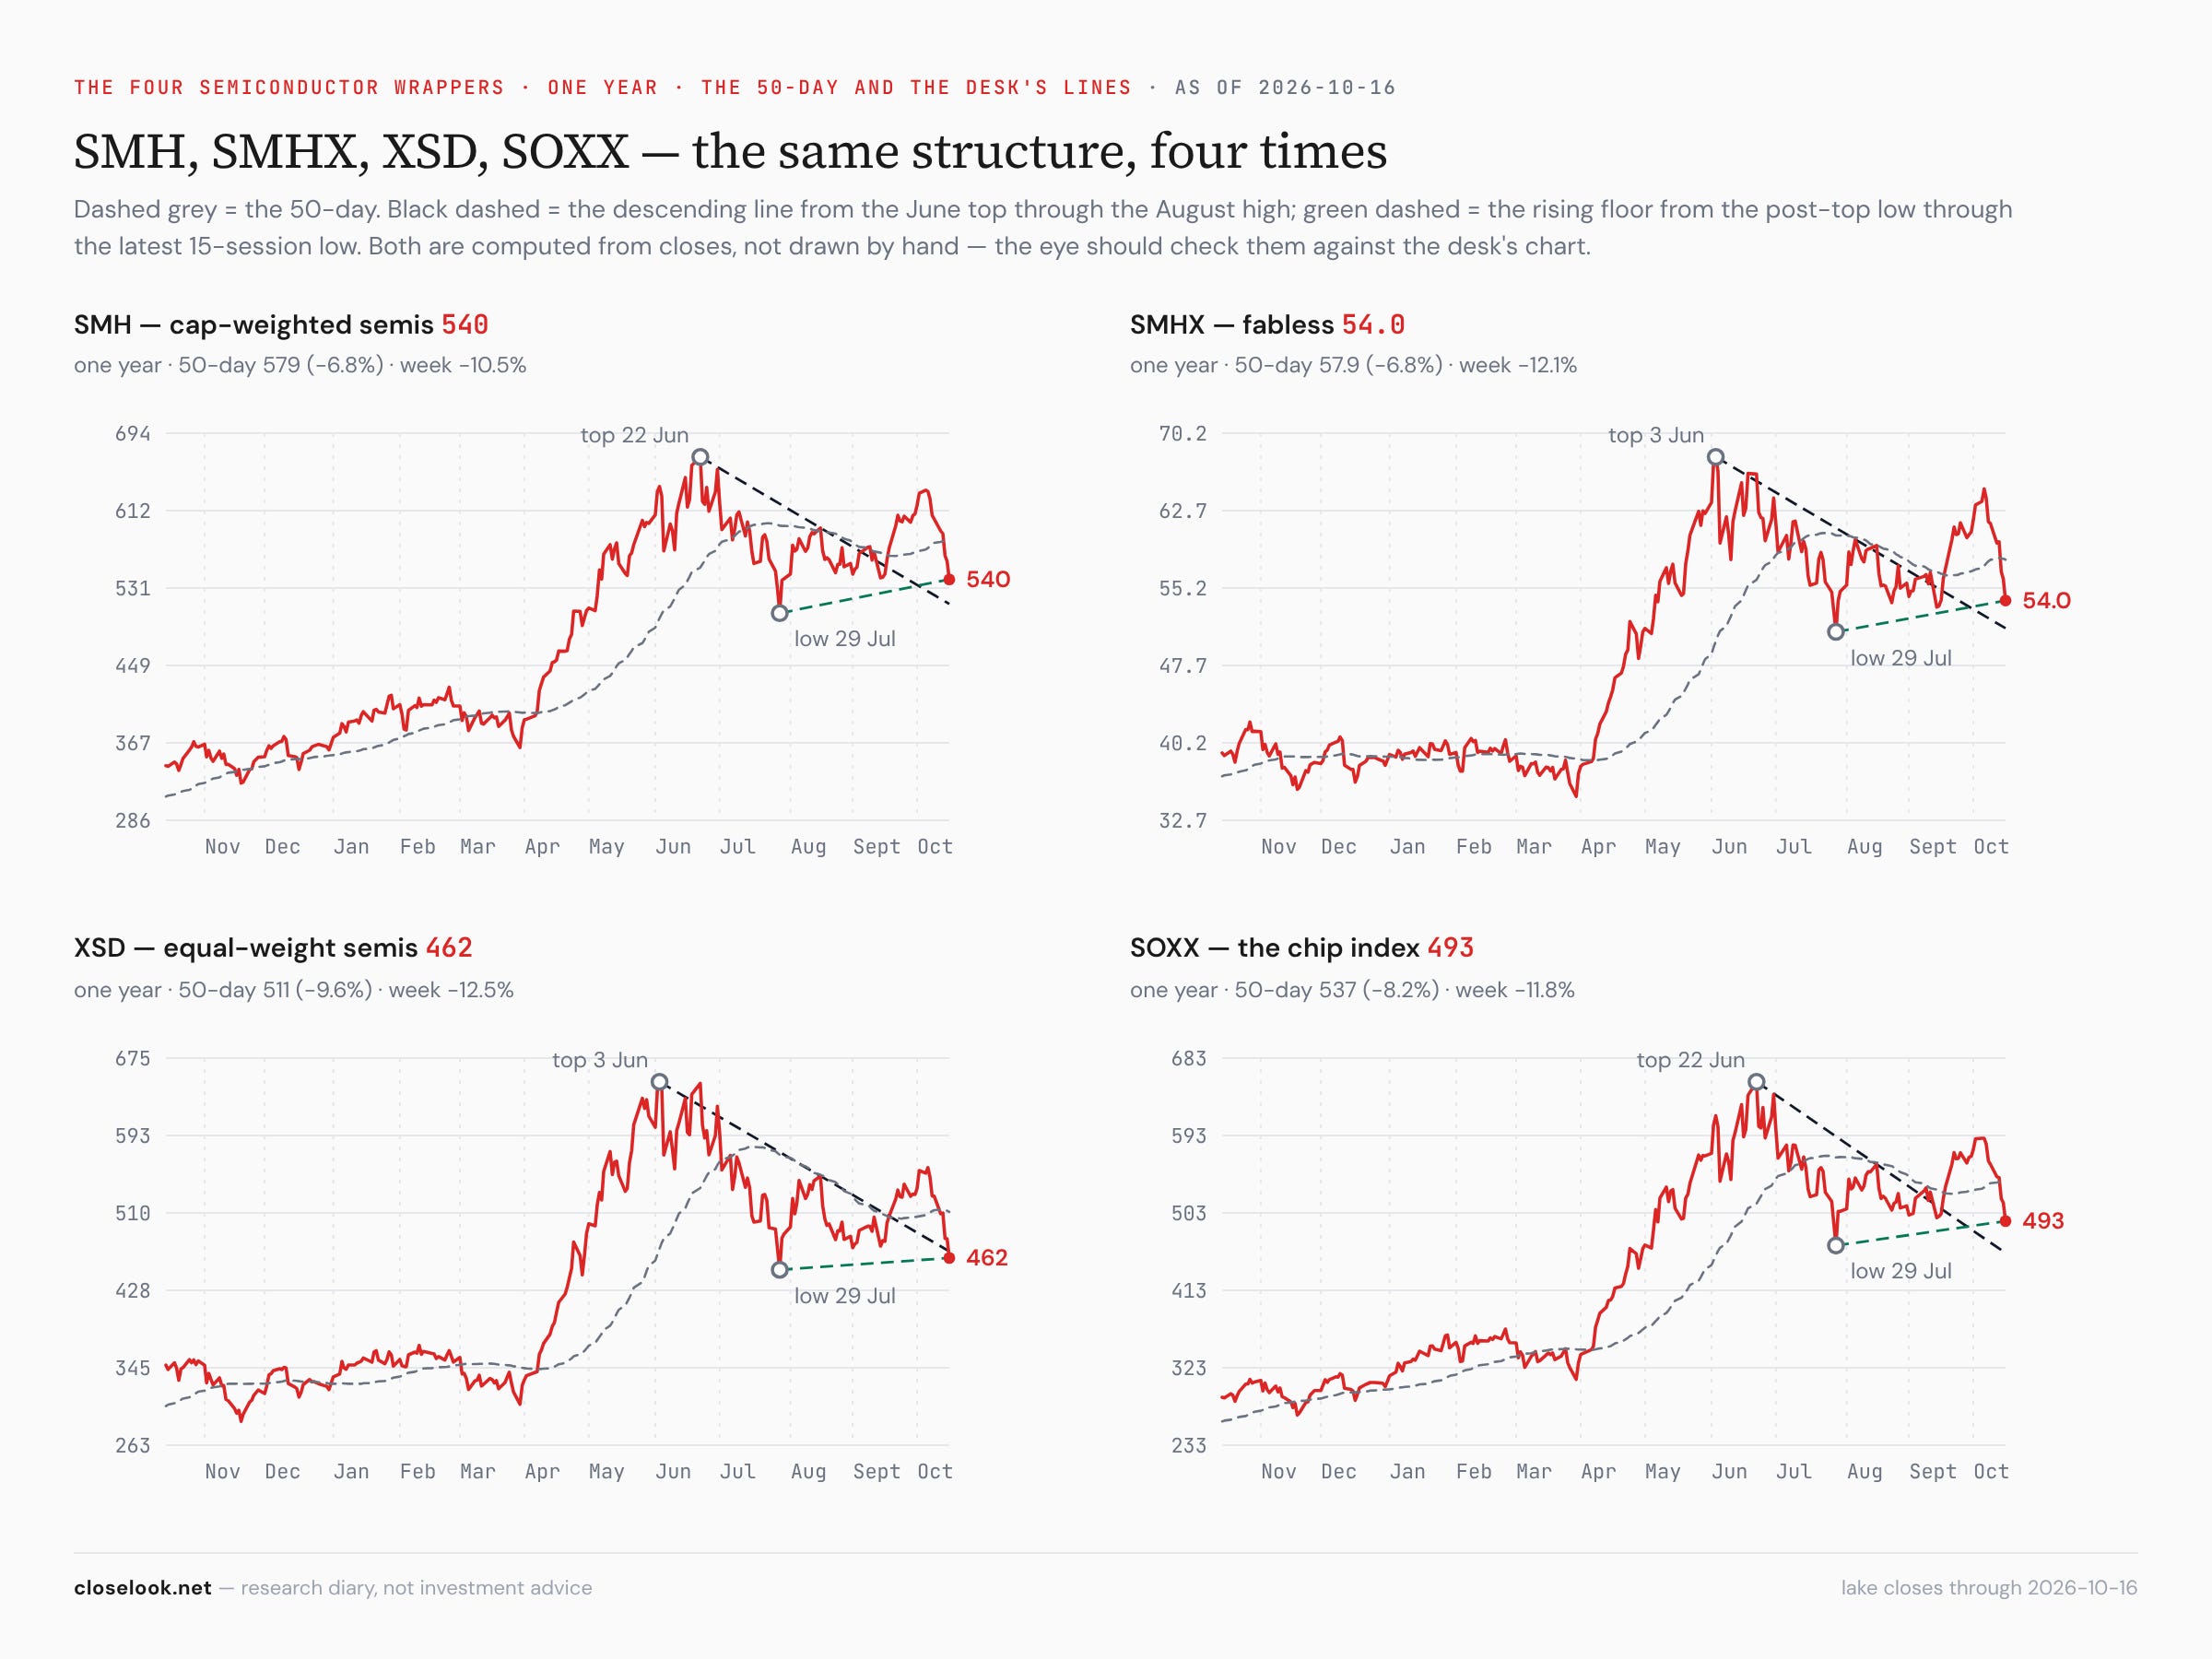
Nineteen of twenty-one red. XSD −12.48%, SMHX −12.14%, SOXX −11.80%, SMH −10.53%, cybersecurity −10.16%, software −7.39%, cloud −6.78%. Only defence tech (SHLD +2.69%) and gaming (ESPO +0.65%) rose. The software-over-semis ratio still rose 3.5% — software fell less — and is 48% above its June low, but this week software was not the shelter it was a week ago; it was the second wave of the selling.
The names in one line each. On the way down: Applied Optoelectronics −31.1%, Aehr −28.4%, Coherent −25.5%, Lumentum −25.3%, Nebius −25.2%, CoreWeave −25.2%, Fabrinet −25.3%, HPE −25.0%, Credo −21.6%, Okta −19.3%, Applied Materials −19.3%, Palo Alto −18.3%, CrowdStrike −17.3%, Dell −17.6%, Snowflake −16.8%, Micron −14.6%, AMD −13.1%. Up: Intuit +7.4%, Eli Lilly +6.6%, Stryker +6.3%, Chevron +6.1%, Exxon +5.9%, Salesforce +5.1%, Veeva +4.8%, Amgen +4.3%, Apple +2.0%. The software names that rose were the out-of-favour ones — Intuit is still down 48% on the year; the ones that had led the year were sold.
The four indices: Dow, S&P 500, Nasdaq 100, Russell 2000
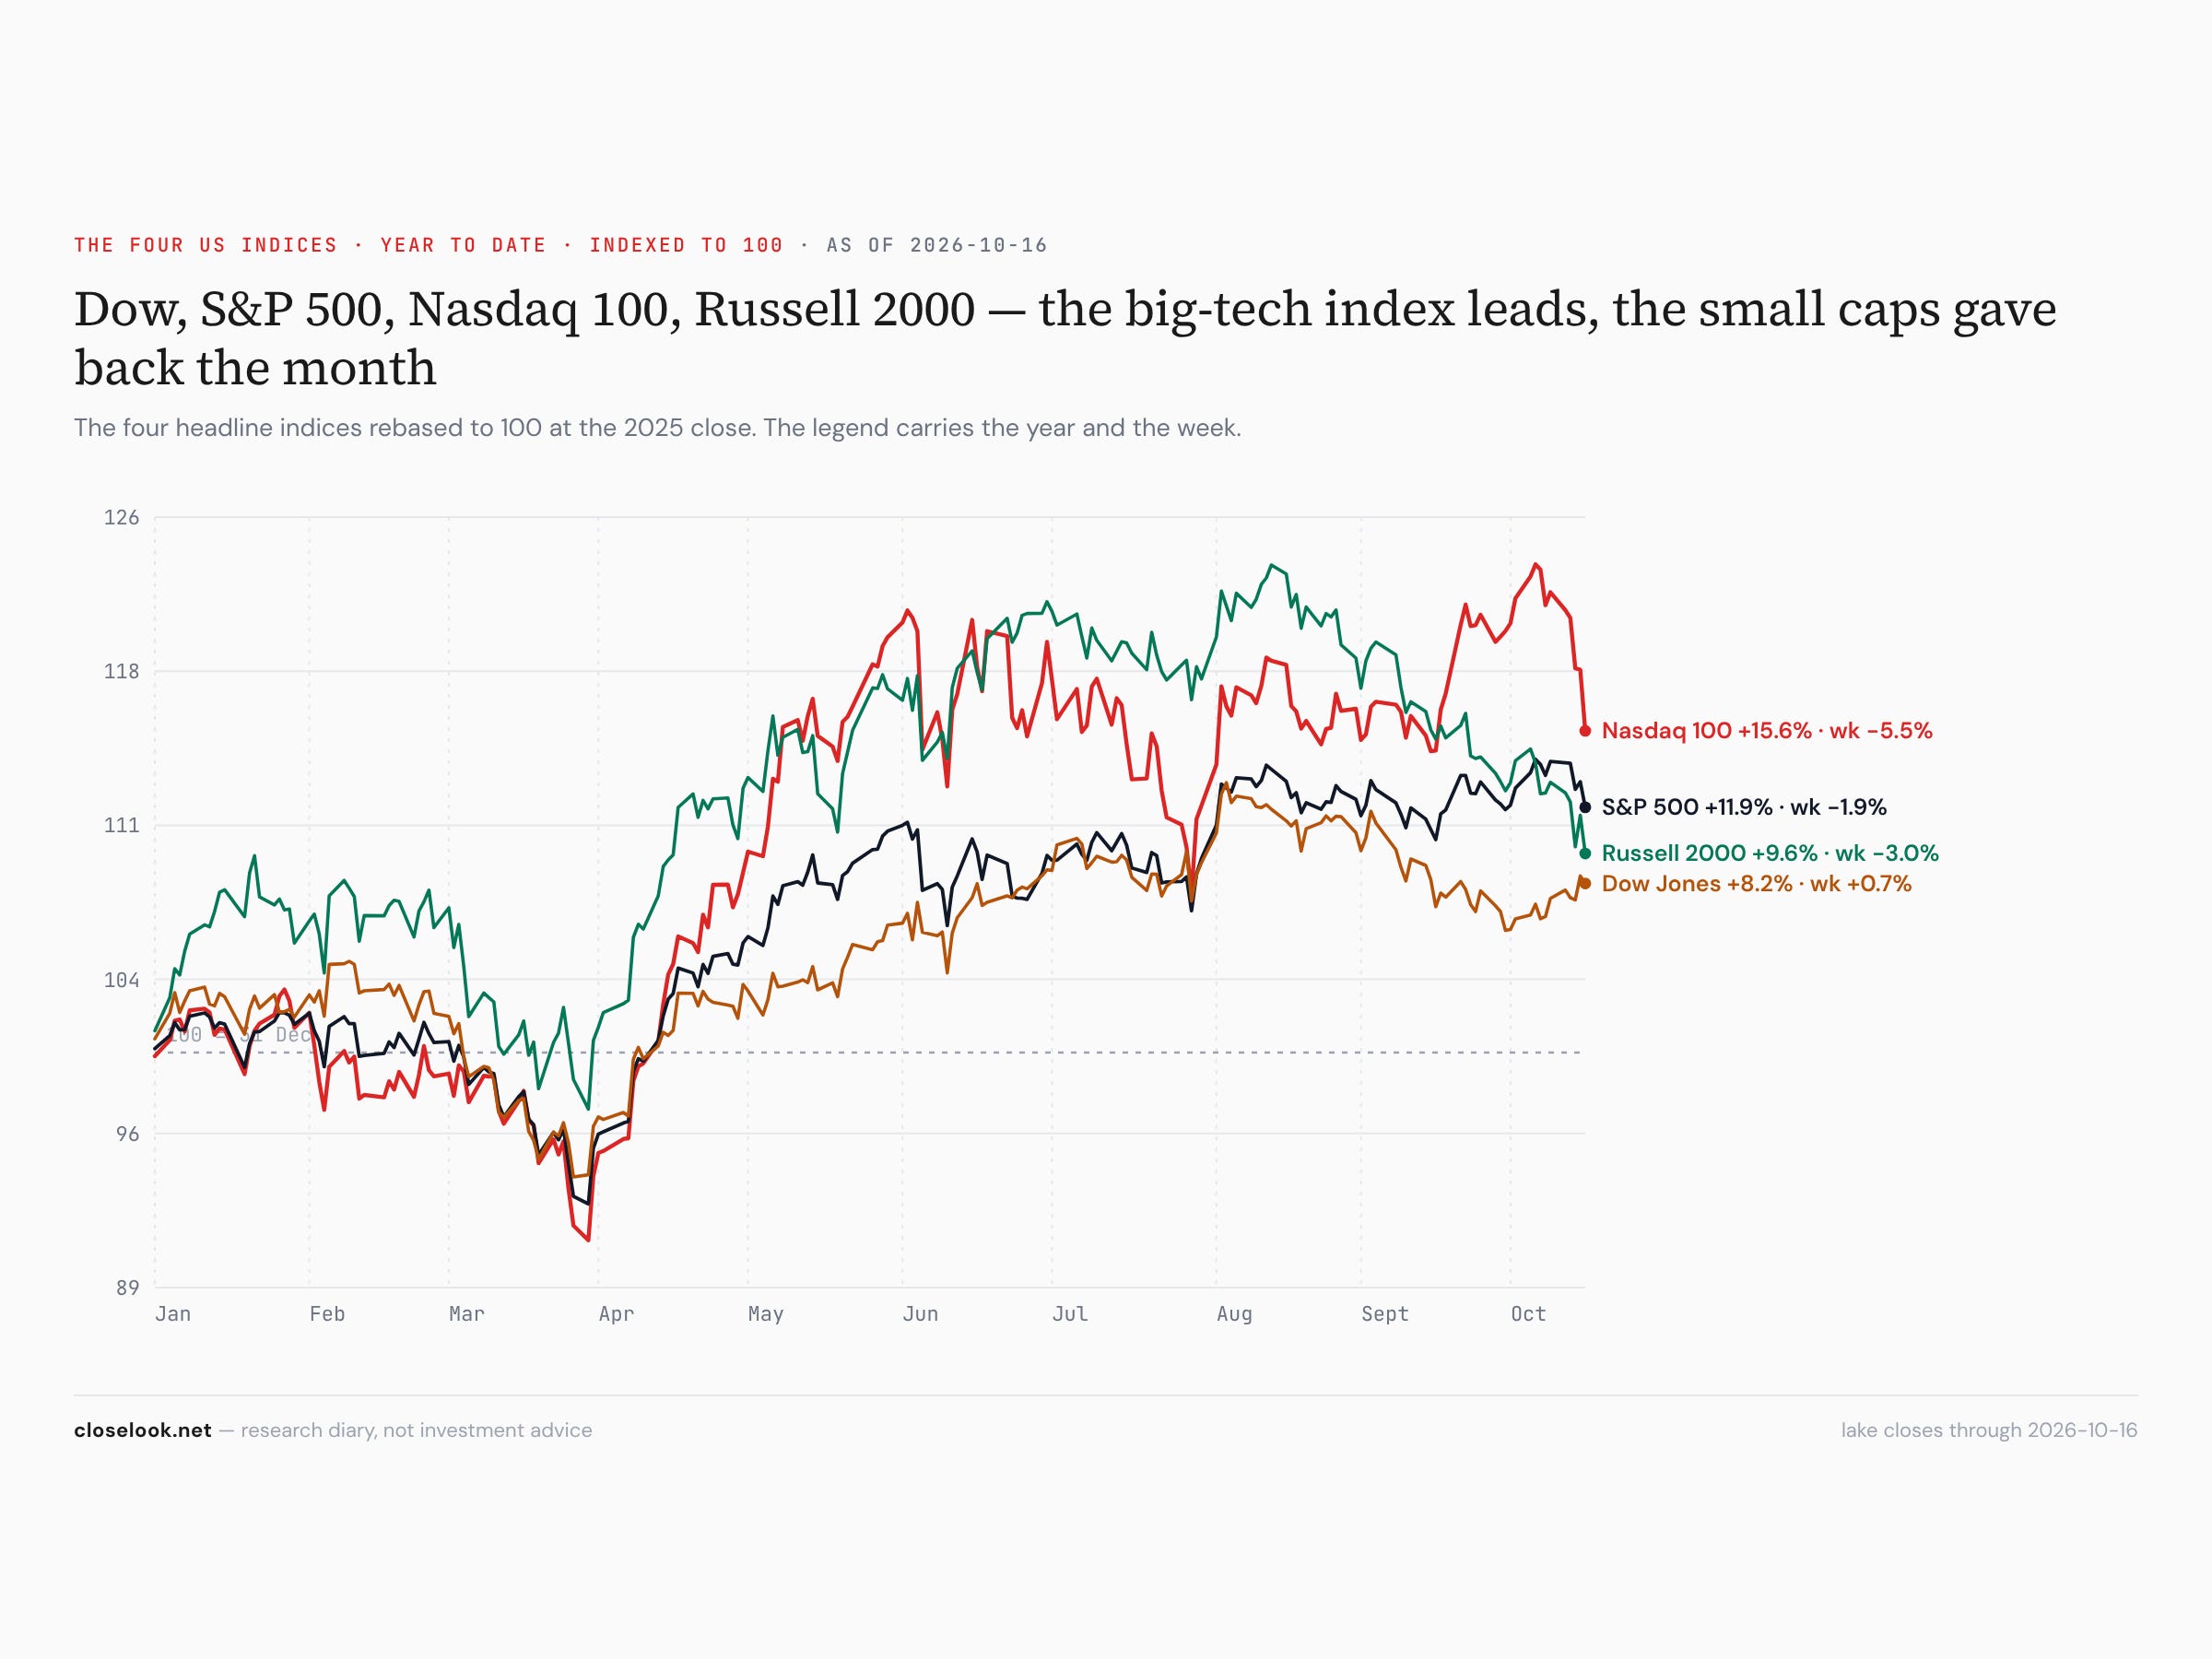
The S&P 500 −1.97%, the Nasdaq 100 −5.52%, the Russell 2000 −3.05%. The Dow held up best: it gained 1.1% on Thursday and was still green at midday on Friday while the Nasdaq fell, because it holds more banks, health care and consumer names and fewer chips. The S&P is 2.0% under its 6 October record, the Nasdaq 6.6% under its own. The Russell is 6.4% under its 50-day average.
The Treasury curve, one month to thirty years
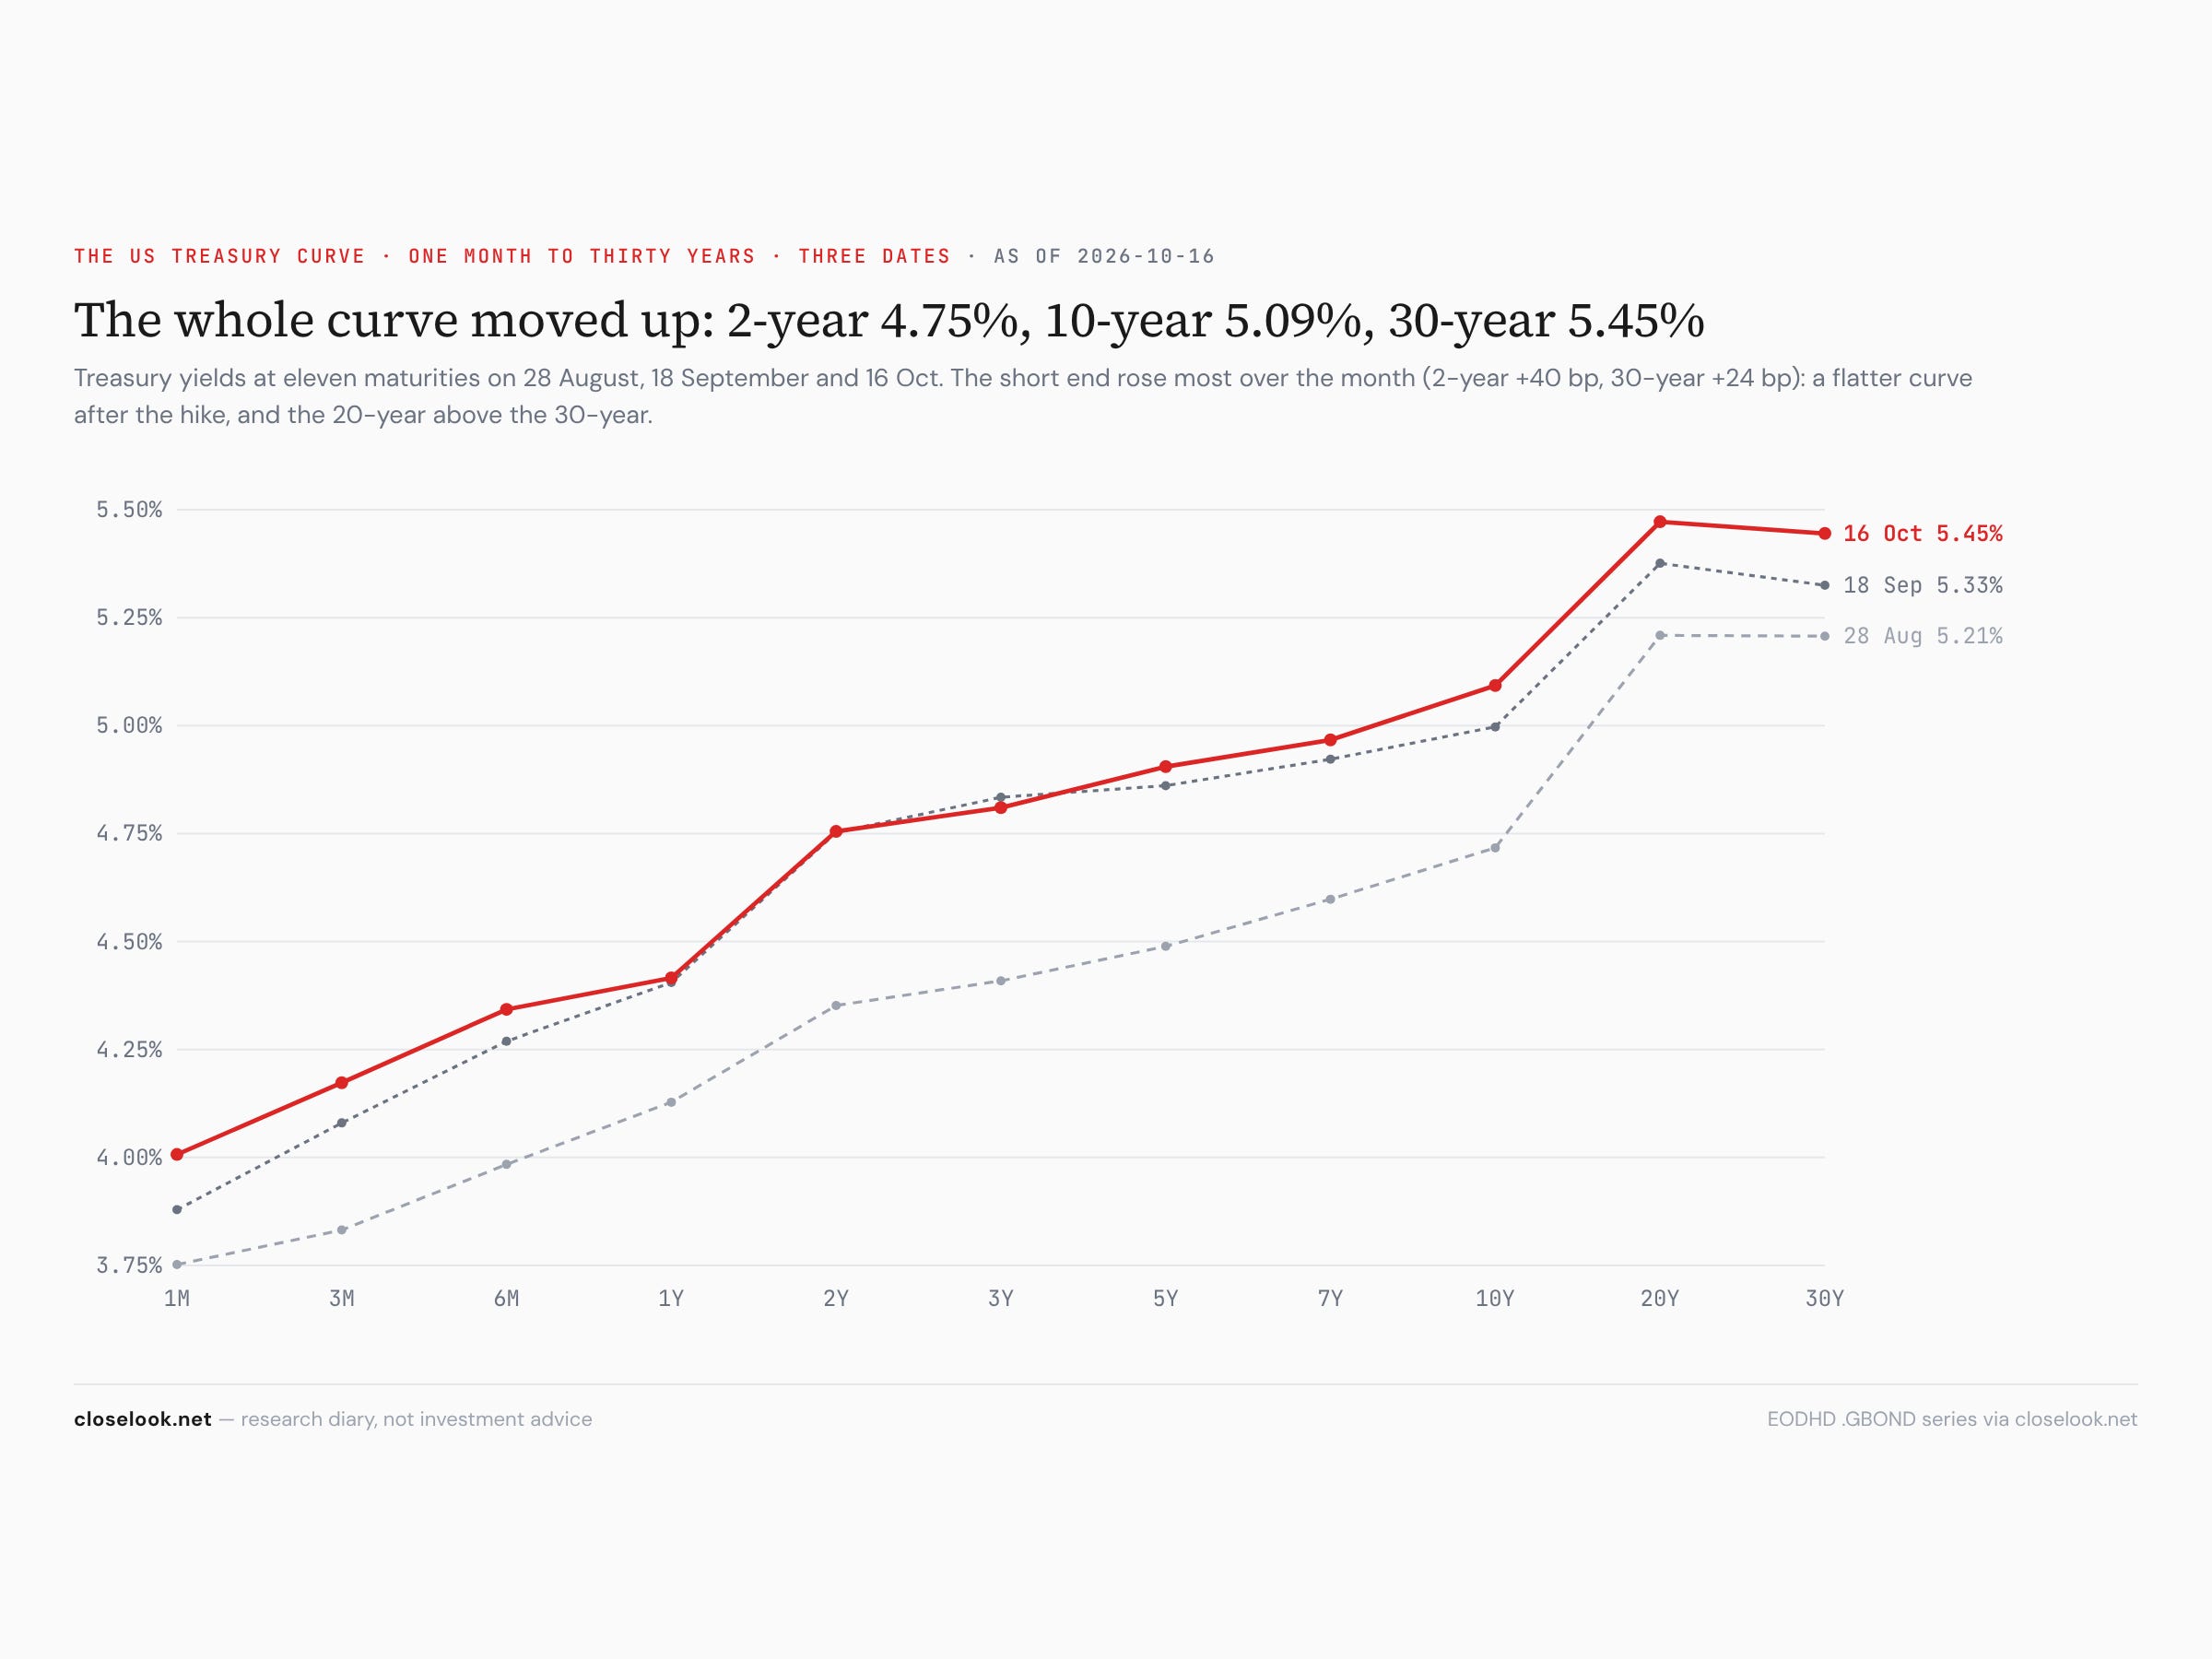
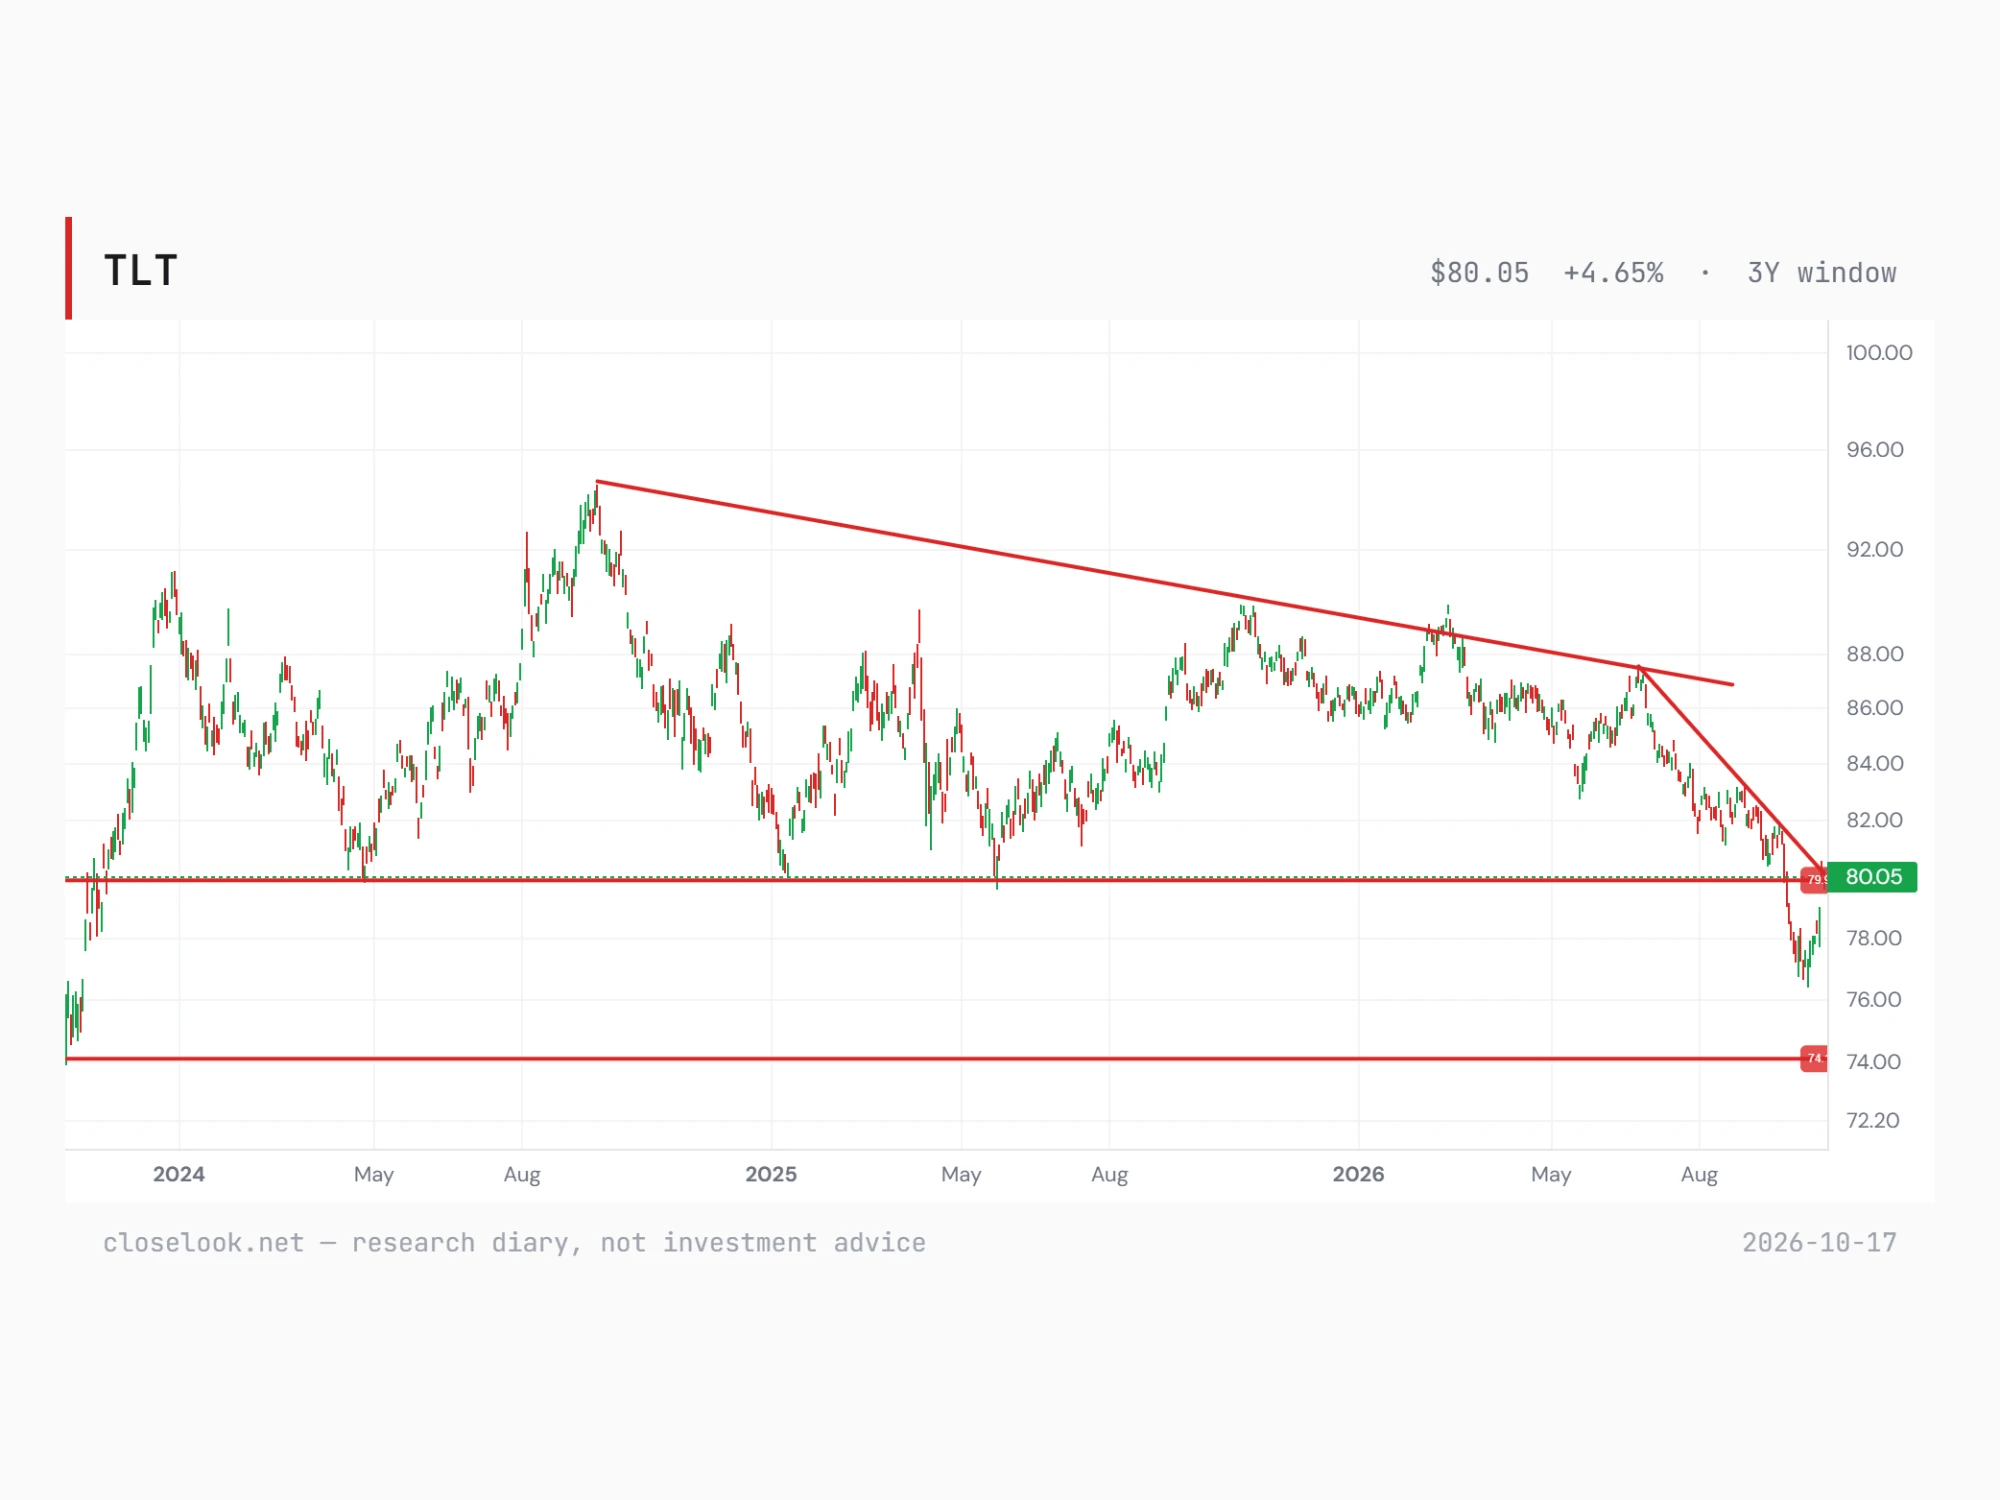
The ten-year yield fell from 5.24% to 5.10% on the week, the thirty-year to about 5.43%, the two-year to about 4.72%. It fell in a week of hot inflation numbers: consumer prices rose 3.7% on the year in September, core 2.6%, both above forecast (Wednesday); producer prices jumped 1.3% in the month (Thursday). The bond market looked past them — the ten-year touched 5.24% on Wednesday and fell to 5.10% on Thursday, as consumer spending outside food and energy stalled. The long-bond fund TLT rose 2.65% to 80.05, with a gap higher on Thursday on the heaviest volume of the month.
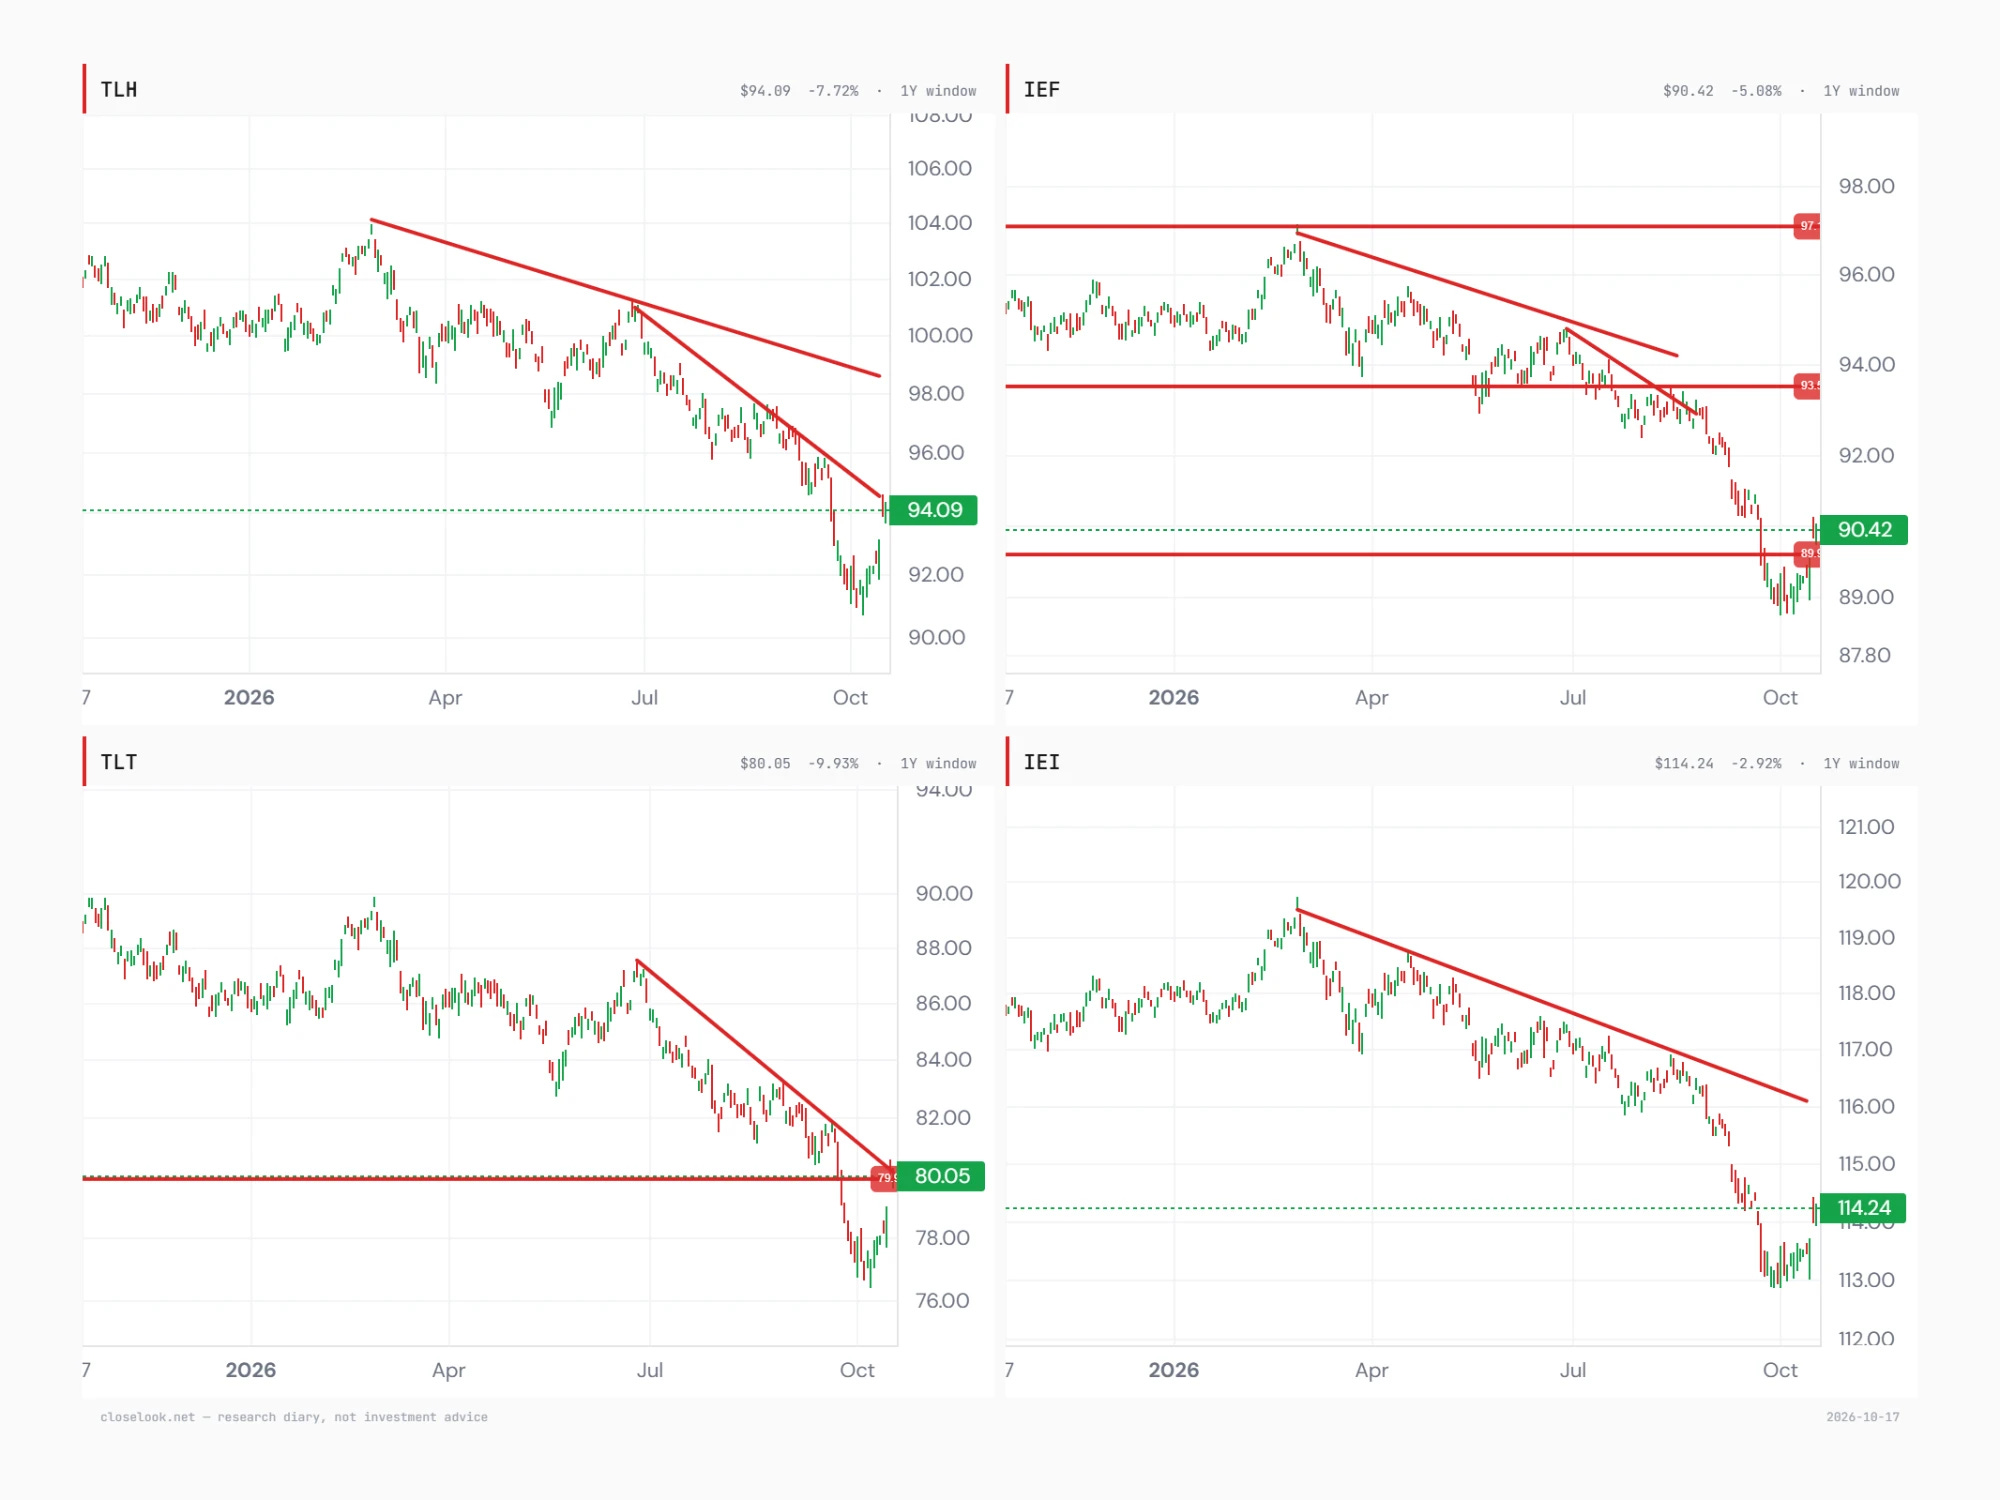
The editor’s read of the bond chart: TLT may have made an initial breakaway gap. On Thursday the fund opened at 80.47 after closing at 78.89 the day before, and the day’s low of 79.93 never came back to Wednesday’s high of 79.01 — a gap of almost a dollar, on 86.7 million shares, the heaviest volume of the month. Friday traded down to 79.67 and closed at 80.05, so the gap is still open. That close sits on the two lines on his three-year chart: the falling line from the 29 June high (87.45) and the 79.9 floor the fund held in 2024 and 2025 and first closed under on 24 September. 74 is the line below. His point: a breakaway gap starts a move; if the move is real, a second gap higher — a running gap — may follow soon, and the next test is a close clearly above the falling line. All four Treasury funds gapped higher on Thursday and held it on Friday: TLH (10–20 years) at 94.09 on its own falling line, IEF (7–10 years) at 90.42 back above its 89.9 line with 93.5 next, IEI (3–7 years) at 114.24.
The dollar
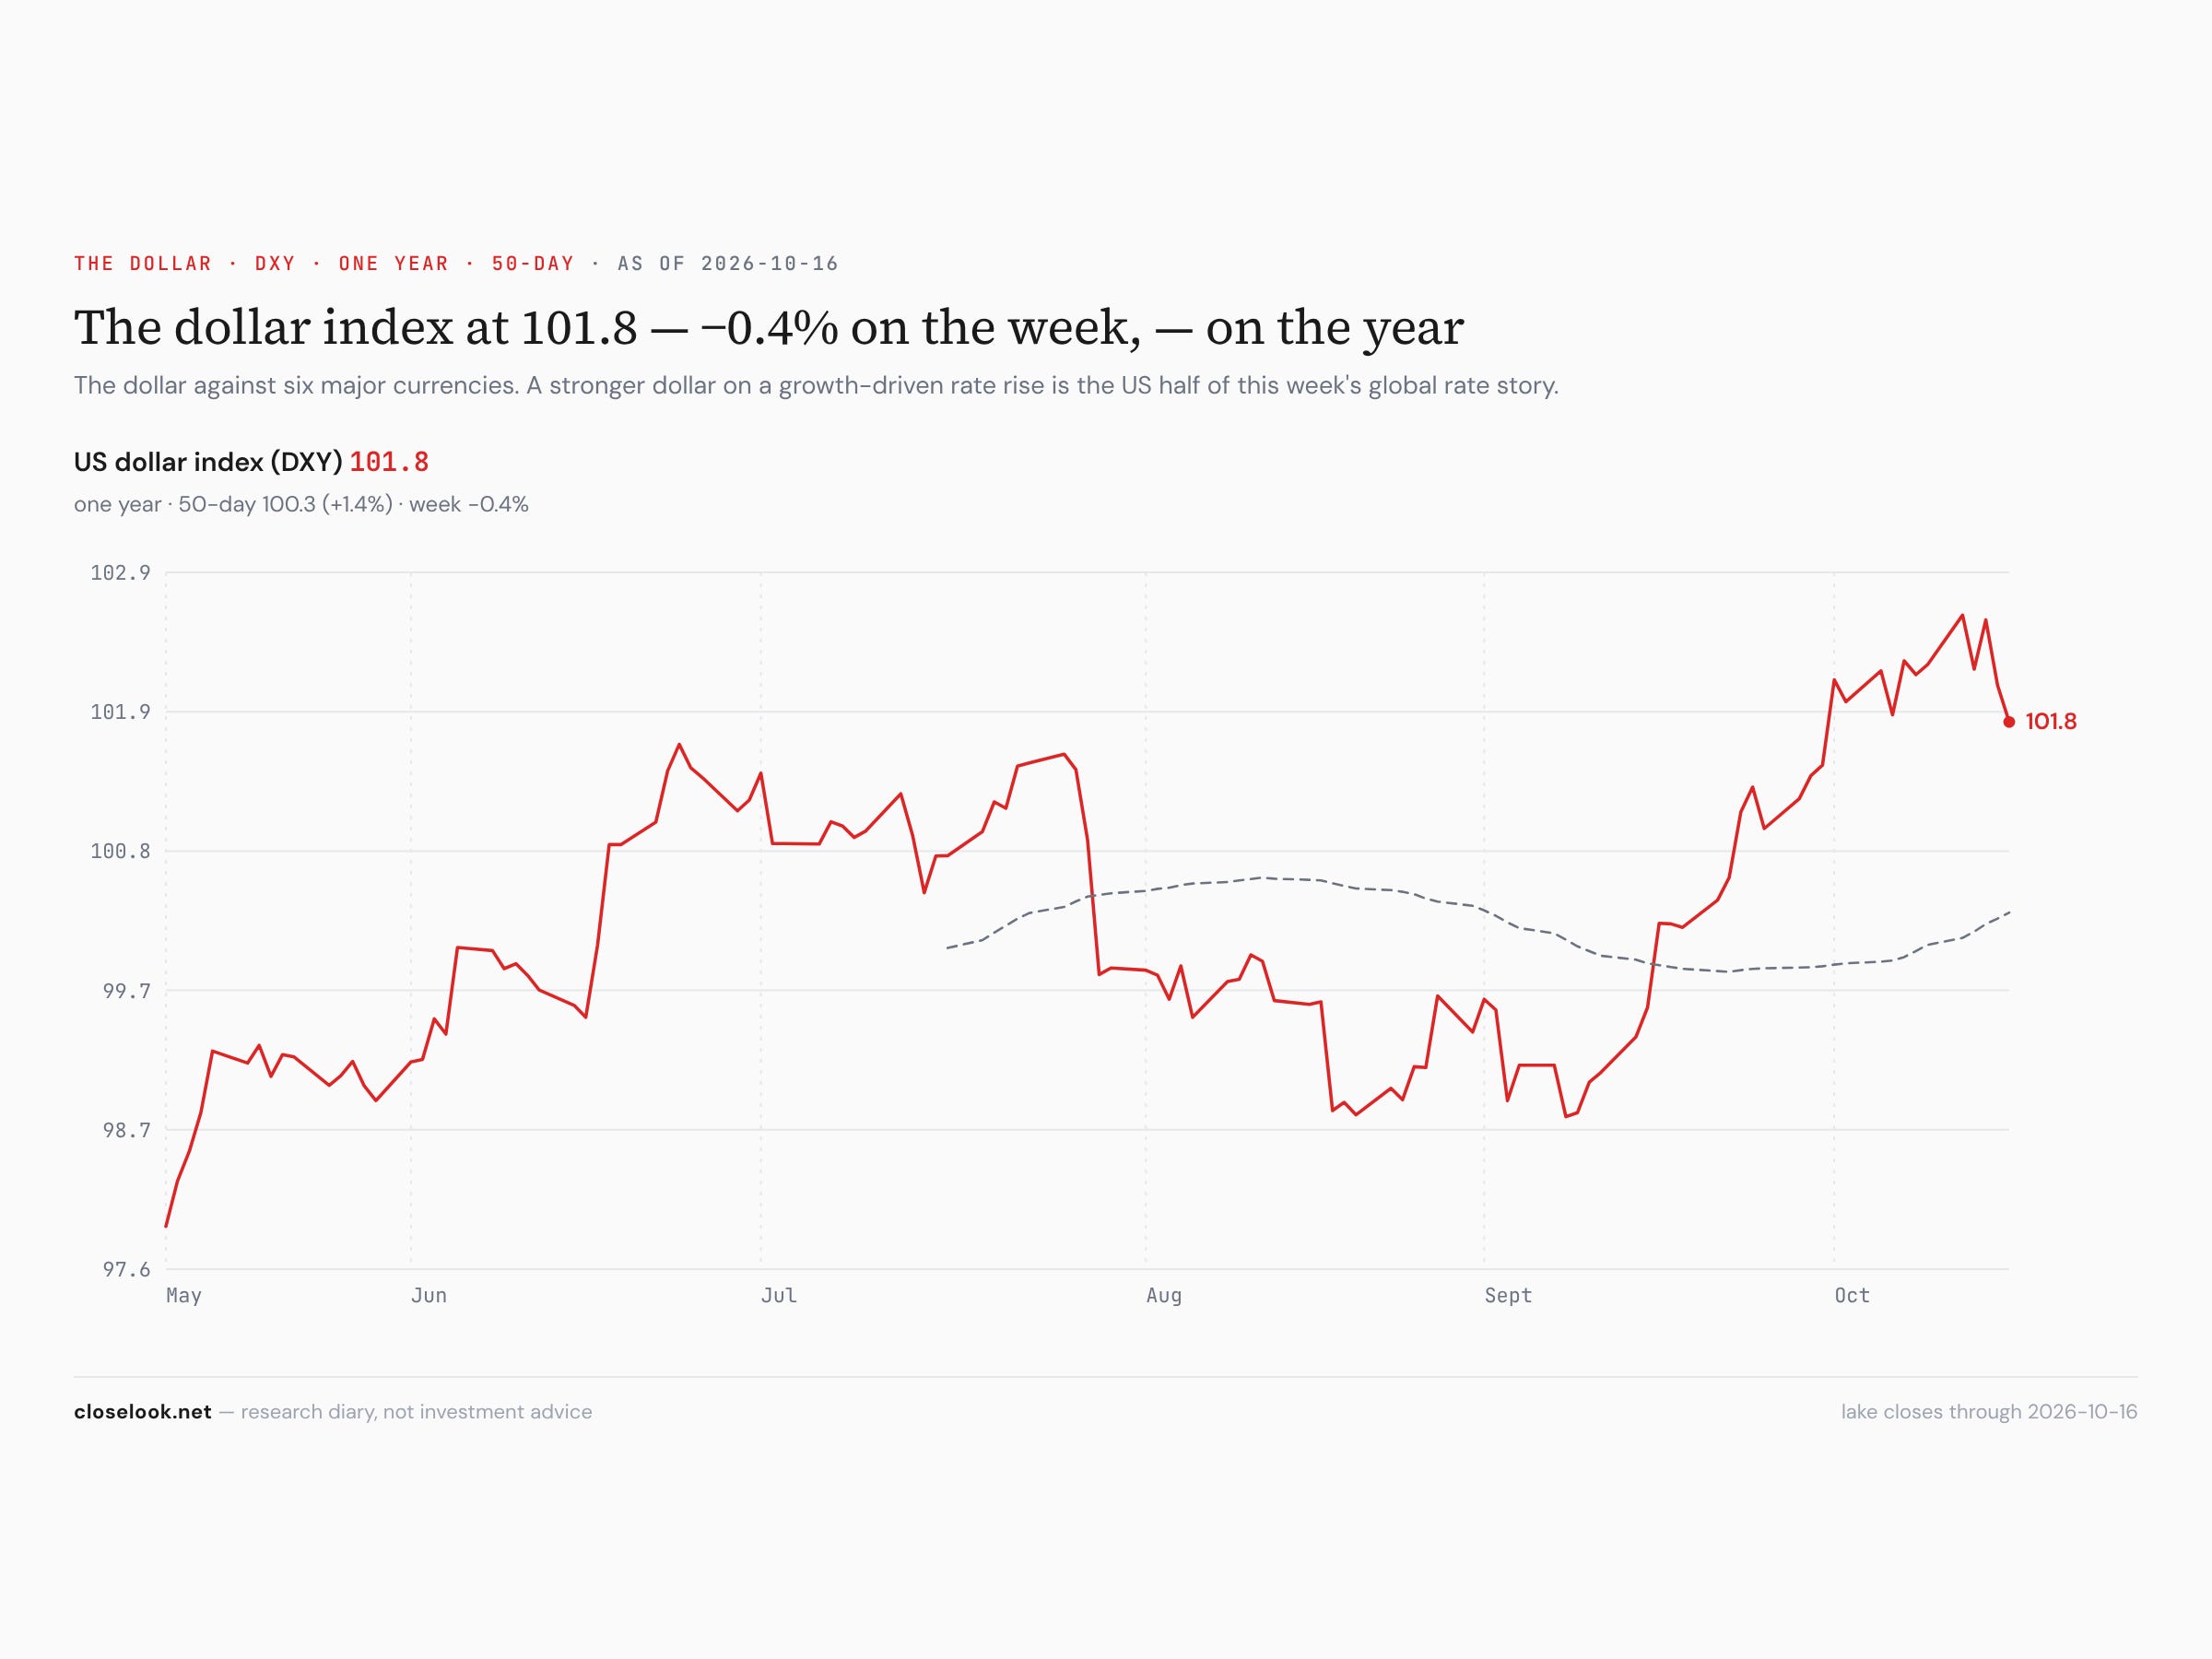
The dollar fund slipped 0.34% to 28.92 while the yields fell. A softer dollar and lower long yields in the same week is what a market pricing slower growth looks like.
2 · The State
The week, in order. Monday: Korea’s market, back from two days off, fell 3.5% to catch up with the US chip selling; in New York memory and optics were sold again — Lumentum −7.7% and SanDisk −6.5% at midday — while Meta rose 3.8%. Tuesday: the Kospi broke its 18-month uptrend; J&J and Citi fell after beating, JPMorgan recovered after missing; the chip fund closed back under its 50-day. Wednesday: hot inflation, the ten-year at 5.24%, the chip fund −3.7% and 20% under its June high, software −2.4%, Oracle −7.5%, AMD −4.9%; health care +2.0% the only shelter. ASML reported a record quarter and said it is sold out into 2028. Thursday: TSMC beat but called itself “prudent” on 2027; the chip fund −2.0%, Dell −7.7%; software was bought, ServiceNow +5.4%; the ten-year fell to 5.10%; health care +2.5% led again. Friday: the whole complex sold — chips −2.1% for the eighth day, software −4.3%, CrowdStrike, Snowflake and Palo Alto −7% — while the Dow stayed green and the money stayed in staples, banks and utilities.
The mechanism, named: profit-taking in the winners, not a flight from stocks. A sell-everything week takes the equal-weight S&P down with the index; this one did not. The S&P fell 2%, the average stock rose. The money went from the places it had made the most this year — chips +86% on the year before the week, the AI builder index +103% — to the places it had made the least: staples, health care, energy. Two things pushed it. The AI supply chain got its first hard question about 2027: TSMC prudent, an earlier report that put OpenAI’s revenue nearer 50 billion dollars than 70 billion. And a peak in rates with slower growth behind it — the ten-year off its 5.31% high of 5 October in a week of hot prices — favours companies that grow without a strong economy.
The channels, said plainly. The rising line from the 30 March low held every dip for six and a half months: in June, in July, in September. A break of it after the chips fell 25% from their June high is not a crash; it is the end of the easy part of the trend. What it changes is the stance — a dip that breaks the line is not bought the same way as a dip that holds it.
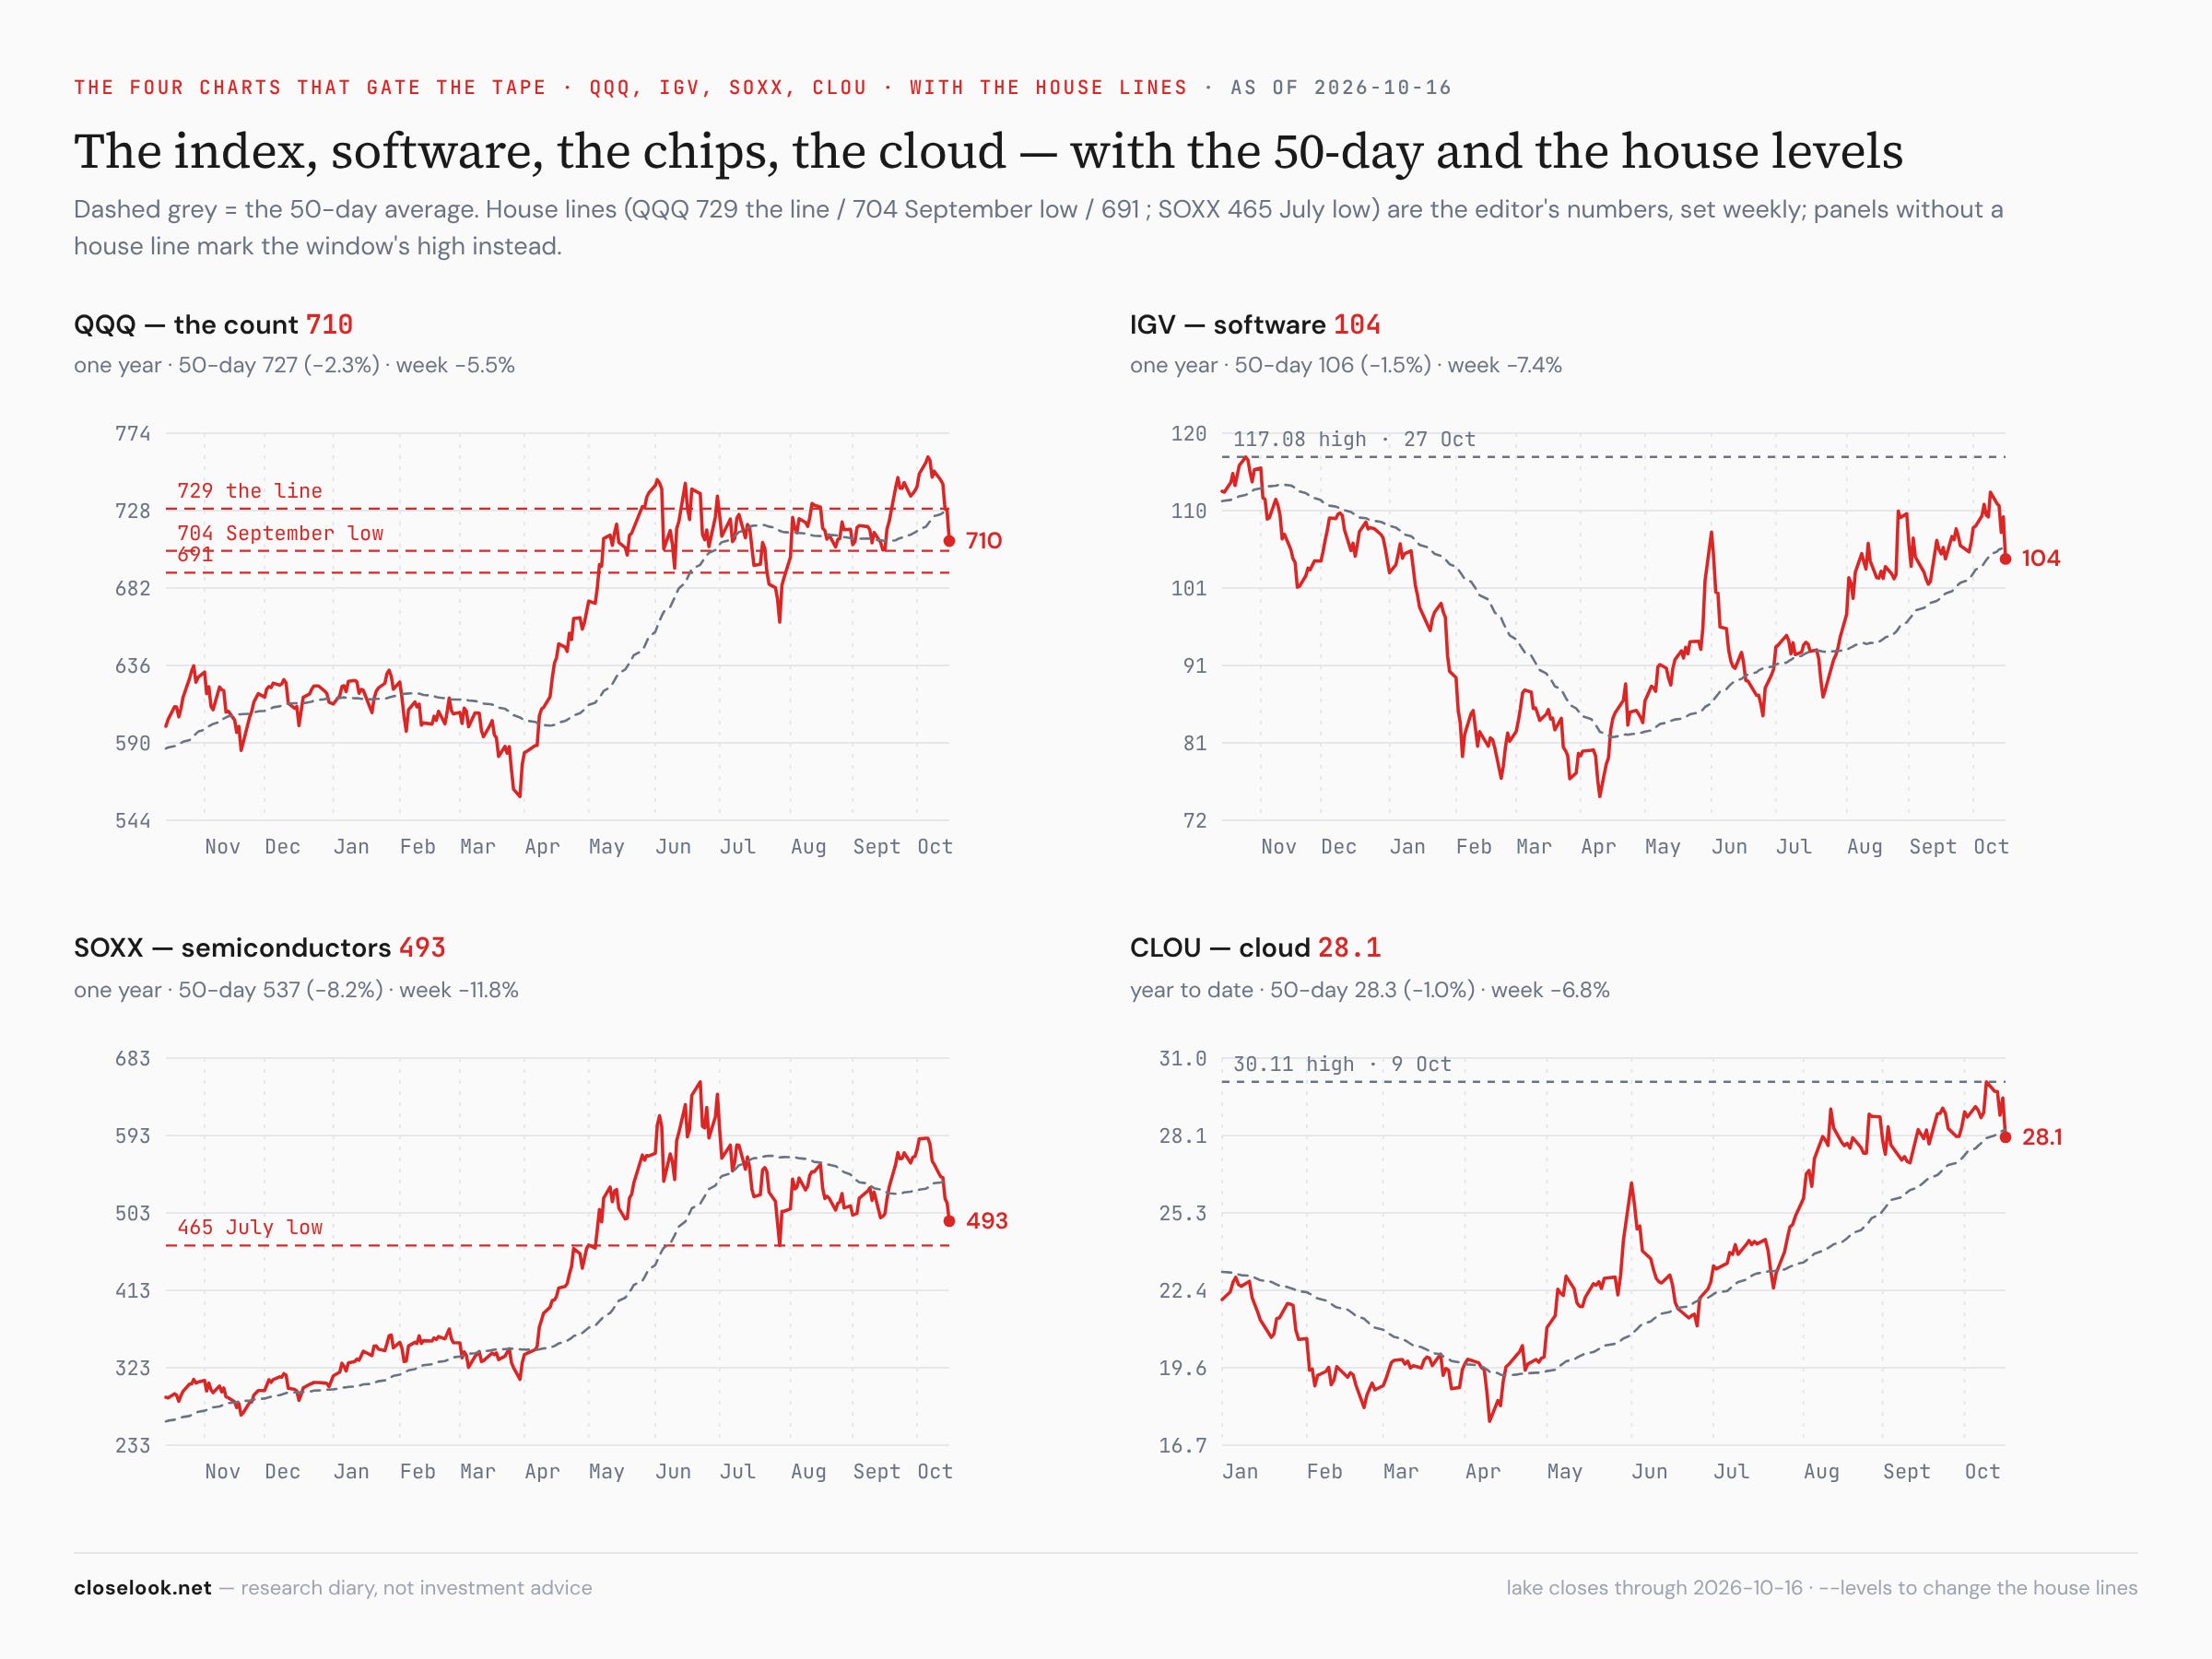
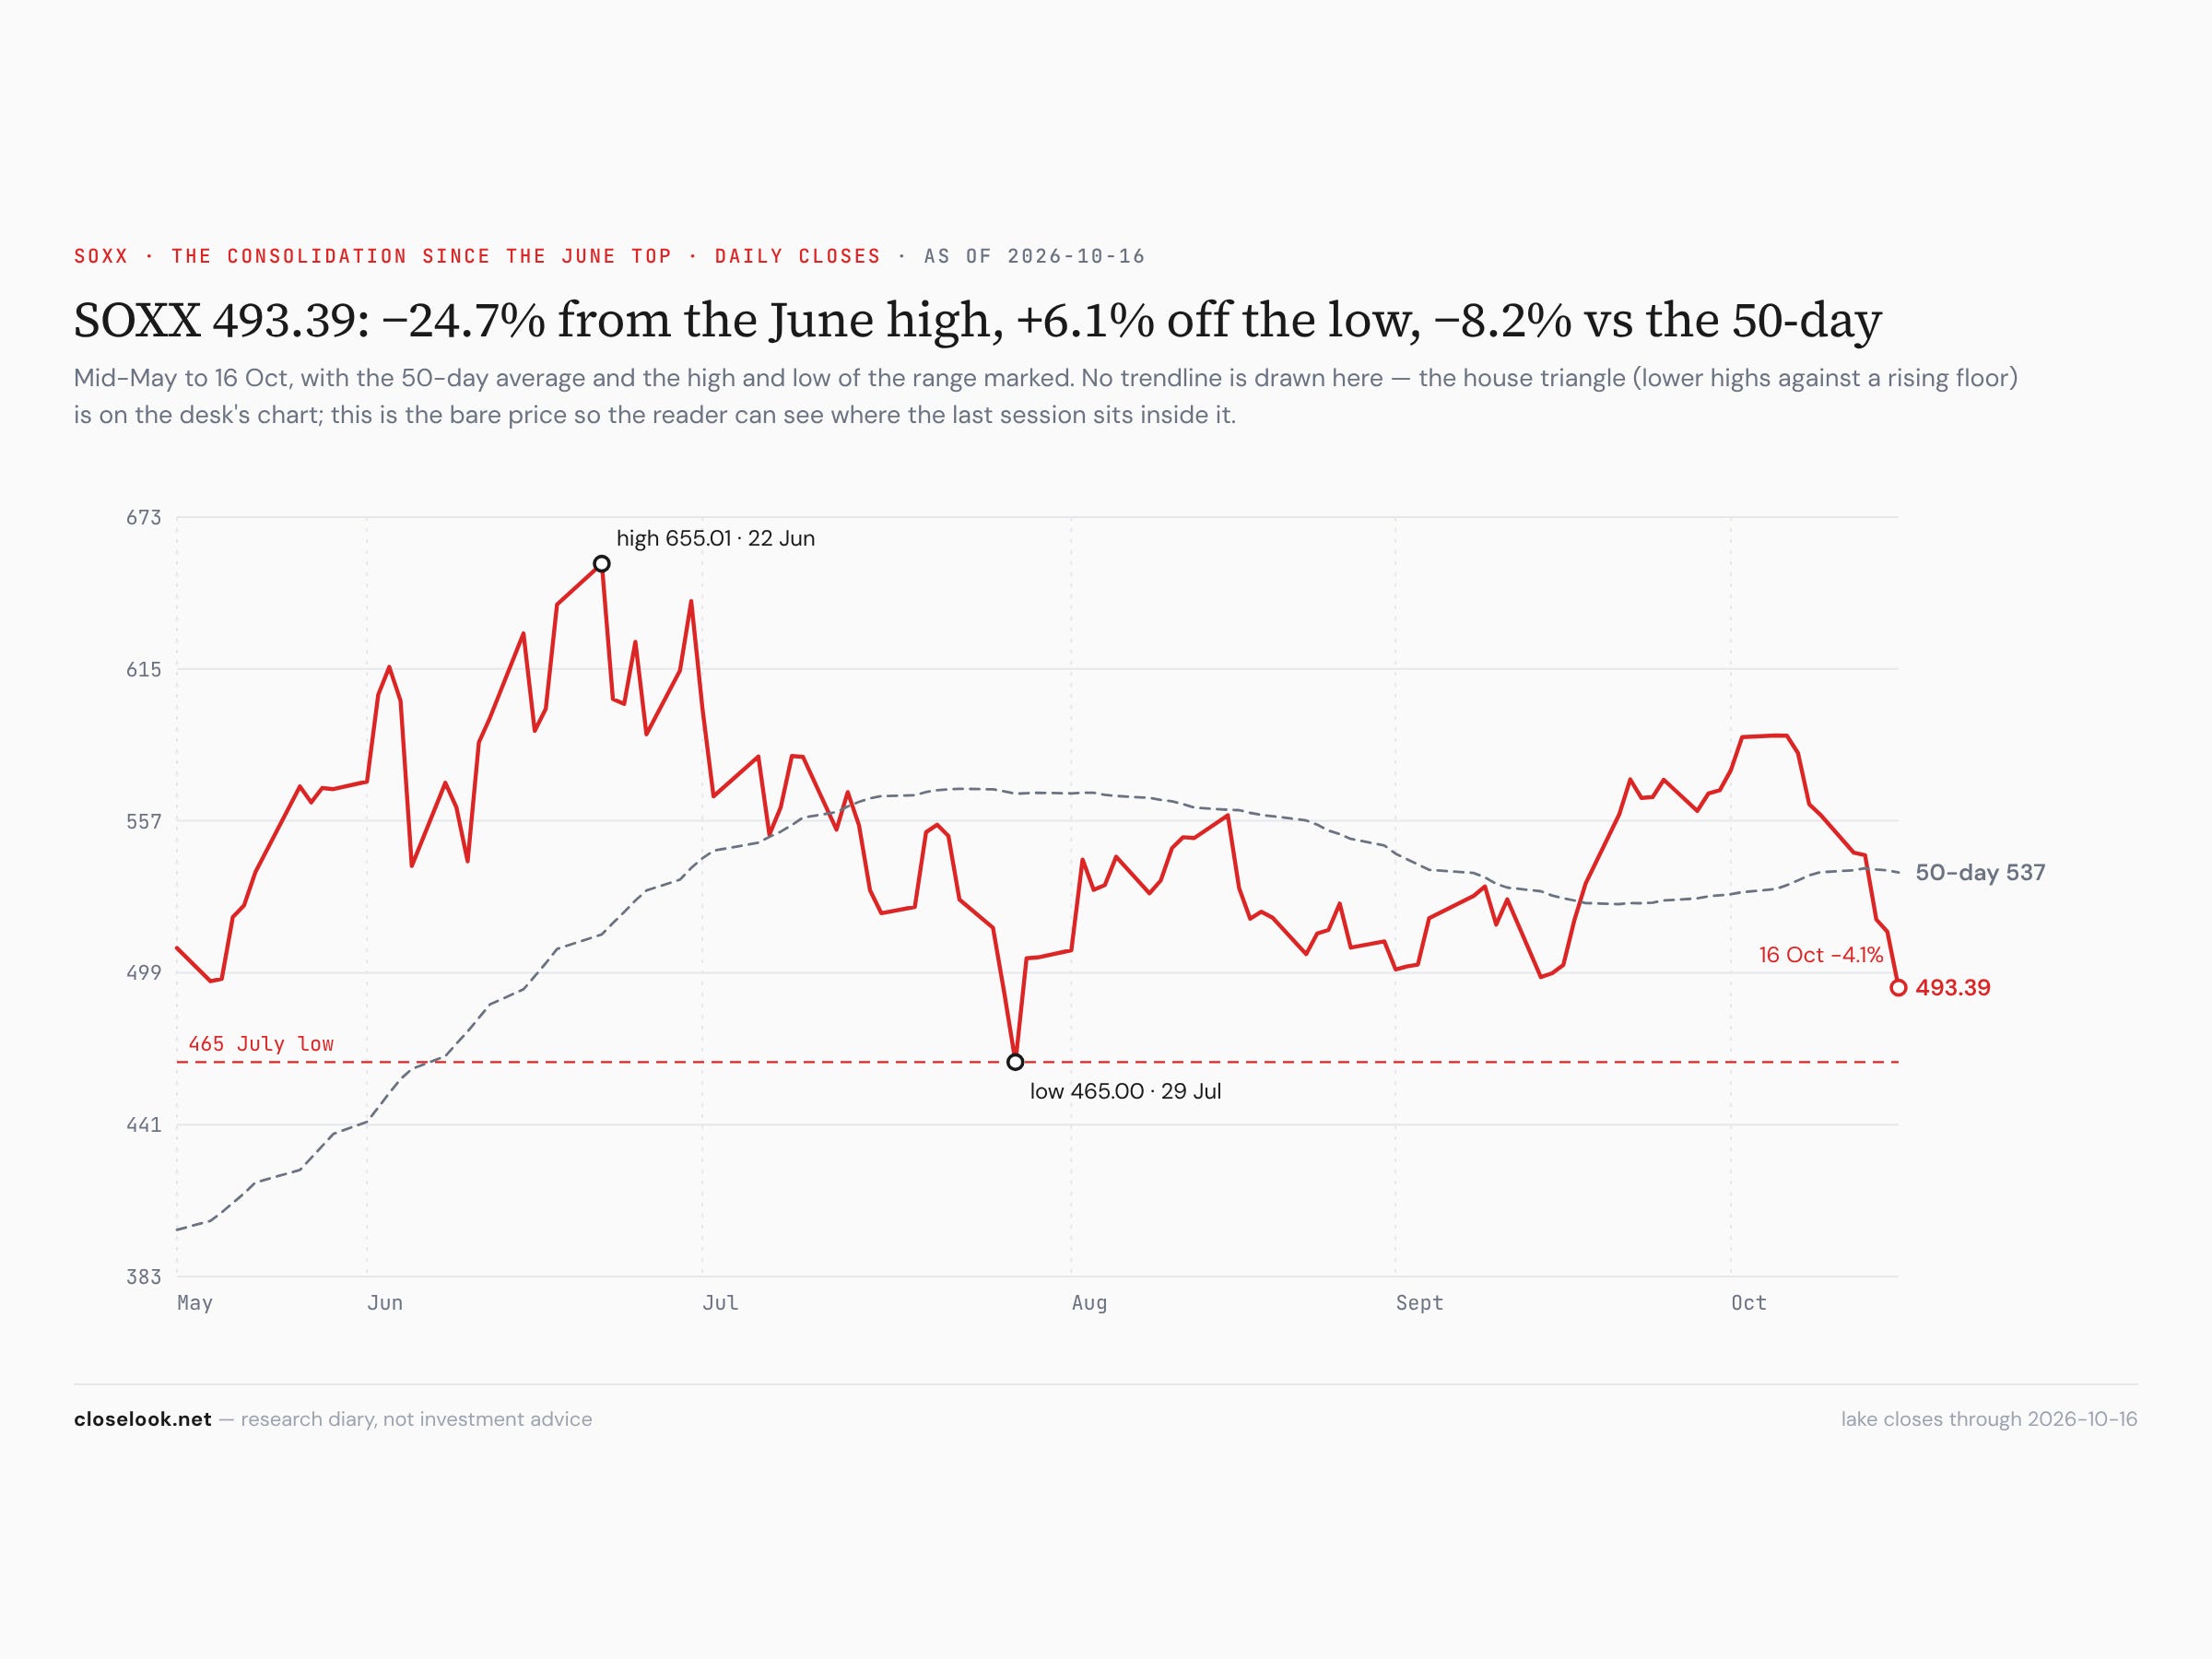
The chips — the second leg. SOXX 493.39: 24.7% under its 22 June high, 8.2% under its 50-day, 6.1% above the 465.00 July low. SMH 539.79, 19.3% under its June high; XSD 462.03, 28.7% under, back at its July level. The July low is the line the whole chip complex now trades against.
Software — from shelter to seller. IGV 104.34 — 7.4% under last Friday’s 112.67, which was its best close of 2026; 1.5% under its 50-day. CLOU 28.07, 6.8% under its 30.11 high of last Friday. CIBR 98.82, 10.2% lower on the week. A week ago software was making highs while the chips fell. This week it fell with them.
3 · The Outlook
The three-index read — capex and opex both sold, applications flat. Capex (Rubin Build-Out) −13.45%, 26.8% under its June high, +76.4% on the year. Opex (Agentic Ecosystem) −14.16%, from a record a week ago — not one of its 34 names rose. Applications (Agentic Winners 40) −0.50%, after −2.0% on Friday. The builders and the companies that run AI fell together; the applications held most of the week and gave a little back at the end. HALO — growth with no AI thesis — fell 0.5%.