


A jobs report three times the forecast did in one session what the earnings season could not. Software closed green on the year on Thursday and lost it on Friday; the chip index rose 3.5% in a day from three months of lower highs while Nvidia closed within 2.3% of its record; and the print record scored fourteen windows — seven paid, six sold, one flat — sorted not by layer and not by beat, but by whether the number was still accelerating. The bond rout ran through Wednesday, oil went through 90 on Hormuz, and the Fed’s September meeting became a hike question again. The index moved a tenth of a percent.

1 · This Week’s Action
The tape, day by day. Another quiet index week sat on top of a bond rout, an oil shock and a jobs report — and it moved a tenth of a percent. Monday −0.30% as gold’s Friday break hung over August’s last session and the dollar caught its bid. Tuesday −0.69%, the widest down day: Japan’s 10-year closed above three percent for the first time since 1996, the Bund at a 2011 level, the US 10-year through 4.78% on a sixth straight rising session — and, overnight, the US and Iran exchanged fire with two tankers reported hit near Hormuz, WTI +5% in two sessions. Wednesday +0.44% with the 10-year at 4.81%, its highest since November 2023, and oil through 90. Thursday +1.05%, the widest move of the week: Waller cut the September hike odds to a coin flip, Nvidia bought Hugging Face, the belly of the curve steadied. Friday −0.39% on a payrolls print of 162,000 against roughly 53,000 expected — the first jobs report of the Warsh chairmanship, three times the forecast, with 55,000 of upward revisions behind it — which put the September hike back above 58% odds, spiked the two-year to 4.425%, and split the tape by layer in the opposite direction from the whole month: chips +3, software −2.
Five sessions, and the S&P finished +0.11% at 770.19, the Nasdaq 100 +0.35% at 718.96, still above the 50-day (711.08) it reclaimed last week, and the equal-weight S&P −0.77% — the second consecutive week cap-weight beat equal-weight. Everything that happened this week happened underneath the index again. This week, for the first time in three, what happened underneath favoured the silicon.
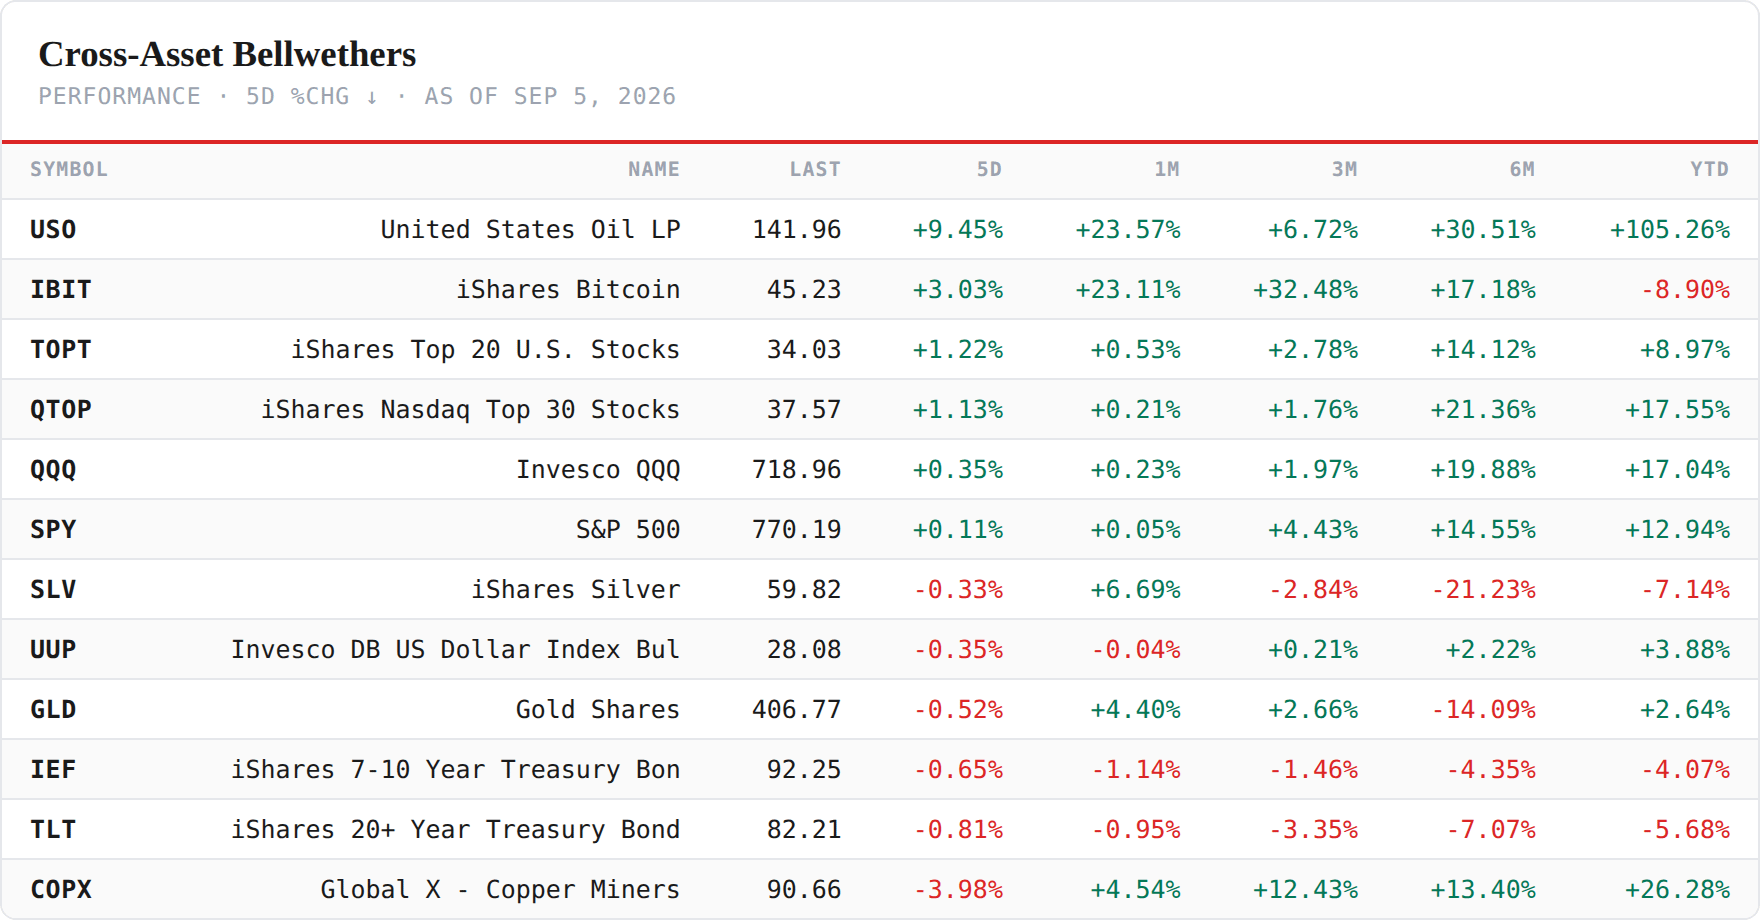
The cross-asset board — oil owns it. The best line on the board is not an equity: USO +9.45% on the week, +23.6% on the month, +105% on the year — the Hormuz exchange put WTI above 90 and Brent near 96 by Friday. The coin fund +3.03% (IBIT 45.23) and the two top-heavy US cuts (+1.22%, +1.13%) are the only other green of consequence. The hard assets were sold: gold −0.52% to 406.77 after Thursday’s high at 410.22 and Friday’s payrolls-day fall; silver −0.33%; copper miners −3.98%, the worst line. Both Treasury funds red — IEF −0.65% to 92.25, TLT −0.81% to 82.21 — with the belly making a new year-to-date low on Tuesday. Saturday’s letter carries the sovereign board and the hard-asset charts in full; the one-sentence version for the tape: gold and bitcoin both rose to their resistance and the first attempt to break failed — the read stays constructive, and it stays unconfirmed.
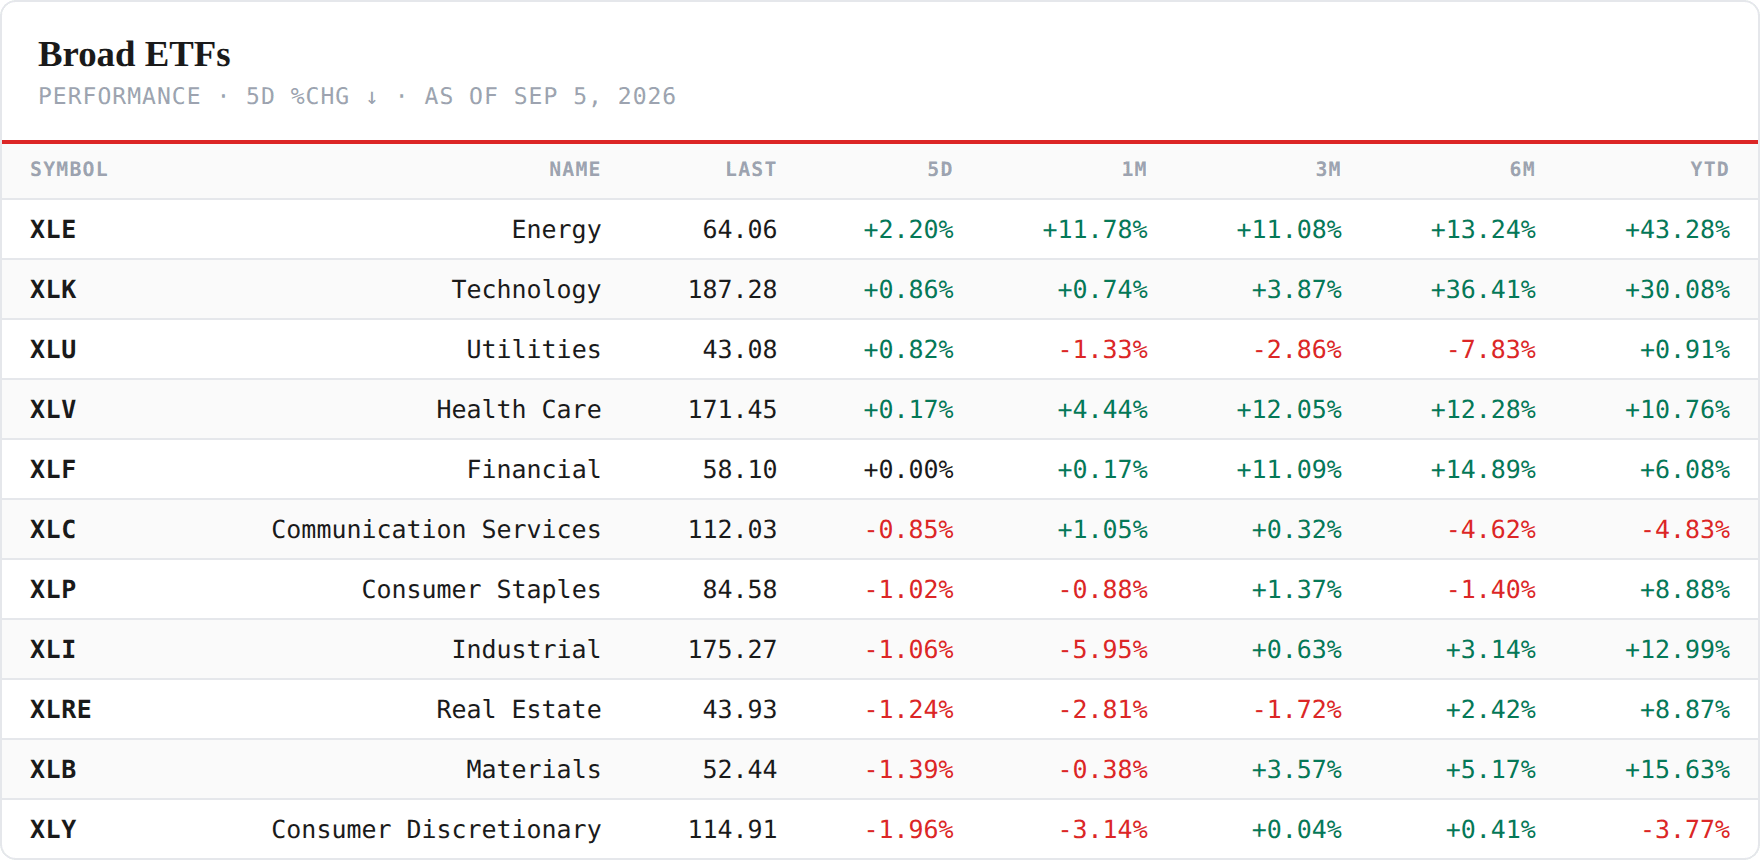
The sector read — energy took the board, and the inversion stopped. Five green of eleven: energy +2.20%, technology +0.86%, utilities +0.82%, health care +0.17%, financials flat. Six red: communications −0.85%, staples −1.02%, industrials −1.06%, real estate −1.24%, materials −1.39%, discretionary −1.96%, the worst. For two weeks this letter recorded full inversions — each week’s leaders became the next week’s casualties. This week the pattern broke: technology, top-three last week, stayed green; health care, bottom-five last week, came back to flat; energy, quietly strong for a month on both lenses, finally led outright. A tape that has been auditioning leaders and dismissing them after five sessions kept two of them this time.
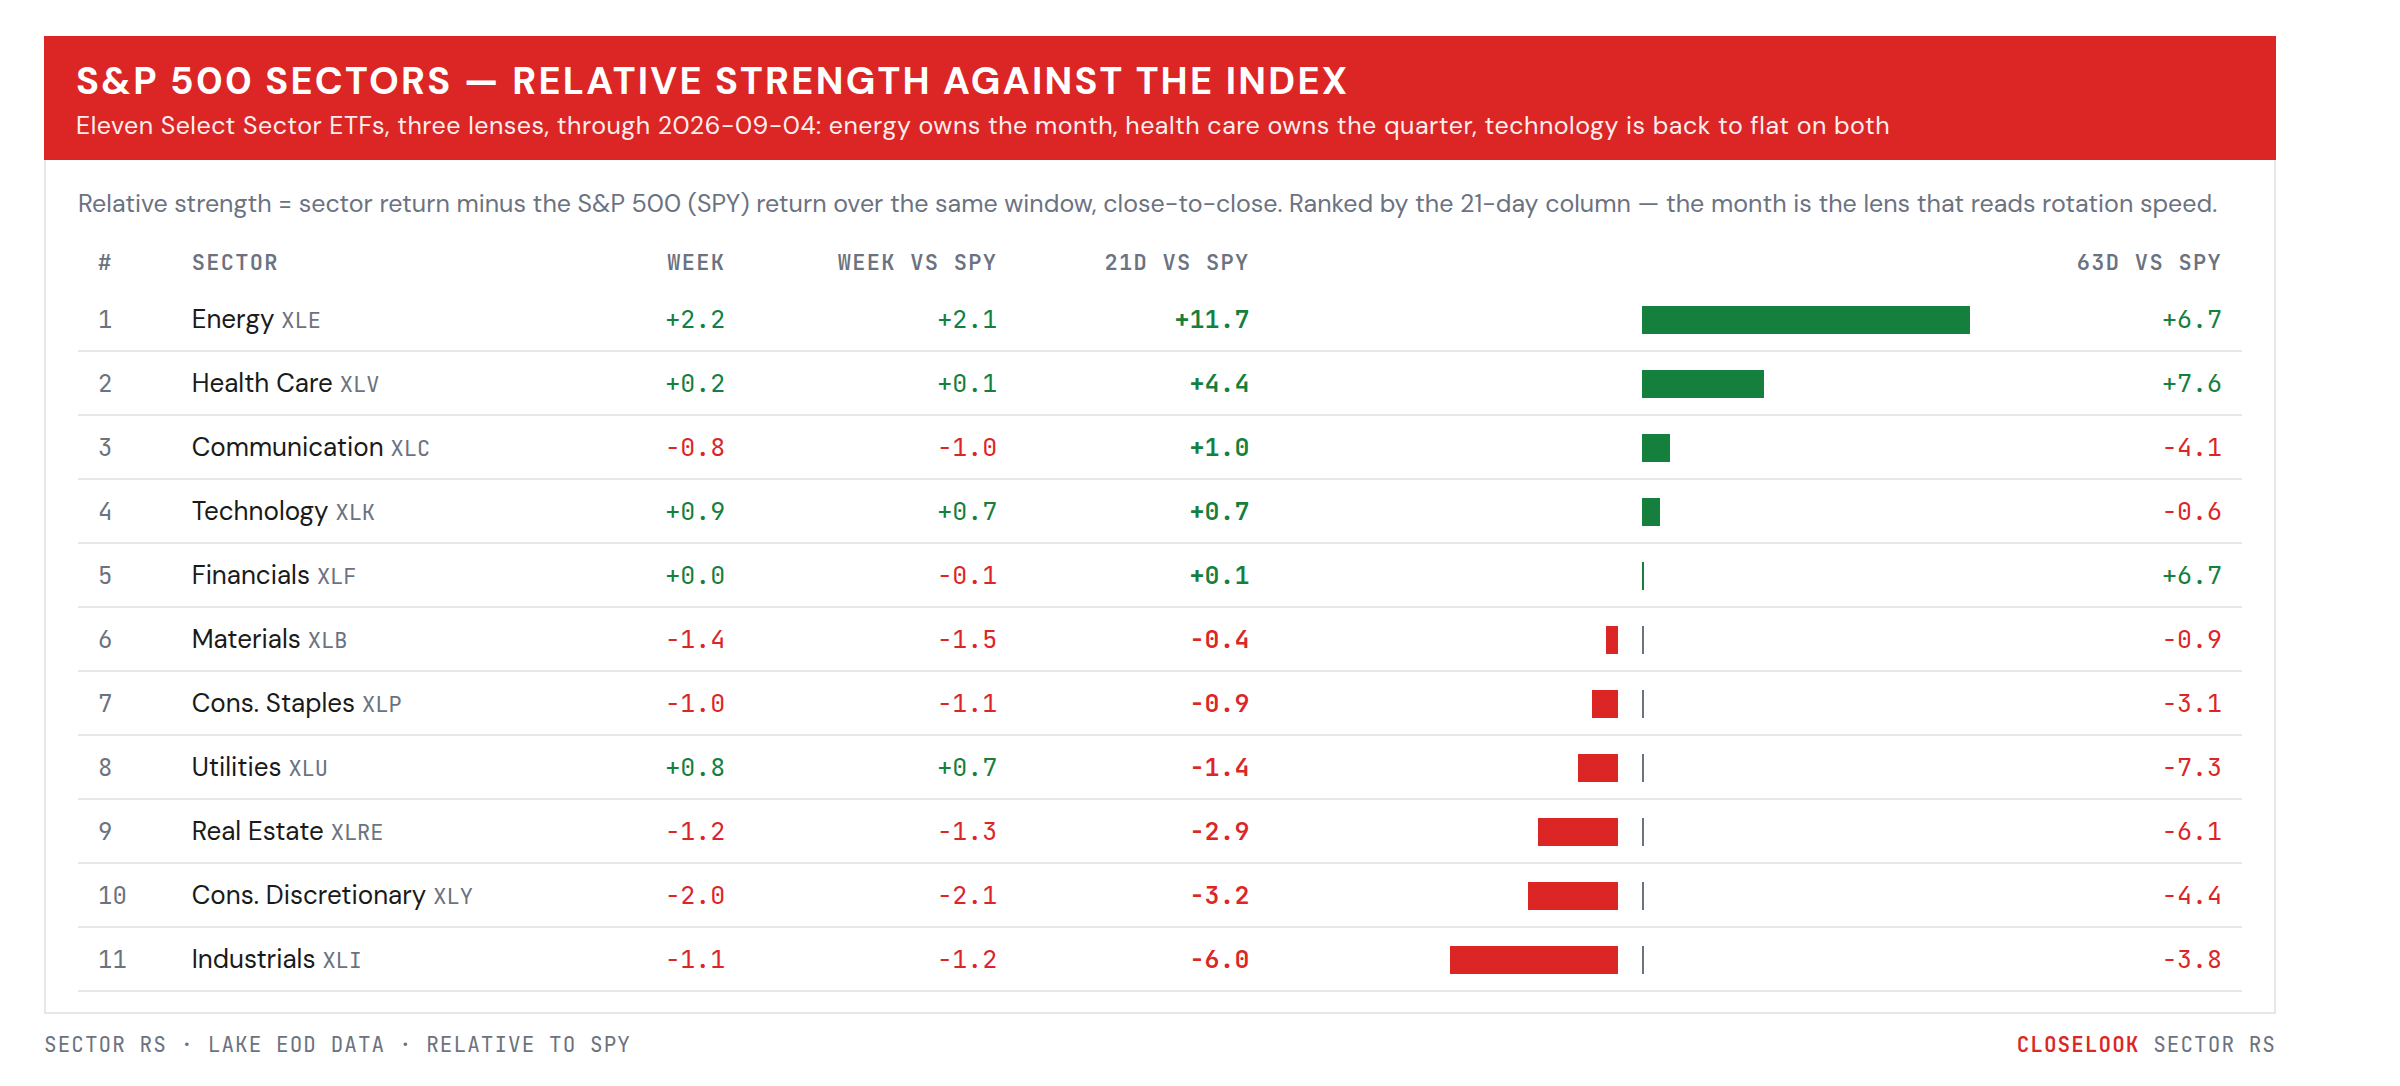
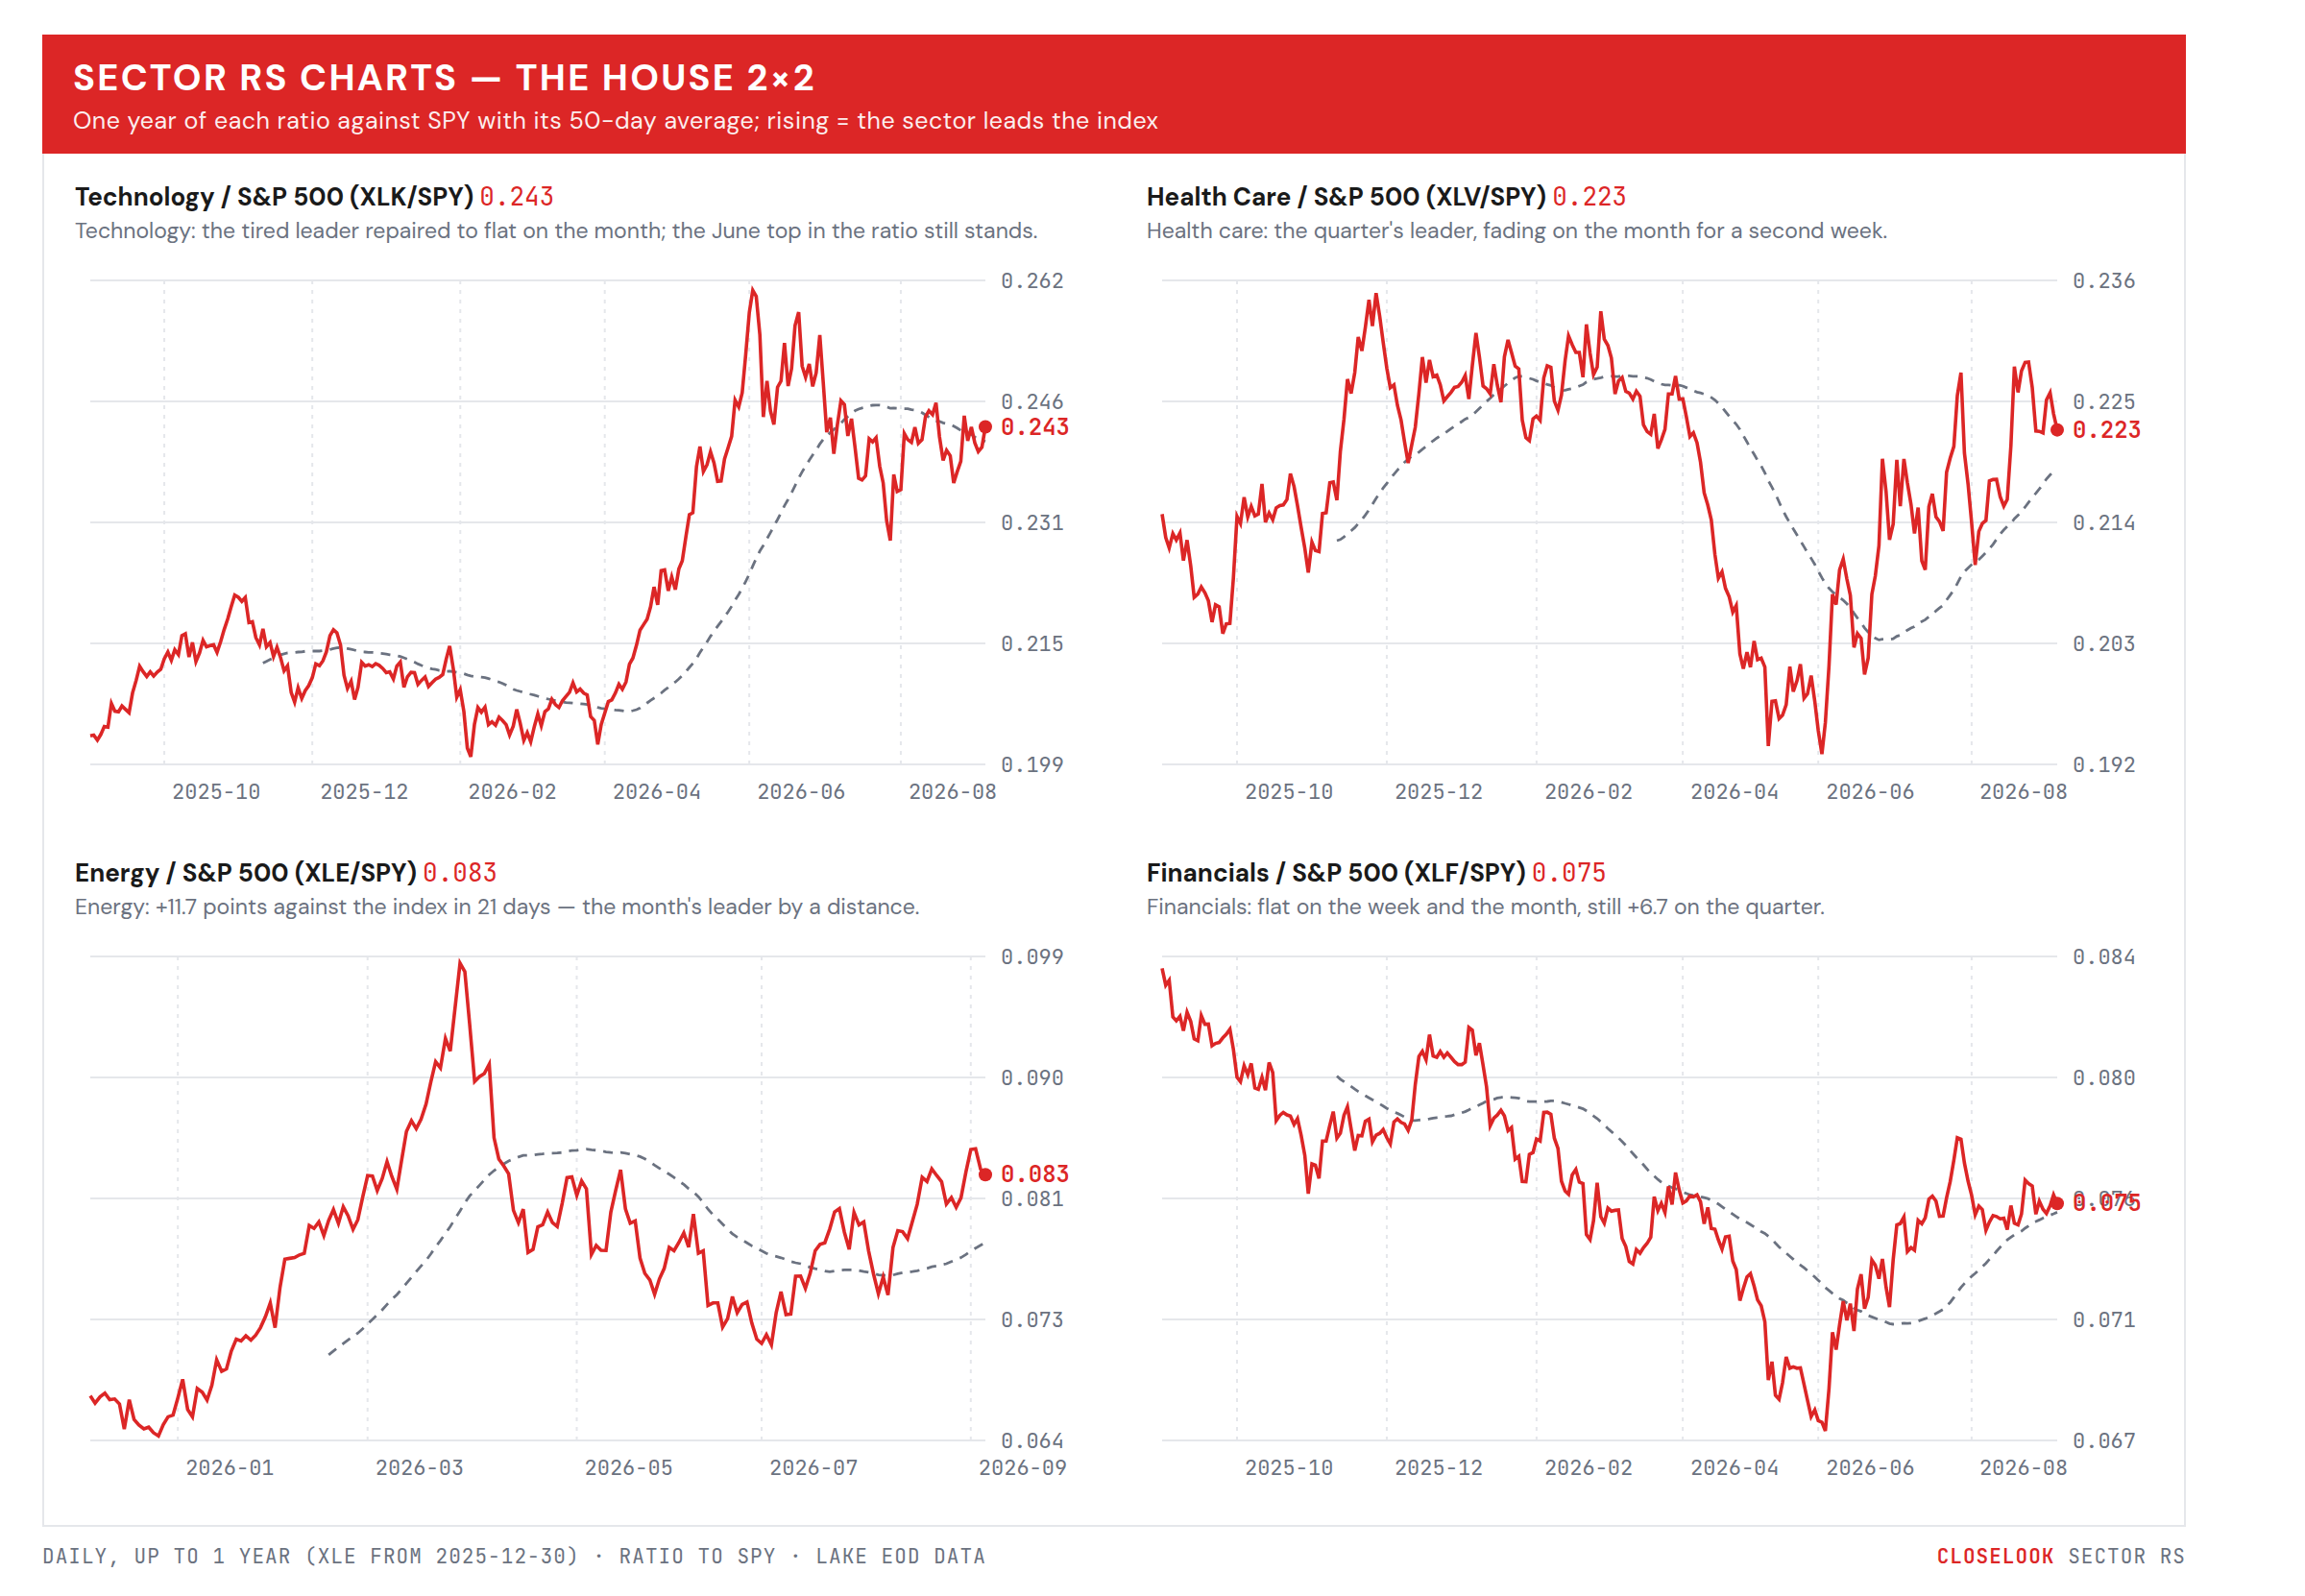
The sector rankings — relative strength, three lenses. Our sector-RS board reads the rotation’s speed, and this week it reads a leader by a distance: energy +11.7 points against the index over 21 days, +6.7 over 63 — the month’s leader, and the only sector whose month is stronger than its quarter by that margin. Health care keeps the quarter crown (+7.6 over 63) and repaired its month (+4.4) after fading last week. Technology: +0.7 on the month, −0.6 on the quarter — the tired leader that was −4.5 on the quarter a fortnight ago has had its quarter forgiven; it is now flat on every lens, which is not leadership but is no longer the drag. Financials +0.1 and +6.7: flat month, strong quarter. And the bottom two moved: industrials −6.0 over 21 days is now the worst line on the board, while utilities, last on every lens a week ago, improved to −1.4 on the month as the long end rallied. The rotation slowed. Last week it ran in both directions at once; this week it ran in one — toward the sector that a Hormuz headline prices first.
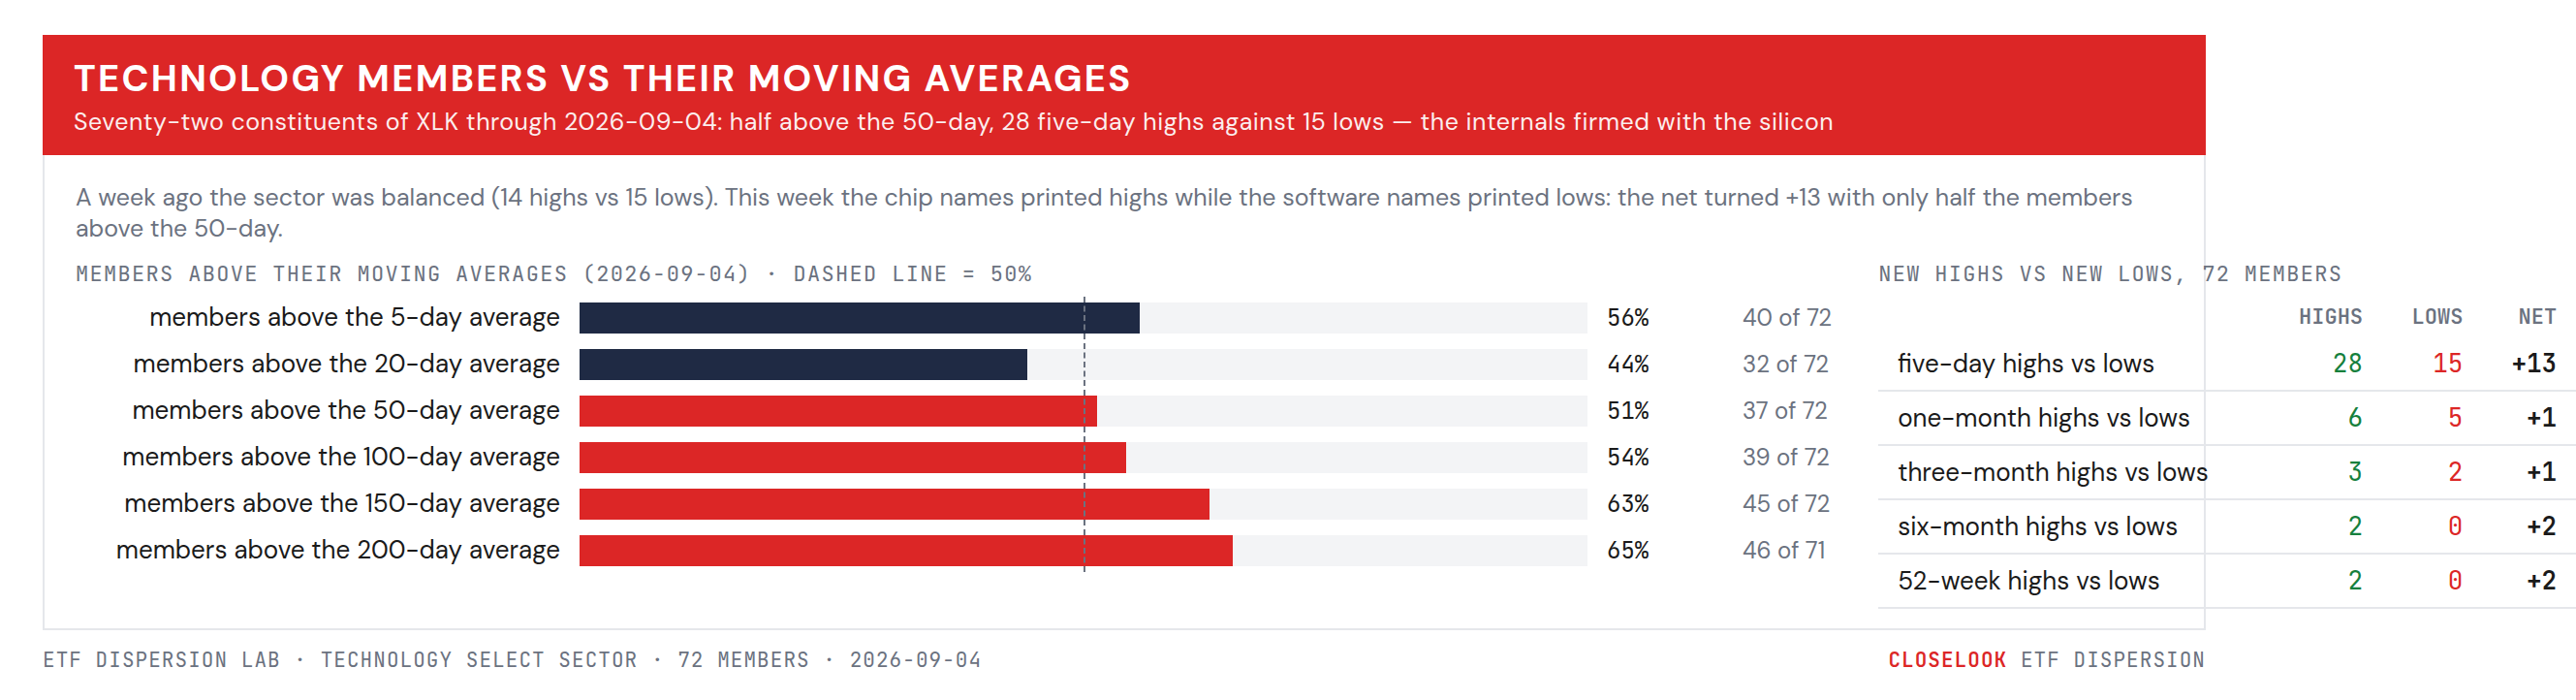
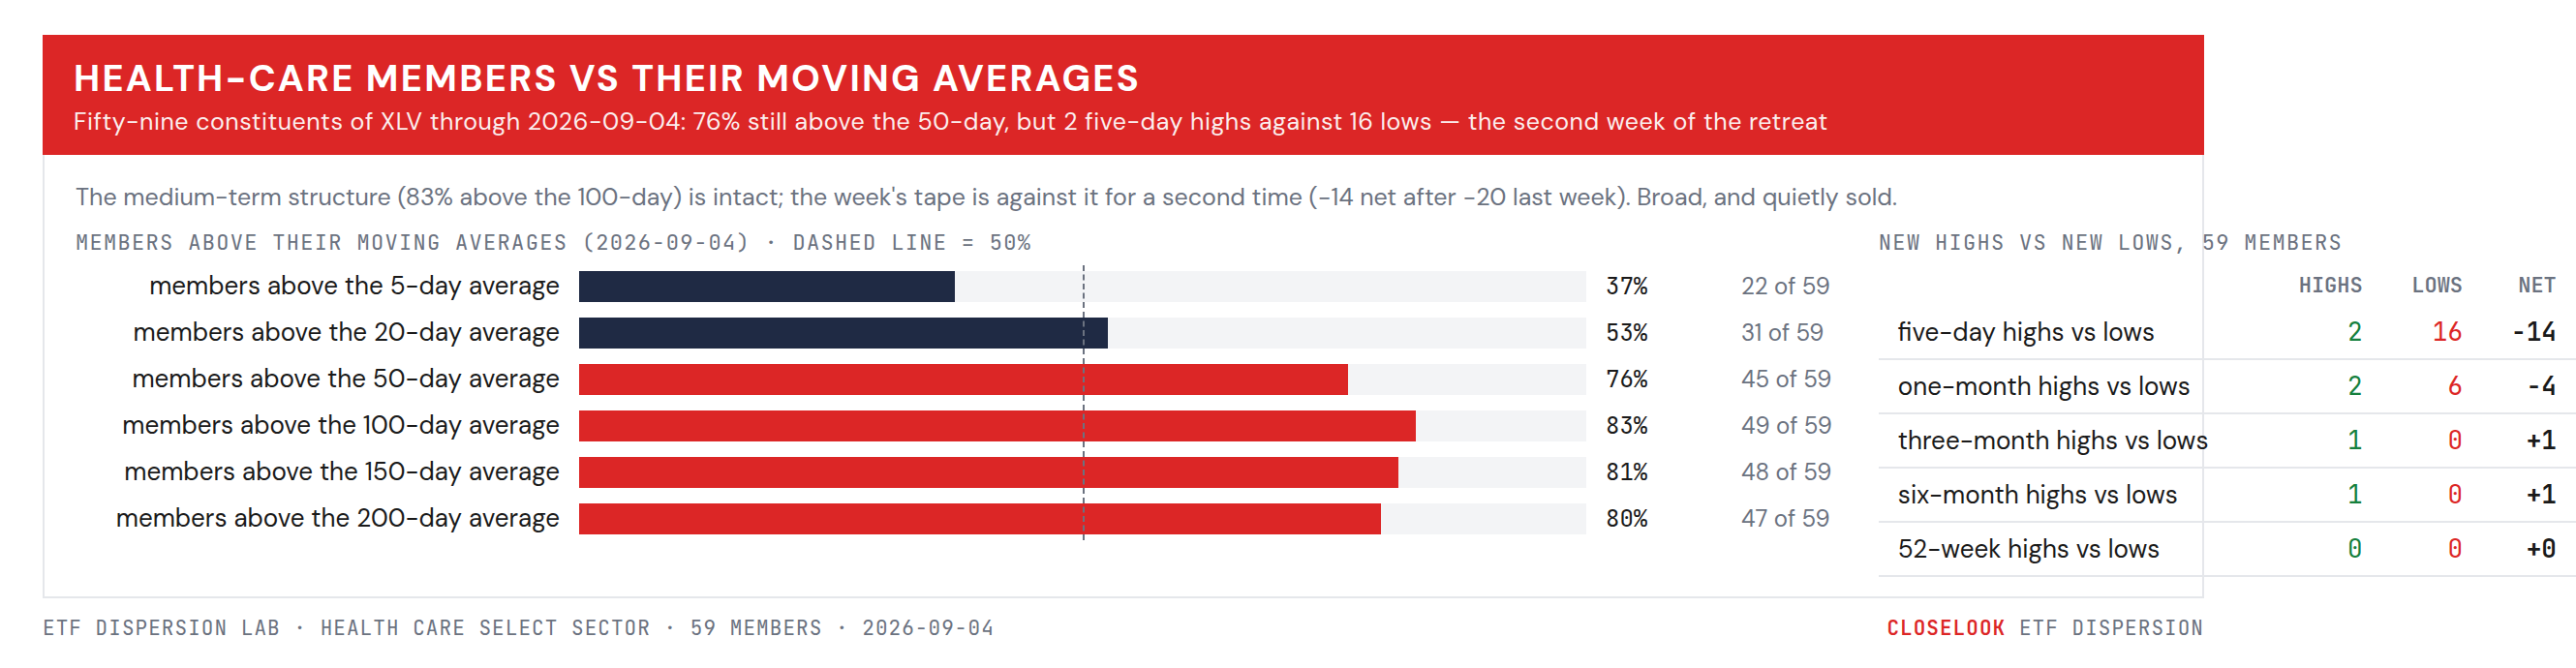
Underneath the four focus sectors — the breadth split along the same line as the tape. The dispersion pages show the members behind each ETF. Technology: 51% of members above their 50-day — still only half — but 28 five-day highs against 15 lows, a +13 net after last week’s balanced 14-against-15. The chip names printed highs on Friday while the software names printed lows: the sector’s internals firmed exactly where its ETF did. Health care: 76% above the 50-day, 83% above the 100-day — and 2 five-day highs against 16 lows, −14 net after −20 last week. The medium-term structure is intact; the week’s tape has now been against it twice. Financials 12 highs against 7 lows with 92% above the 150-day — the strongest structure on the board. Energy the paradox: 90% of members above the 50-day, and yet 2 highs against 11 lows on Friday — the sector led on the week and was sold on payrolls day. Industrials the mirror: only 24% above the 50-day, but 27 highs against 15 lows — a broken sector bouncing broadly. One week ago the internals rotated as fast as the surface. This week they sorted by the same axis the surface did: silicon over code.
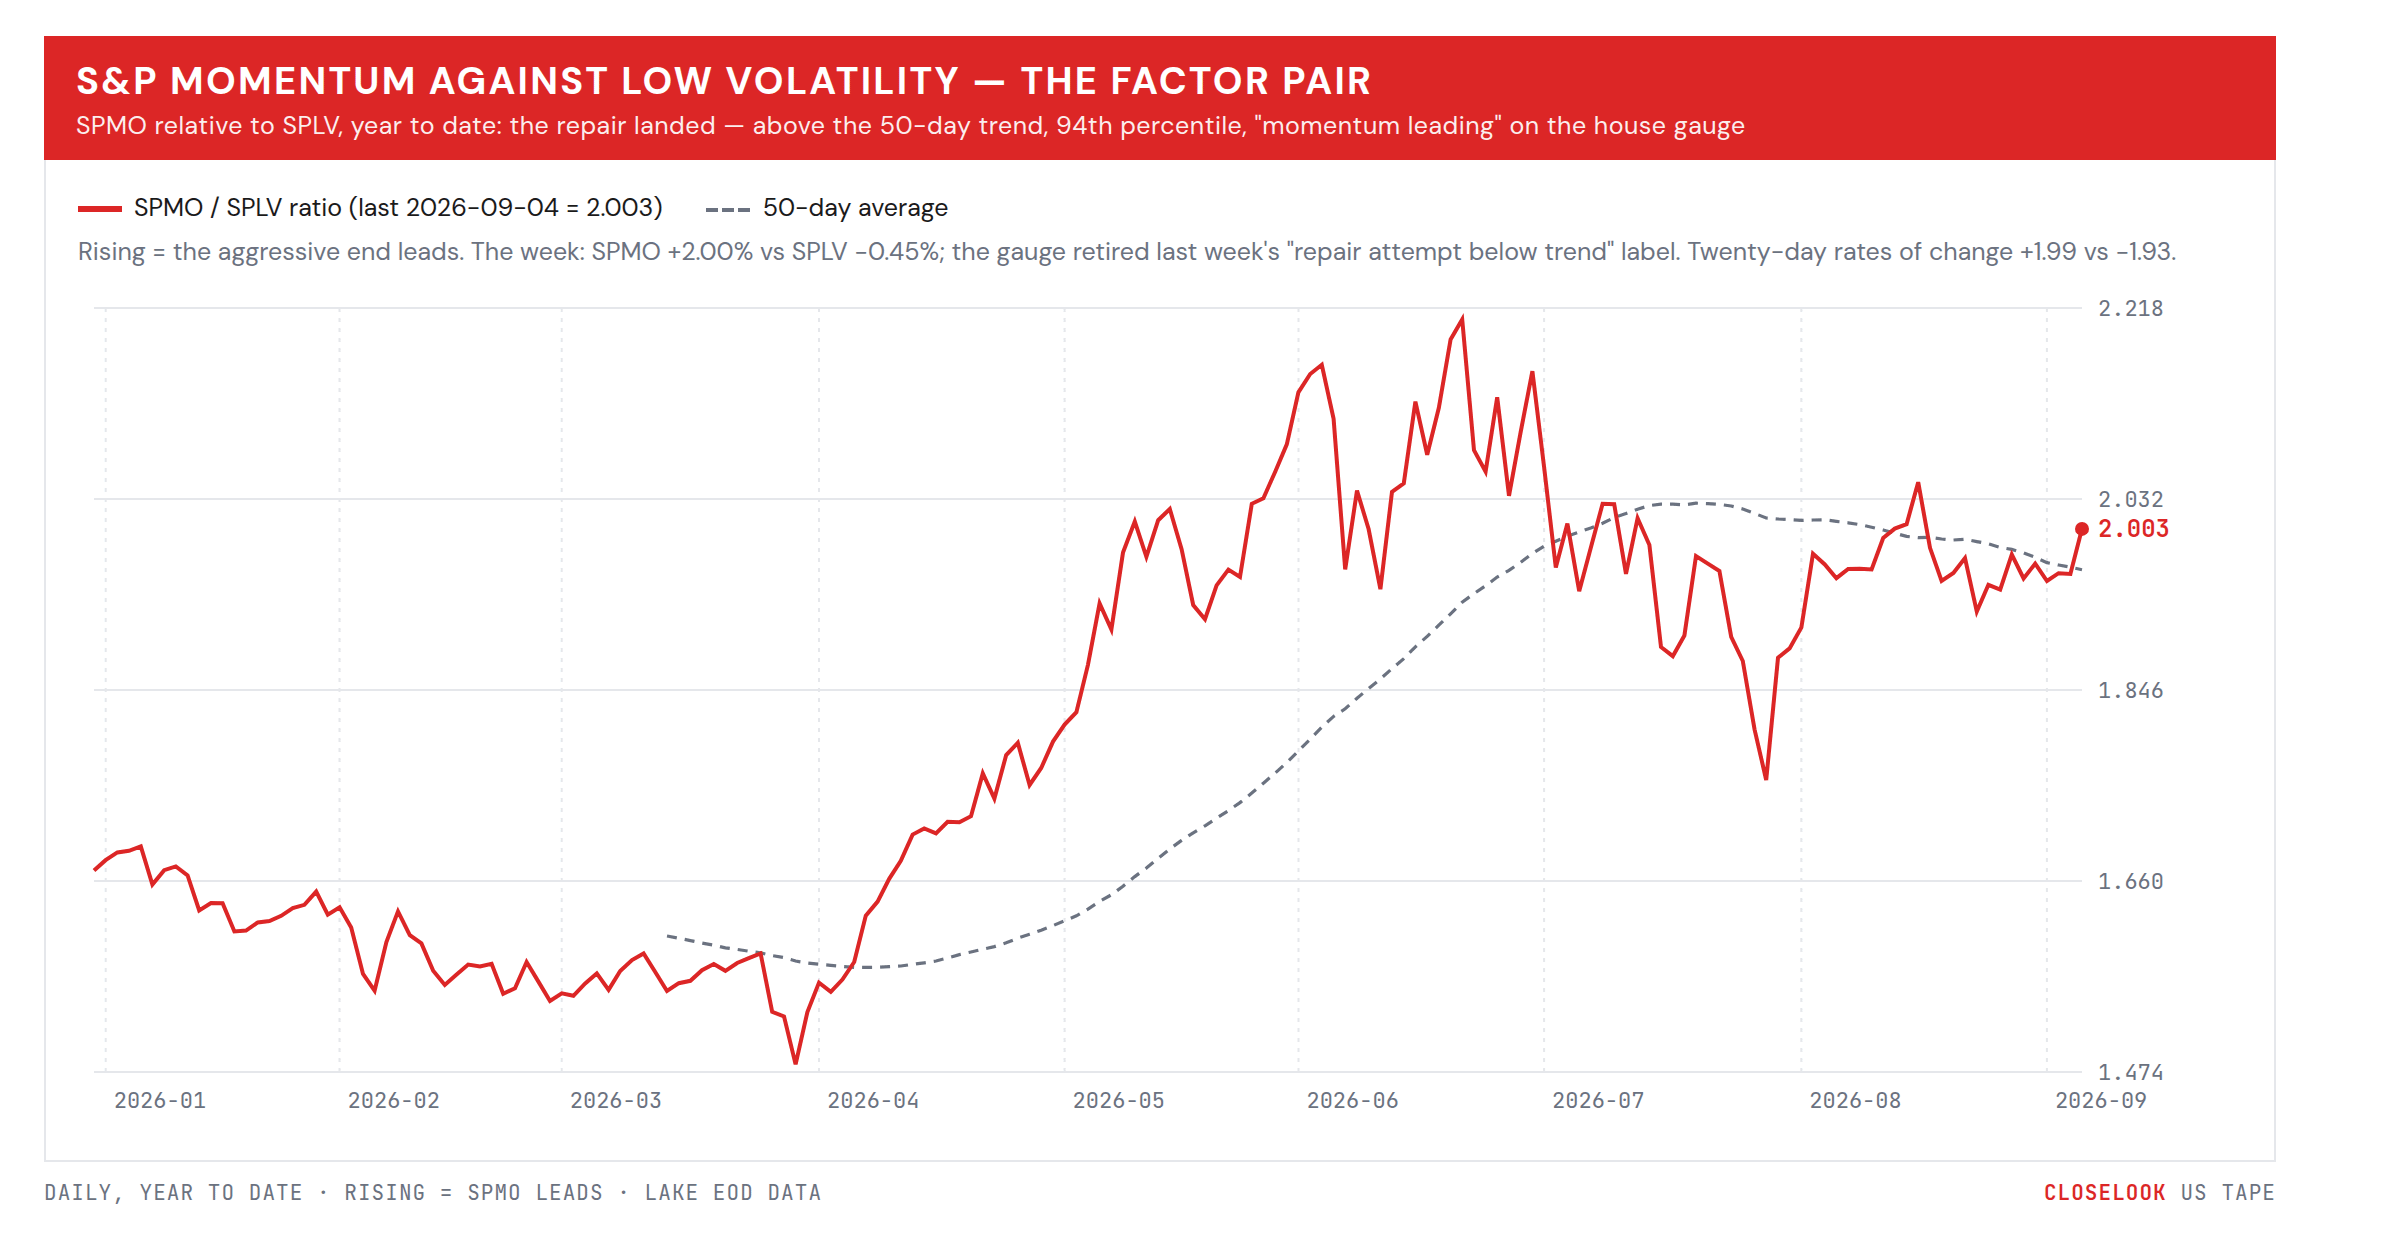
The factor read — the repair landed. The factor-regime gauge retired last week’s label. For three weeks it read momentum repair attempt below trend, with the percentile bleeding from 94.6 to 92.3 to 89.7. This week: the momentum-over-low-vol spread indexed at 159.08 against a 50-day at 155.92 — above trend — at the 94.18th percentile, and the state reads “momentum leading, risk appetite building”. The pair behind it: SPMO +2.00% against SPLV −0.45%, the twenty-day rates of change now +1.99 against −1.93, the sixty-day +3.02. Saturday’s letter found the international pair less decided — both ends rose, min-vol made a high on Thursday and gave it back. At home the style axis, which went quiet during the violent layer rotations of the last fortnight, moved this week — and it moved toward risk, on a hawkish jobs number, in the week the belly of the curve made a new low. That is the factor market saying the growth in the payrolls print matters more to it than the discount rate in the two-year. It is a reading, not a verdict; the gauge has retired labels before.
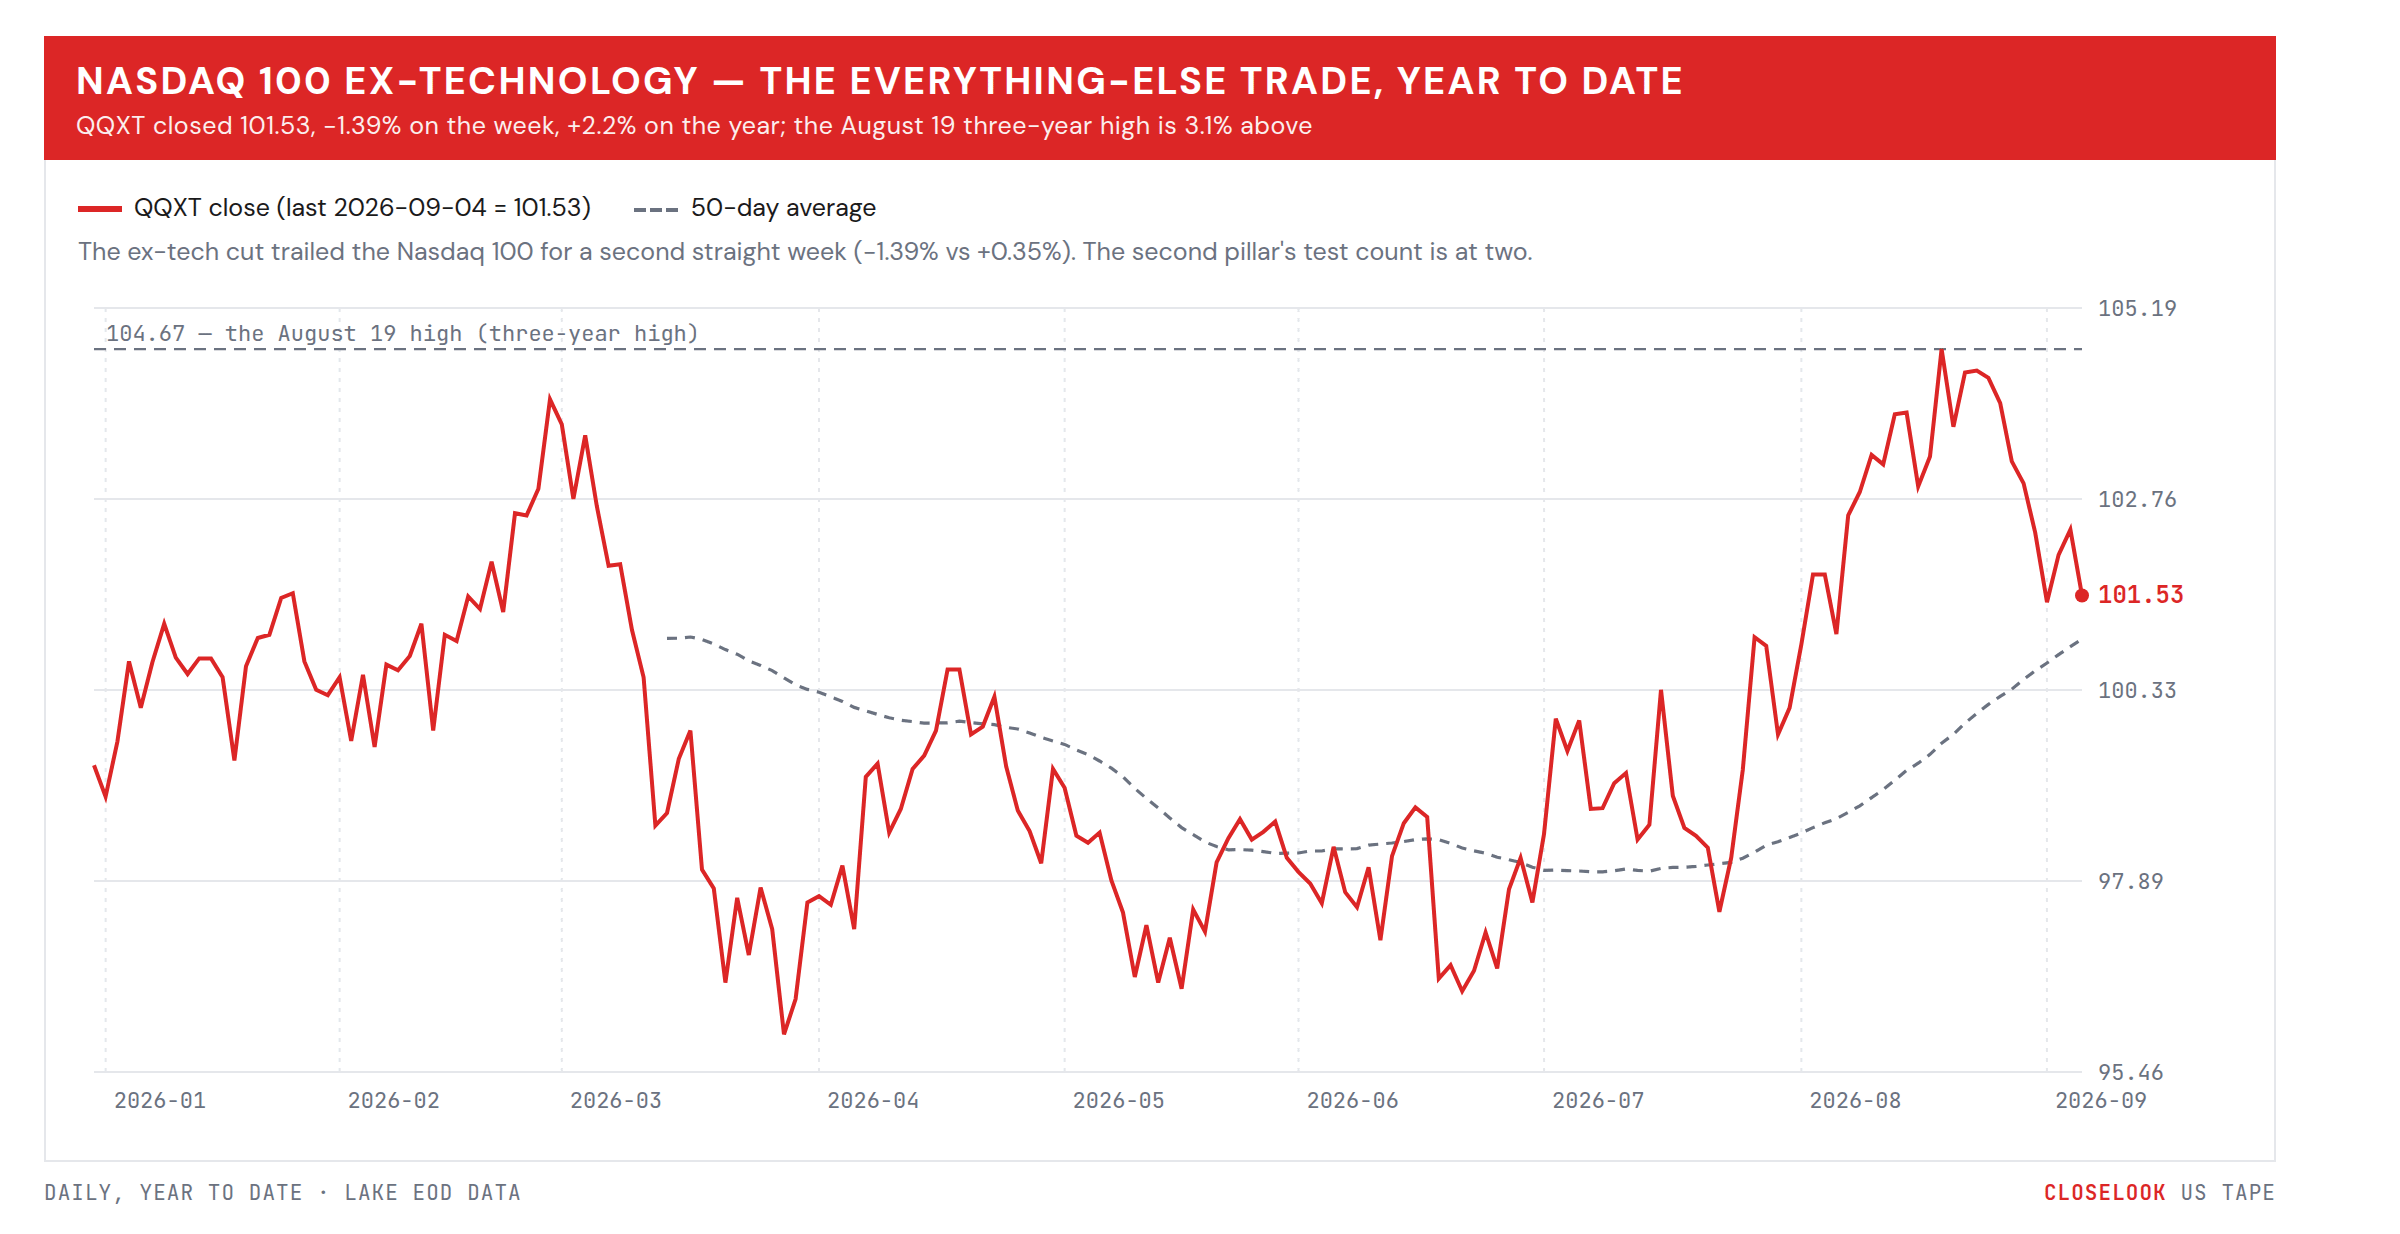
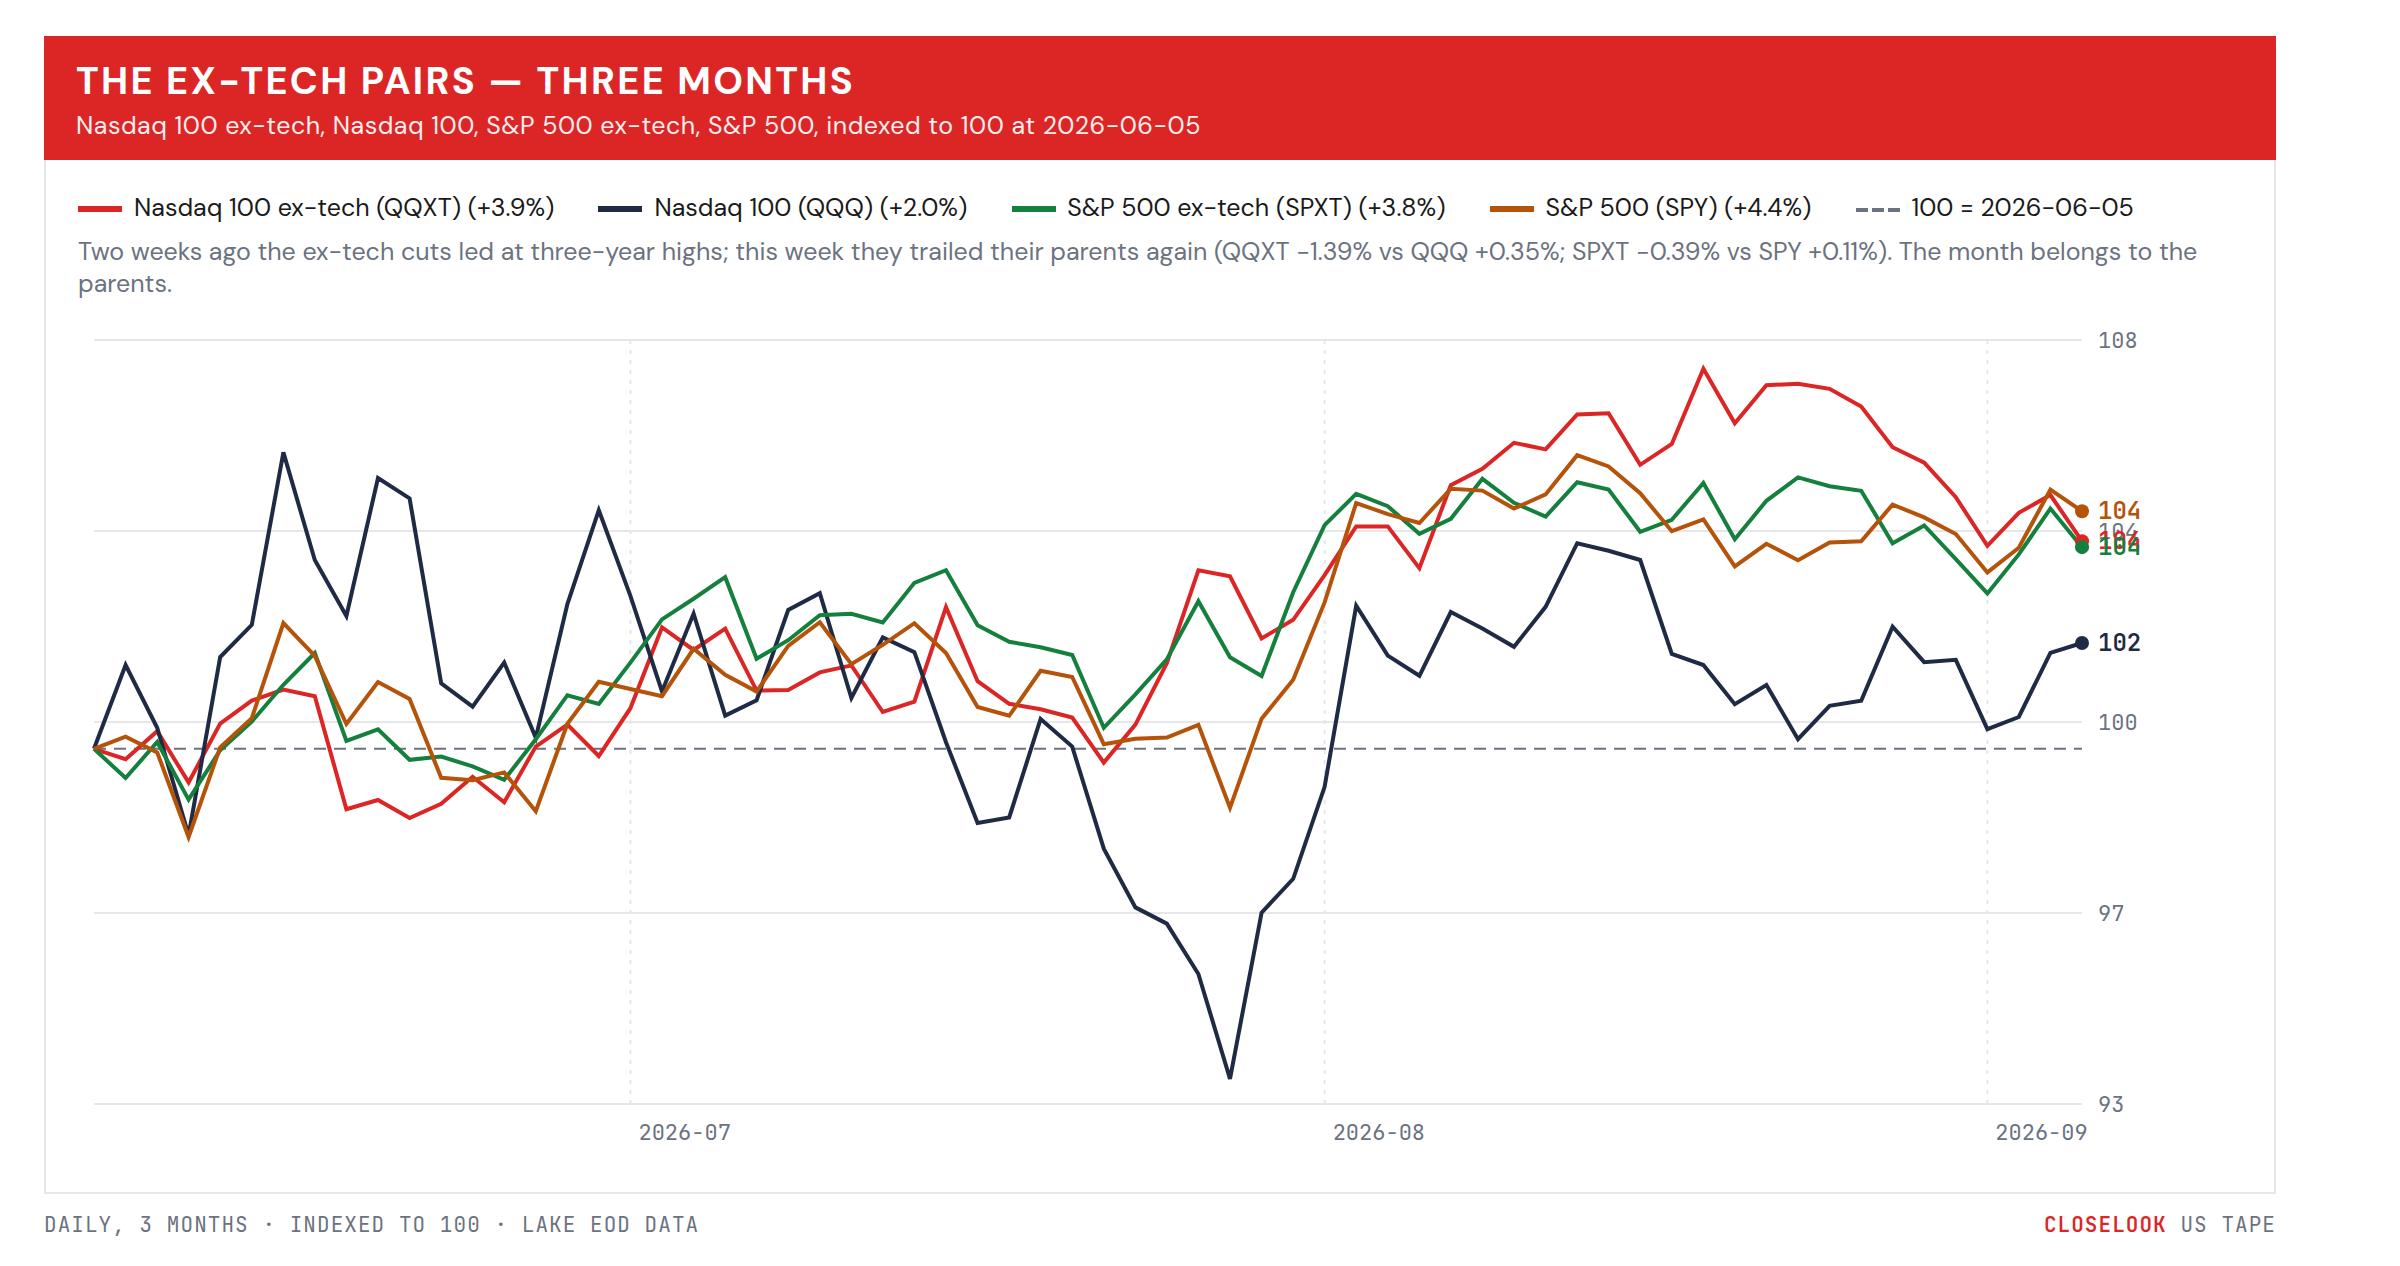
The axis, one week on — the everything-else trade trailed again, and the tech trade split down the middle. Two weeks ago the ex-tech cuts led at three-year highs; last week they gave back; this week they trailed a second time: the Nasdaq 100 ex-technology −1.39% against the Nasdaq 100’s +0.35%; the S&P ex-tech −0.39% against the S&P’s +0.11%. The year-to-date order still reads the other way, and the second pillar’s count — the number of consecutive weeks tech beats its ex-tech cuts — stands at two, against a stated limit of four. Run the pairs and one more thing shows: the Nasdaq 100’s own equal-weight technology sleeve fell 1.23% while the cap-weighted index rose. Tech beat everything-else this week, and inside tech, three names did the beating.
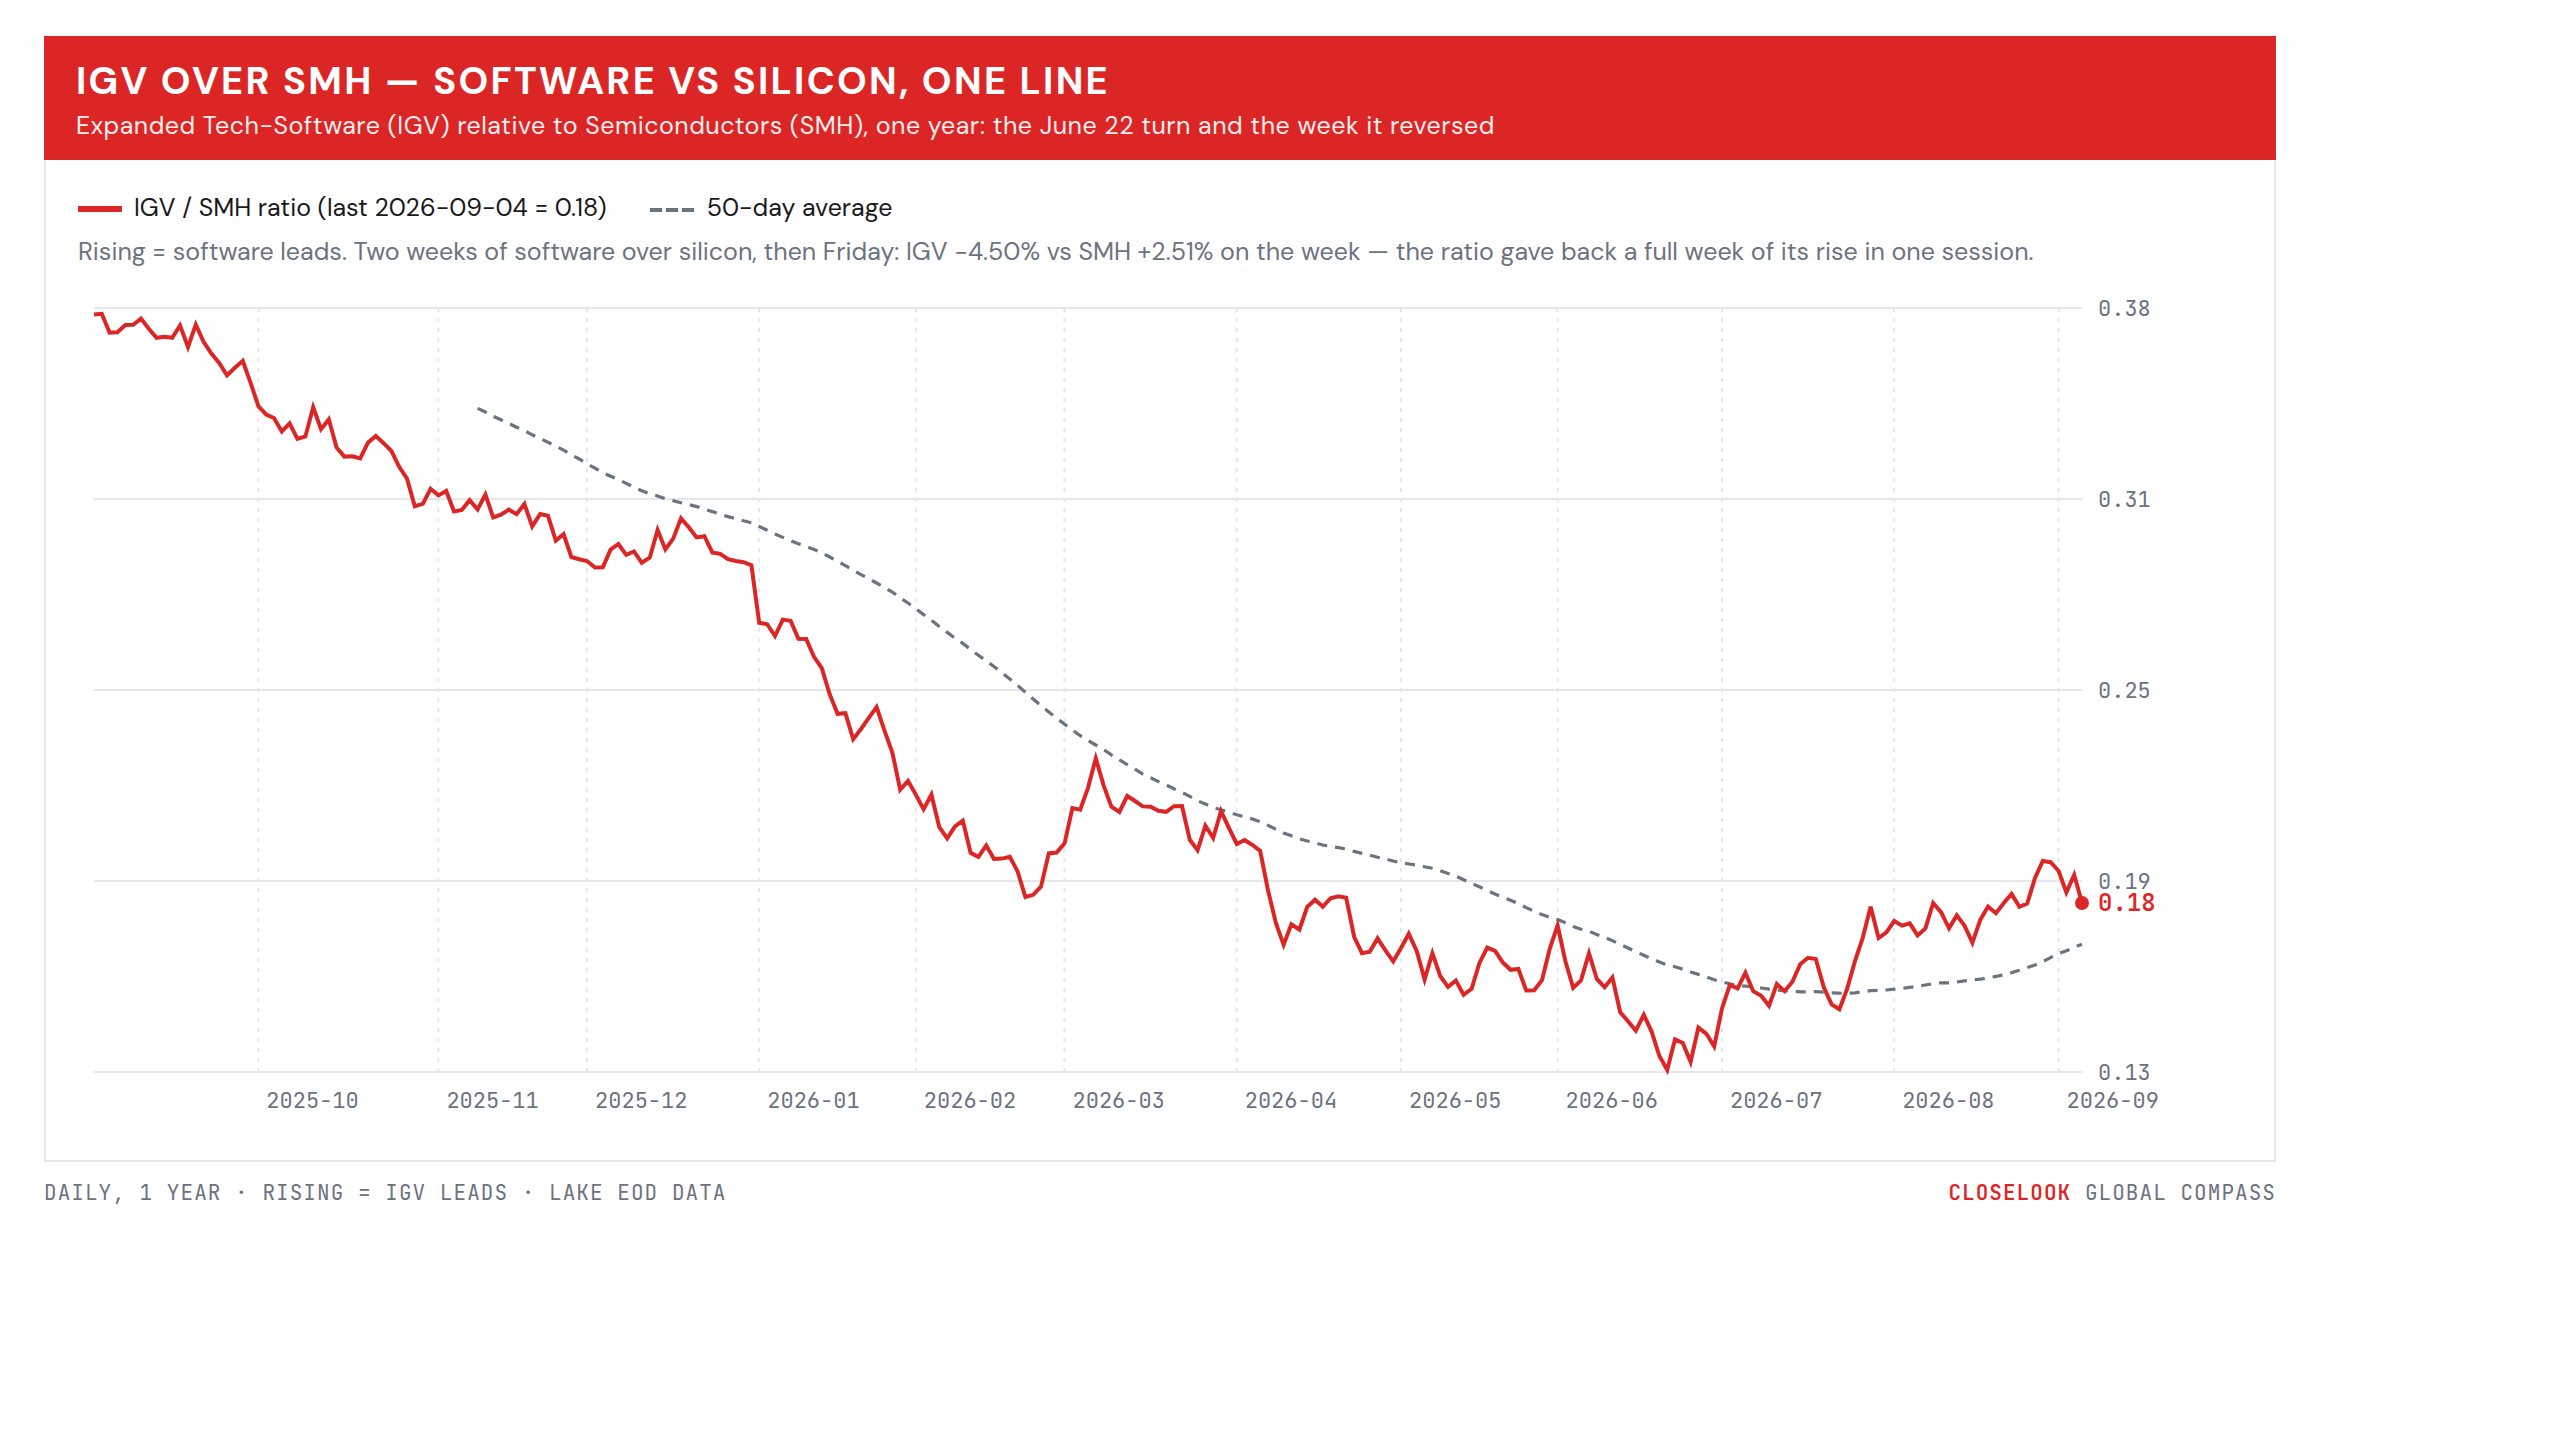
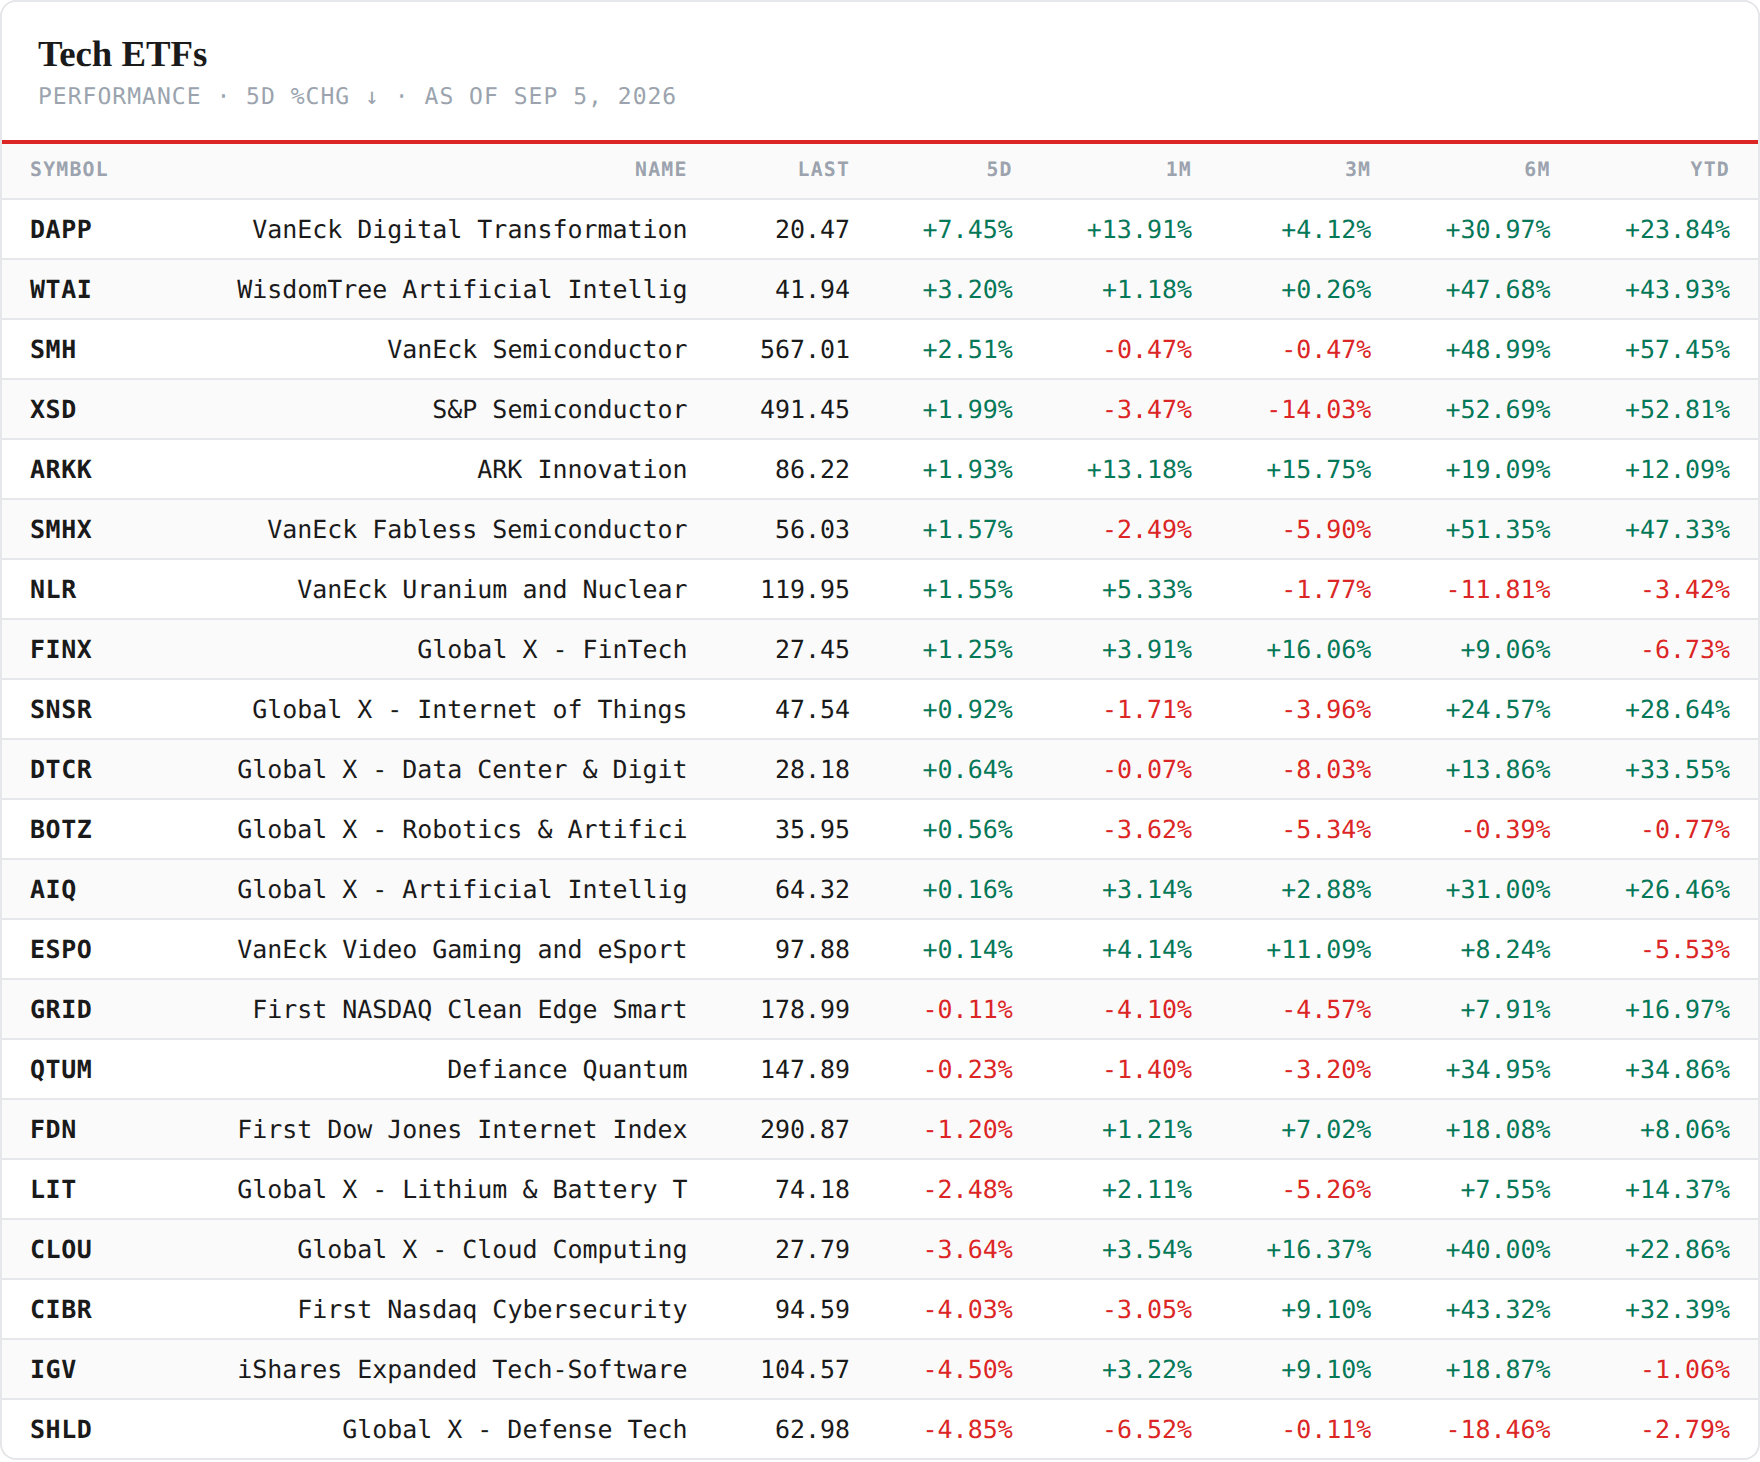
Because the money did not go where last week’s rule sent it. Last week the rule read “the market pays the layer, not the beat”, and it paid software: IGV +5.93%, through 107.70, green on the year. This week: software −4.50%, the worst line on the tech board but one — and the silicon it had been beating for a fortnight took the top of the board: SMH +2.51%, SOXX +2.21%, XSD +1.99%, SMHX +1.57%. IGV’s week, session by session, is the whole letter: Monday 109.98, holding the breakout; Tuesday −3.46% to 106.18, back under the 107.70 line it had broken the week before; Wednesday 103.42, under the year; Thursday +3.41% to 106.95 — green on 2026 again, intraday and at the close; Friday −2.23% to 104.57, red on the year by 1.06%. A breakout that lasted one weekly close, a retest that failed on the second session, a year regained on Thursday and given back on Friday. The pair board dates the turn: the software-to-semis ratio fell 6.84% in the week — from 52% above its June 22 low to 41% above it, a full month of the ratio’s rise surrendered in five sessions, most of it on Friday.
Underneath it, the participation statistic held for a second week — and changed its composition entirely: the Magnificent-7 basket +0.54% against equal-weight’s −0.77%, cap-weight above equal-weight in both indices again. But last week’s re-concentration was into the balance sheets — Microsoft +6.3%, Amazon +3.0%, Alphabet +0.5%. This week those three were the basket’s worst lines — Microsoft −2.69%, Amazon −2.97%, Alphabet −2.35% — and the basket was carried by two names with a chip thesis: Nvidia +5.89% and Meta +6.70%. The re-concentration is still on, and it is no longer a defensive crowding into size. It is a crowding into the two largest expressions of the silicon trade.

Inside tech — the split flipped, and it flipped to the chip. Thirteen green lines of twenty-one, led by the digital-asset fund +7.45% (the coin’s week), the AI-themed basket +3.20%, and the four semiconductor wrappers — SMH +2.51%, XSD +1.99%, SMHX +1.57% — with nuclear, fintech and the internet-of-things fund green behind them. Eight red, and the layer above the chip is all of them: defense tech −4.85%, software −4.50%, cybersecurity −4.03%, cloud −3.64%, then lithium, internet, quantum and grid. Last week: five green, all the layer above the chip; sixteen red, led by the silicon. This week: the exact inversion at board level. The three-week software-over-semis trend that this letter promoted from “tell” to “axis” seven days ago has been interrupted in one week — not overturned on the year, not overturned in the ratio’s two-month structure, but interrupted in the most emphatic single session of the summer.
2 · The State
The sorting rule broke — and the replacement is sharper: the market pays the number, not the beat and not the layer. Fourteen scoring windows closed this week, the record’s largest single week of the season. Seven paid: Nvidia +5.3% (the first paid Nvidia window since May 2024), Synopsys +7.2%, CrowdStrike +22.1%, Salesforce +25.3%, Elastic +10.3%, Dell +23.3%, GitLab +10.5%. Six sold: Marvell −12.9%, Autodesk −8.5%, IREN −9.2%, Rubrik −17.4%, MongoDB −15.1%, Palo Alto −8.0%. One flat: Workday +2.5%, one dollar under the paid line. Sort those by layer and the rule of last week fails on the first pass: three hardware and infrastructure names were paid (Nvidia, Dell, Synopsys), four software names were sold (Autodesk, Rubrik, MongoDB, Palo Alto). Sort them by the size of the beat and it fails again: MongoDB’s was its largest EPS beat in the covered record, Rubrik’s a raised guide, Palo Alto’s a seventh straight double beat — all sold. What sorts them is acceleration: whether the print showed a number still speeding up against a price that had already paid for the last speed. Dell’s $7.04 against $4.91, a 43% surprise on revenue up to $46.97 billion — paid 23%. Broadcom’s faultless quarter with a $34.8 billion guide that merely met the higher of two consensus numbers — sold 6.8% at Thursday’s low, closed −2.7%. Friday’s chart pick wrote the rule in one line: the market is not paying for beats; it is paying for growth that accelerates, and punishing anything that merely met a price already paid.
Broadcom is the rule’s exhibit for the week ahead, and its window is open. EPS $3.32 against $3.22, revenue $29.59 billion against $29.24 billion, AI-semiconductor revenue $16.7 billion, up 221% from a year earlier, against its own $16 billion target — and the stock was sold on the guide until the call put AI revenue at $115 billion for fiscal 2027 and $230 billion for 2028. It closed Thursday at 357.16, a dollar above the level that grades its window as sold, and Friday at 357.89, −2.95% on the week. The window scores at Tuesday’s close from a 367.24 anchor: Broadcom needs +2.6% by Tuesday to score flat, and the tape has to do it through Labor Day. A card that has flipped sign every quarter for a year — +10.0%, −16.0%, +8.9%, −17.2% — arrives at its next verdict with the whole chip complex having just risen 3.5% in a day.
The jobs number, taken seriously — because the tape took it two ways at once. Payrolls +162,000 against roughly 53,000; July revised from −23,000 to +21,000; unemployment 4.1% with participation rising to 61.6%. The rate market read it the obvious way: hike odds for September 16 back above 58% from Thursday’s coin flip, two-year 4.425%, dollar up, gold −1.4% toward $4,400, five of the seven largest technology stocks down. That is the discount-rate effect, and it hit everything whose value sits in the distant future — software and cloud −2, the long-duration growth lines, the ex-tech cuts. But a jobs report is also a demand statement, and the market put semiconductors on the cyclical side of that line: the Philadelphia index +3%, Nvidia toward its record, Applied Materials +5%, Astera Labs +11%. The same number raised the discount rate on the code and raised the near-term earnings expectation on the silicon. Friday’s split is not a rotation between two AI layers. It is the market grading one number twice, and the grades disagreeing by layer.
The veto, scored at the close — no fourth attempt; the belly was sold outright. Three weeks running IEF pushed above 93.17 midweek and was sold back by Friday, each push from higher than the last. This week it made no push at all: 92.74 Monday, 92.10 Tuesday — a new year-to-date low — 92.18, 92.28, 92.25 Friday. The 10-year touched 4.81% on Wednesday, its highest since November 2023; the 30-year finished at 5.247% from 5.207% with its buyback window starting Tuesday. TLT held its floor by a smaller margin — 82.21 against 81.2. Saturday’s letter carries the Pacific half, and it is the more interesting half this week: Japan’s 10-year closed above three percent for the first time since 1996 on Tuesday and was back under it by Friday, and Japan’s 30-year rallied — 3.970% from 4.125% — as the BoJ’s Takata talked “continuous” hikes and the yen went from through-160 to 156 in three sessions. The bond market has now declined to sign the equity resolution four weeks running. This week it did not even show up to argue.
The macro print was a number, and the number turned the September meeting into a hike question again. On Thursday Waller had the market at a coin flip for September 16. On Friday the payrolls put it back above 58%. Between them the yield curve did its own work: the belly at a year low, the long end selling and then steadying, oil through 90 on a shooting exchange in the Gulf that Saturday’s letter owns. The rate-hike-era pattern this letter identified on Warsh’s keynote — balance sheets bid, capex charged, hard assets sold — did not print on Friday. The balance sheets were sold (Microsoft, Amazon, Alphabet all red on the week), the capex layer was bid (Rubin +2.5% on Friday alone), and the hard assets were sold. One session is one session; but this session contradicted the template of the last one, and the only consistent reading across both is the one the print record gave: the market pays what is accelerating, and on Friday the accelerating thing was the economy.
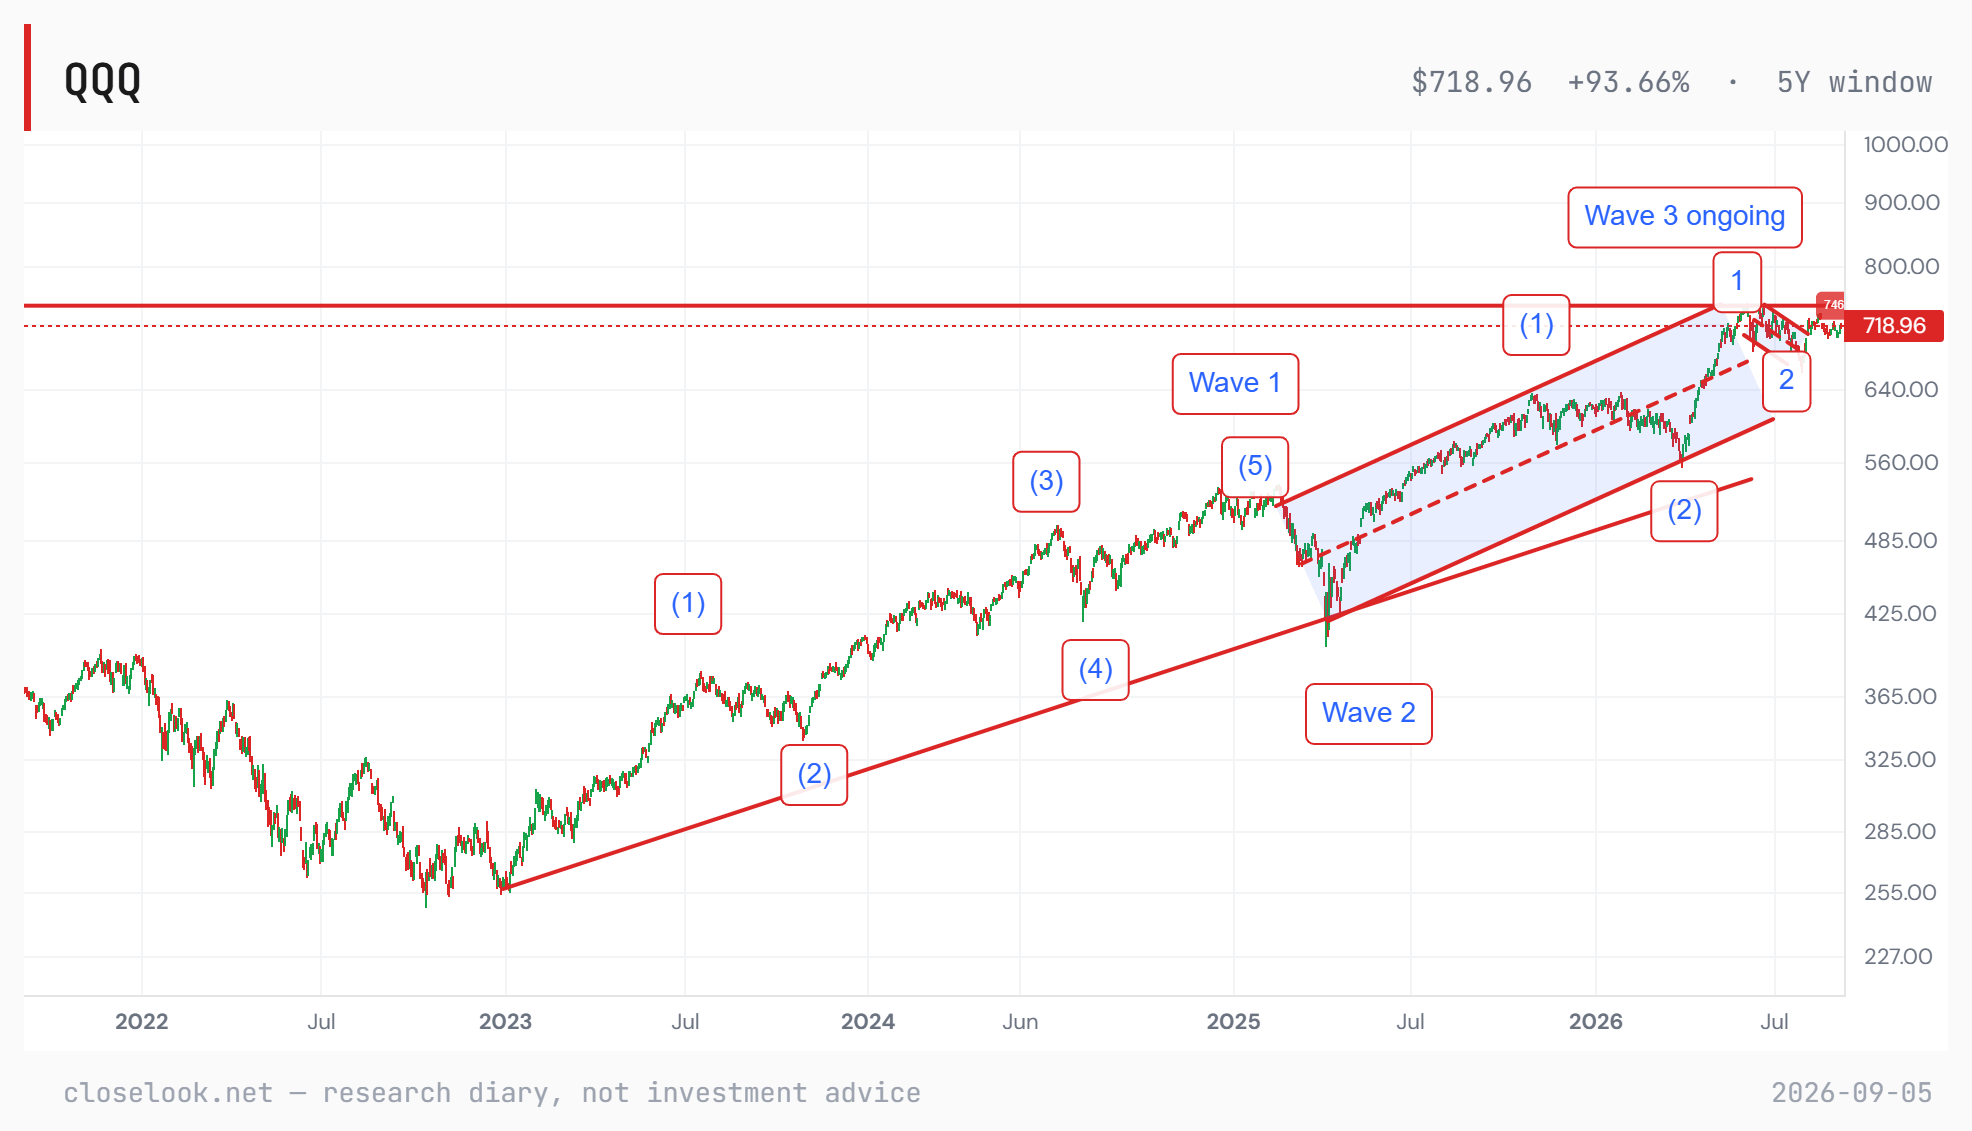
The count — above the average, both lines live, neither approached. The Nasdaq 100 closed 718.96 against a 50-day at 711.08 — 1.1% above, from 0.6% last week. The map is unchanged: 1-2 off the April low, wave 3 ongoing, 746.16 the confirmation (3.8% above), 694 the kill-switch (3.5% below). The week traded a 707.64 low on Tuesday and a 718.96 high on Friday’s close; neither line was in play. Saturday’s letter carries the five-year count on the world ex-US, which took its record close on Friday — wave 3 progressing, the three-week postponement over. The two counts still agree, and the domestic one is now the laggard: the world ex-US confirmed, the Nasdaq 100 is still 3.8% from doing so.
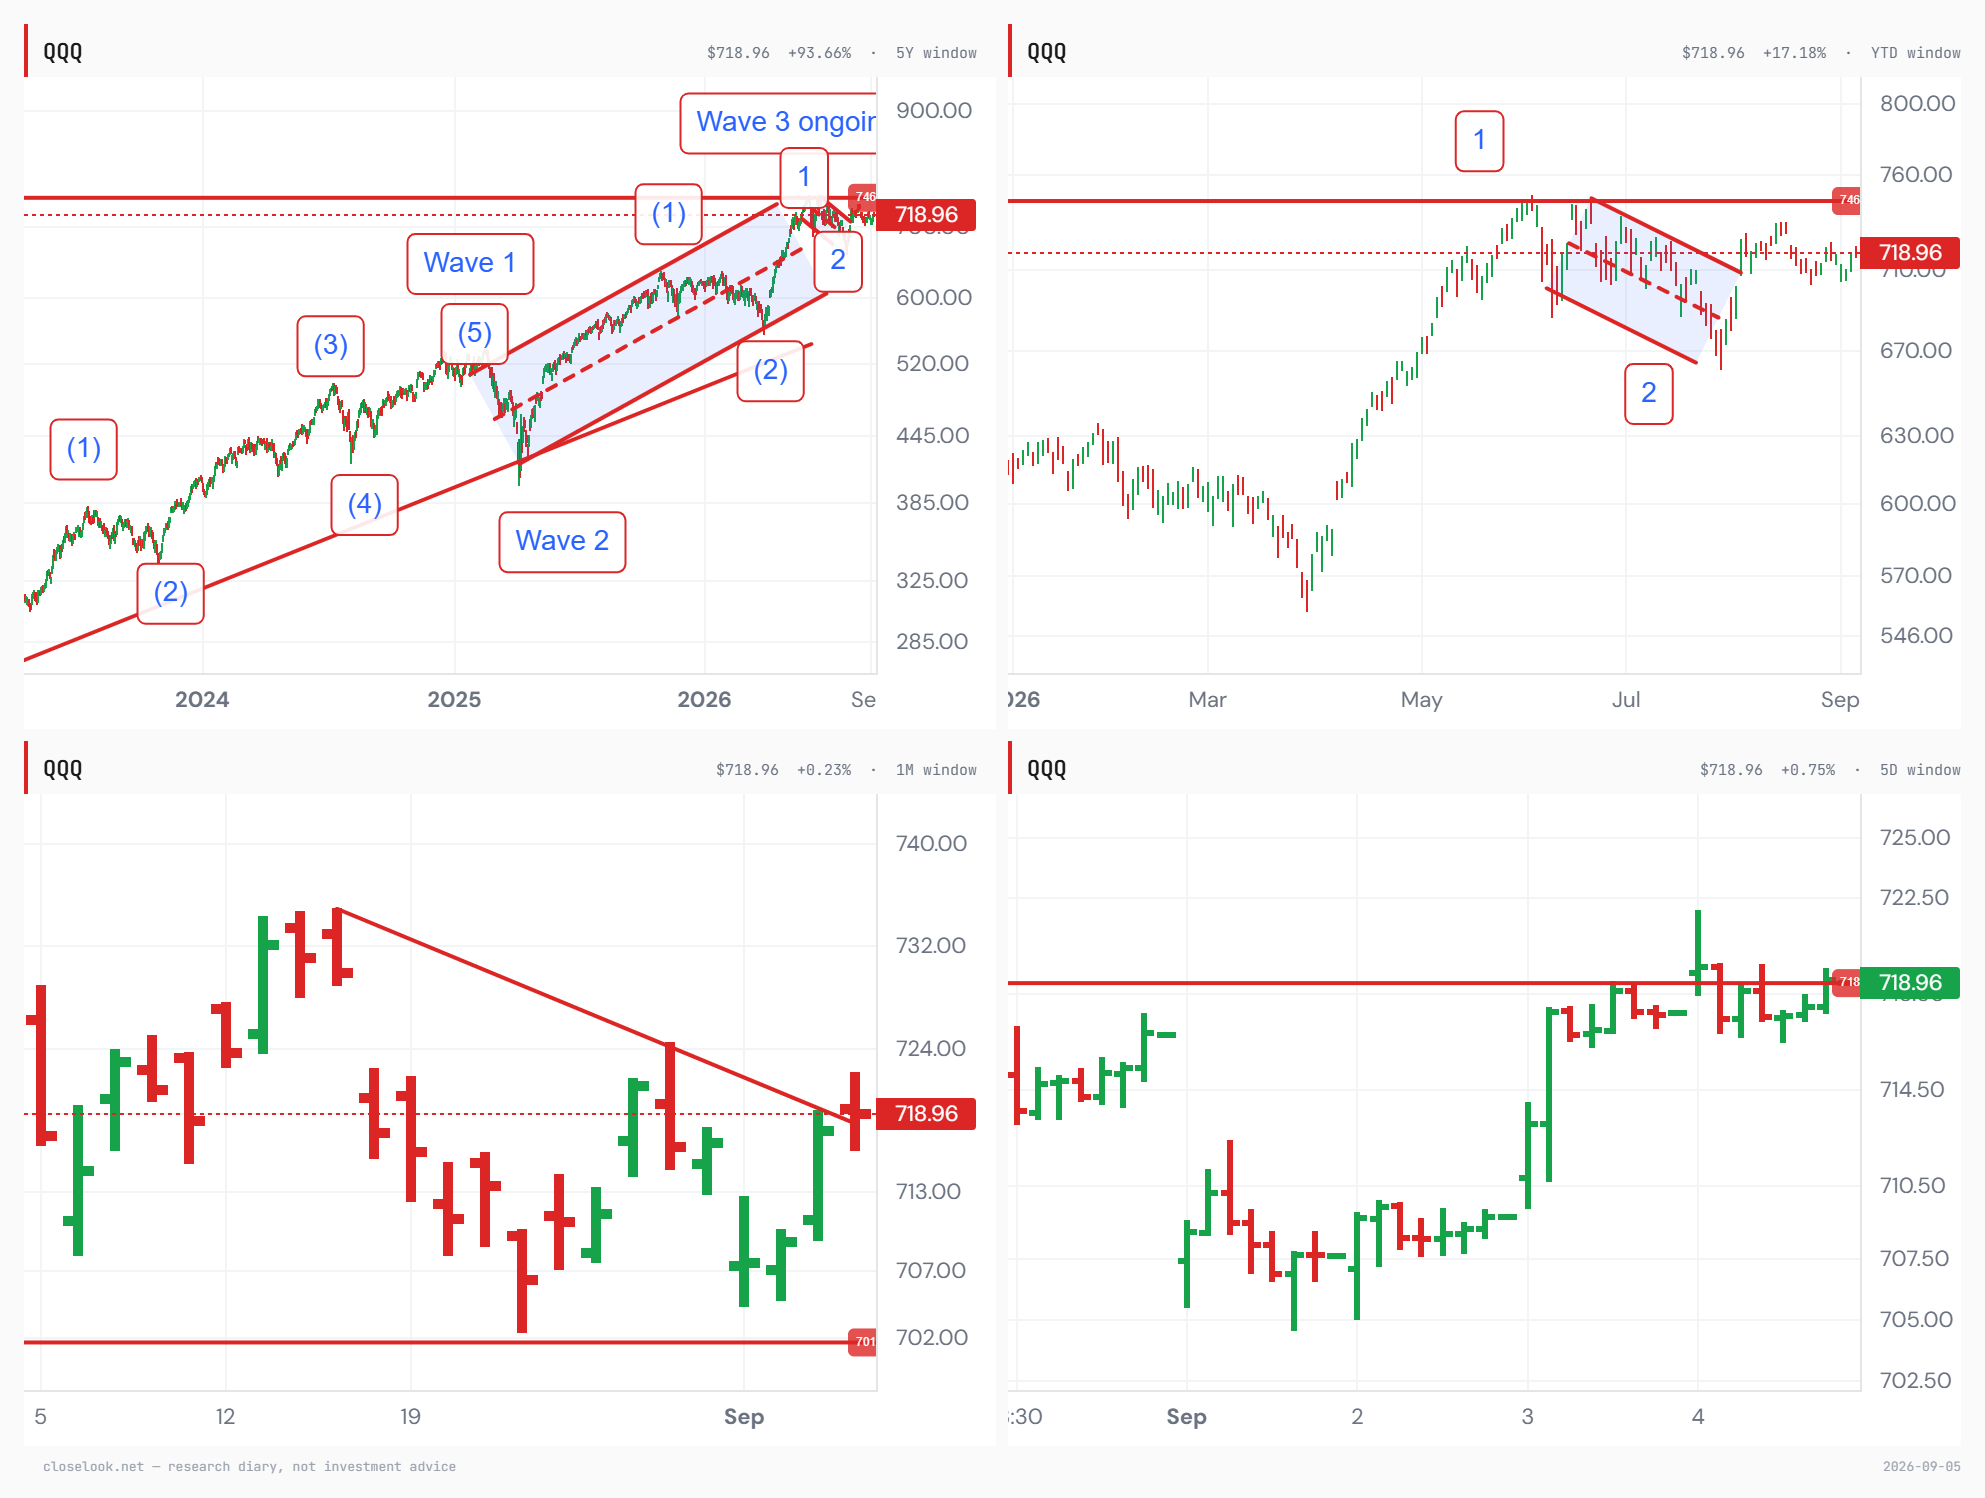
The same chart at four focal lengths. The house grid runs the count through its windows: the five-year view carries the wave structure — 1 and 2 complete, wave 3 ongoing inside its channel; the year-to-date view shows this summer’s 1-2 sequence against the 746 line, the 2 low held; the one-month view frames the index under the descending line from the mid-August high — Friday closed exactly on that line at 718.96, with the 701 shelf untested below; and the five-day view shows the week’s own micro-structure: Tuesday’s bond-rout gap down to 707, Thursday’s jump back to 718, and two sessions pressing against a flat 718 top. Four windows, one reading: an advance pausing at descending focal lengths — and the two smallest windows now sit at their line, not below it. A close above 718 on Tuesday resolves the month’s line upward; the count above does not need it, but the week ahead will read it.
3 · The Outlook
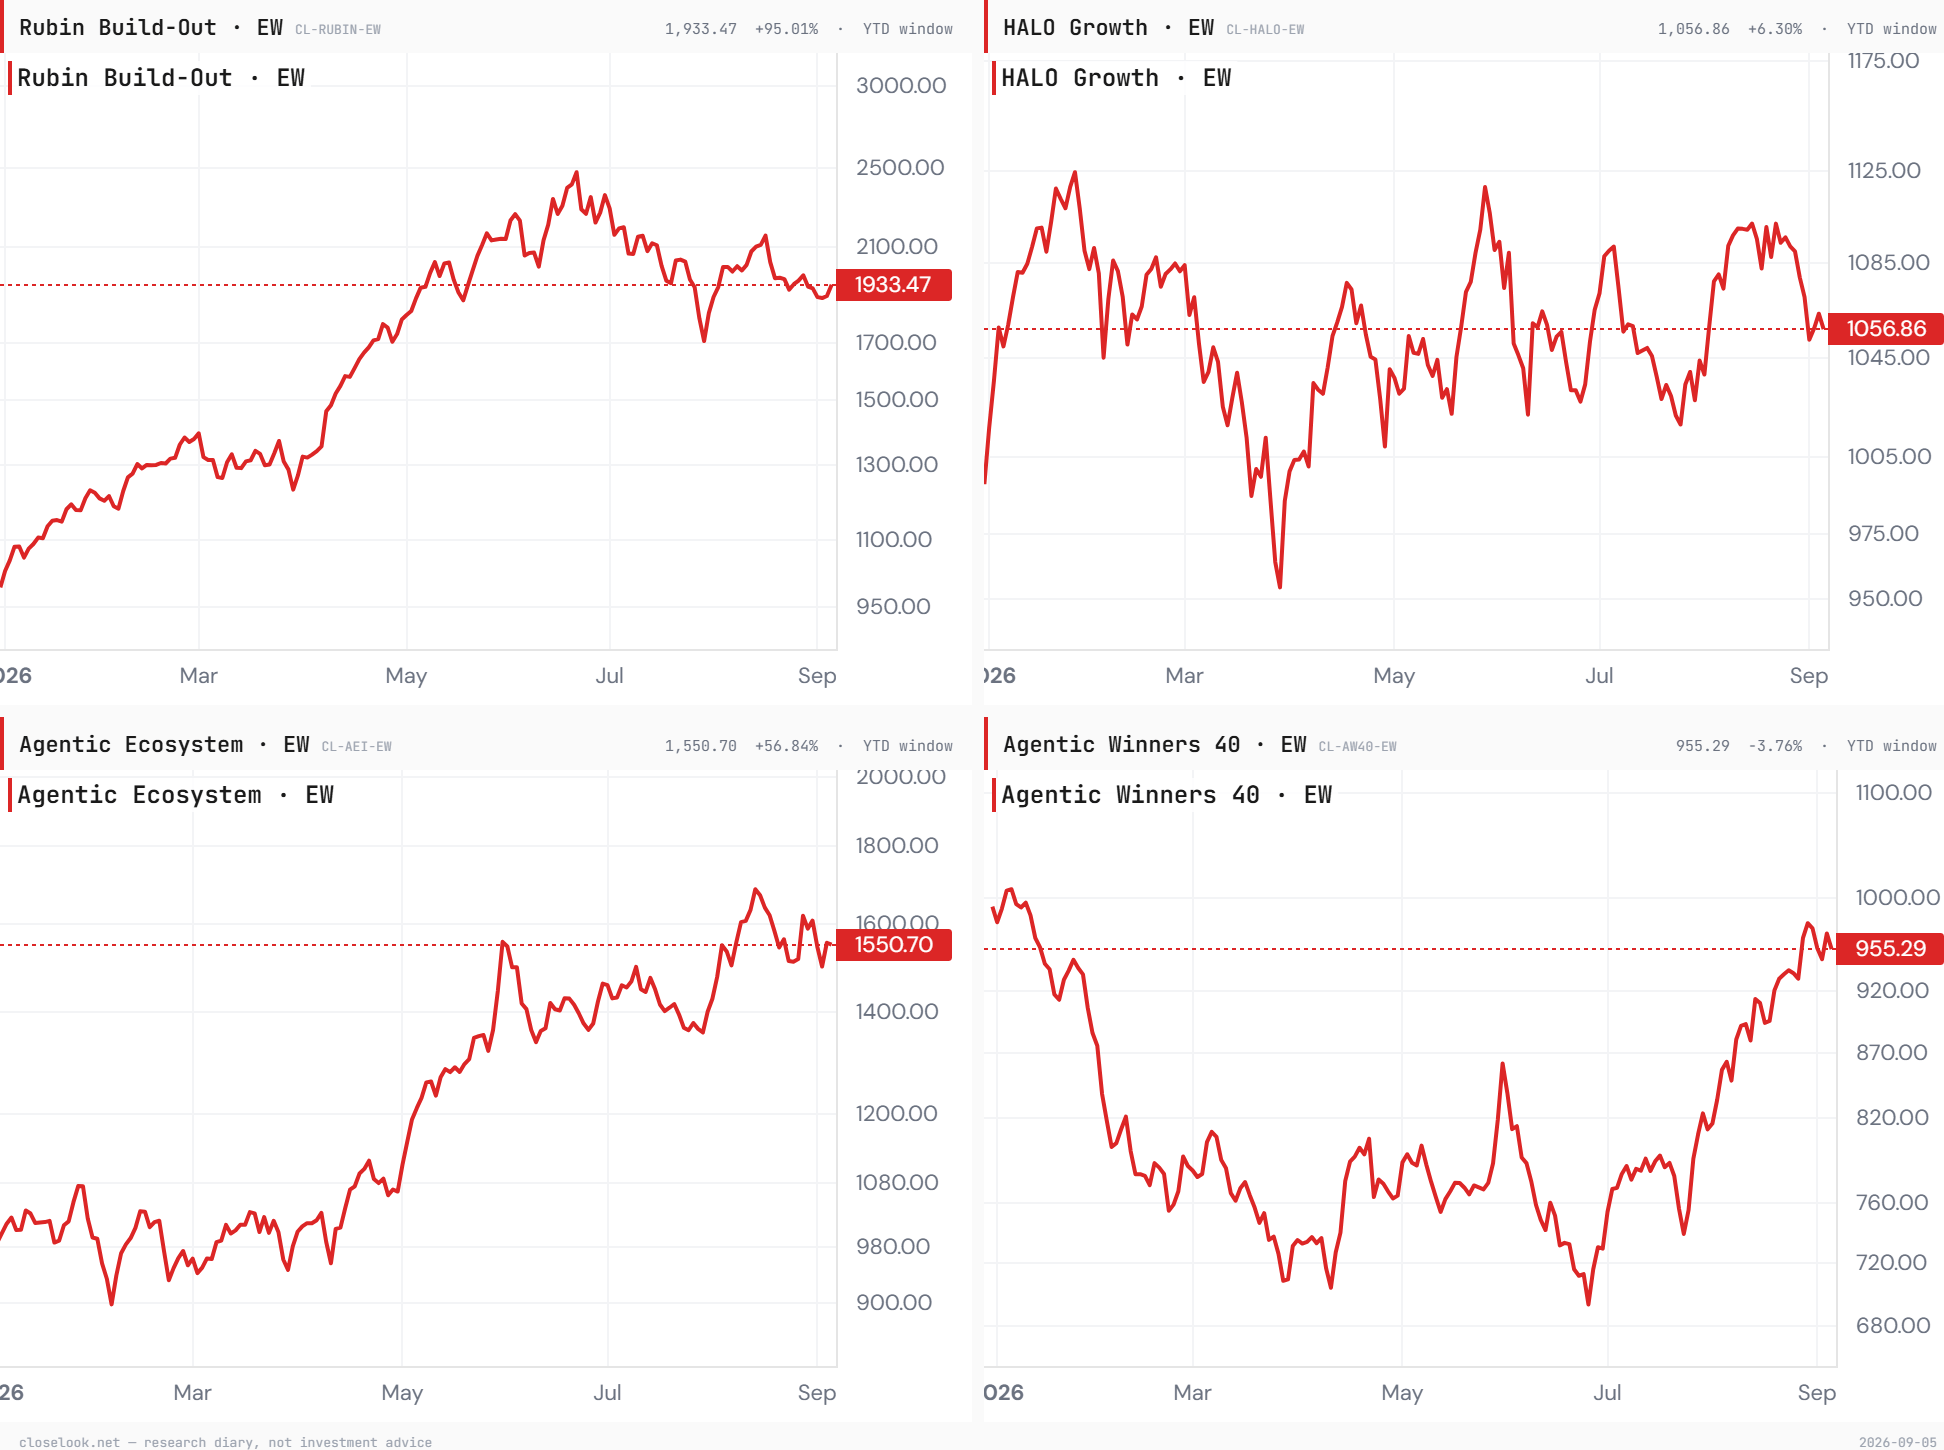
The four indices — the physical layer separated from the pack, and it did it on Friday. The family printed the week’s split in one row: Rubin Build-Out +0.40% (the capex layer, +88.1% on the year — the only green line, and green only because of Friday’s +2.5% session: 1886.14 to 1933.47), HALO −2.02% (broad growth, no AI thesis; +4.0%), Agentic Winners −2.30% (the applications; back under water on the year at −2.4%, from −0.12% a week ago, one week after this letter wrote “one ordinary week from a green year”), Agentic Ecosystem −2.39% (the opex layer; +57.1%). Across the Atlantic Euro-AI −3.4% through Thursday, its defense cluster −6.9% and its semiconductor cluster the only green sector at +0.2%. Last week the lightest layer led for a third week and the capex layer was the casualty. This week the lightest layer was the casualty and the capex layer led — by one session.
The control group did not flip this time, and that is the week’s most important internal. For two weeks HALO and the AI layers alternated: an AI unwind, then an AI bid inside a growth sell. This week HALO −2.02%, applications −2.30%, opex −2.39% — all three within forty basis points of each other, all three red — and only the physical layer apart. This was not an AI-versus-growth week. It was a duration week: everything priced on next year’s earnings fell about two percent together, and the one layer priced on this year’s shipments rose. Inside HALO the ladder says the same: Latin America +2.18%, space +2.08%, longevity +1.80% green; destination economy −6.27%, autonomous defense −5.84%, surgical −3.96% red — four green of twenty-three.
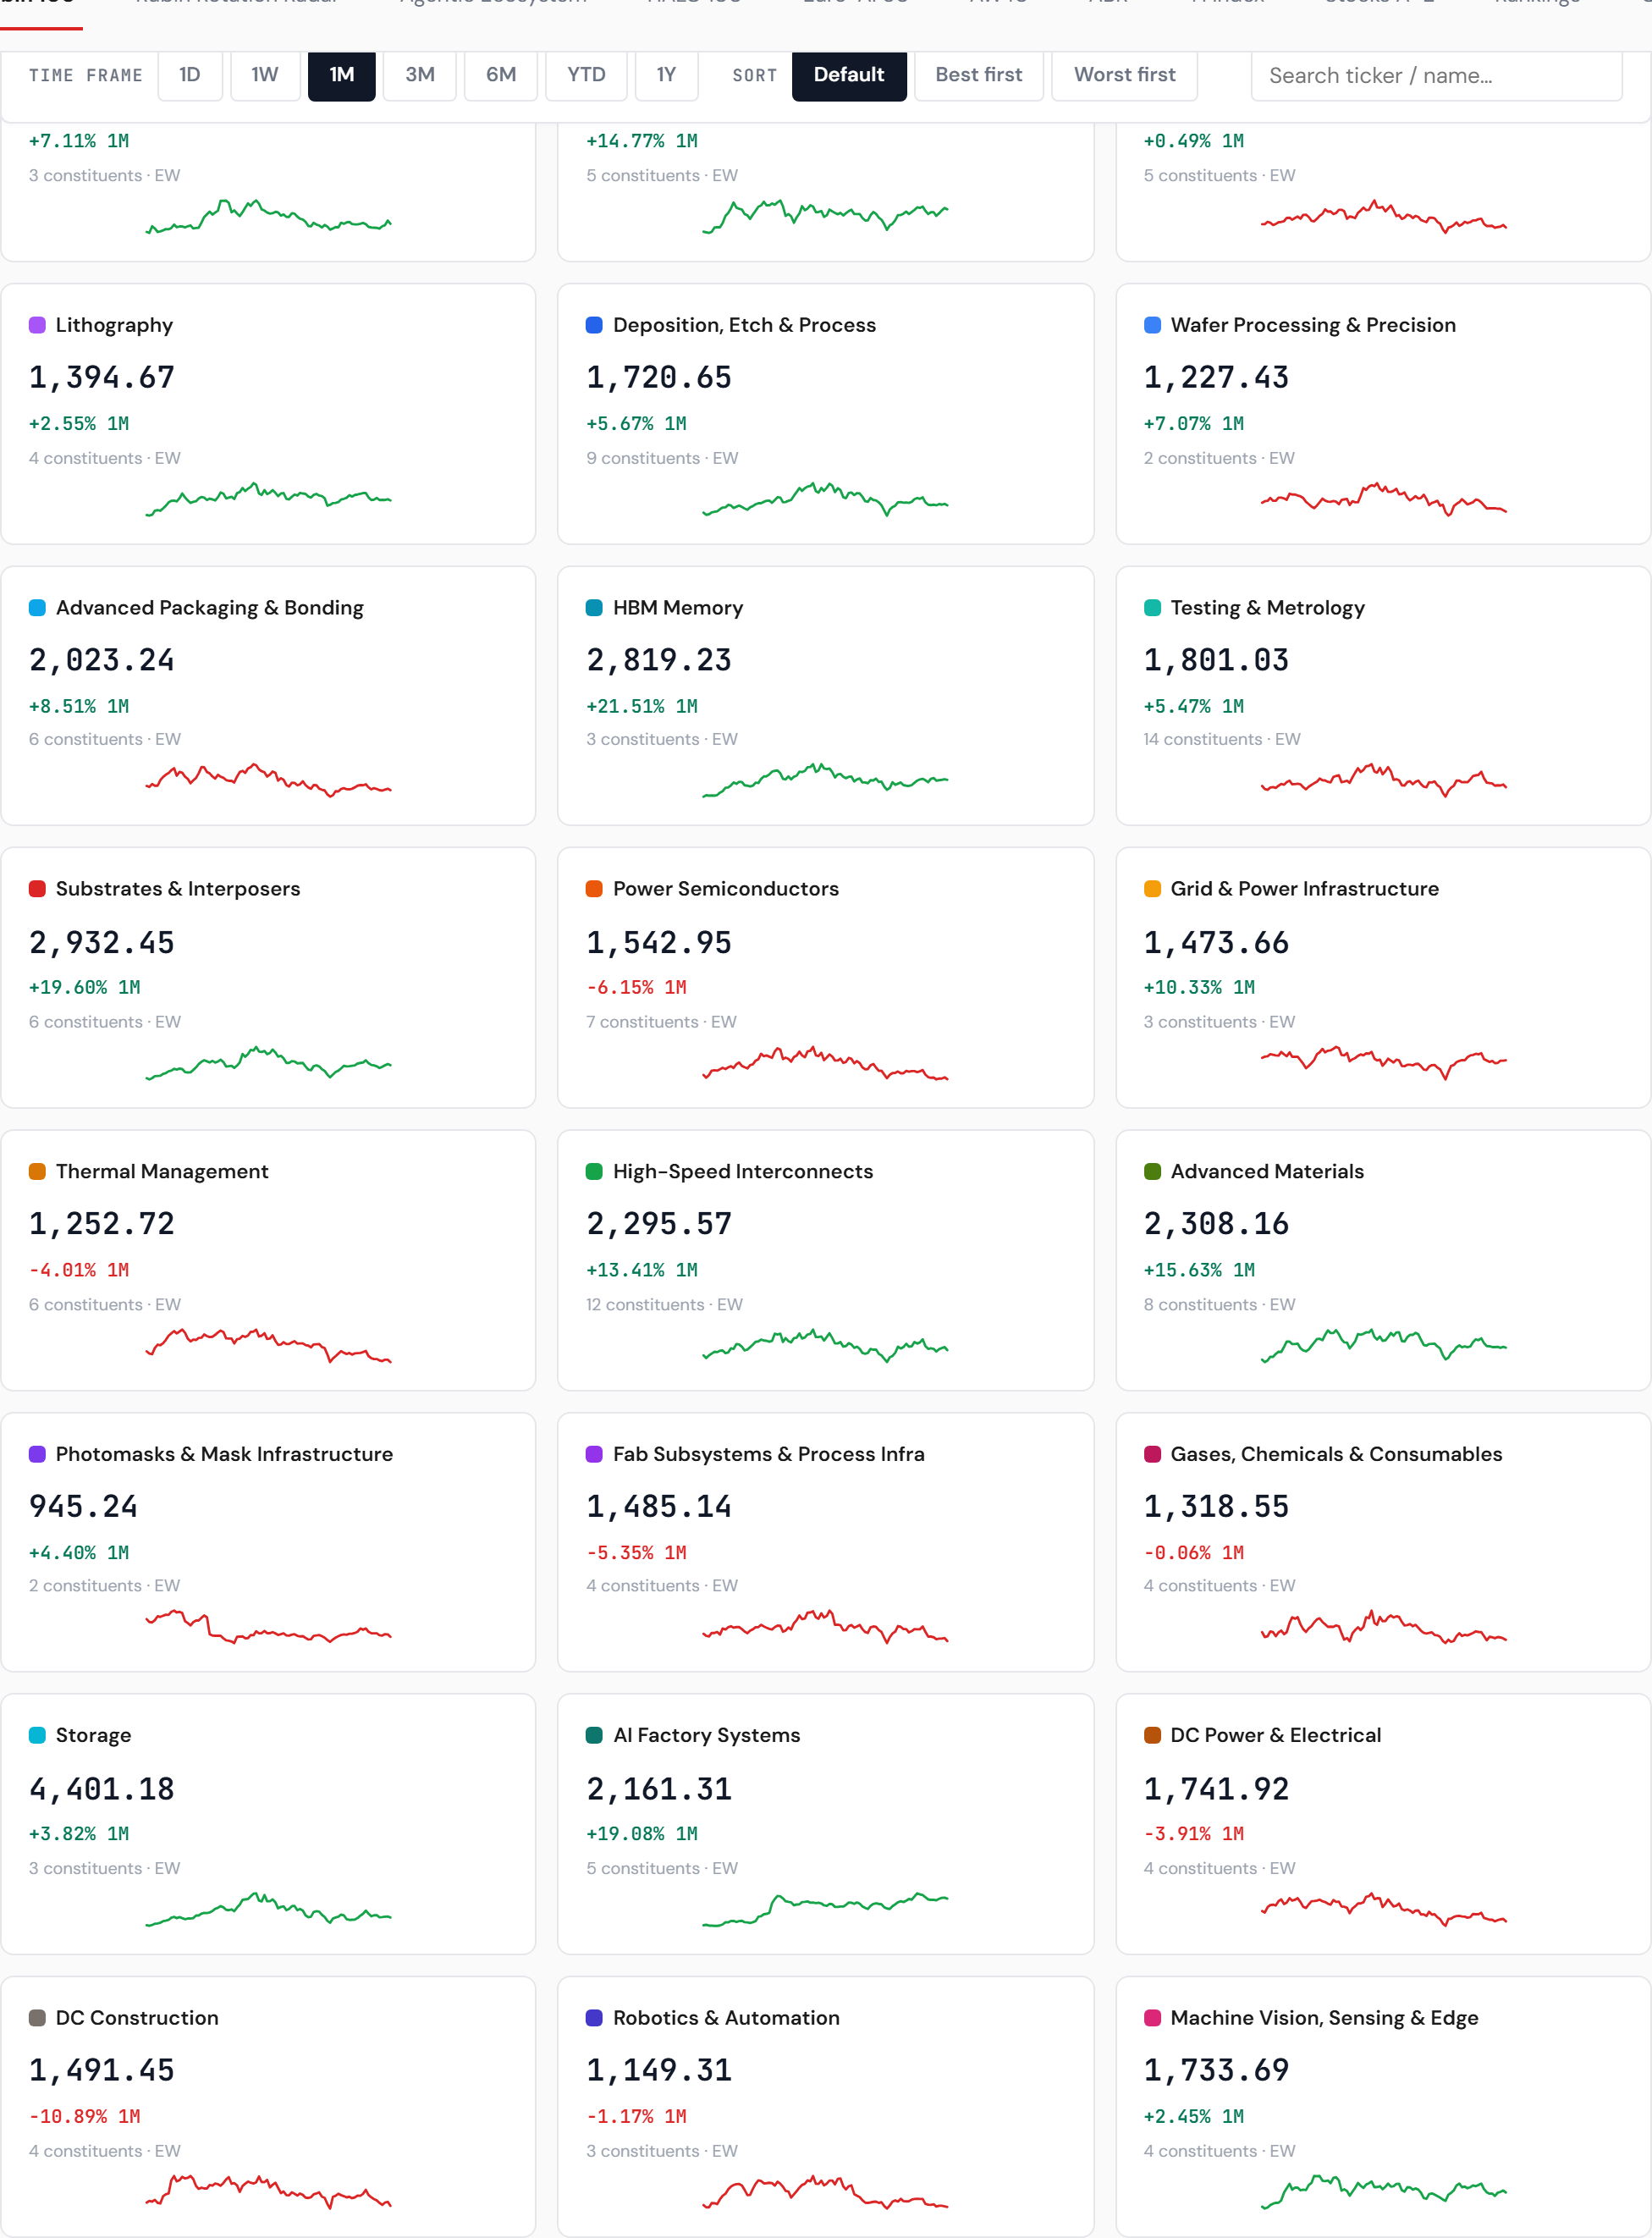
Inside the indices — where the week actually happened, and where the month is happening. Inside Rubin the top five are the physical stack, every one: Storage +11.04% (+357% on the year), AI Factory Systems +5.51%, DC Power & Electrical +5.17%, AI Factory +4.93%, Thermal Management +4.79% — twenty-two of thirty-six sub-indices green. The bottom is the buildout’s software: EDA & chip IP −7.76% — last week’s best line — high-speed interconnects −6.12%, wafer processing −4.94%, design −2.15%. Widen the window to the month and the old leaders are back on top of the whole tracker: Storage +17.1%, HBM Memory +15.8%, AI Factory Systems +11.4% lead the thirty-six on a one-month view, with wafer processing −20.3%, fab subsystems −14.2% and interconnects −10.3% at the bottom. The memory-and-storage complex that spent August draining from the highest flow scores on the board — SanDisk, Kioxia, Micron — is the month’s leader by price. Inside the Agentic Ecosystem the bid went to the operators for the first time in four weeks: compute operators +3.69%, the layer’s best line, Asia constituents +2.20%; at the bottom, operations & observability −7.93% — the worst sub-index in the entire four-family system, edge −3.99%, data & memory −3.82%, govern & secure −3.62%. Inside Agentic Winners, two green of nine: Asia +0.95%, megacap gateway +0.61%; control plane −4.36% and Europe −4.36% worst. Thursday’s Daily Pulse argued the next scarcity is permission to act — the governed, observable, reversible path from an enterprise’s own data to a transaction. The market spent this week selling exactly the sleeves that thesis names: observability, control plane, governance. A thesis and a tape disagreeing this cleanly is either an entry or a warning; the print record above says which names the market is still willing to pay in that layer, and it is a short list.
Best and worst week, by name — the mirror, fourth week running, and it favoured the silicon. Across the family’s constituents, the five best: IREN +26.0%, Bloom Energy +20.0%, Soitec +18.8%, SanDisk +17.2%, Dell +14.9% — then Appier +14.5%, Kioxia +13.7%, Viasat +11.8%, Modine +9.6%, Vertiv +9.1%, Micron +9.0%. Nine of the eleven are capex names — storage, power, cooling, the operators — the exact inversion of last week’s list, which was nine software and application names with not one chip. The five worst, with Amphenol excluded from the list as a split artefact in the worker’s data this week: Credo −26.7%, Unimicron −18.7%, MongoDB −17.4%, UiPath −16.3%, Axon −14.2% — then Cadence −14.0%, JFrog −11.3%, Synopsys −11.0% (after its paid window closed Monday), Fastly −10.6%, Palo Alto −10.3%, PTC −10.3%. Fourth consecutive week in which the prior week’s hero list leads the casualty list — Synopsys and Cadence were the EDA leaders seven days ago; IREN was the third-worst name in the system. The medians: capex +0.72%, opex −2.09%, HALO −2.15%, applications −2.38%. Green counts: 67 of 126 in the buildout, 30 of 96 in HALO, 12 of 34 in the opex layer, 11 of 40 in the applications.
The AI Handoff Board — the up-stack run stopped, and the operators turned. The handoff ratios had three consecutive weeks of the stack handing value up. This week: use-against-build −2.70% to 1.5967, beyond-gateways −4.10%, use-against-operate flat (+0.09%) — the applications gave back against the builders. The sharpest line is inside the buildout: verification-against-design +9.52% — test and metrology re-rating against the EDA names that led last week. And the line this letter has watched for a month reversed: operators-against-suppliers +3.26% after −4.79% a week ago — the neoclouds rising against the chipmakers that supply them, for the first time since the capacity trade was marked down in August. Trust-against-execution −0.23%: the security spike of last week went flat, and its names (Palo Alto, Zscaler) were sold.
The hyperscaler cohort — through the shelf on Thursday, back under on Friday. The Mag Pulse board reads the basket at 69.44, +0.54% on the week — 0.09% below the 69.5 shelf that has capped it since spring. It closed through the shelf on Thursday at 70.43 — the first close above it since spring — and was sold 1.41% on Friday to six cents under. Underneath, the composition inverted from last week: Meta +6.70%, Nvidia +5.89%, Tesla +1.53%, Apple +0.08% — and the three hyperscalers red: Alphabet −2.35%, Microsoft −2.69%, Amazon −2.97%. Last week’s re-concentration was the rate-hike-era playbook — the companies that fund themselves. This week the same basket beat equal-weight by 1.3 points while its self-funding trio fell: the money went to the chip and the chip’s largest customer. The shelf test is now a daily-close test; a weekly close through 69.5 has been attempted once and refused once. The December pivot at 62.56 is not on the map.
Compute tightness — the operators’ first green week in four, on the number. For three weeks this letter recorded the neoclouds marked down against the most supply-constrained guide of the cycle. This week: Nebius +8.23%, CoreWeave +3.65%, IREN +26.04% — the best name in the entire system — the compute-operators sub-index the best line in its layer at +3.69%, and the operators-against-suppliers ratio +3.26%. The demand statement did not change; the funding backdrop, on paper, got worse (the belly at a year low, hike odds up). What changed is the payrolls read: a stronger economy is more usage, more inference, more rented compute. The market paid the capacity traders on the cyclical reading of the same number that sold the software. That is one week against three. The book’s tilt watches the ratio, not the week.
The financing architecture underneath it — the special analysis is in production. Last week this letter announced a separate Closelook analysis of the August 10 platforms — the $500 billion of third-party capital that Nvidia, Apollo, BlackRock, Blackstone, Brookfield, Goldman and KKR are mobilizing to make AI factories an investable asset class, with Nvidia reportedly standing behind residual GPU values for up to a quarter of a project. The week added the other half of the picture: Nvidia agreed on Thursday to buy Hugging Face for $12.93 billion — roughly 86 times its revenue — nine months after paying about $20 billion for Groq’s assets, and disclosed supply and capacity commitments of $279 billion, from $119 billion three months earlier. Friday’s Daily Pulse read the two purchases as one ecosystem: the chips that serve existing models and the platform where open models are shared, bolted onto the supplier that finances the factories. The analysis publishes separately on closelook.net; this letter’s interest is narrower — a supplier that owns the model marketplace, the inference silicon and the financing vehicle is a supplier whose customers’ equity is being priced around its balance sheet, and this week the market priced those customers up.
Structural inflation — contained, unchanged, while the curve did everything else. The house composite in the macro lab reads 49, “Contained”, direction flat, structural character “Mixed” — unchanged from last week to the point. A supply-shock impulse registers (oil, Hormuz) and the gauge’s own note says it is not spreading to breadth or expectations. Hold that against a two-year at 4.425% and a September hike above 58%: the market is pricing the Fed on growth, not on inflation, and the gauge agrees with the market’s decomposition. If CPI on Friday disagrees, this paragraph changes first.

Breadth and temperature — narrowing, cooling, then warming into Friday. Equal-weight lost 0.77% against cap-weight’s +0.11% — the second cap-weight week — while the Money Temperature composite went 57 to 49 midweek to 55 on Friday, transition band, the state reading “risk-on rally”. A gauge that cooled eight points into Wednesday’s bond rout and recovered six of them on a hawkish jobs print is reading the same thing the factor pair read: appetite returned on Friday, and it returned narrowly — into the silicon, into the operators, into two megacaps.
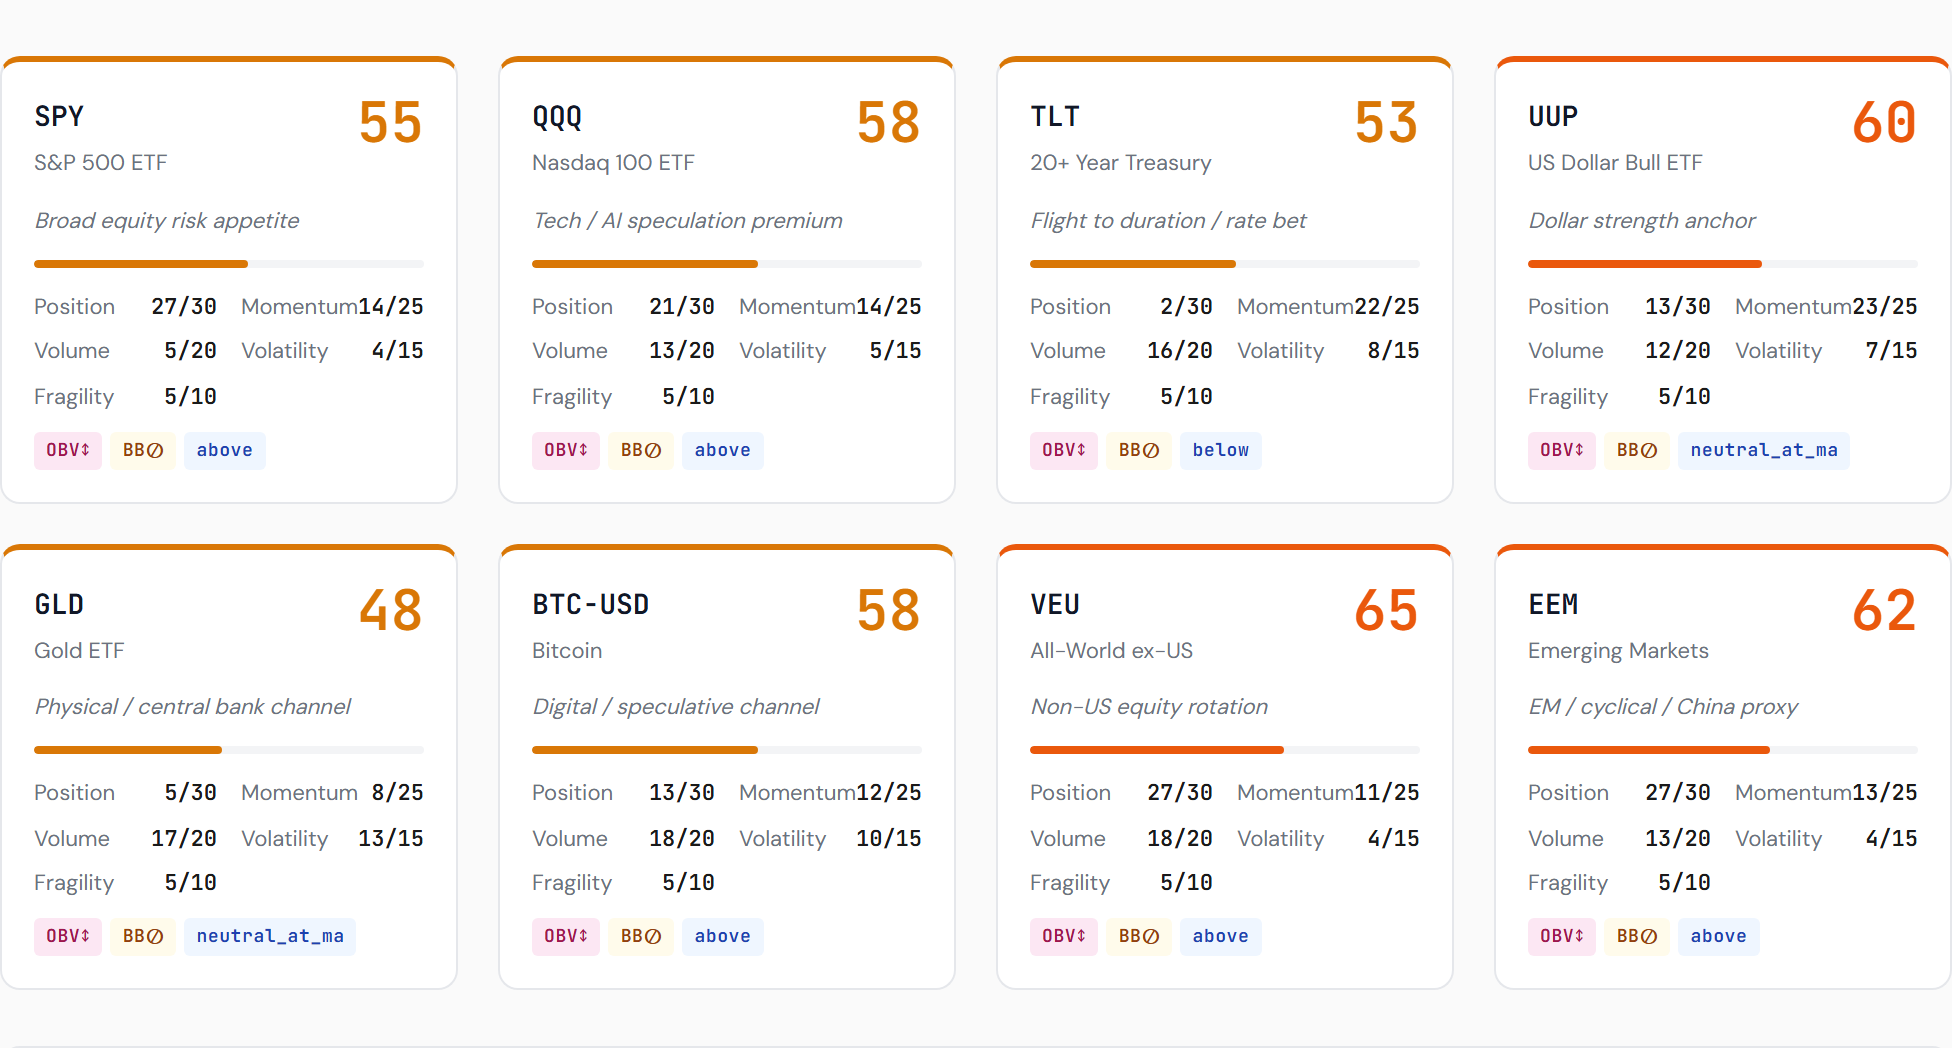
The count, restated for the week ahead. Above the 50-day by 1.1%, 3.8% from confirmation, 3.5% from the kill-switch, with a holiday Monday, five scoring windows Tuesday and Wednesday, Oracle Tuesday night, Adobe Thursday night, the ECB Thursday, CPI Friday and the Fed the following Wednesday. The referees are booked, and this week they are macro referees.
