


Underneath it, the ledger disagrees with the tape in one specific corner: the week’s best-performing sector is the week’s worst flow.
Edition of 2026-08-16 · from the C+ archive
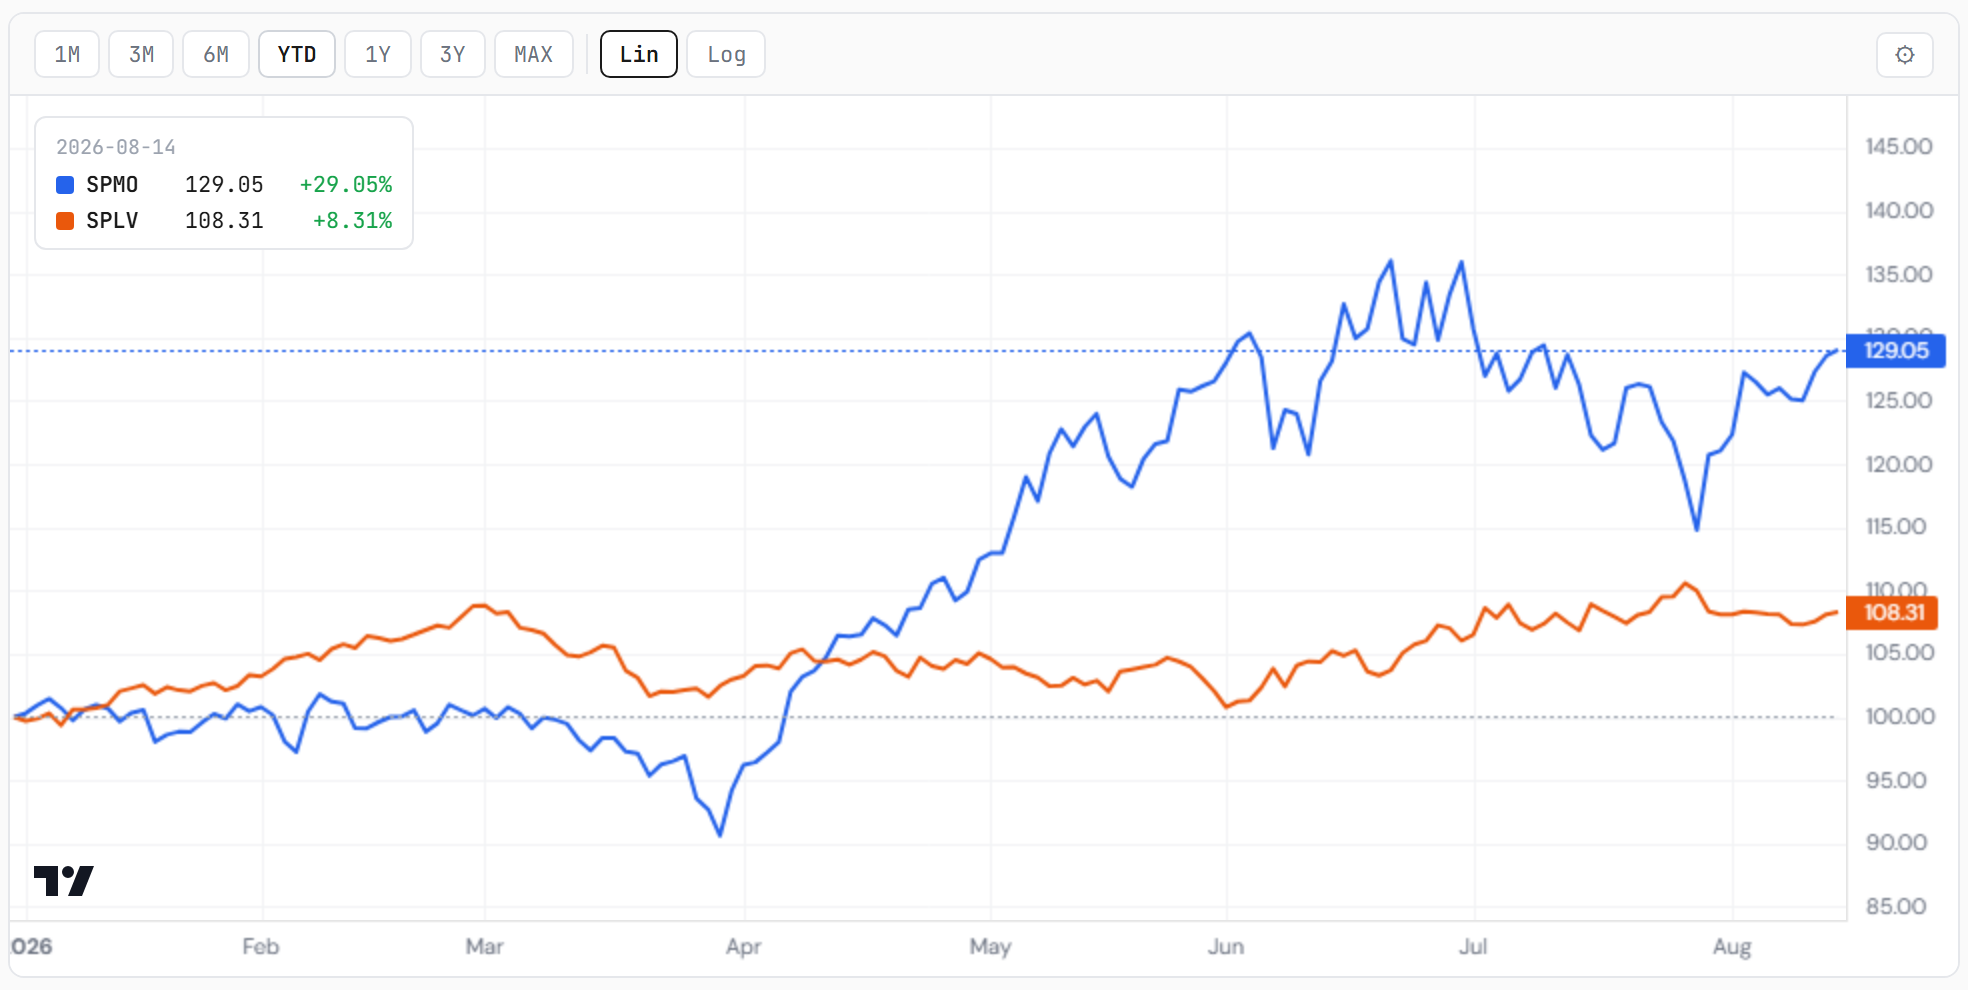
1 · This Week’s Action
Where this letter sits. Sunday’s US edition reads this market at index and sector degree — the tape, the levels, the count. This one reads it at name altitude: which individual companies the money actually went into, which ones it left, and what the flow behind each is doing. Same market, one rung lower, and a strong bias toward the AI complex because that is where the growth is currently priced.

The backdrop, one line. Two cool inflation prints, a stagflation-shaped demand miss on Friday, an index that moved four tenths of a percent, and a volatility gauge that fell to 14.32 through all of it — the quietest possible surface over the season’s most violent single-name sorting.
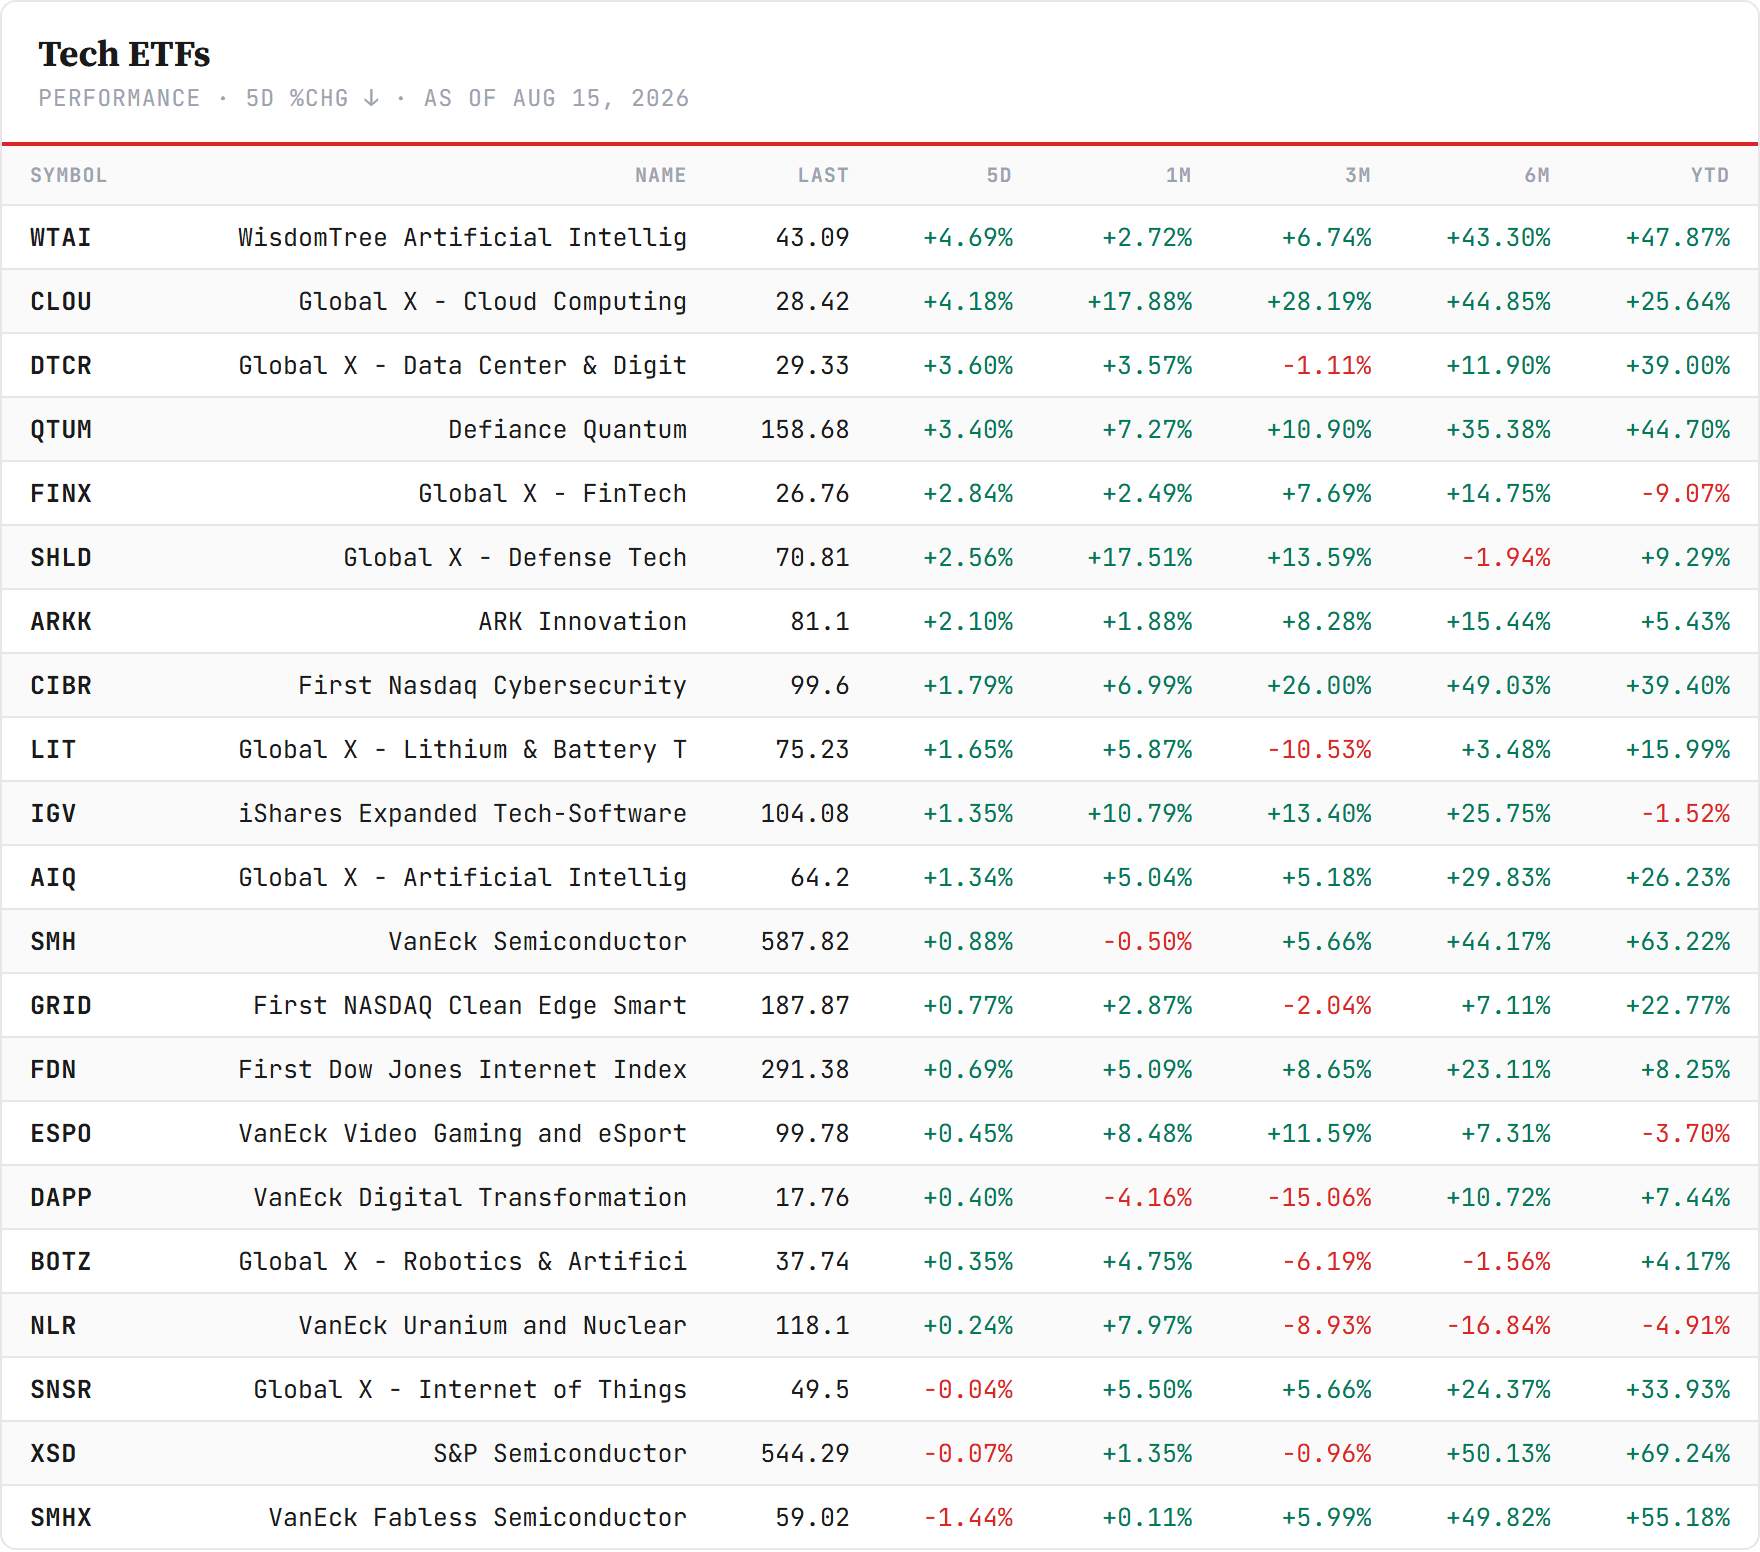
The tech shelf — the infrastructure cut led, the year’s winners lagged. The sleeves this cohort lives in sorted cleanly: WTAI +4.69%, cloud +4.18%, data-centre REITs +3.60%, quantum +3.40%, cybersecurity +1.79%. Software managed +1.35% and remains −1.5% on the year — a de-rating not repaired by one good fortnight, which is the whole subject of this letter.
And the bottom of the shelf is the tell: fabless semis −1.44%, small-cap semis −0.07%, both red in a green group and both up more than 55% for 2026. The names that ran hardest into this week did the least in it.
The factor view — momentum at the 95th percentile. The factor-regime gauge reads momentum-leading, risk appetite building: momentum against low volatility at 2.0077, the 94.6th percentile of its own history, above its 50-day trend, with momentum’s twenty-day rate of change at +6.55% against low-vol’s −0.27%.
For this cohort that single number is both the tailwind and the risk. Hypergrowth is the highest-beta expression of a momentum regime, and a spread that far into its own distribution is also the thing that unwinds hardest when it turns. The equal-weight cut beating the index three to one — RSP +1.22% against SPY’s +0.40% — says the participation underneath is real, which is the version of this regime that lasts.
The pair behind that ratio is tradable, and for this cohort it is not an abstract gauge — it is a mirror. The S&P Momentum ETF closed at 153.31 against the Low-Volatility ETF’s 76.36; over sixty days momentum compounded +9.02% against low-vol’s +3.99%, over twenty +6.55% against −0.27%. The defensive leg has stopped moving while the aggressive one keeps going.
Hypergrowth is the high-beta expression of that spread. When this ratio advances, this cohort is what it advances into; when it mean-reverts, this cohort is what gets sold to fund the reversal. So the 94.6th percentile is not background colour here — it is a direct reading of how crowded the trade this letter covers has become.
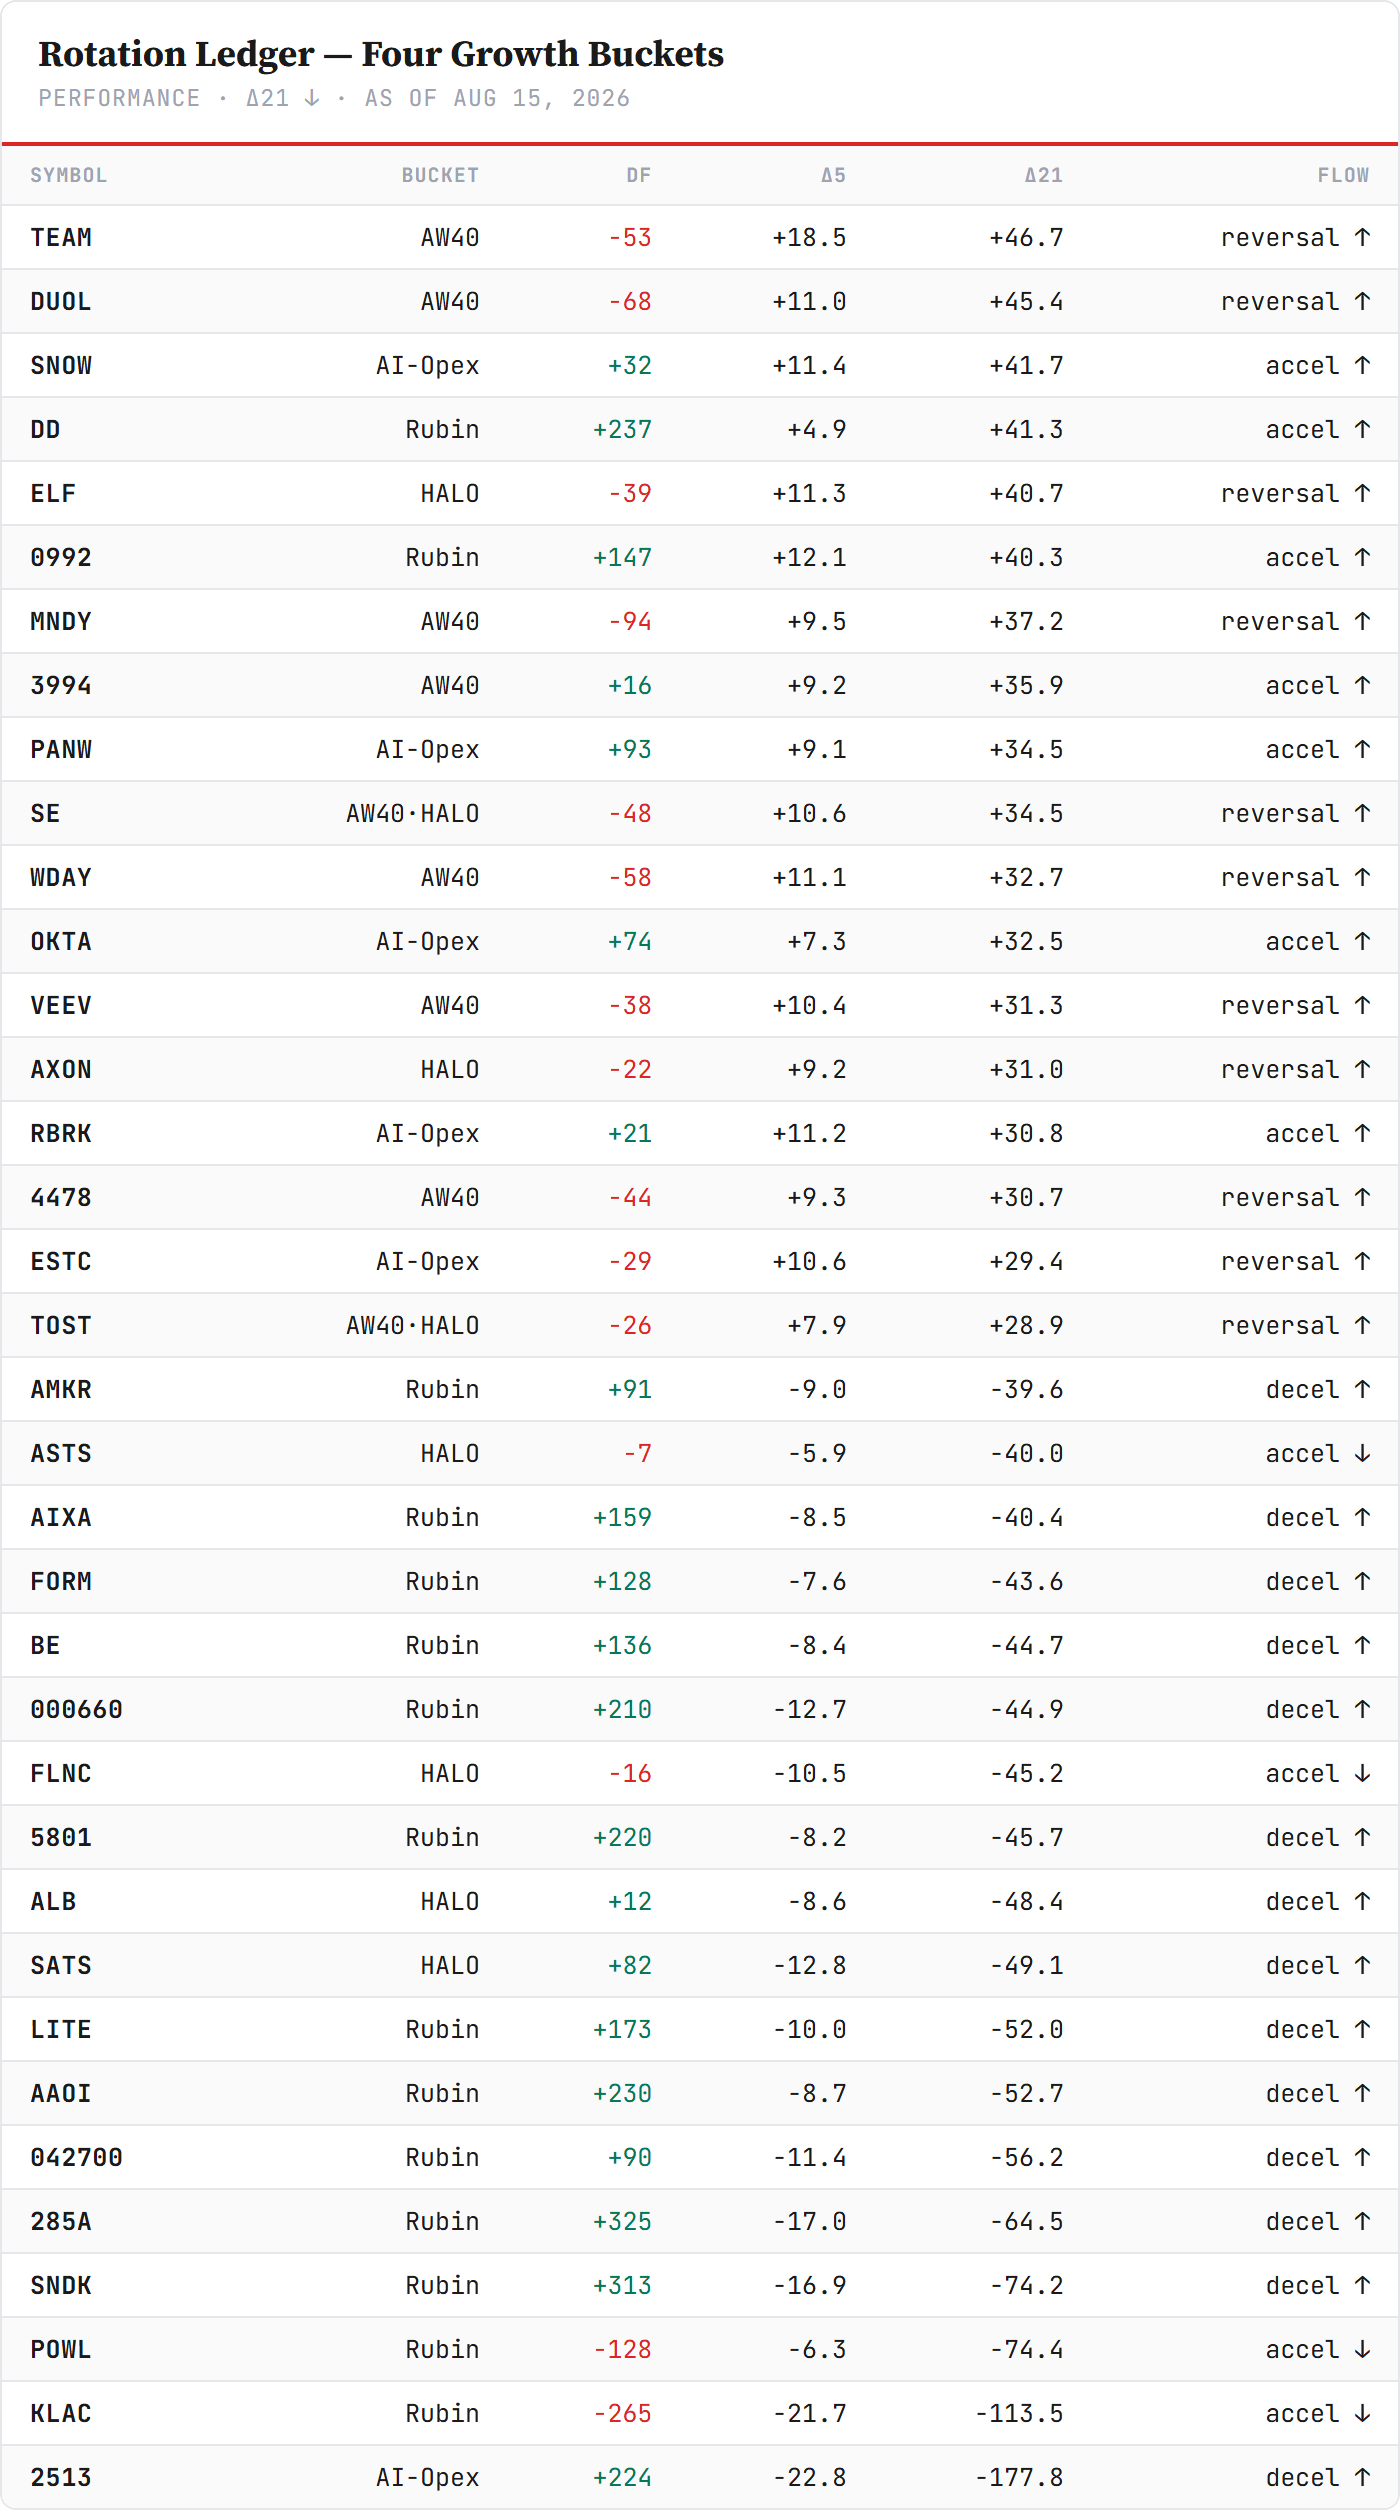
Our own board — the Rotation Ledger. The Directional Flow scan, now current through Friday’s close, reads: 73 accelerating-up, 74 reversing-up, 166 decelerating-up, 71 flat, and only 42 accelerating-down across 426 instruments. One in three building flow, barely one in ten losing it outright — a broad tape by our own instrument, not merely by the index print.
But read the windows separately, because they say different things. The 21-day builds are dominated by names that reported ten days ago — Atlassian +46.7, Snowflake +41.7, e.l.f. Beauty +40.7 — and that is the residue of prints already scored, not fresh accumulation. A 21-day window in earnings season is mostly a record of gaps that have already happened.
The five-day cut is the honest read of this week, and it says something narrower: Atlassian +18.5, Lenovo +12.1, Snowflake +11.4, e.l.f. Beauty +11.3, Rubrik +11.2, Workday +11.1. Several names appear on both lists — those are the ones still being bought after the gap rather than merely carrying it. Workday’s presence is the interesting one: the flow was building before Thursday’s takeout report, which is not proof of anything but is the kind of thing this board exists to notice.
And the five-day bottom is the week’s real warning, unchanged in either window: Z.ai −22.8, KLA −21.7, Kioxia −17.0, SanDisk −16.9 — the memory and equipment complex, draining flow while its prices led the capex table.
How Directional Flow works — for new readers
Level (trend strength). A weighted linear regression on log prices over the last 252 trading days, with recent days carrying heavier weight. The output is the annualised slope in percent: how strong and how persistent the trend is right now. Most stocks score below 100; only exceptional trends run far above it, and the score can be negative.
Flow (our leading layer). We compute that level not only today but also as it stood 5, 21 and 63 days ago. The difference is the leading indicator: positive means the trend is accelerating, negative means it is losing strength. Price usually reacts later.
Why the 21-day change matters. Price is the slowest signal. Trend strength is coincident. The change in trend strength is what leads. A stock making new highs while its 21-day change declines is decelerating — the move is getting tired. A stock still in a downtrend whose 21-day change is turning up is an early-chance setup.
Four flow states. 🟢🟢 Accelerating-Up · 🟢🟡 Decelerating-Up (long warning) · 🟡🟢 Reversing-Up (early chance) · 🔴🔴 Accelerating-Down. The middle two are the valuable ones — they arrive before the price move does.
Universe and cadence. Over 400 instruments — US headline indices, the 11 sector funds, Nasdaq sub-indices, country ETFs, tech thematics, the Closelook indices and all of their constituents. The scan runs on US trading days at 23:05 UTC, after the close. The full ranking is public at closelook.net/stocks/rankings/directional-flow/.
The four stock tables — this letter’s own board. These are the tables the other two letters do not carry, because this is the only one that reads at name altitude. Every row comes from our own Directional Flow scan across 410 stocks, not from a vendor screen.
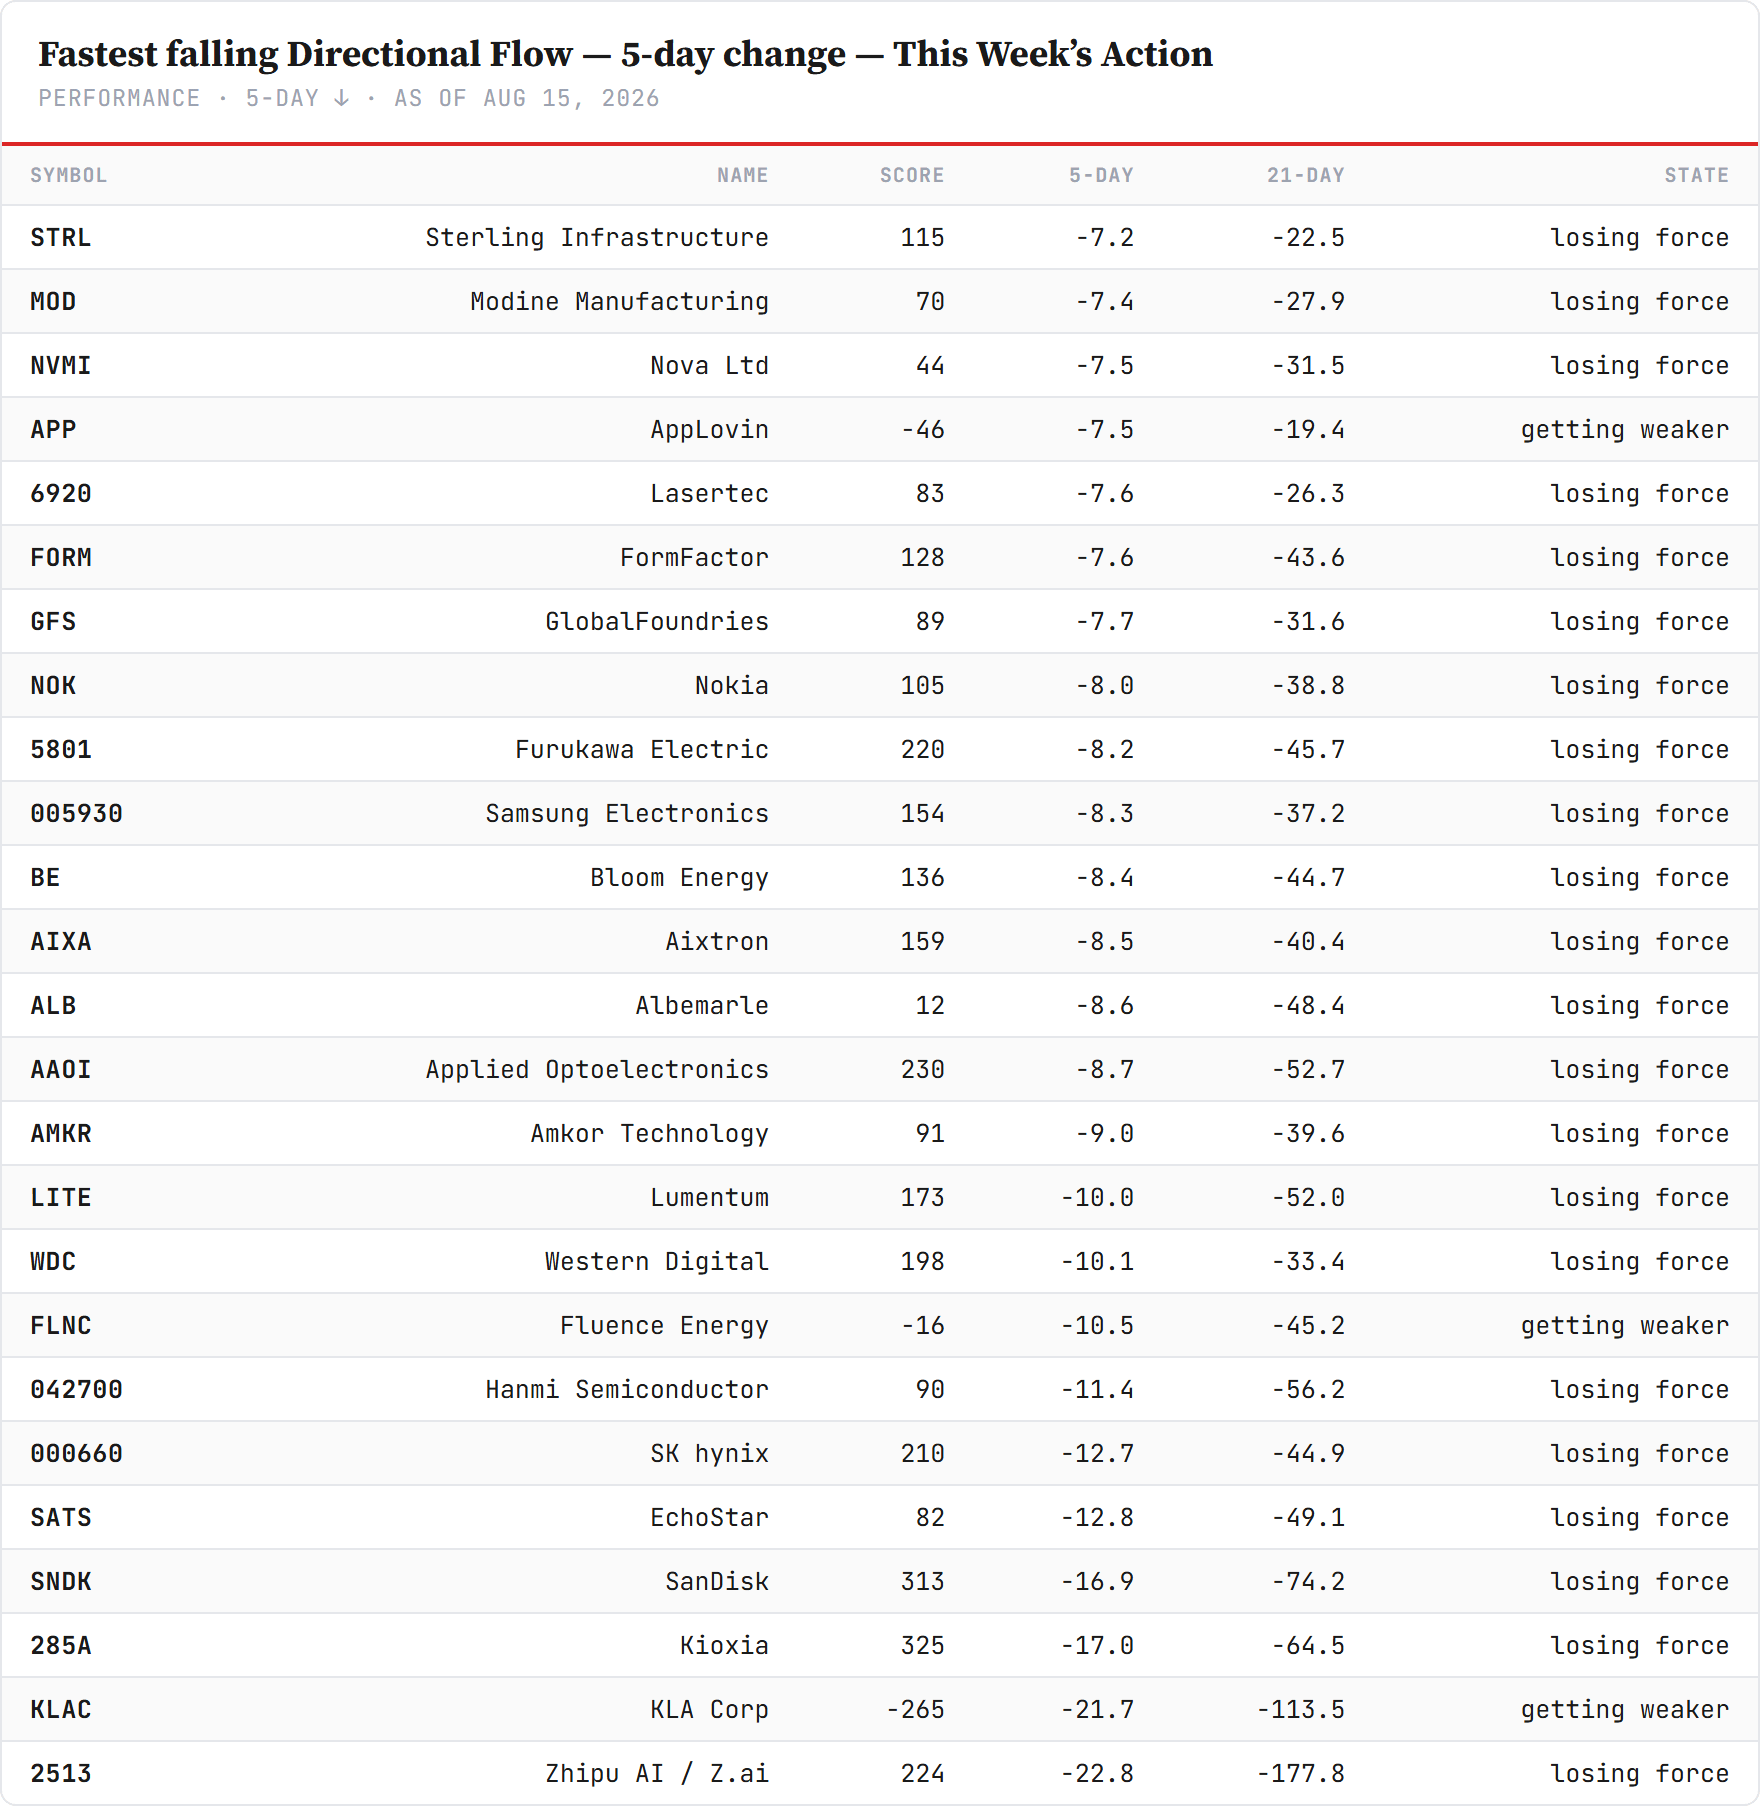
The strongest trends, confirmed on the medium term. Highest absolute score among names whose 21-day change is positive — established trends still improving. DuPont at 237, Dell 197, Sumco 169, Iridium 163, AMD 150. A high score means a steady, persistent trend rather than a fast one; most stocks sit below 100.
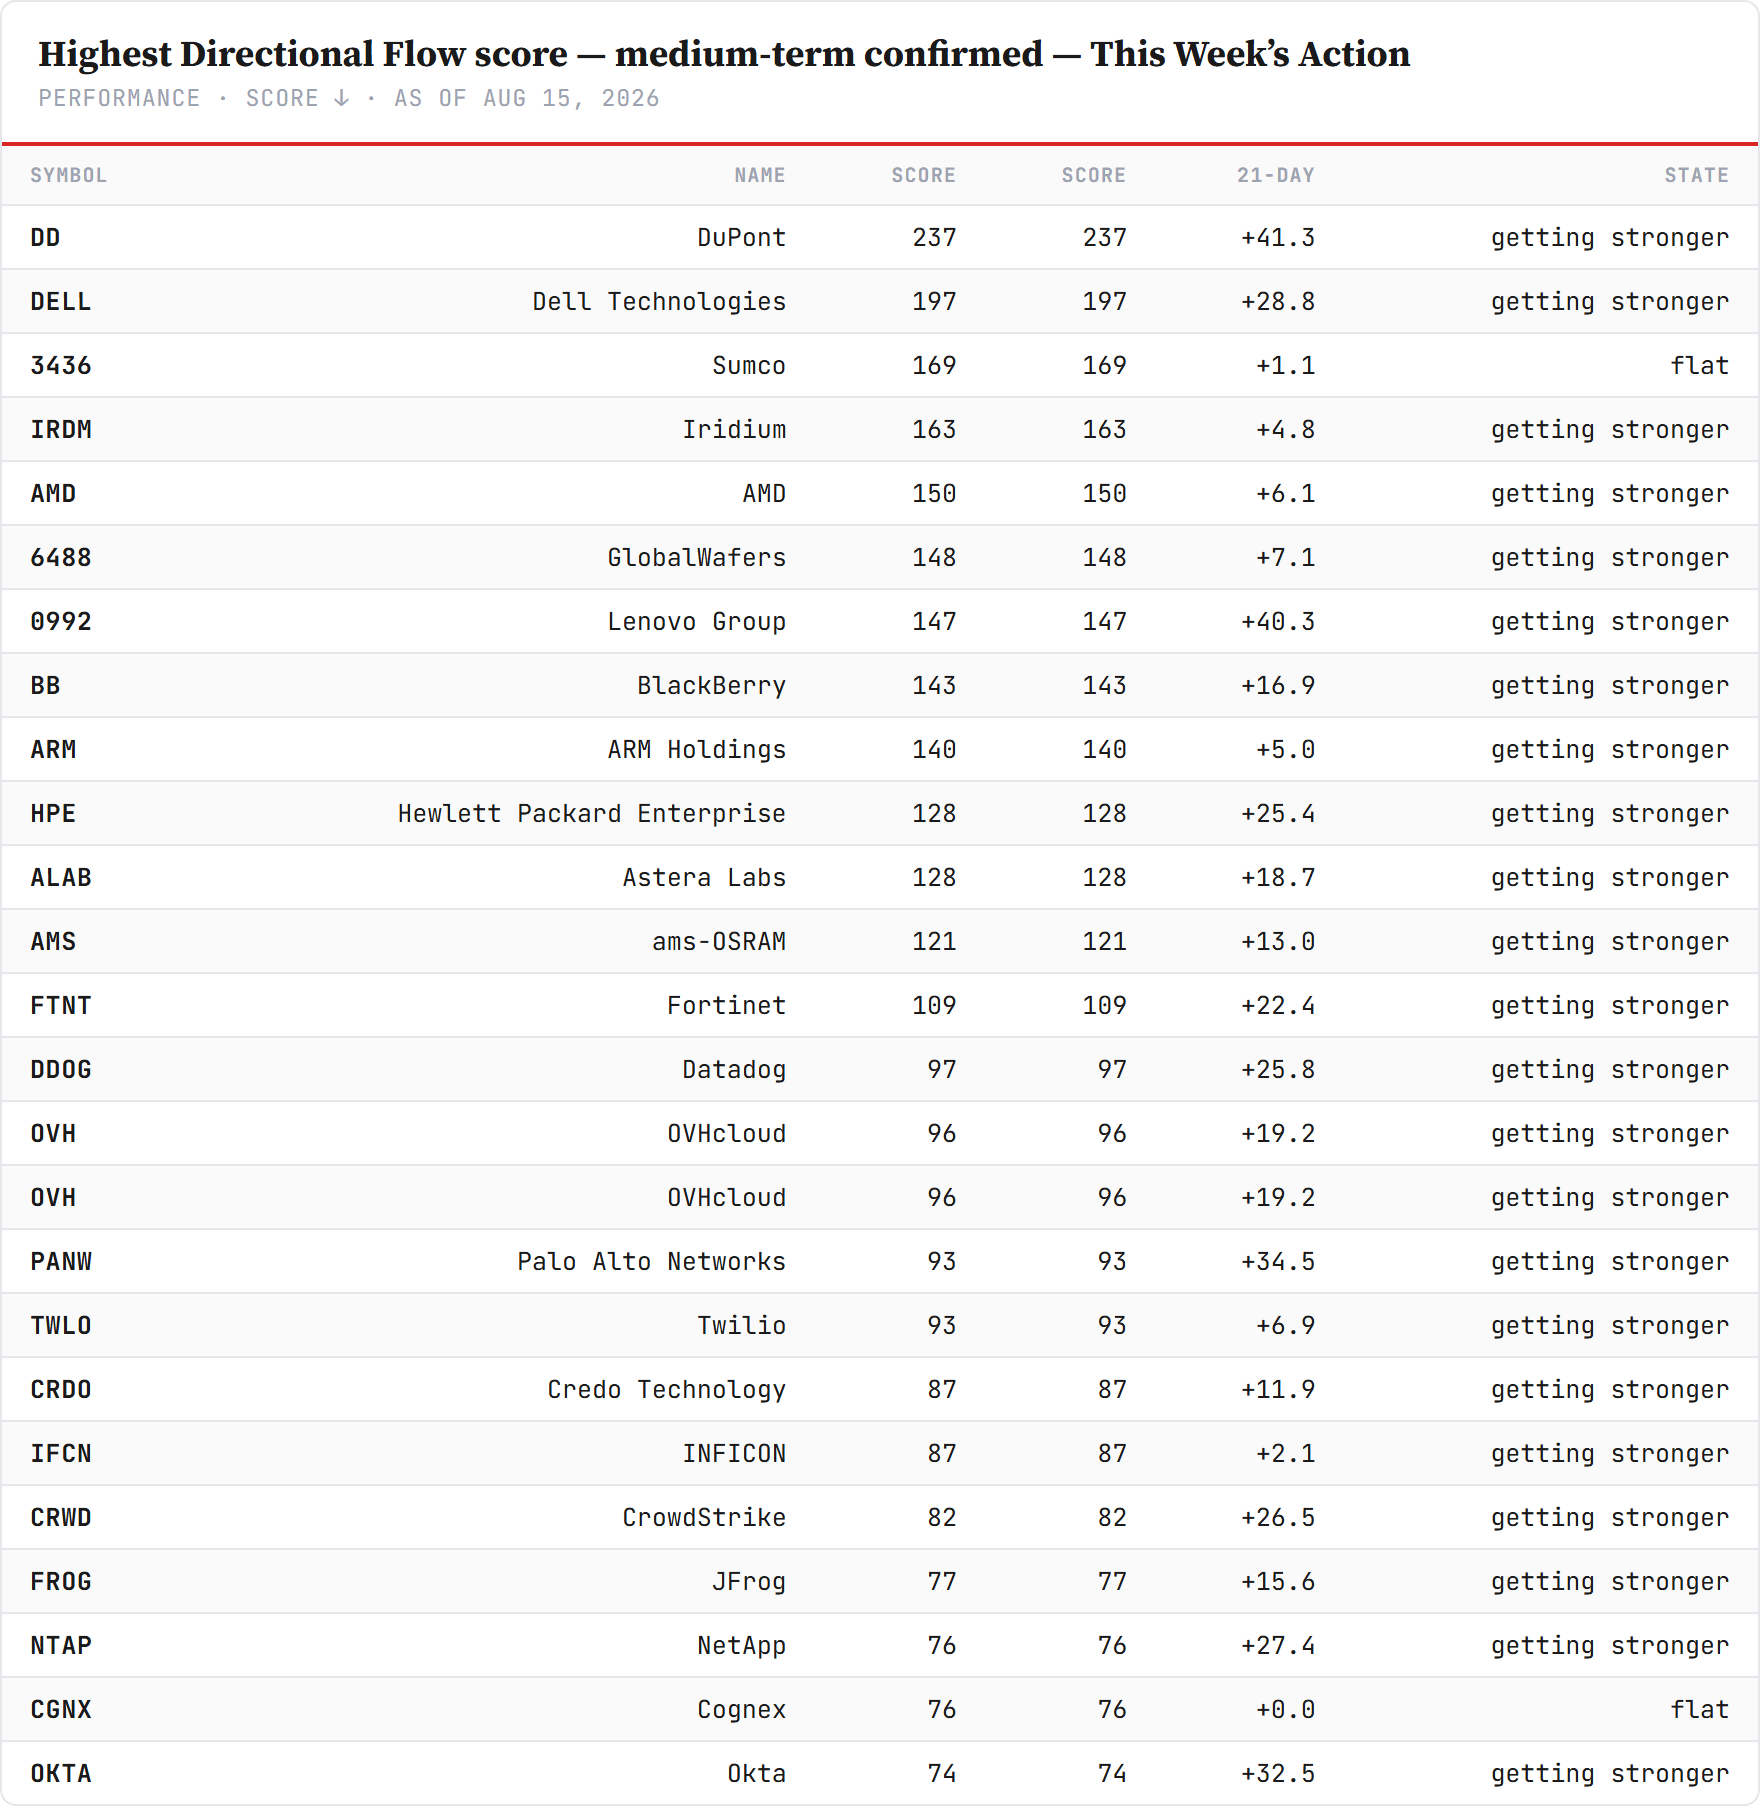
The same list, confirmed on the short term. Highest absolute score among names still rising this week. Where a name appears on this table and not the one above, the strength is fresh rather than established; where it appears on both, the trend is being added to at every horizon we measure.
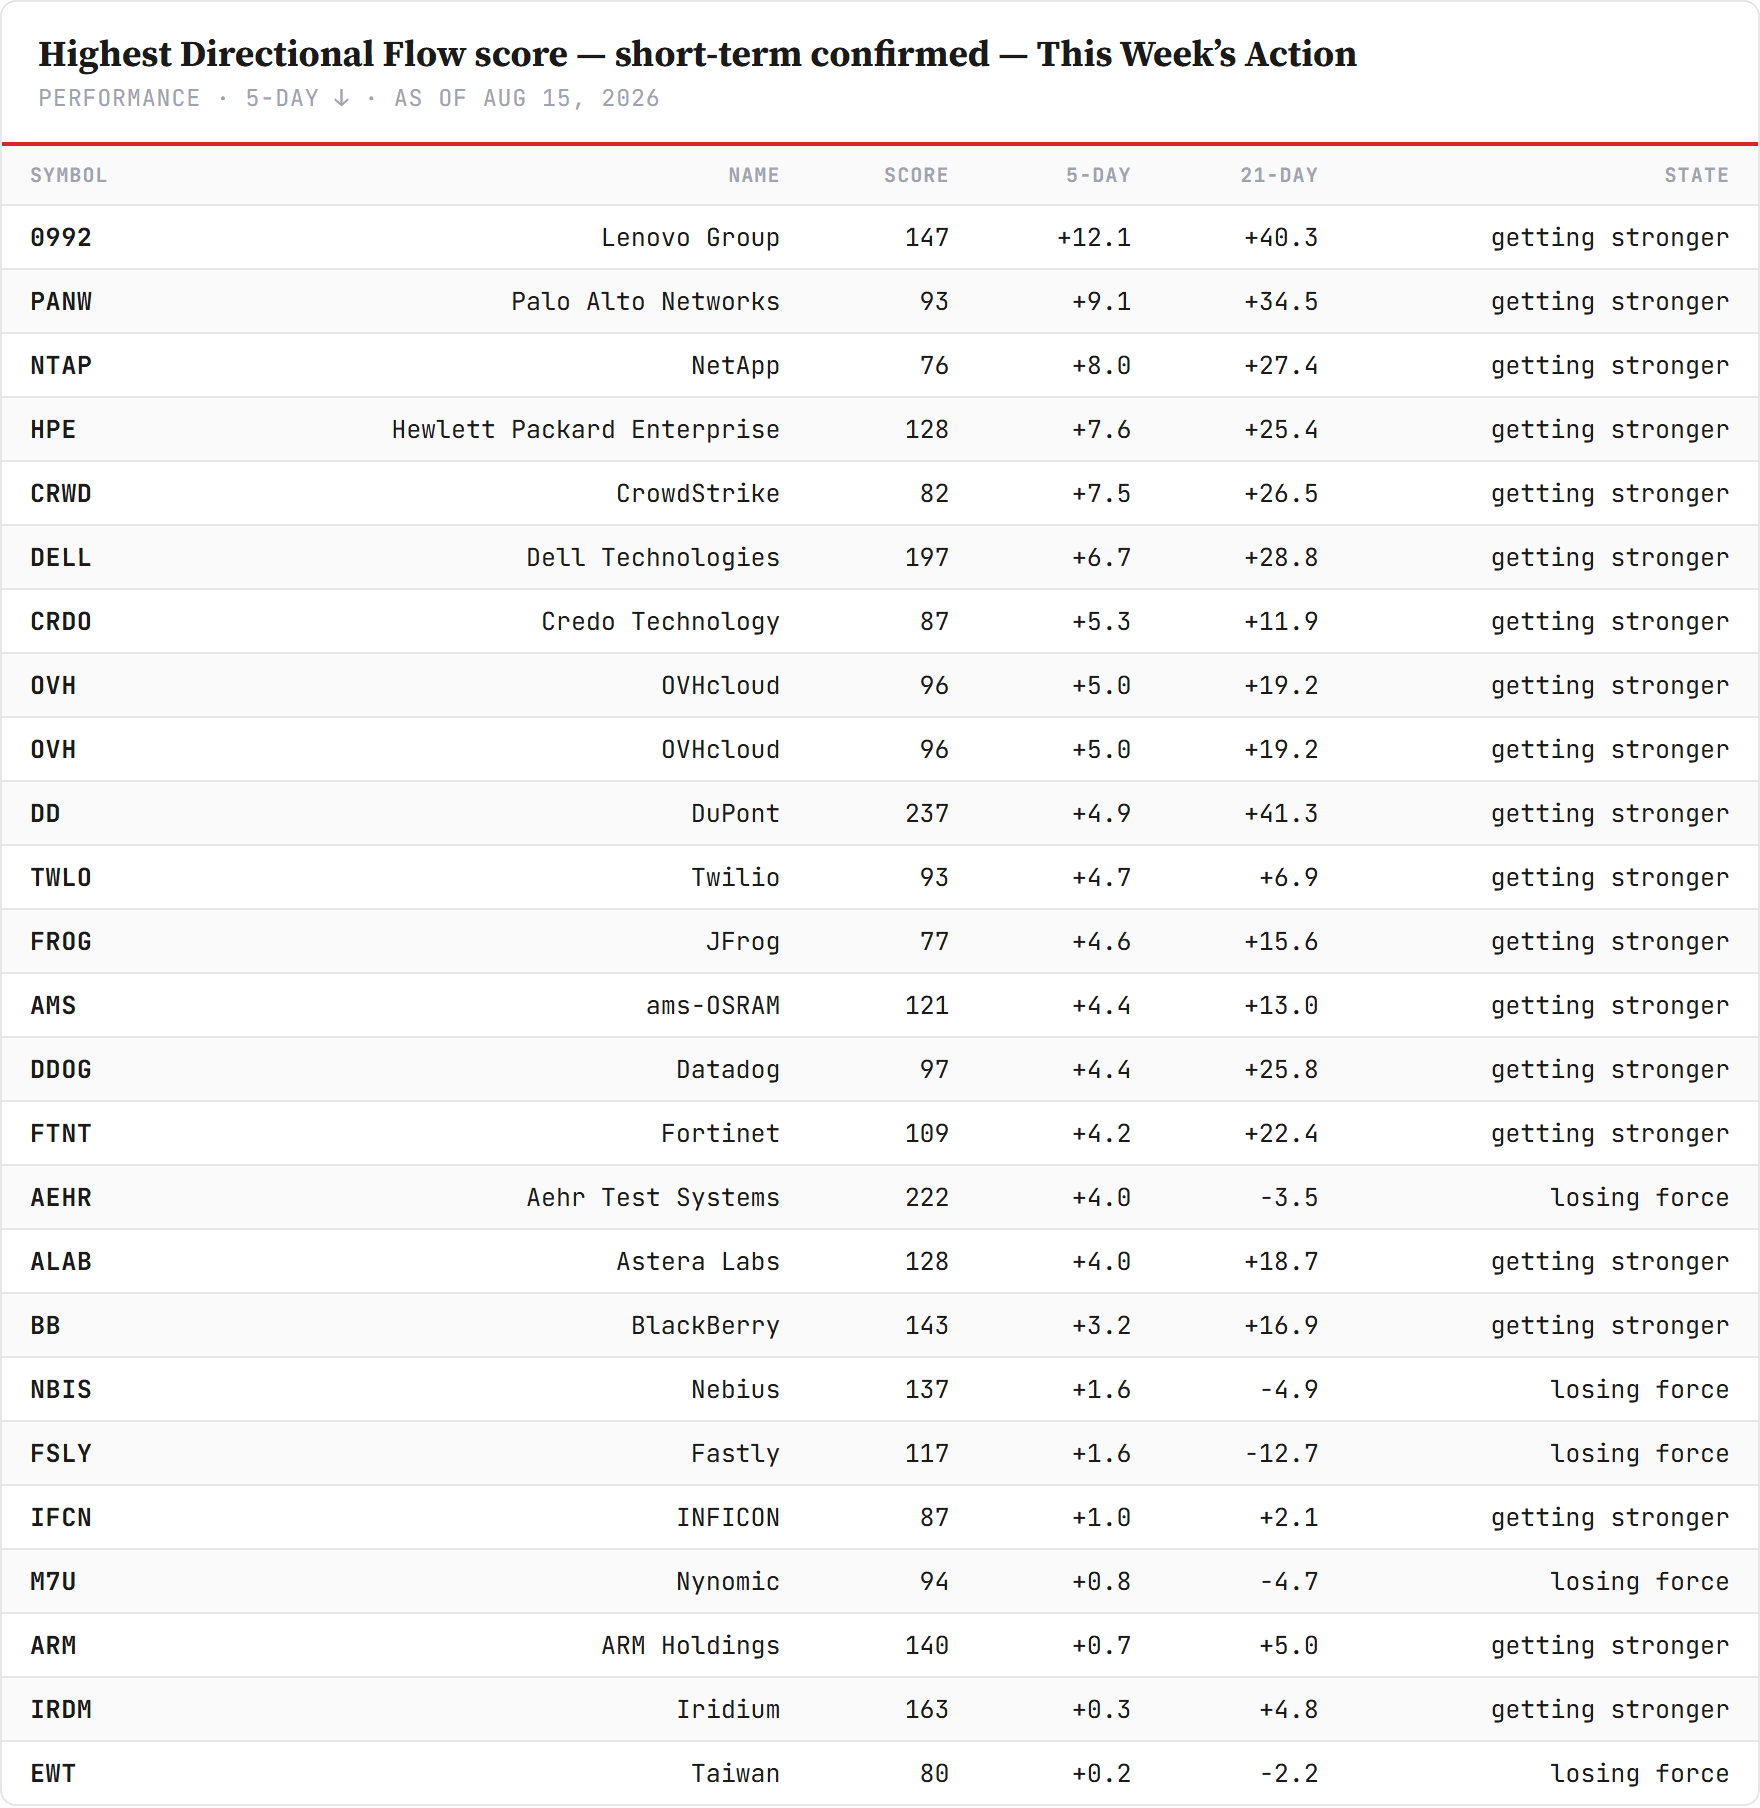
Where new leadership shows up first — the fastest risers. Ranked by five-day change in the score rather than by the score itself, which is the point: Atlassian +18.5, Lenovo +12.1, Snowflake +11.4, e.l.f. +11.3, Rubrik +11.2, Workday +11.1. Note the scores beside them — Atlassian’s is negative at −53 and Snowflake’s only 32. These are not strong trends yet. They are weak trends improving fast, which is where the engine has historically found leadership before the price board shows it.
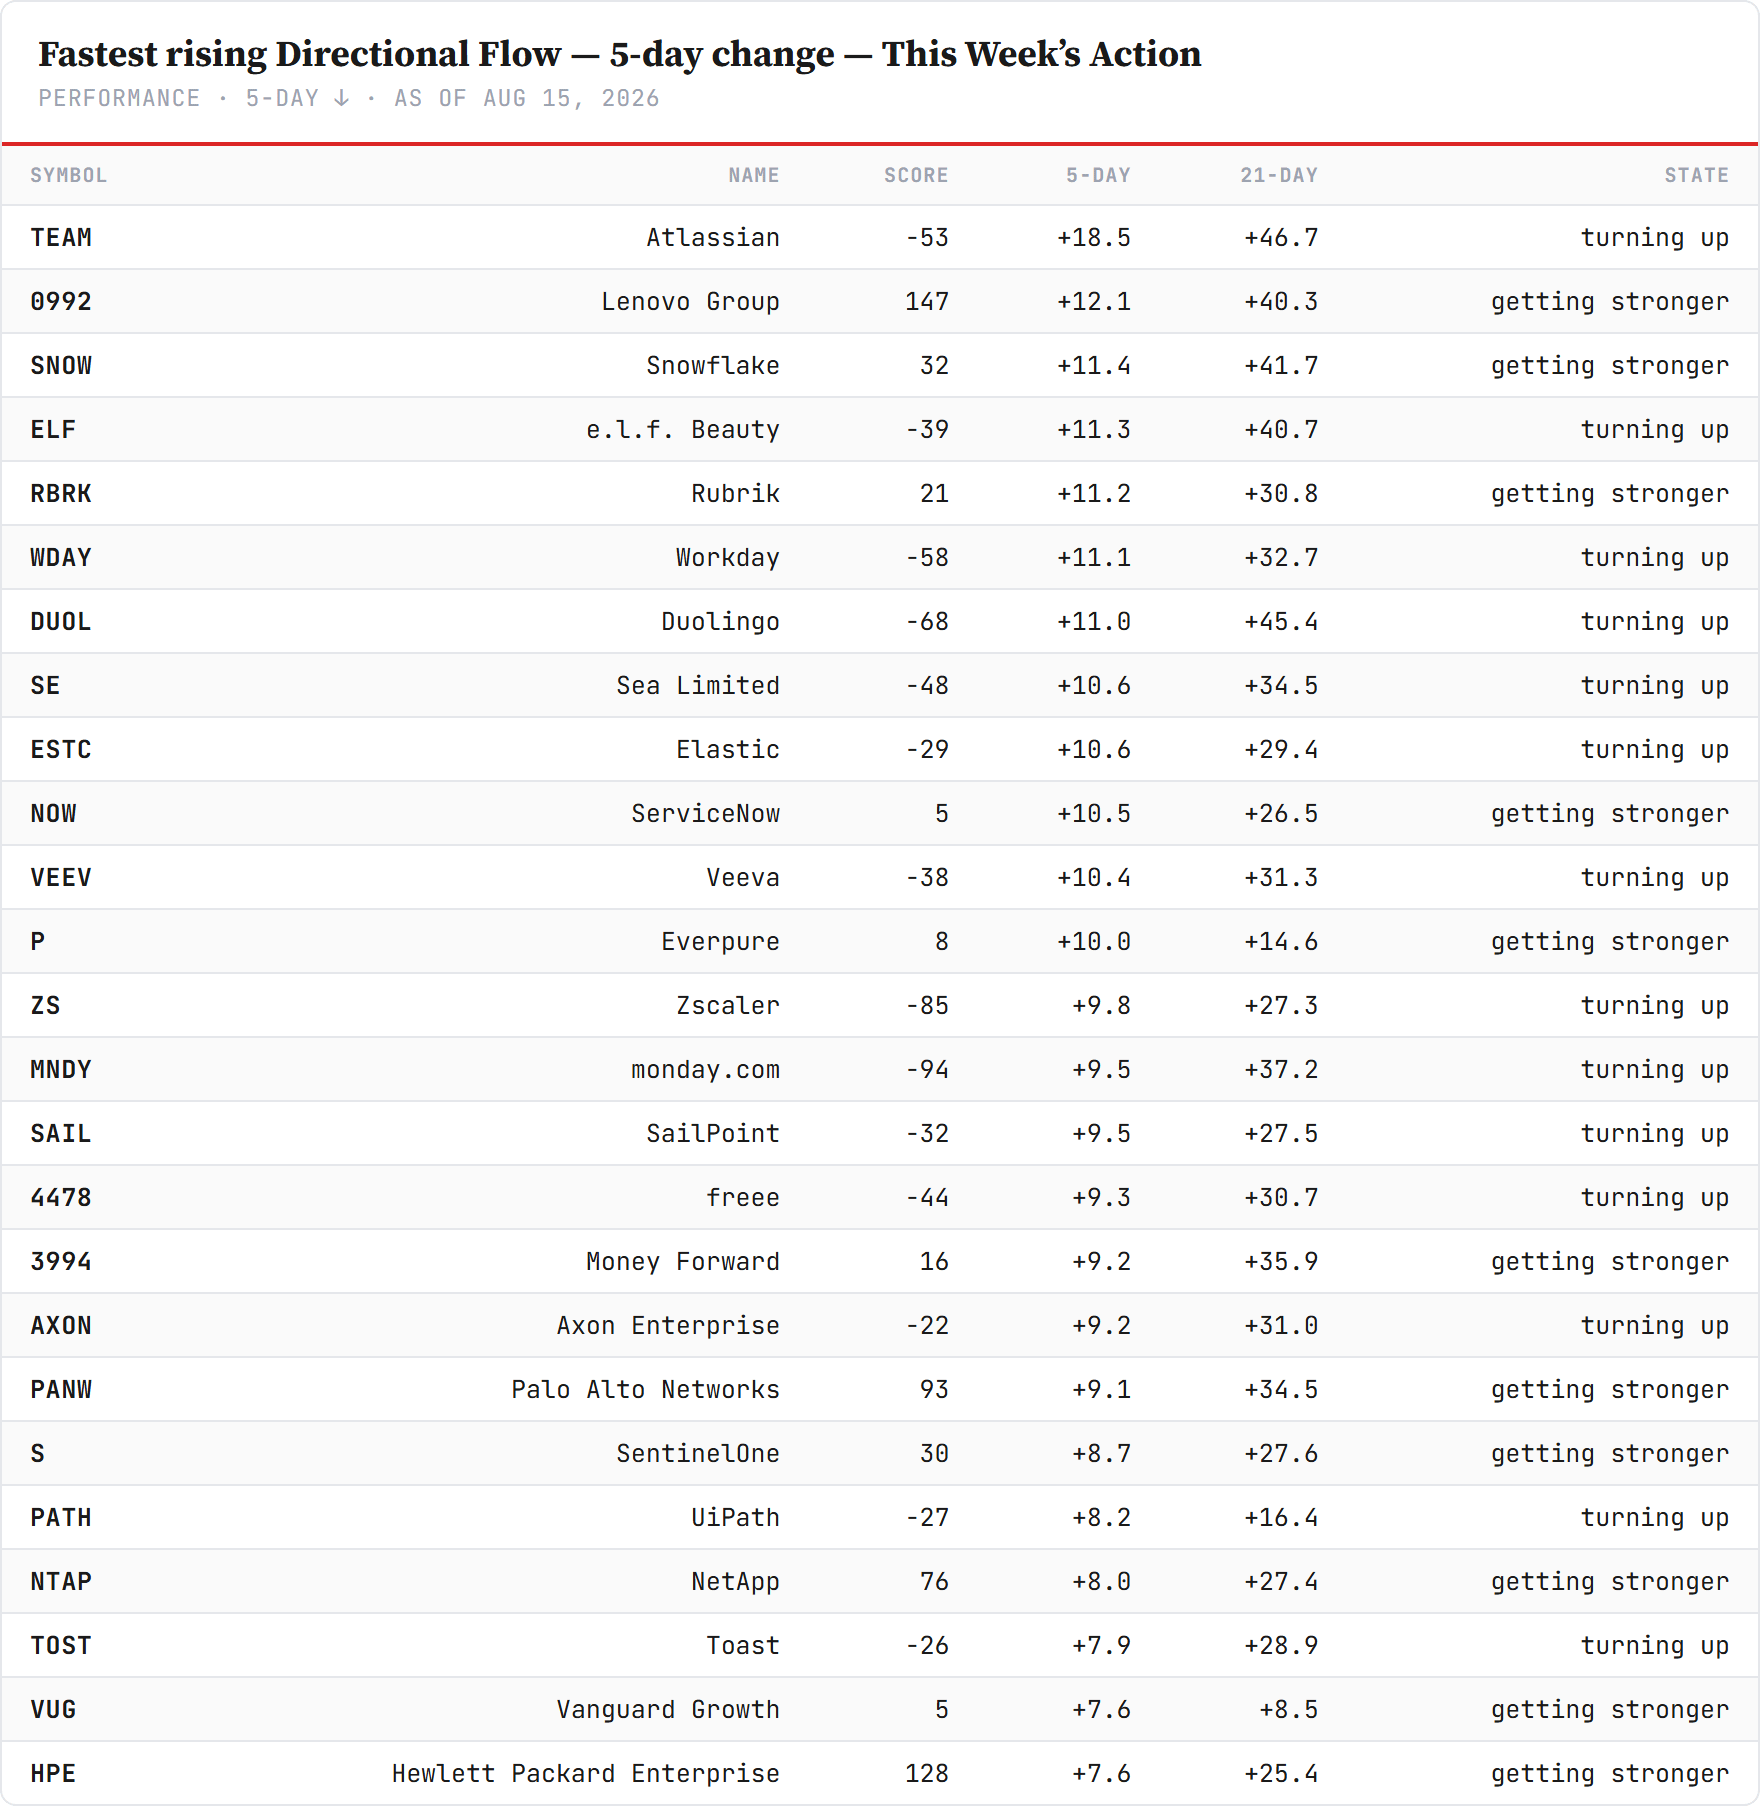
And the draining side. The same measure inverted, and it is the week’s most uncomfortable table: Z.ai −22.8, KLA −21.7, Kioxia −17.0, SanDisk −16.9, EchoStar −12.8. Kioxia and SanDisk carry scores of 325 and 313 — among the highest in the entire universe — while losing force faster than almost anything else. High score, falling fast: a strong trend being drained. That is exactly the price-versus-flow disagreement this letter opened on, now visible name by name rather than as a sector observation.
2 · The State
The four buckets, briefly. New readers: we cut the growth trade into functional indices rather than sectors — capex (Rubin Build-Out, what gets built), opex (Agentic Ecosystem, what it costs to run), applications (Agentic Winners, what gets sold on top), and HALO as the control group carrying no AI thesis at all.
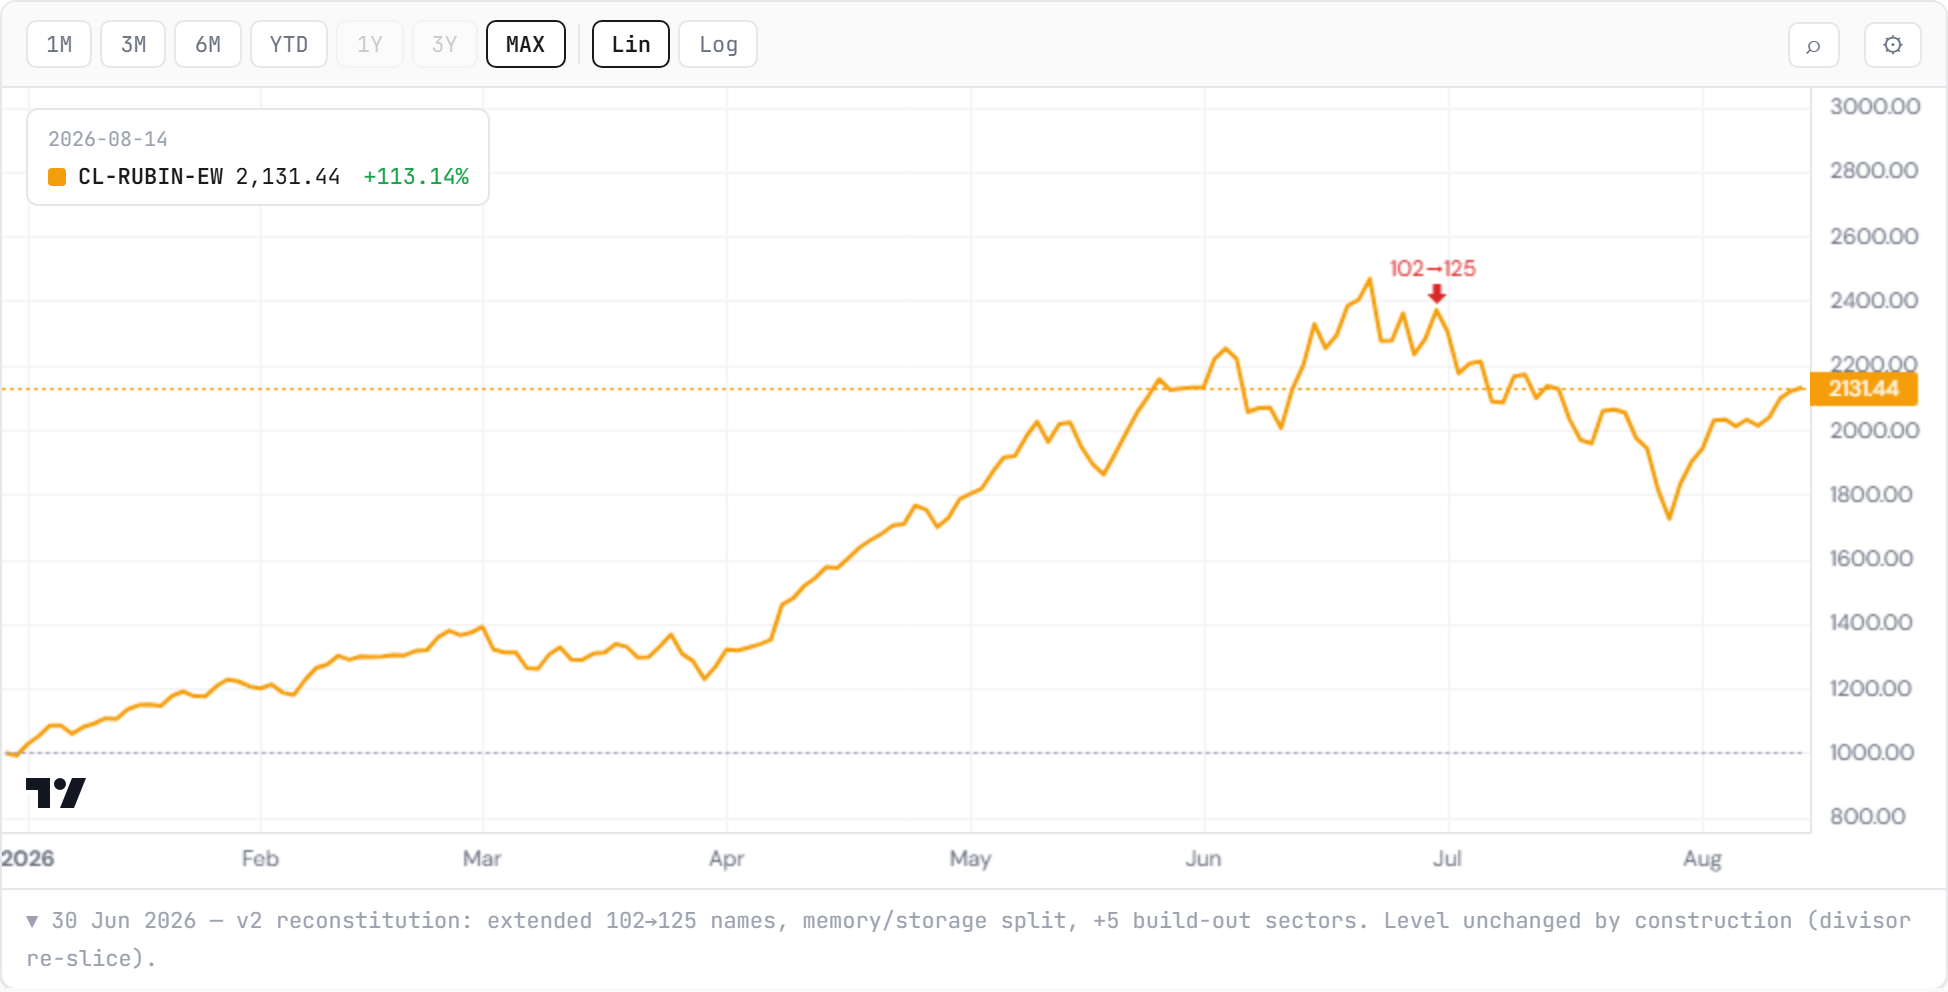
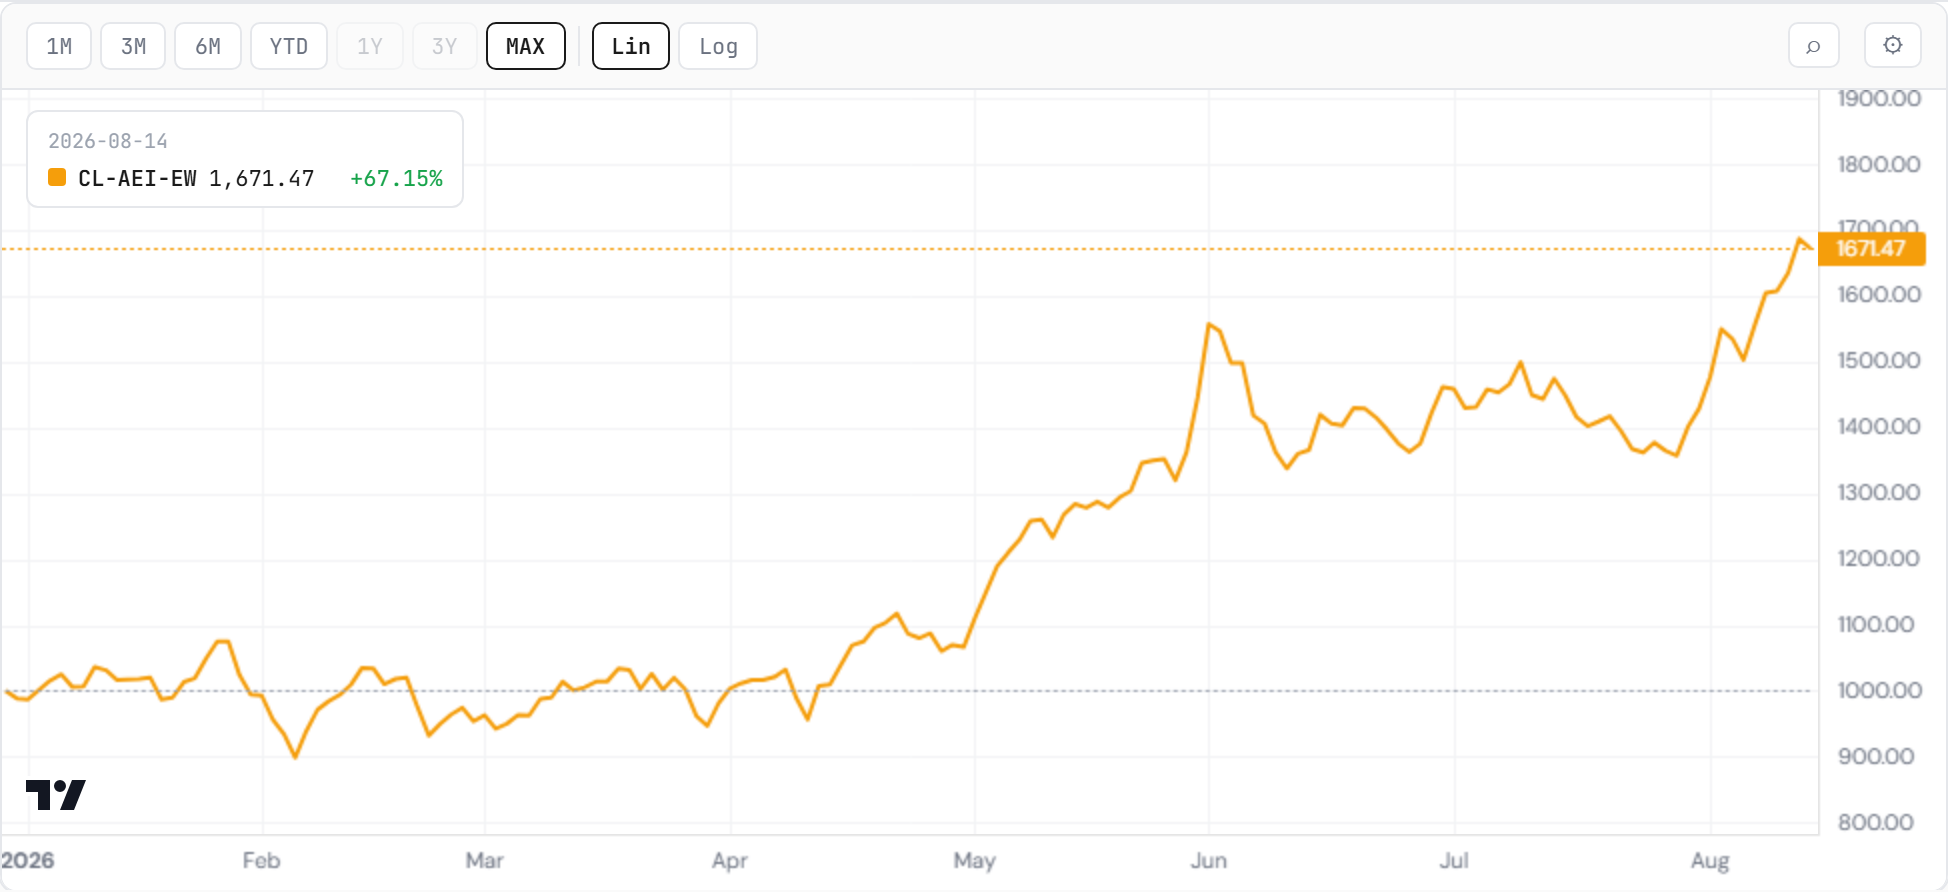
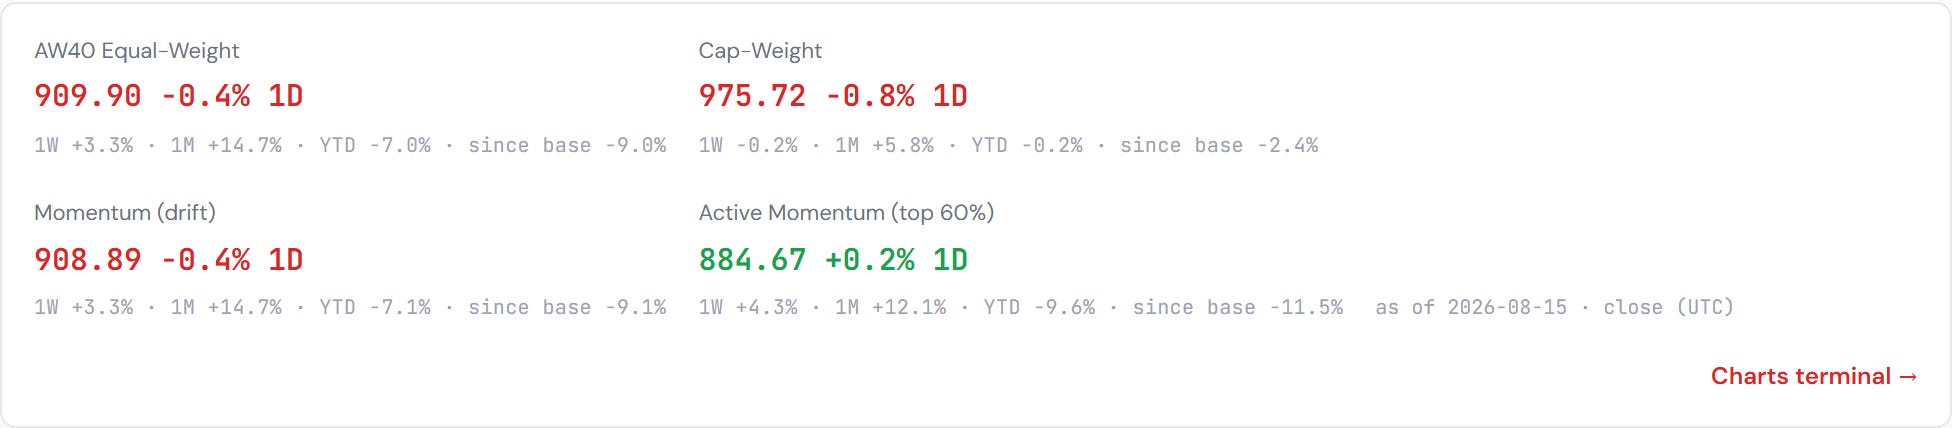
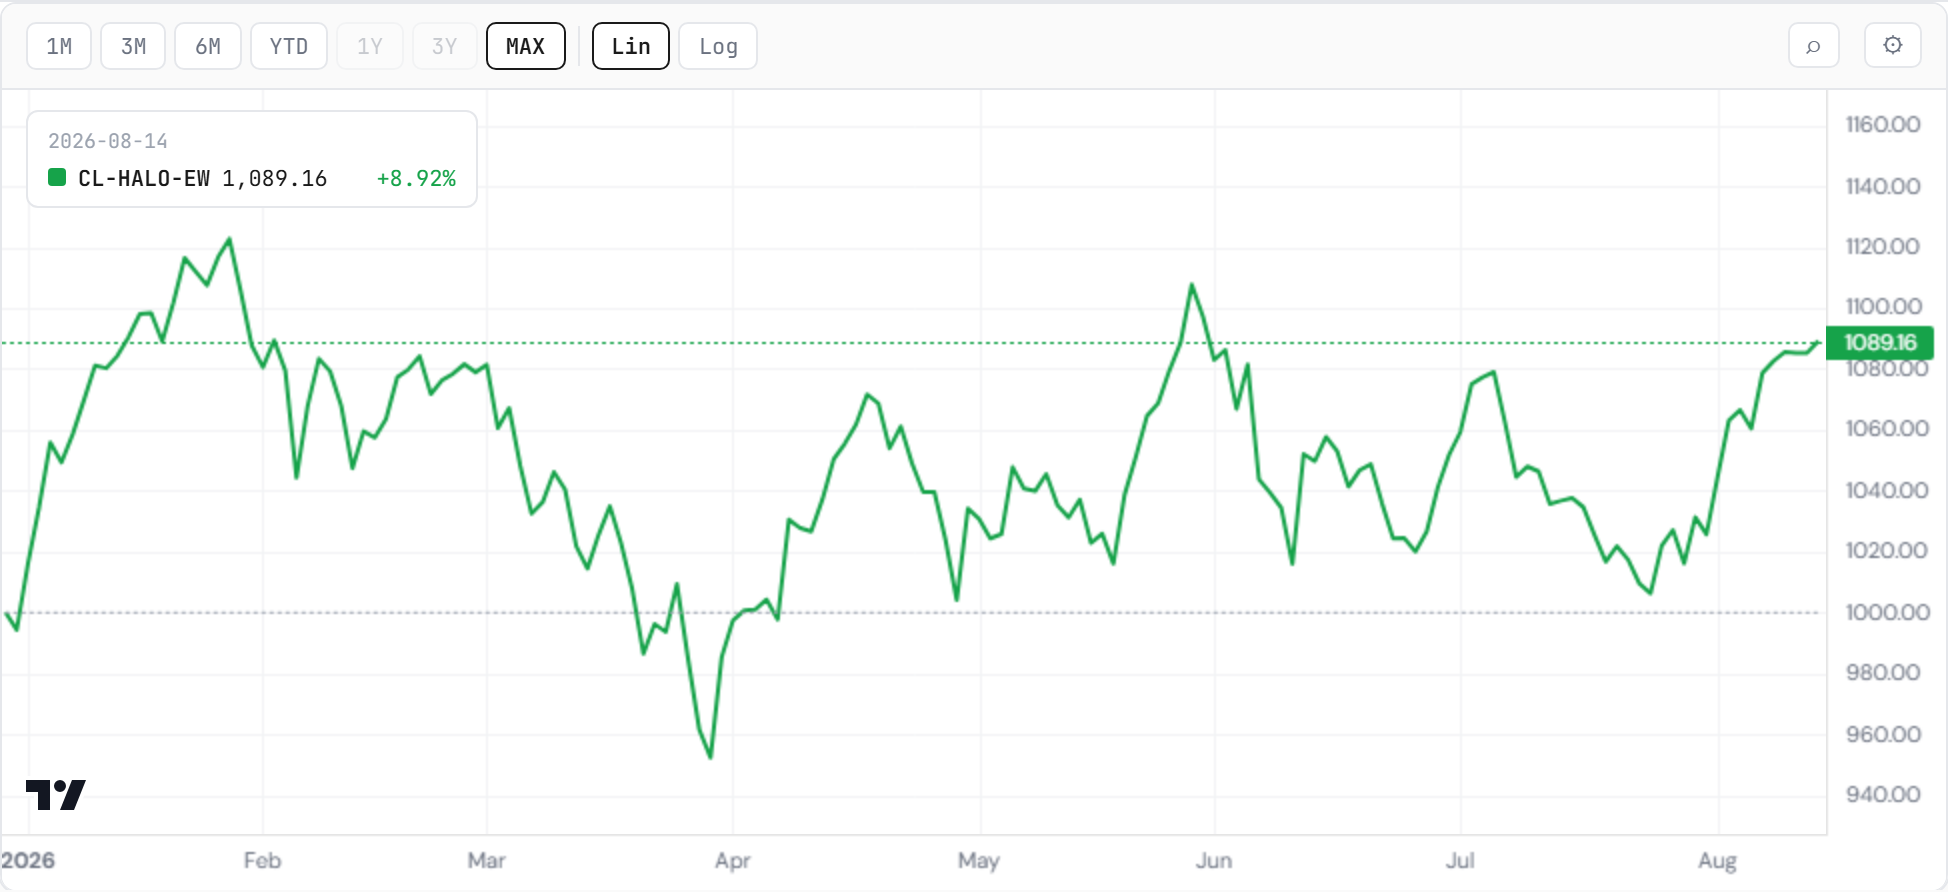
The week’s ladder: opex +7.5%, capex +4.9%, applications +3.3%, HALO +1.0%. On the year: capex +107.4%, opex +69.4%, applications −7.0%, HALO +7.2%. The middle stage led the week; the buildout still owns the year; the applications layer is still negative for 2026 and closing.
The control group settles what kind of week it was. HALO gained 0.97% against opex’s 7.5%. Growth was not bid this week — AI was. That distinction matters more here than in either sister letter, because this is the cohort that gets bought by mistake in broad risk-on weeks, and this was not one.
Two floors were tested, and they did not hold equally.
The challenger floor held, then rose. CoreWeave was paid 19.3% on its print and Nebius 34.1% — the latter straight through a famously disclosed short near 212. Payment retention is exactly where paid prints have died all season: the verdict lands, the market takes it back inside two sessions. Not this time. Both retained through day two at −1.3% and −1.6%, and by Friday Nebius had added another 8.8% to 277.58. Three days on, the payment is larger than the verdict was.
The incumbent floor was tested and wobbled. Silver Lake is reported in talks to take Workday private: +17.8% Thursday, halted intraday on 3.6× normal volume, a name that traded near 250 last September and bottomed at 110 in April — then giving back a third of the spike on Friday to 198.68.
The asymmetry is the story. The floor built on reported results extended itself; the floor built on a reported conversation began deflating within twenty-four hours. Both are evidence the disruption discount overshot. Only one of them is evidence you can score.
Inside the buckets — the sub-sleeves put names on the week. Inside applications: Application Leaders +4.9%, Enterprise (B2B) +3.6%, Control Plane +3.5%, Endpoints +3.4%, Consumer +2.7% — every one still negative on the year, and the only sector up in 2026 is Megacap Gateway at +9.7%, which was the only one red this week at −1.6%. The layer spent the week buying what it spent the year selling.
Inside opex every sector was green — Edge & Distribution +12.8%, Data & Memory +12.3%, Substrate +11.4%, Compute Operators +11.1% — while Foundation Models managed +1.9% against +858% on the year. The sleeve that made 2026 stood still in the week its own infrastructure was bought.
And read the buckets against their June highs — the focus change in three numbers. The Agentic Ecosystem is 7.3% above its 1 June record, the Agentic Winners 5.6% through theirs — and the Rubin Build-Out is still 13.7% below its 22 June high. Last edition the operating layer sat a tenth of a percent from its record and the applications had just cleared theirs; both have since put distance between themselves and those marks while the build layer has closed its gap without clearing it.
Three numbers, one sentence: the two lighter layers are making new highs and the heaviest is not. That is the focus change this letter has been describing since July, now visible on the geometry rather than in the argument.
The opex verdict at name altitude — paid, except where the threat has a name. The flow ledger puts the operating layer’s names at the top of the whole board: Snowflake +40.9 on 21-day flow, Palo Alto +35.1, both accelerating-up, with Atlassian +44.0 and Duolingo +45.3 reversing up from the July lows. Cybersecurity rose 1.79% in a week software managed 1.35%.
The exception remains where the threat has a name. The sleeves exposed to the biggest-customer-becomes-competitor problem still trade at a discount the rest of the layer has escaped — which is precisely why this letter keeps flagging security as the opex bucket where that threat structurally does not apply: the frontier labs are security’s demand, not its rival.
The referee this week was the retention window, and it paid. Last edition named the neocloud prints the referee for the cohort. The verdict held and then extended: CoreWeave and Nebius kept their payments through day two, and Nebius added 8.8% on day three to 277.58. A cluster that had been sold on every paid print since spring was, this time, left alone.
The structural read — the count advanced. The US letter carries the contract; here it matters as the gate on everything above. QQQ closed 731.07, through the 723.85 high-water mark, with 746 still the line that turns the filed count from live to confirmed — 2.0% above Friday. The count did not resolve this week. It moved one notch, on internals rather than on price.
The structural read — applications cleared their June high, the buildout has not. The correction lows say it earlier still: capex and opex both bottomed 29 July, while applications never made that low — it bottomed 25 June, five weeks earlier, and is +31.2% off it against +23.6% and +23.1%.
In the spring downturn the roles were reversed: capex and opex bottomed together on 5 February while applications kept falling to 10 April, nine weeks behind — and the index that bottomed first went on to own the year. This time it is the applications layer that refused the later low. Probability, not prophecy — but the last index to do this led everything that followed.
3 · The Outlook
The tells from last edition — scored.
Challenger retention — whether paid prints would hold past two sessions. Held, and extended: Nebius +8.8% on day three. Scored yes.
The software floor — who buys the survivors at the bottom. A financial buyer appeared, and the price gave a third of it back by Friday. Scored partially, and provisionally.
MAGS at the shelf, attempt three — failed, and by more than last week. Detail in §4.
The new watch-class — prices the flows won’t countersign. This is the reading of the week, and it points the opposite way to the price board.
Storage was the best sector in the entire capex table at +21.1%, with HBM Memory second at +15.3%. Yet the flow ledger puts the same complex at the bottom of 426 instruments on both windows — SanDisk −16.9 over five days and −74.2 over twenty-one, Kioxia −17.0 and −64.5, KLA −21.7 and −113.5 — all in a decelerating-up state — price still rising, the force behind it draining. KLA sits at −117.9 in outright acceleration-down.
A sector cannot lead the price board and trail the flow board indefinitely. One of the two is early. Our instrument was built for exactly this disagreement, and its record says flow turns before price more often than the reverse — which files this week’s memory strength as a move to be respected rather than chased, and puts a specific, dated question on next week’s board.
The regime gauges, one paragraph. The Handoff Board rotated one layer up: operate-against-build +2.5% to 1.2723, operators-against-suppliers +5.9%, and beyond-gateways +5.9% to 1.2158 — the applications pulling away from their distribution chokepoints, which is the Megacap-Gateway-only-red week expressed as a ratio. Against that, use-against-operate fell 3.8% and trust-against-execution 5.4%. The stack is not rising as one; it is rotating upward, and the layer being left behind is the one that sells the picks. The Money Temperature composite sits at 51 — the middle of its range, where rotations get funded and first mistakes do too.

The week ahead — three prints, one referee. Cisco and Coherent complete their three-session scoring windows on Monday, Applied Materials on Tuesday — three champions, three clean beats, three punishments being graded. Then the docket runs to Nvidia on the 26th, the referee for the count, the tilt and the sorting rule at once.
4 · What May Lie Ahead
Three questions, carried and renewed.
