


The Fed raised rates for the first time since 2023, the ten-year closed above five percent, the Bank of Japan hiked two days later — and the S&P finished the week a third of a percent lower with every line this letter carries retaken. That is the constructive reading, and it is the house’s: a market that sells the physical layer on a letter on Monday, makes its low on the decision on Wednesday and buys the decision on Thursday and Friday is a market that has paid for its catalyst. The yen did not surge on Tokyo’s hike, so the carry trade that has ended two bull markets from the side stayed in place — the mechanism Thursday’s Pulse called the bull’s insurance. Bitcoin rose through 80,000 on the second hike; gold did nothing. Monday’s close says whether Friday’s chip reclaim was a close or an expiry; the week’s tape says the bull held.

1 · This Week’s Action
The tape, day by day. Five sessions, and the index sold on three of them, bought the fourth, and finished flat on the fifth. Monday −0.45% to 760.88: the sort. Over the weekend the head of Anthropic published a letter arguing the frontier labs should pace their own capability growth; OpenAI’s chief agreed within hours and ruled out a listing this year; xAI’s owner endorsed it. Seoul read it first as a demand story for the physical layer — the Kospi −3.3%, SK hynix −6.7%, Samsung −4.0%, SoftBank −11.3% in Tokyo — and New York did not sell the AI trade so much as sort it: the chip index −5.6% to 497.40, through the 505 floor this letter carries and Thursday’s 517.43 in one session, with Astera −9.9%, Arm −8.9%, Lam −7.2%, Marvell −6.3%, SanDisk −6.3%, Micron −5.3%, AMD −4.4%, Nvidia −3.4%; the memory vehicle 54.80, under 58 for the first time since July — and on the other side software +5.0% to 106.64, its best day of the year, the security names +13% to +17% (Zscaler, SentinelOne, CrowdStrike, Palo Alto), Microsoft, Alphabet and Meta +2% to +3%. The buildout index −5.3% with every layer red. Tuesday −0.46% to 757.39: the rates day. The ten-year printed 5.008% in the morning, its highest since October 2023, and closed 4.996%; the Dow −0.9%, the Russell −1.2%; the S&P closed under the 757.83 this letter carries; Yardeni cut his year-end target to 7,900 from 8,400 on the yield alone; and at the bell Oracle and Adobe scored — one sold, one paid, section 2 has the grades. Wednesday −0.44% to 754.05: the hike. Midday relief — the ten-year 4.959%, the S&P back above 757.83, the chips above 505 — then 14:00 in Washington: the Fed raised rates, its first hike since 2023, “in search of a timelier drop in inflation,” with one more signalled before year-end. The belly sold, the ten-year closed 5.006% — the first close above five percent of this cycle — the thirty-year was bought to 5.35%, and the relief unwound: a second close under the line, the Nasdaq 100 flat on the 704 shelf, the chips back under 505, the equal-weight −0.8%. Thursday +1.13% to 762.60: the reclaim. Yields fell six basis points in parallel, the Journal wrote that the Fed had regained the market’s trust, and every line was retaken and held at the bell — the S&P above 757.83, the Nasdaq 100 +1.7% to 716.92 above its average, the chip index +3.4% to 519.10 above 505 and 517.43, the megacap basket 70.78 above 69.5. The design side led wide — AMD +6.4%, Micron +5.5%, TSMC +3.0%, Nvidia +2.5%, Broadcom +2.3% — and the equipment three only stopped falling. Friday −0.12% to 761.69: the Bank of Japan and the expiry. Tokyo raised to 1.25% and the yen fell through 157; New York opened its quadruple witching with the memory vehicle 59.61, back through 58 with a 3.2% session; the chip index 533.07, +2.7%, through its fifty-day average for the first time since June; Applied Materials +6.6%, Lam +7.0%, KLA +4.6% — the equipment three joining a day late; SanDisk +11.0%, Micron +3.9% to its first close above 1,000, Western Digital +4.1%; Coherent +7.2%, Lumentum +4.2%. And under a flat index, breadth negative: the equal-weight −0.5%, the Russell −0.5%, software −1.35%, the ex-tech Nasdaq −0.7%, Microsoft −0.7%, Oracle −2.0%, Adobe −1.2%. The ten-year closed 4.998%, Thursday’s rally given back to a fifth of a basis point under five. The VIX 15.33. Brent under 100.
Five sessions, and the S&P finished −0.34% at 761.69, the Nasdaq 100 +0.92% at 721.45 — 1.6% above its 50-day (709.95), after two closes on the 704 shelf — and the equal-weight S&P −1.20%, the fourth consecutive week cap-weight beat equal-weight. The Russell 2000 −1.66%; the equal-weight Nasdaq 100 −0.36%. The index sits 2.1% under its August 13 record close of 777.88; the Nasdaq 100 3.3% under its June range high. Two central banks raised rates inside the week and the American index moved a third of a percent, made its low on the decision and closed the week above every line this letter carries. Everything that happened this week happened underneath it, again — and this time the thing underneath it was a five-percent round trip in the chips that ended on the right side. That is the week’s constructive fact, and it goes first: a market that sells into its catalyst, makes its low on it and buys it for two sessions has paid for the catalyst. The rest of this letter is about what it paid with.
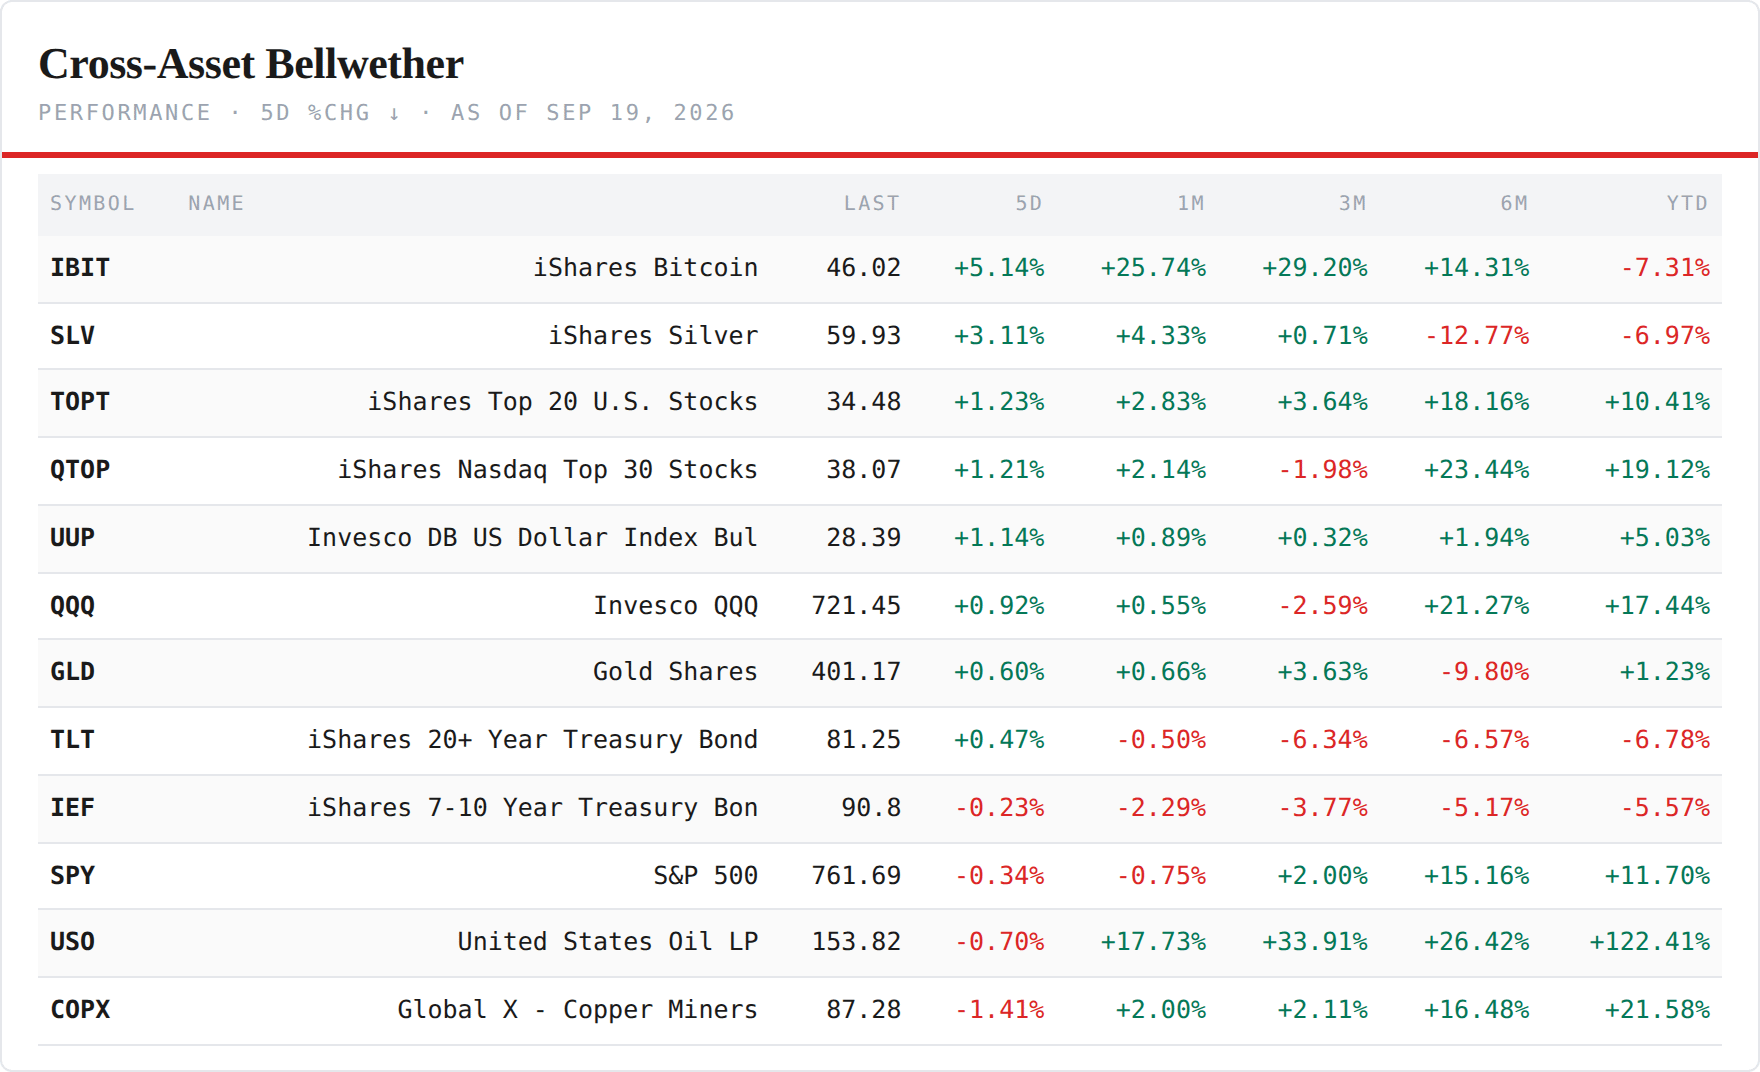
The cross-asset board — the inverse of last week, and bitcoin owns it. Three green and nine red became eight green and four red: the bitcoin fund +5.14% led — a 6.3% Friday — silver +3.11%, the two top-heavy US cuts +1.23% and +1.21%, the dollar +1.14%, the Nasdaq 100 +0.92%, gold +0.60%, the long bond +0.47%. The red four: the belly −0.23%, the S&P −0.34%, oil −0.70%, copper miners −1.41%. After two nine-percent oil weeks the barrel’s week was a round trip with the wrong end first — the oil fund closed Tuesday at 161.86, a fifty-two-week-high close, and fell 5.0% from there; Brent went from $104.61 to $98.76, −5.6%, its first close under $100 since it went through it on September 9. Both hedges were bought on a week the dollar rose 1.1% and two central banks hiked, which is a sentence last week’s edition could not write. Saturday’s letter owns the hard assets as a board; the tape’s version is one line: sold into the hikes, bought on the delivery.
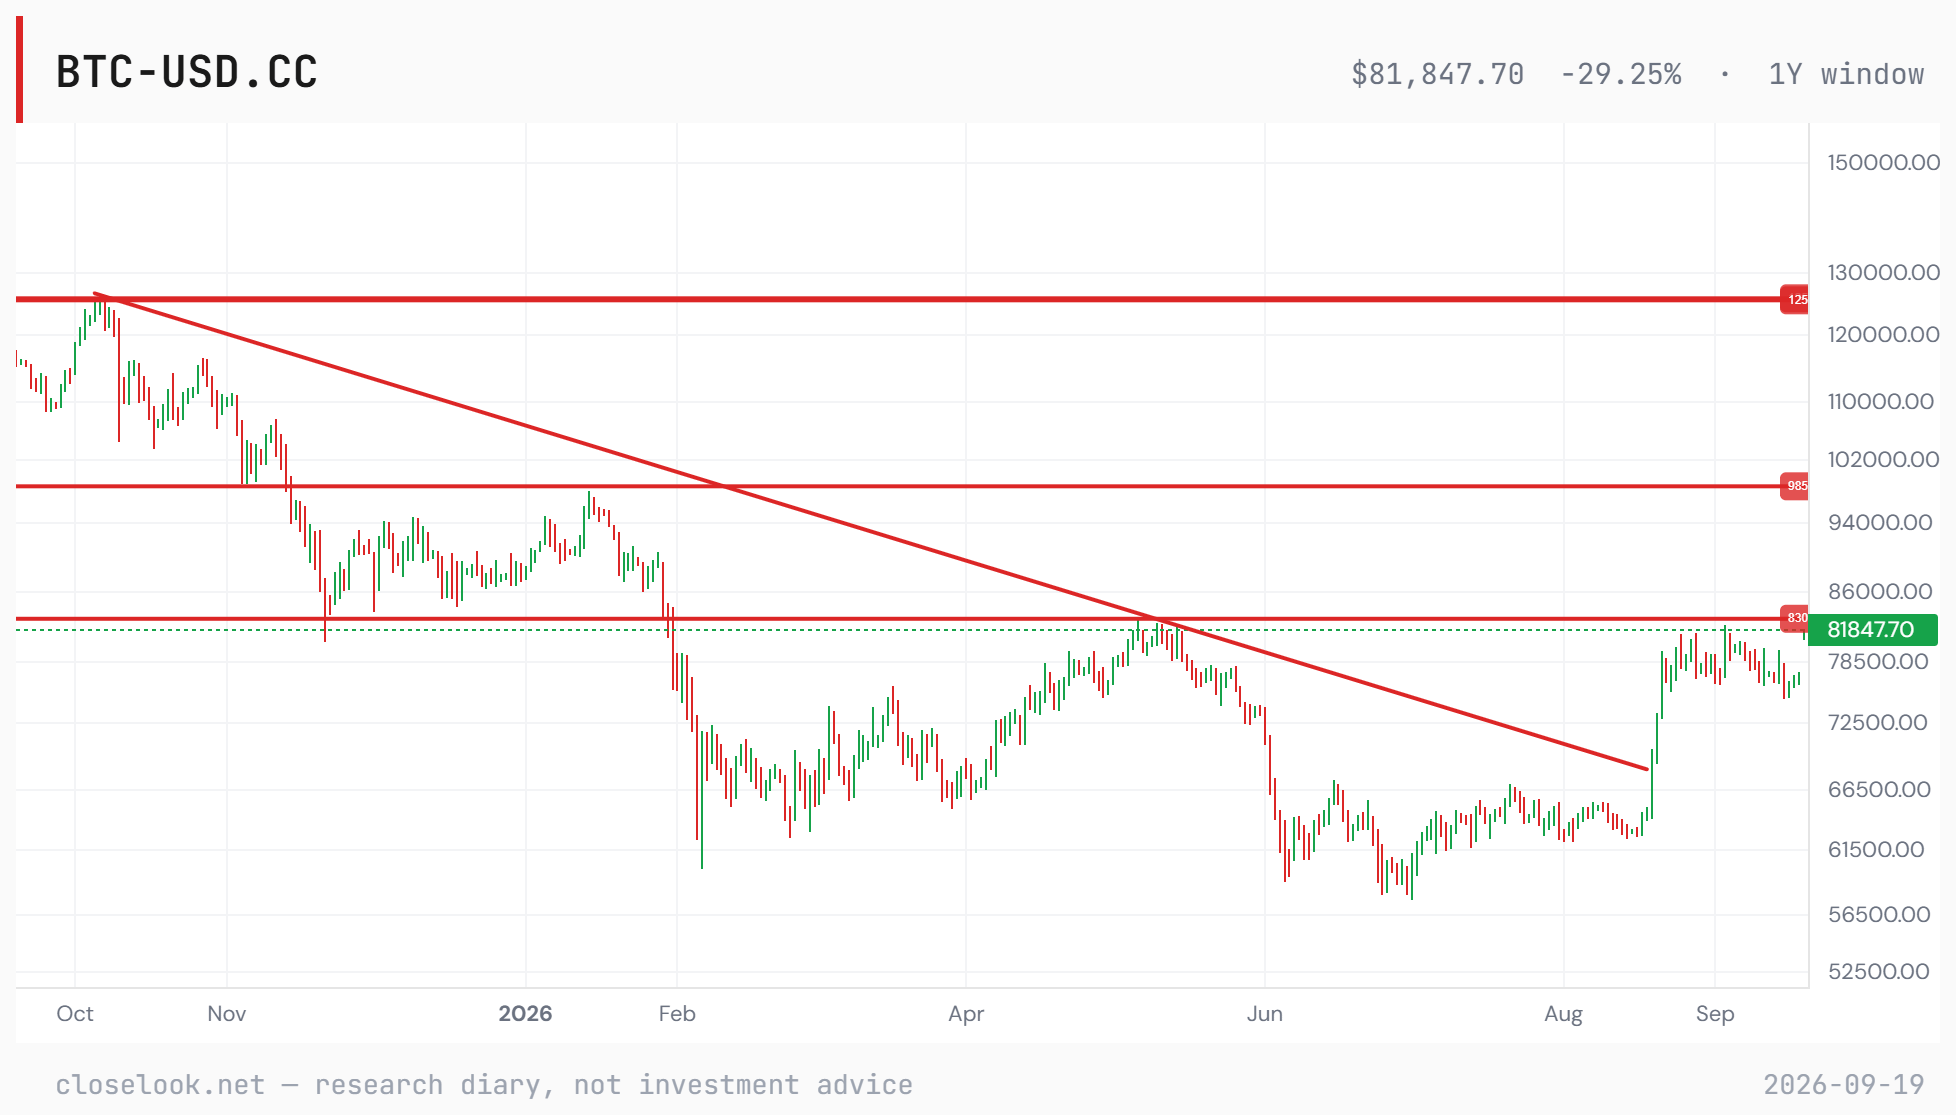
Bitcoin through 80,000 on the hike, and gold did nothing — the week’s cleanest split, and it is the editor’s addition to this letter. The coin’s full Friday, on the twenty-four-hour bar: 80,901 at the close, +5.9% on the day, an 81,332 high — through 80,000 for the first time since it lost the level in the summer — and 81,854 on Saturday afternoon. The week: 77,174 to 80,901, +4.8%, after a 75,613 Tuesday close that had it under the floor of its 77,000–83,000 zone; it re-entered the zone Wednesday and finished it in the upper half. The equity-hours fund, IBIT, printed the same move in a narrower window: 43.30 Thursday, 46.02 Friday, +6.3%, through both the 44 and 44.5 lines it lost a week ago. Gold, on the same two days: the front future 4,408.90 to 4,424.90 on the week, +0.4%, after a 4,332.80 low on Wednesday’s hike; the fund +0.60% to 401.17, +0.7% on Friday. One hedge rose six percent on the second hike of the week; the other rose a fraction and stayed under the 410 line Saturday’s letter set for it. Read it the house way: two hikes, one from the Fed with another signalled and one from Tokyo that sent the yen the wrong way, and the asset that was bought was the one priced on liquidity and dollar-scarcity, not the one priced on real rates. A five-percent ten-year is a headwind for a metal that pays nothing; a carry trade re-opened by a hike that failed to firm its funding currency is a tailwind for the asset the carry buys. Two hedges, one week, opposite answers — and the pair ratio, gold over bitcoin, turned back toward the coin. The editor’s chart below puts the week on the year: the descending line from the October high, broken in August, is behind the price now; 83,000 is the next line above — the ceiling of the zone Saturday’s letter carries — then 98,500 and the October high near 125,000. A coin that broke a ten-month trendline in August and took 80,000 on a hike in September is trading its own structure, not the Fed’s. Section 4 puts the marks on it; section 6 says what reverses it.
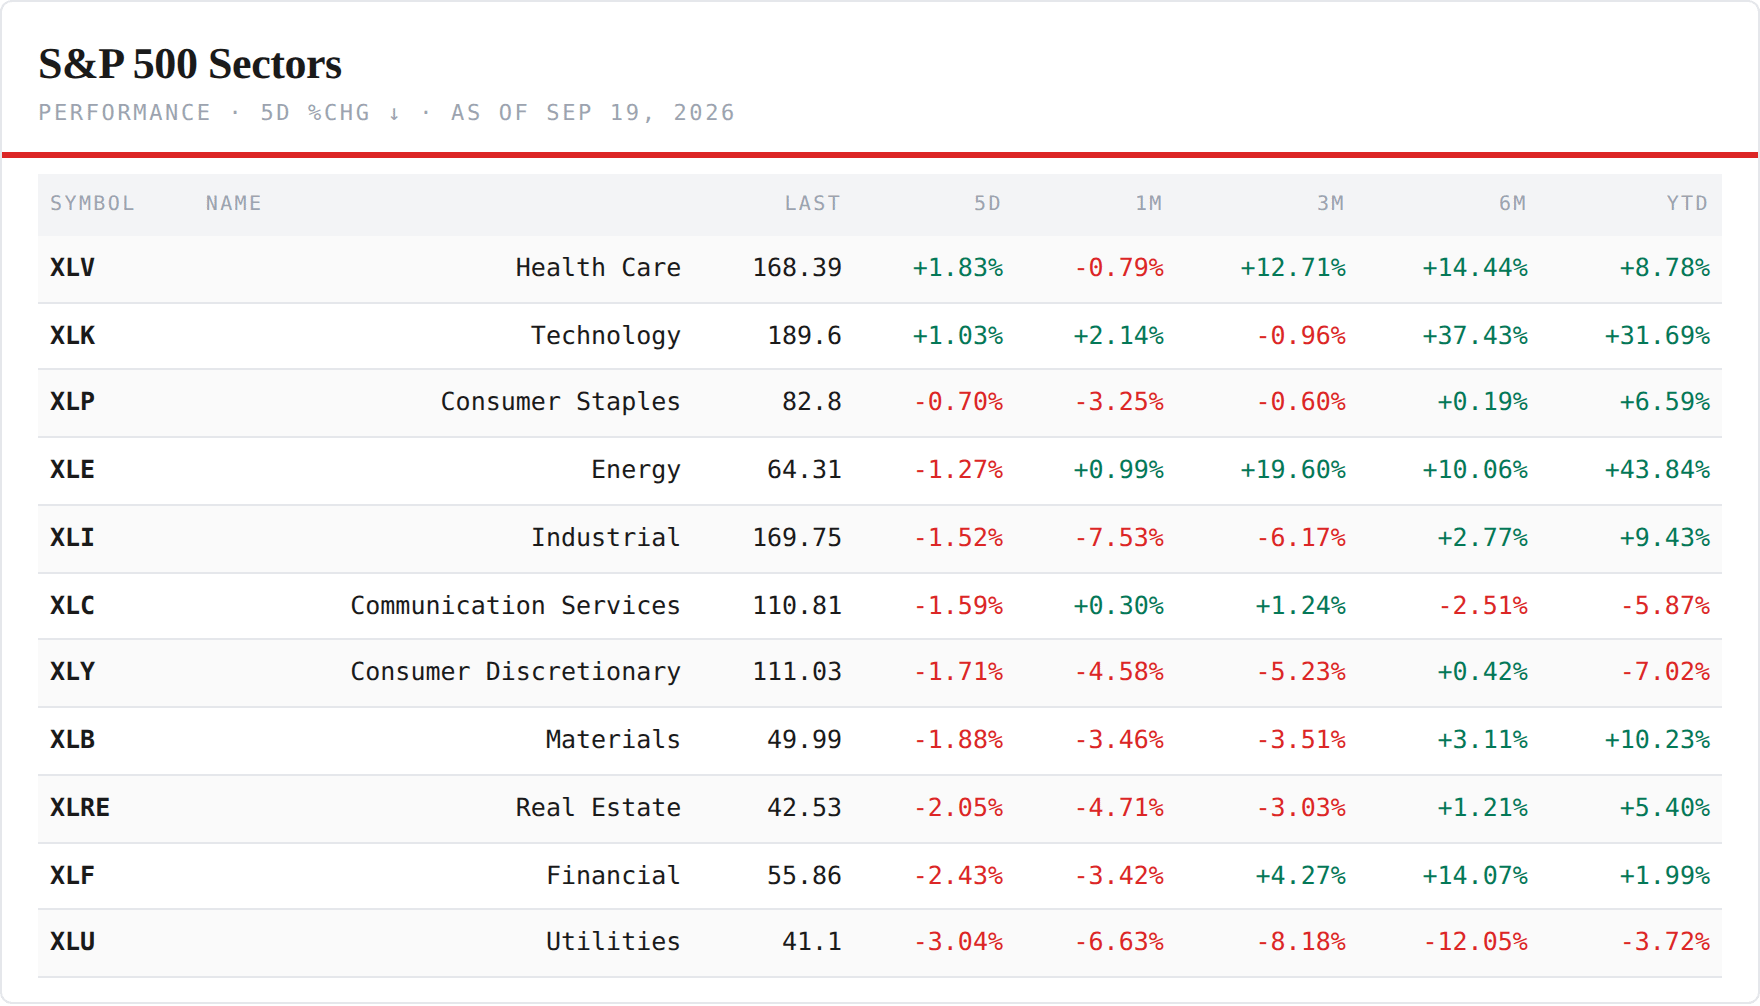
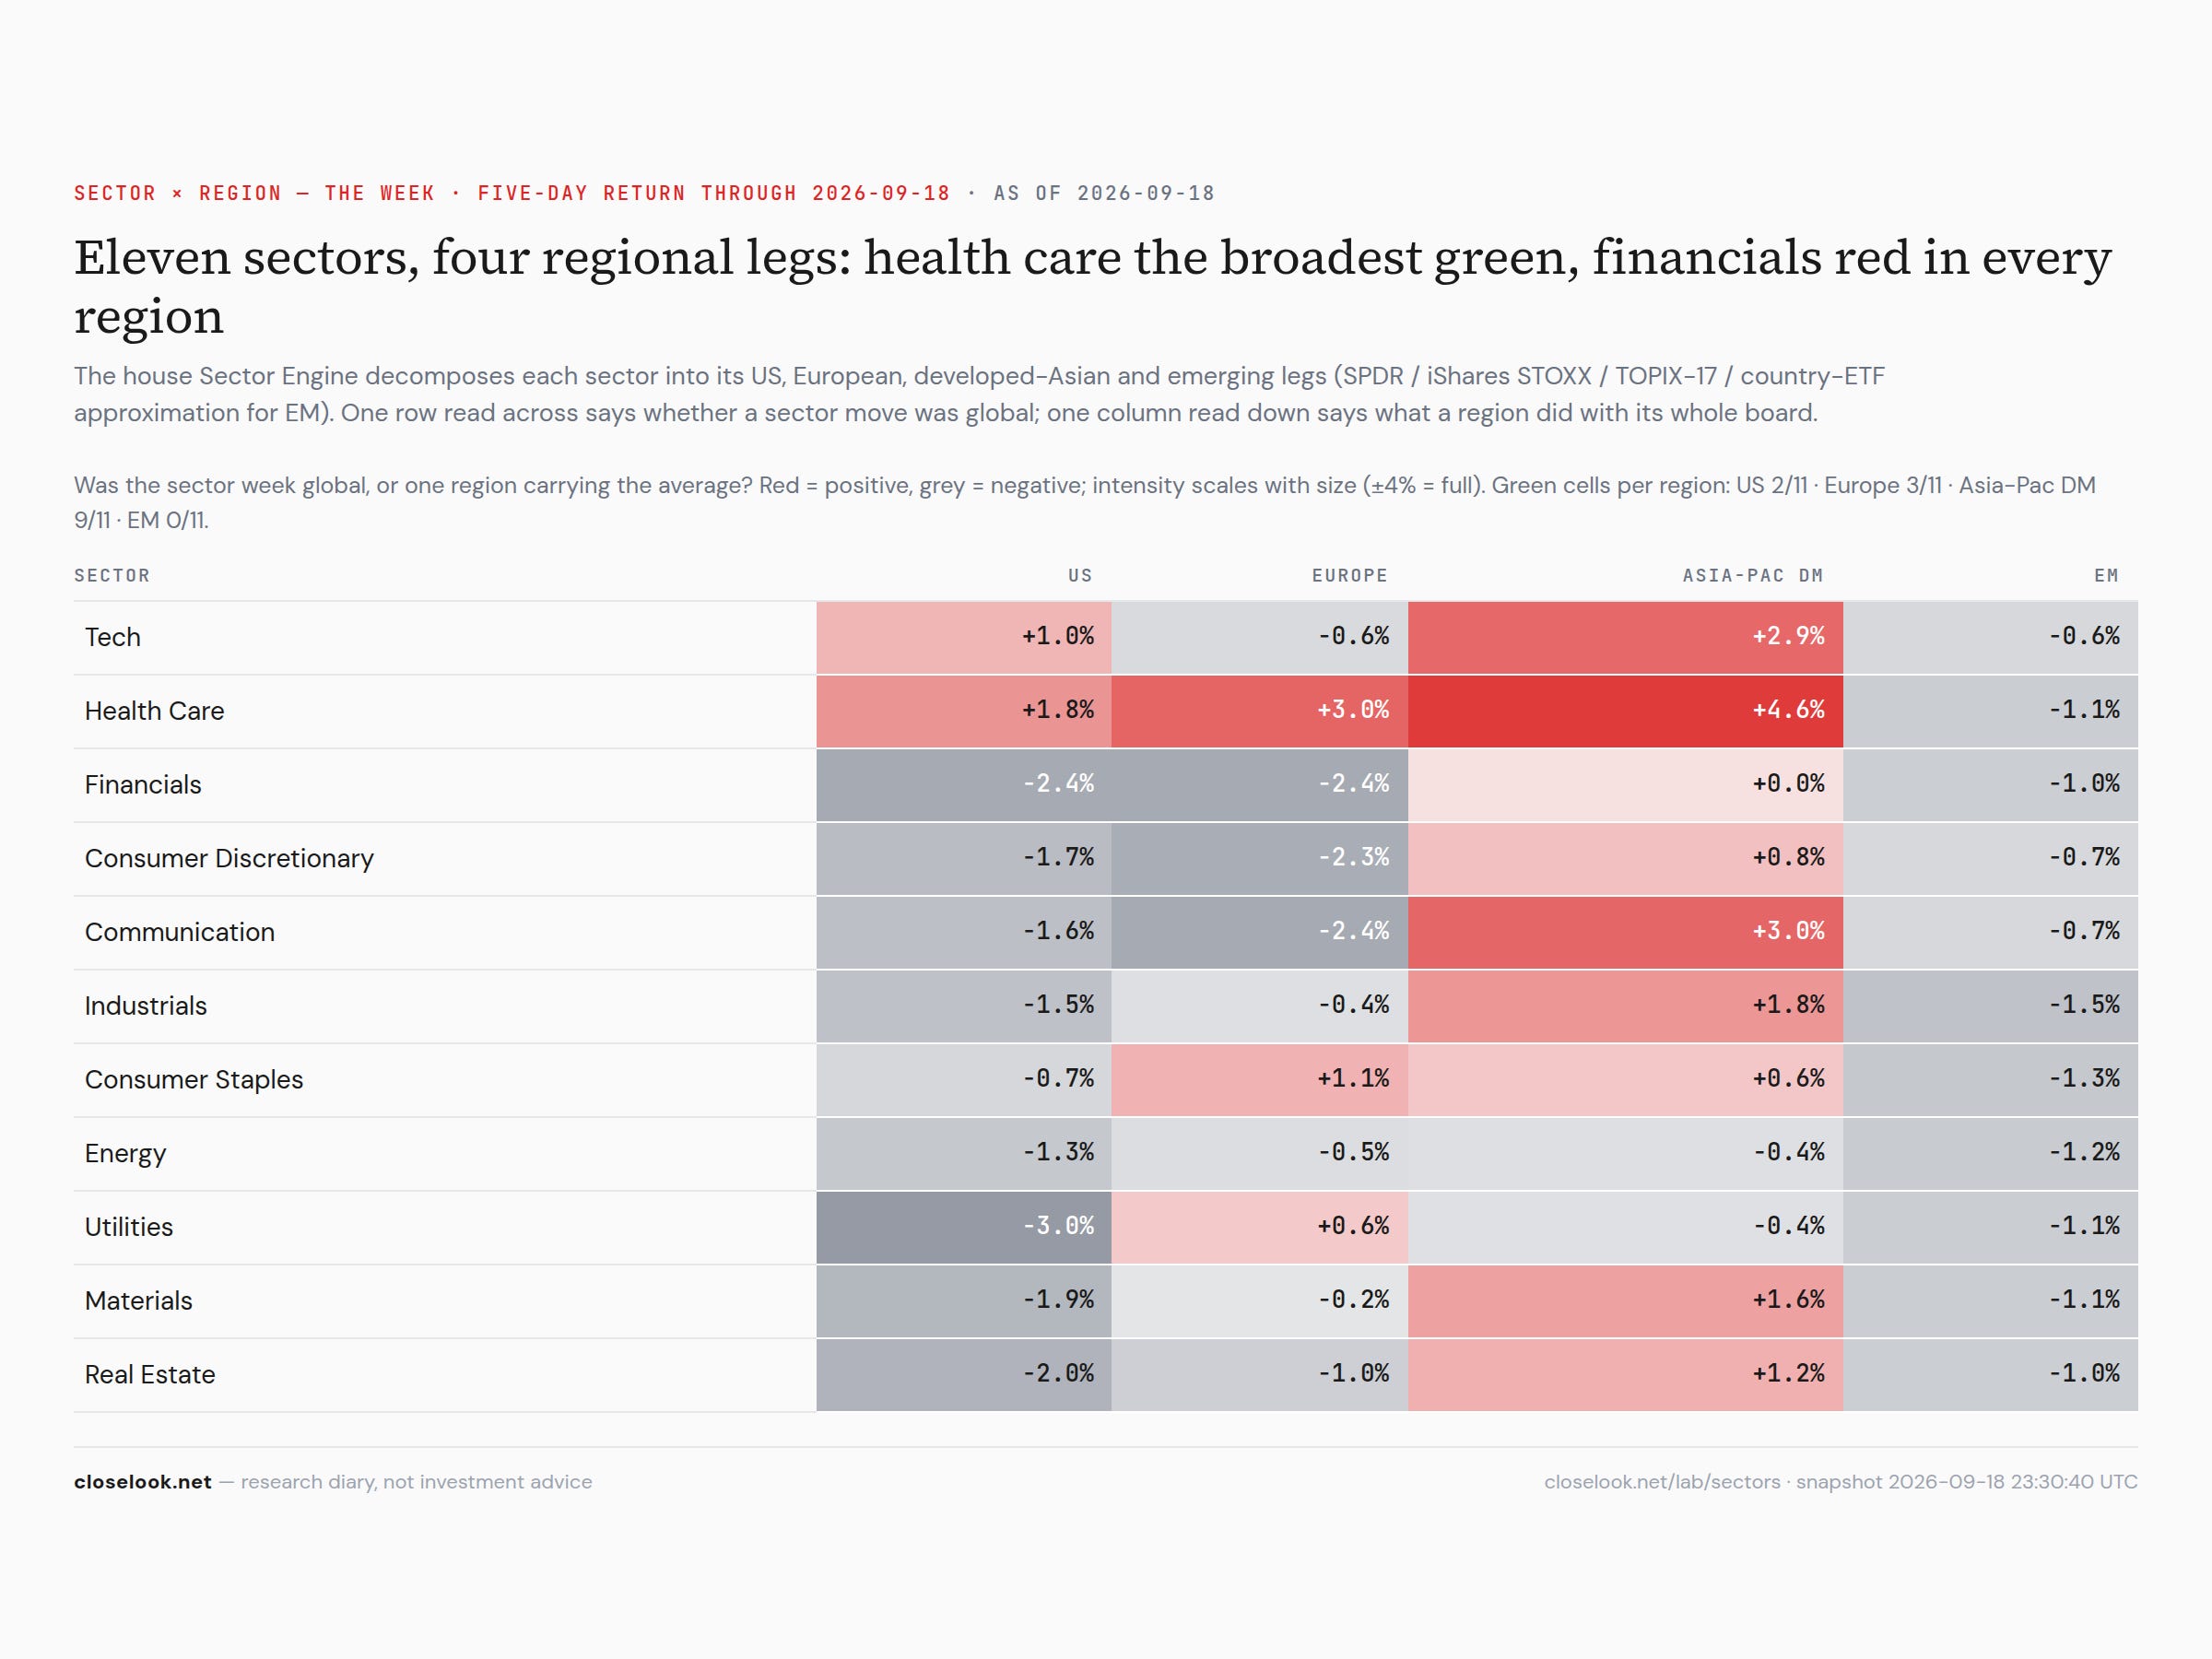
The sector read — two green of eleven, and both are the sectors the week’s two sorts were about. Health care +1.83% — from the worst US sector last week to the best — and technology +1.03%. Nine red: staples −0.70%, energy −1.27%, industrials −1.52%, communications −1.59%, discretionary −1.71%, materials −1.88%, real estate −2.05%, financials −2.43%, utilities −3.04%. Last week’s sort had two floors, commodity inputs and defensives together; this week’s has one, and it is the ten-year at five percent: the three rate-sensitive groups — utilities, financials, real estate — are the bottom three. Health care at the top after a −3.55% week is not a rotation reading; it is the group with the most to sell last week having the least to sell this week. Energy fell with its barrel for the first time in three weeks. A tape that sold nine of eleven sectors and finished flat on the index is, for a fourth week, a tape held up by its narrowest layer.
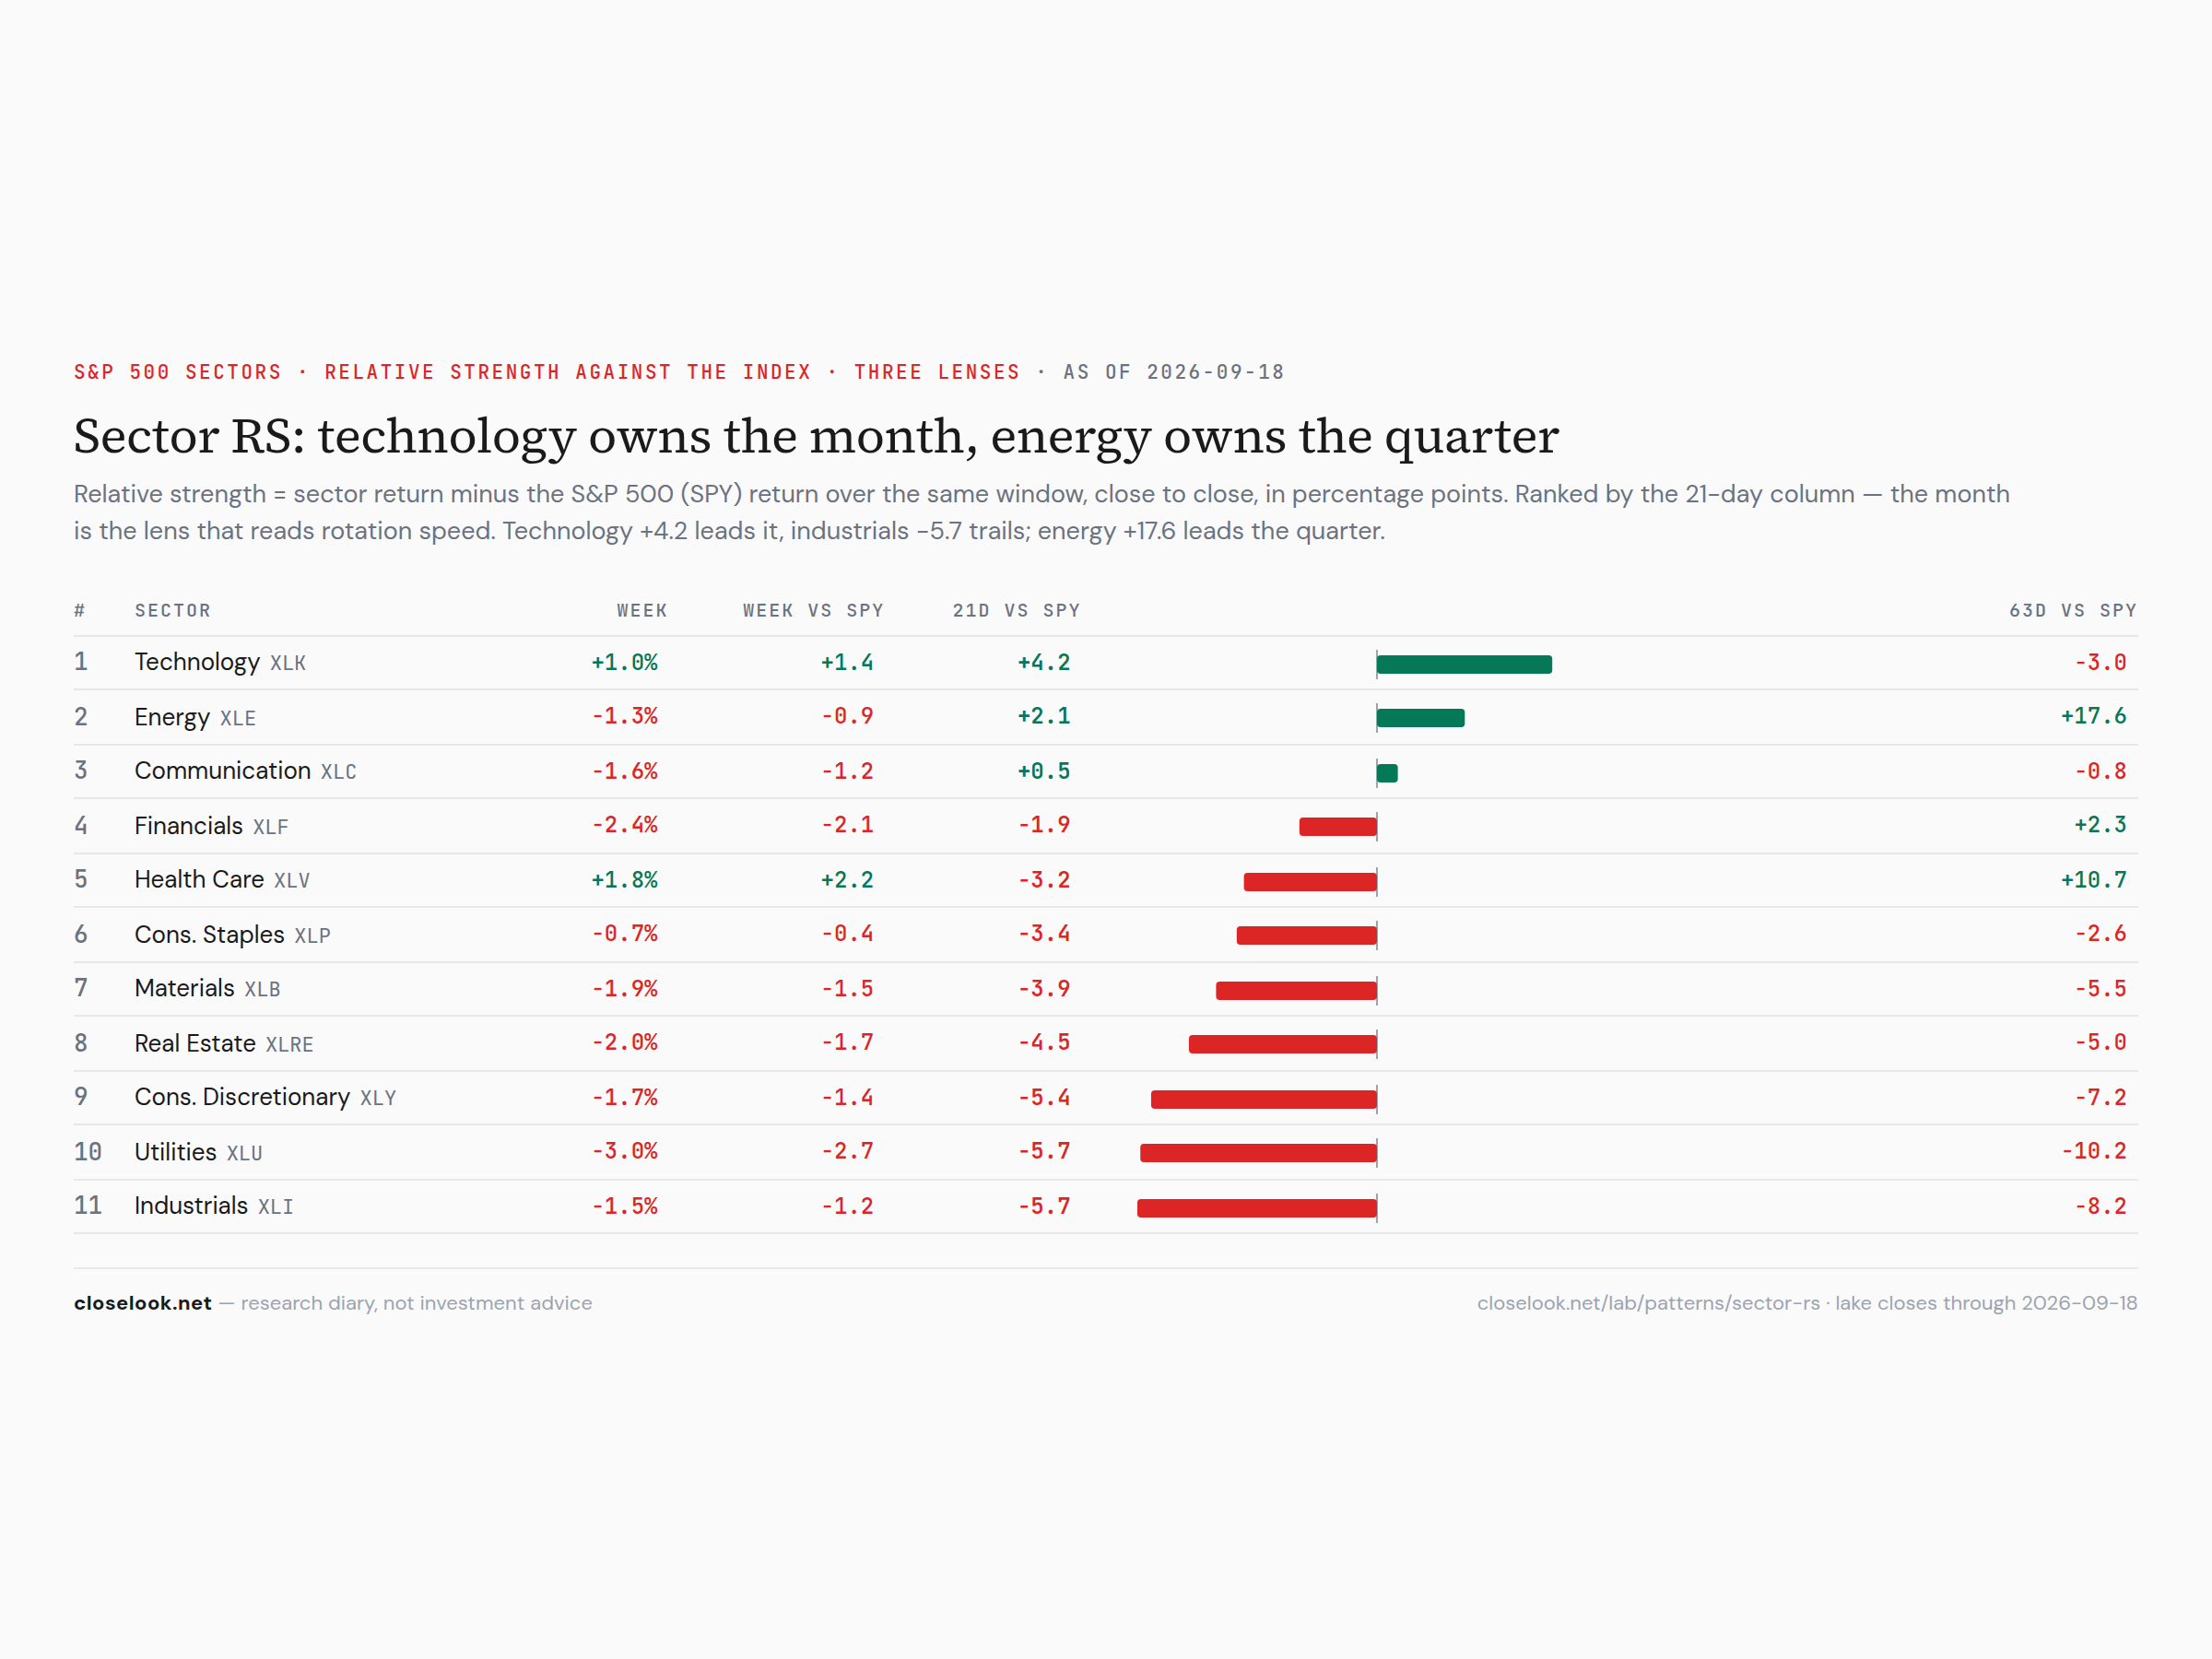
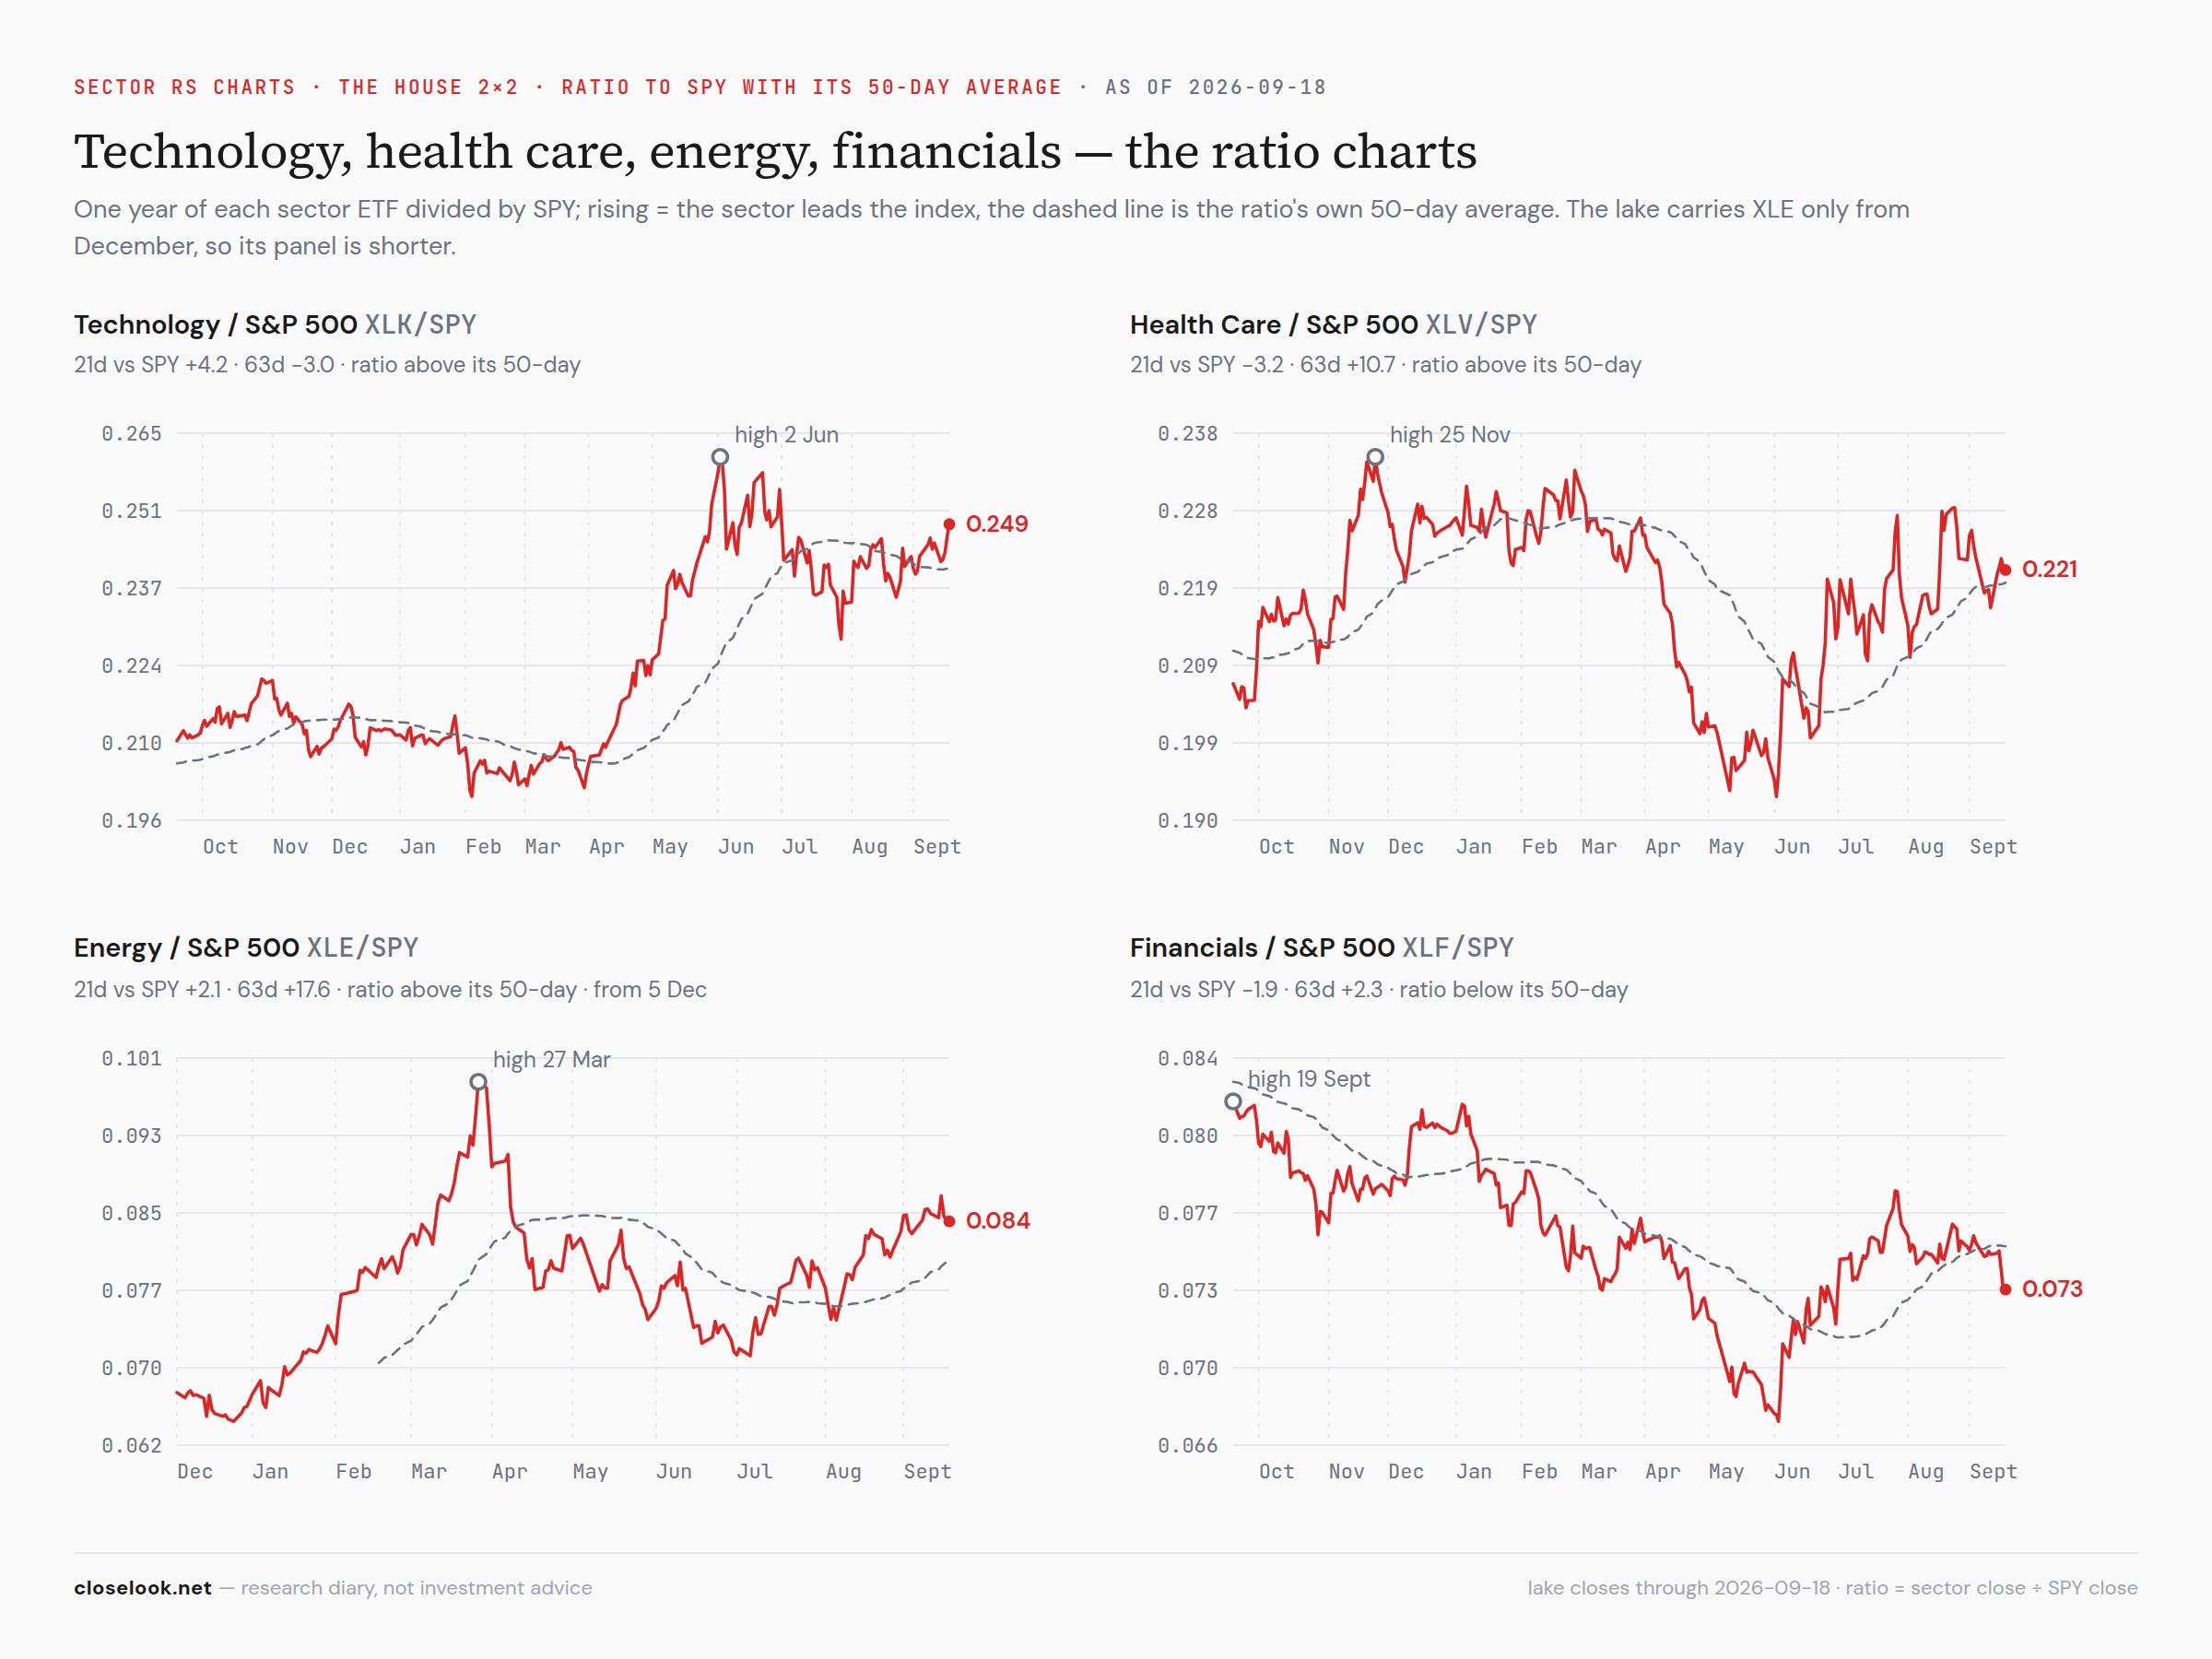
The sector rankings — relative strength, three lenses; energy still owns the quarter, technology took the month. Our sector-RS board reads the rotation’s speed, and this week the two lenses disagree for the first time in a month: energy +2.1 points against the index over 21 days, +17.6 over 63 — the quarter is energy’s by a distance that widened even on a week the sector fell, because the sixty-three-day window still carries August; technology +4.2 on the month, −3.0 on the quarter — the month’s leader, from flat a week ago, on the two sessions in which the chips were bought back. Health care: −3.2 on the month, +10.7 on the quarter — the best week on the surface board and still the fastest-fading line on the month lens. Financials −1.9 and +2.3: the quarter’s cushion is nearly gone. The bottom of the month lens is the rate-sensitive trio plus the cyclicals: utilities −5.7, industrials −5.7, discretionary −5.4, real estate −4.5, materials −3.9. Read the two lenses together: the quarter still belongs to oil, the month now belongs to the chip, and nothing that borrows money is on either list.
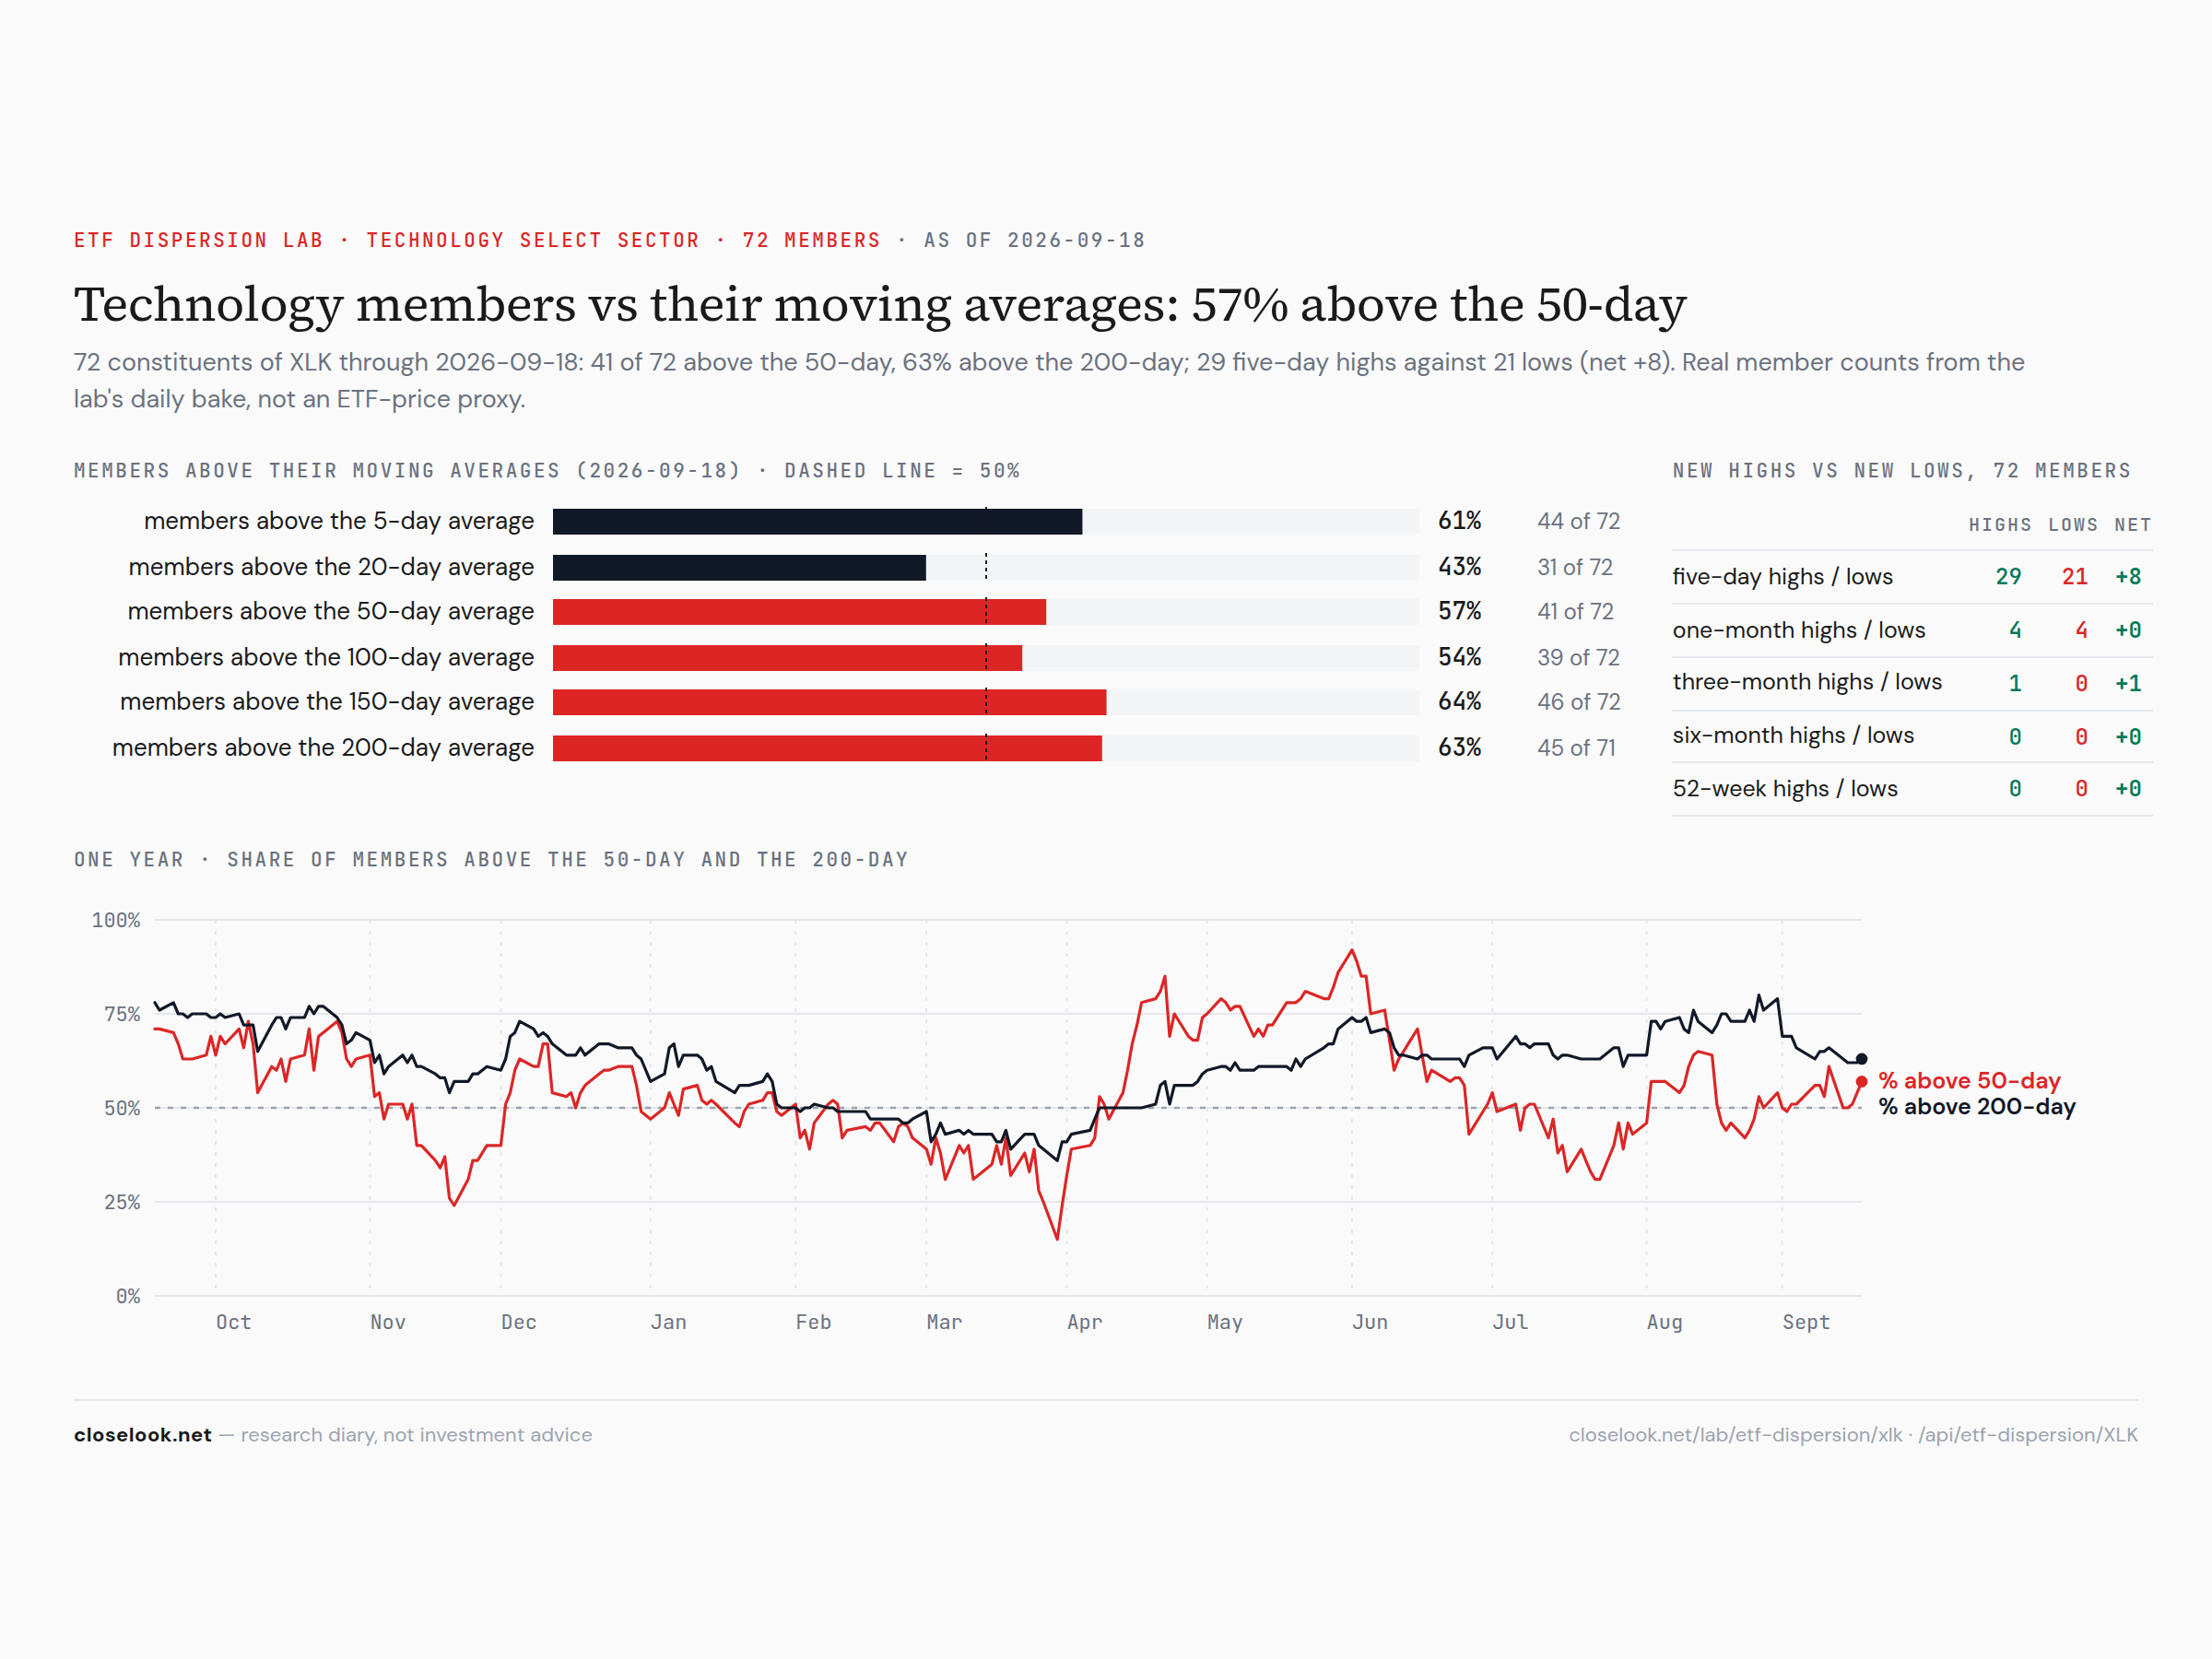
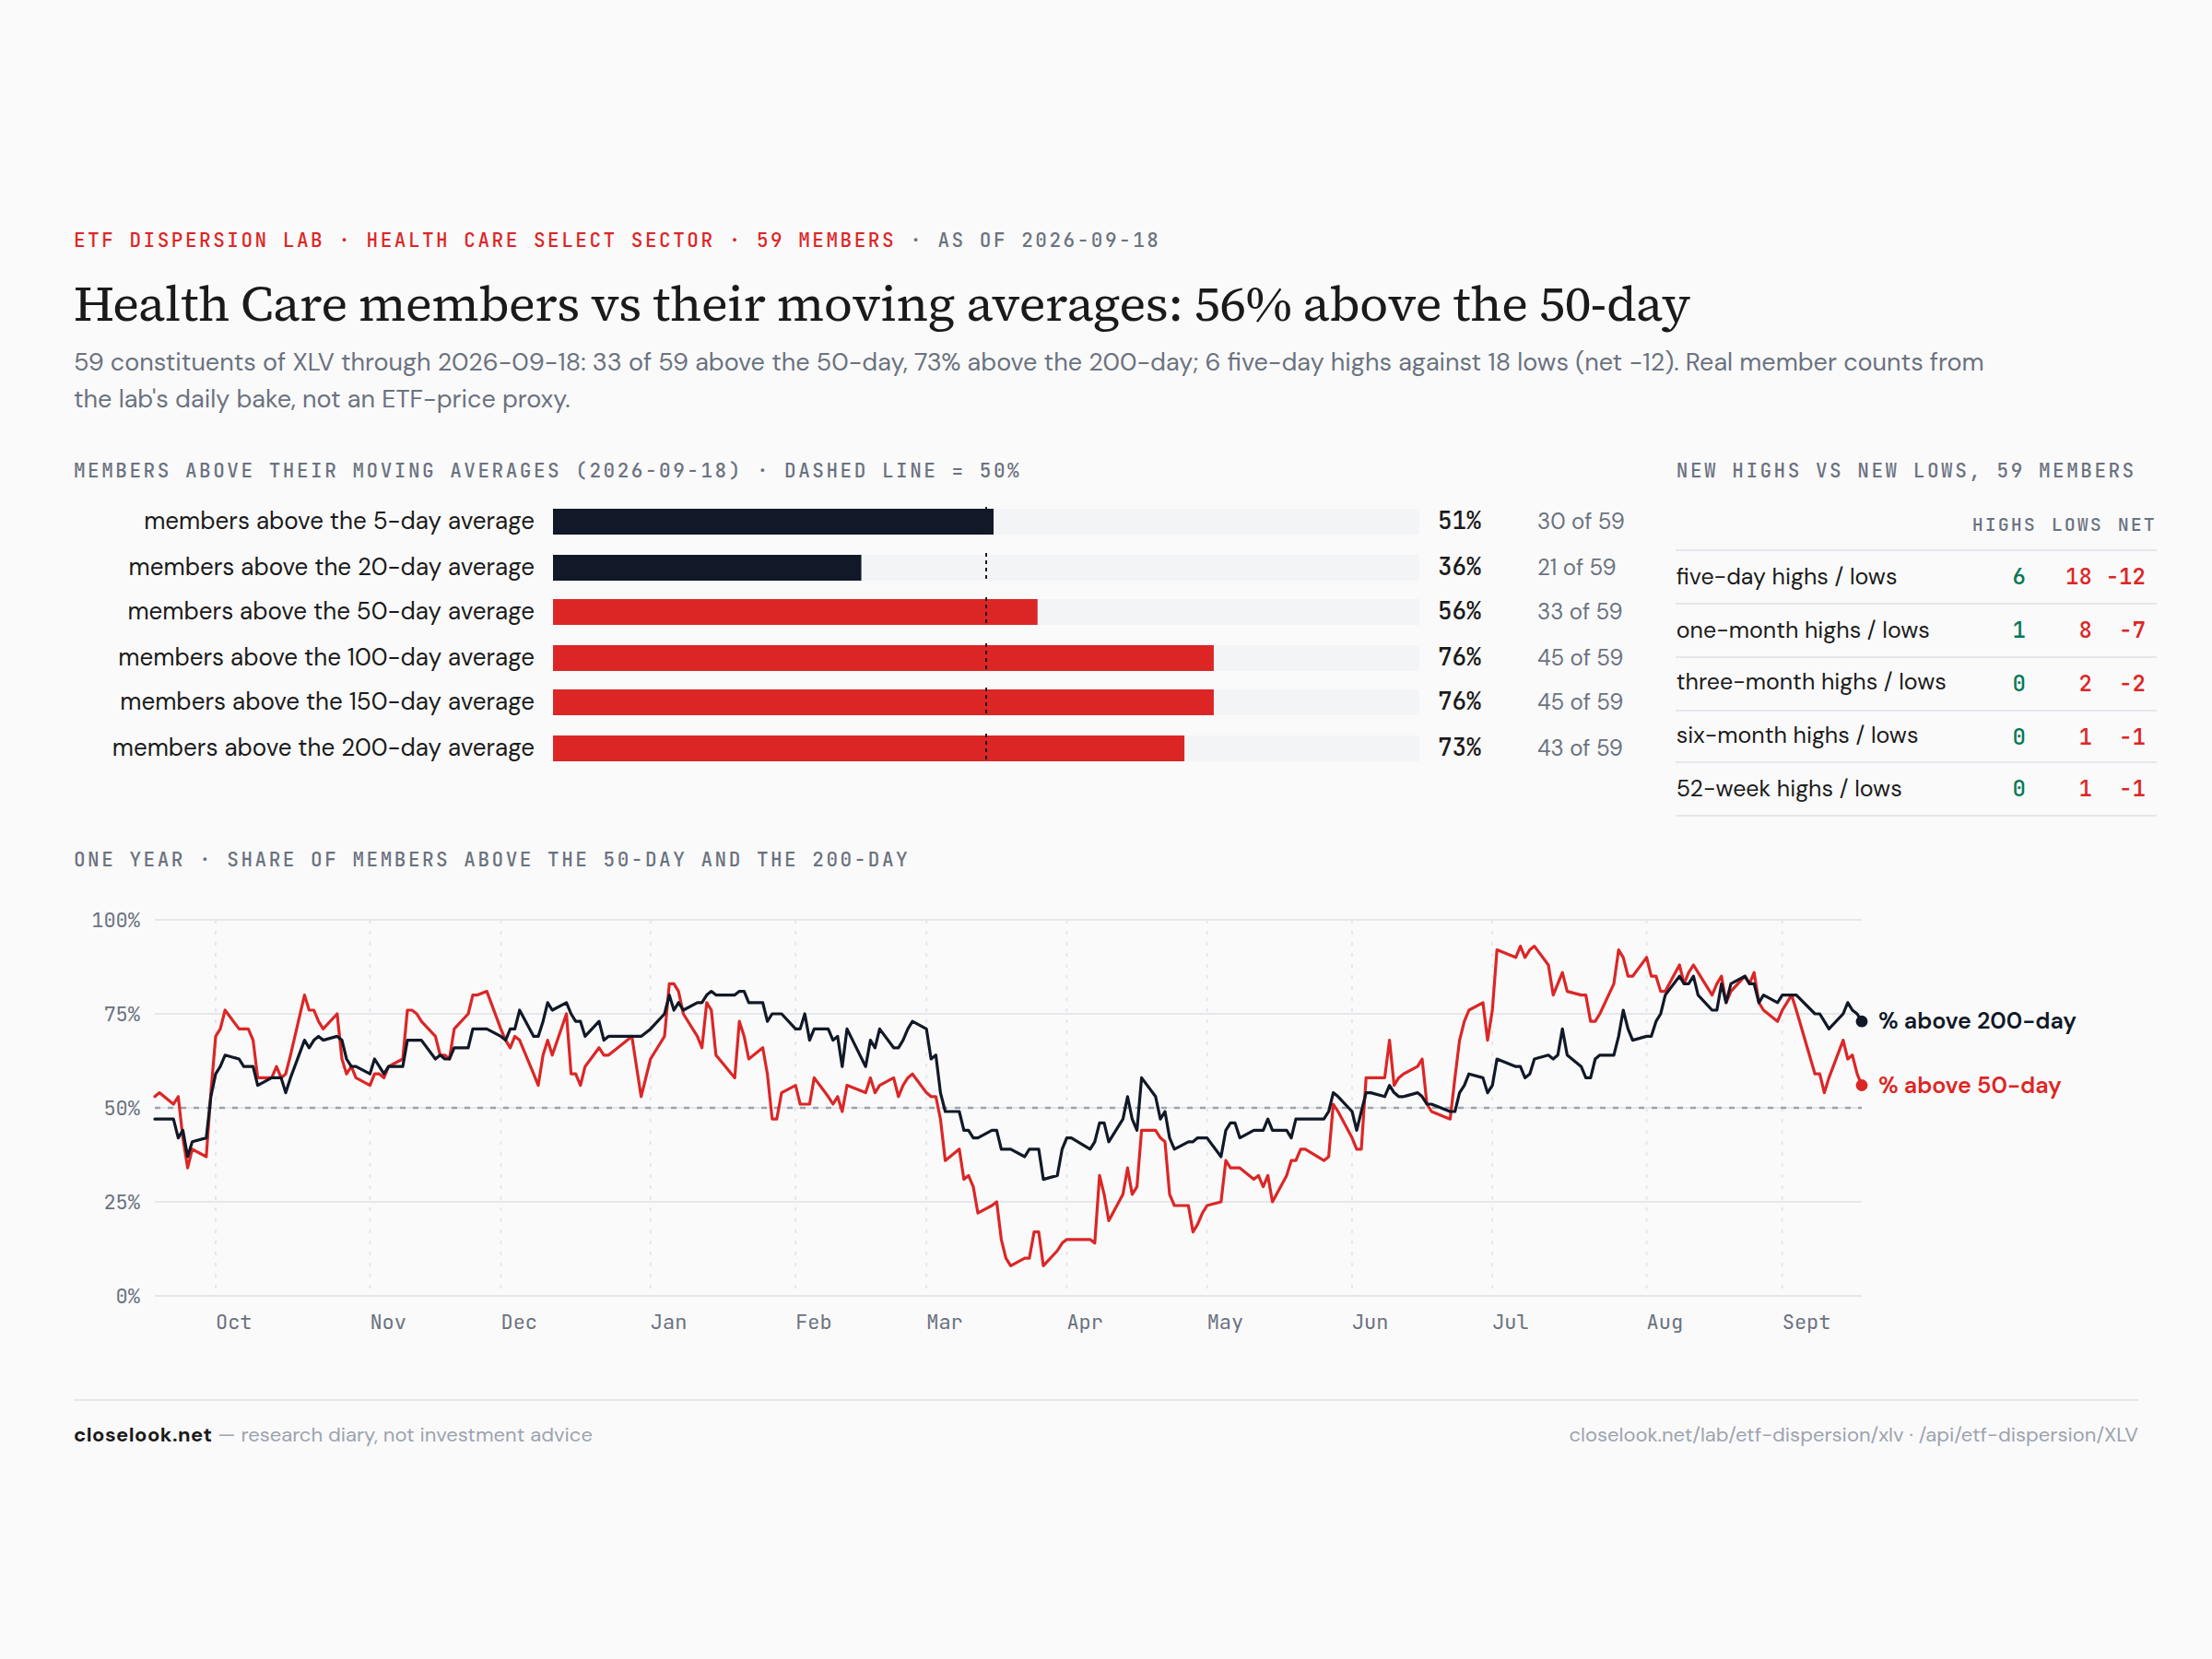
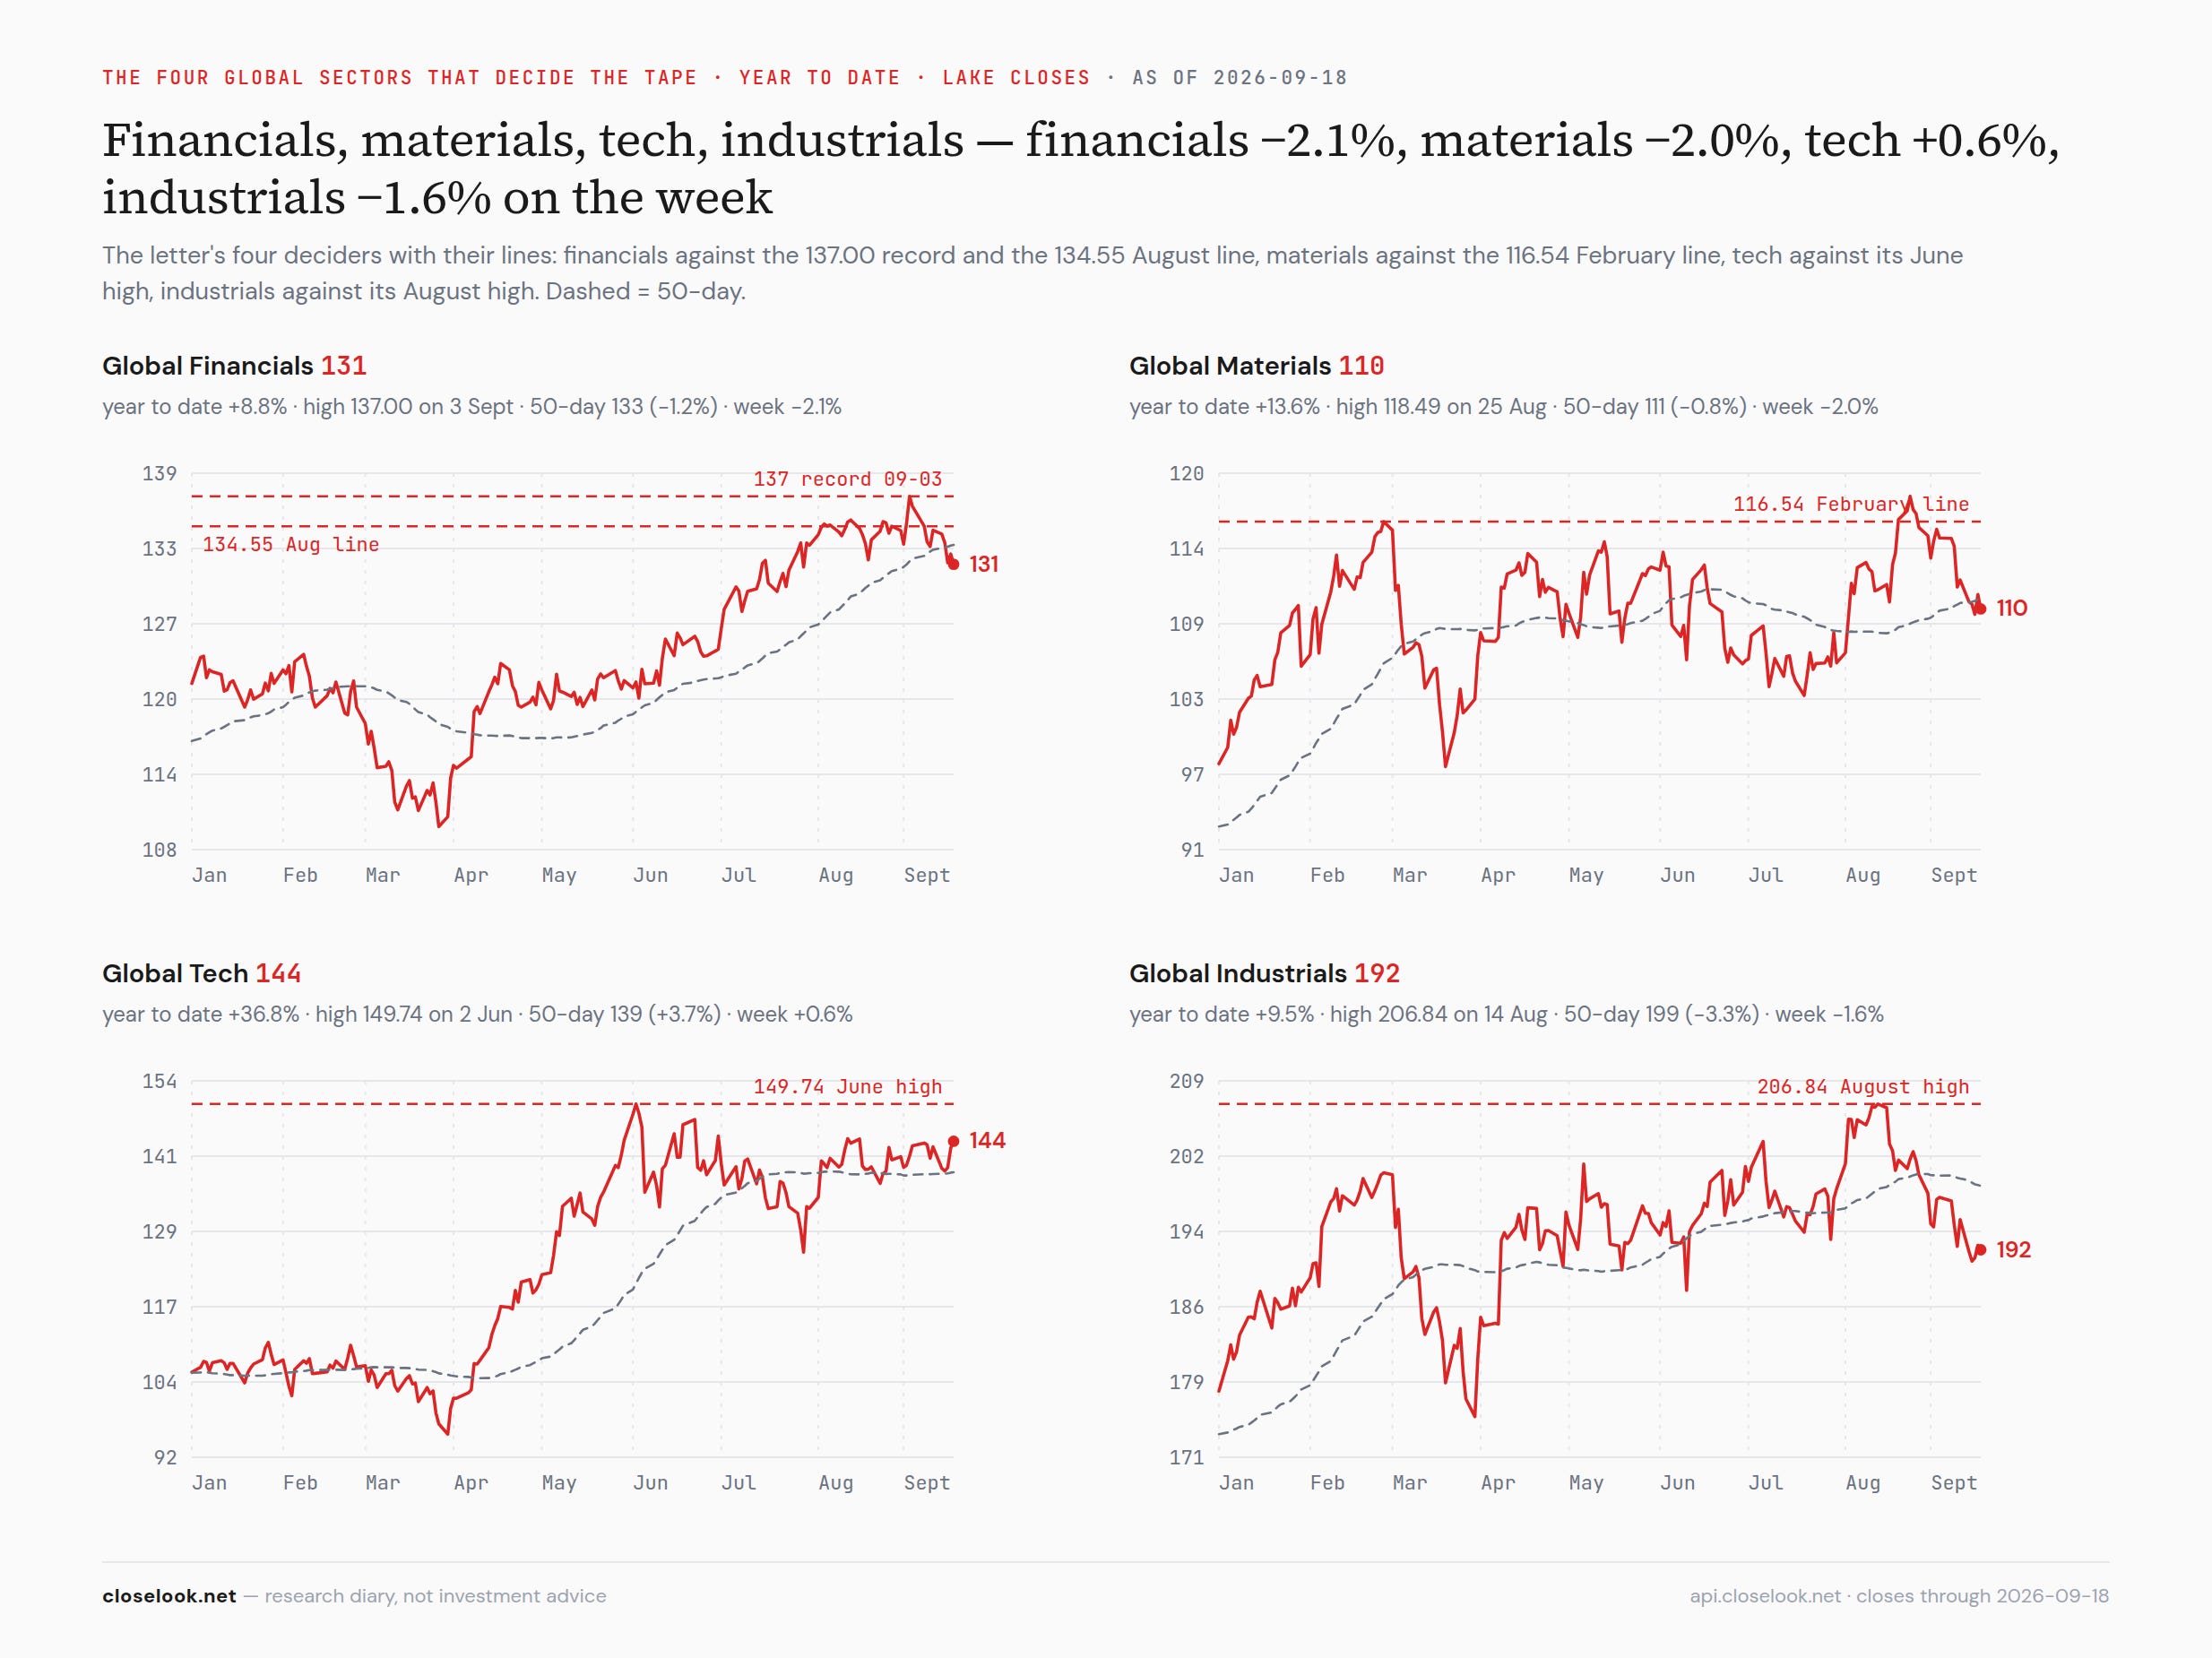
Underneath the focus sectors — technology’s internals held, financials’ broke. The dispersion pages show the members behind each ETF. Technology: 57% of members above their 50-day, from 61%; 43% above the 20-day; 29 five-day highs against 21 lows — a +8 net after +20, on a week the sector’s ETF rose a percent: the chip names printed the highs on Friday, the software names printed the lows on the same day. Health care: 56% above the 50-day, from 58%, but 76% above the 100-day, from 73% — the medium-term structure that gave way last week firmed again; 6 five-day highs against 18 lows, −12 net after −19. Financials: 17% of members above their 50-day, 12% above the 20-day, 6 five-day highs against 30 lows, 18 one-month lows — the weakest internal reading on the board, under a sector line that fell 2.4%. Financials still have 55% of members above the 100-day and 75% above the 150-day: the quarter’s structure is intact and the month’s is gone, which is the shape of a sector being sold for its rate sensitivity and not for its business. Industrials: 11% above the 50-day, 15% above the 20-day. Energy: 62% above the 50-day, 80% above the 200-day — the barrel fell and the members held their trend. The board reads the week the way the surface read it: the money that left the tape left through the sectors that borrow.
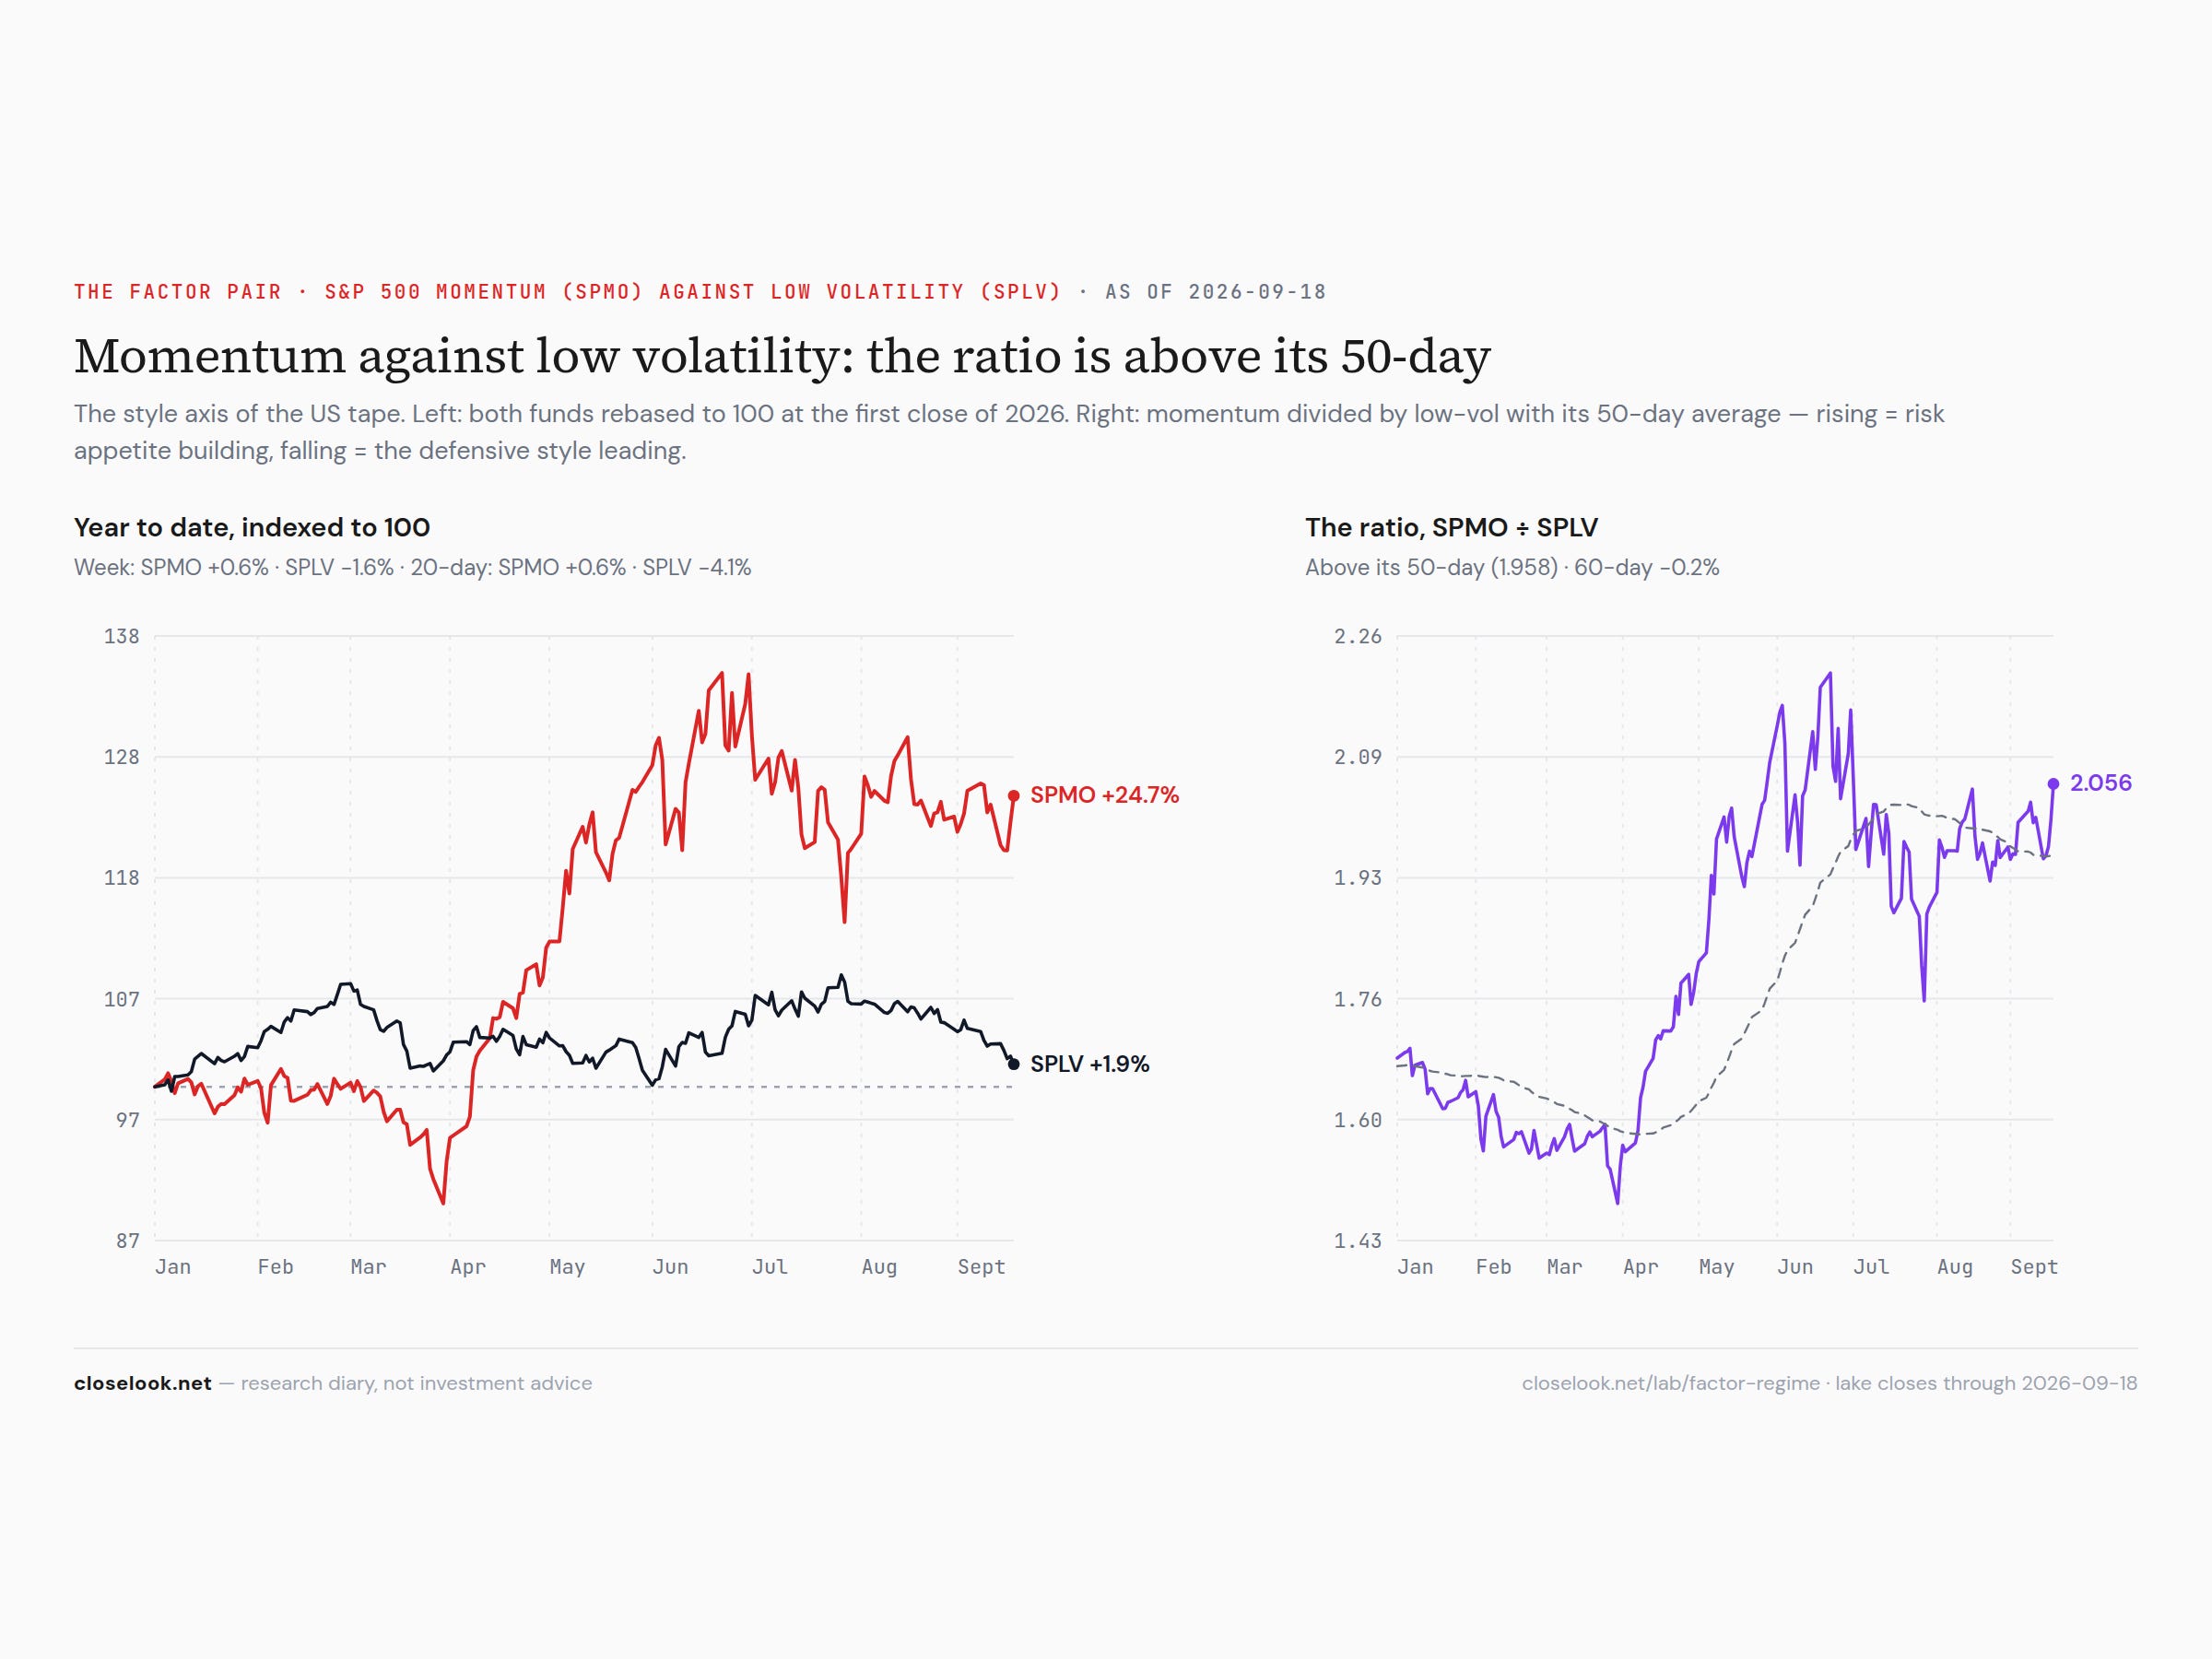
The factor read — the label held, and this time the legs sorted. The factor-regime gauge reads momentum-over-low-vol indexed at 163.25 against a 50-day at 155.48, above trend, at the 97.1st percentile — “momentum leading, risk appetite building” — from 159.61 and the 94.4th percentile a week ago. Last week the label held with both legs down; this week the legs went opposite ways: SPMO +0.61% against SPLV −1.64%. The twenty-day rate of change on the spread is +4.88 from +0.6 — the sharpest widening of the summer, on a week the index fell. A gauge that reads “risk appetite building” while the S&P falls and the equal-weight falls harder is reading the composition of the fall: the low-volatility names — utilities, staples, real estate, the bond proxies — were sold on the five-percent ten-year, and the momentum names — the chips, the security names, the consumer-AI megacaps — were bought on the reclaim. Saturday’s letter found the international pair not sorting the week; the domestic pair did, and it sorted by rate sensitivity. That is a reading of what the hike did, not of what the market wants.
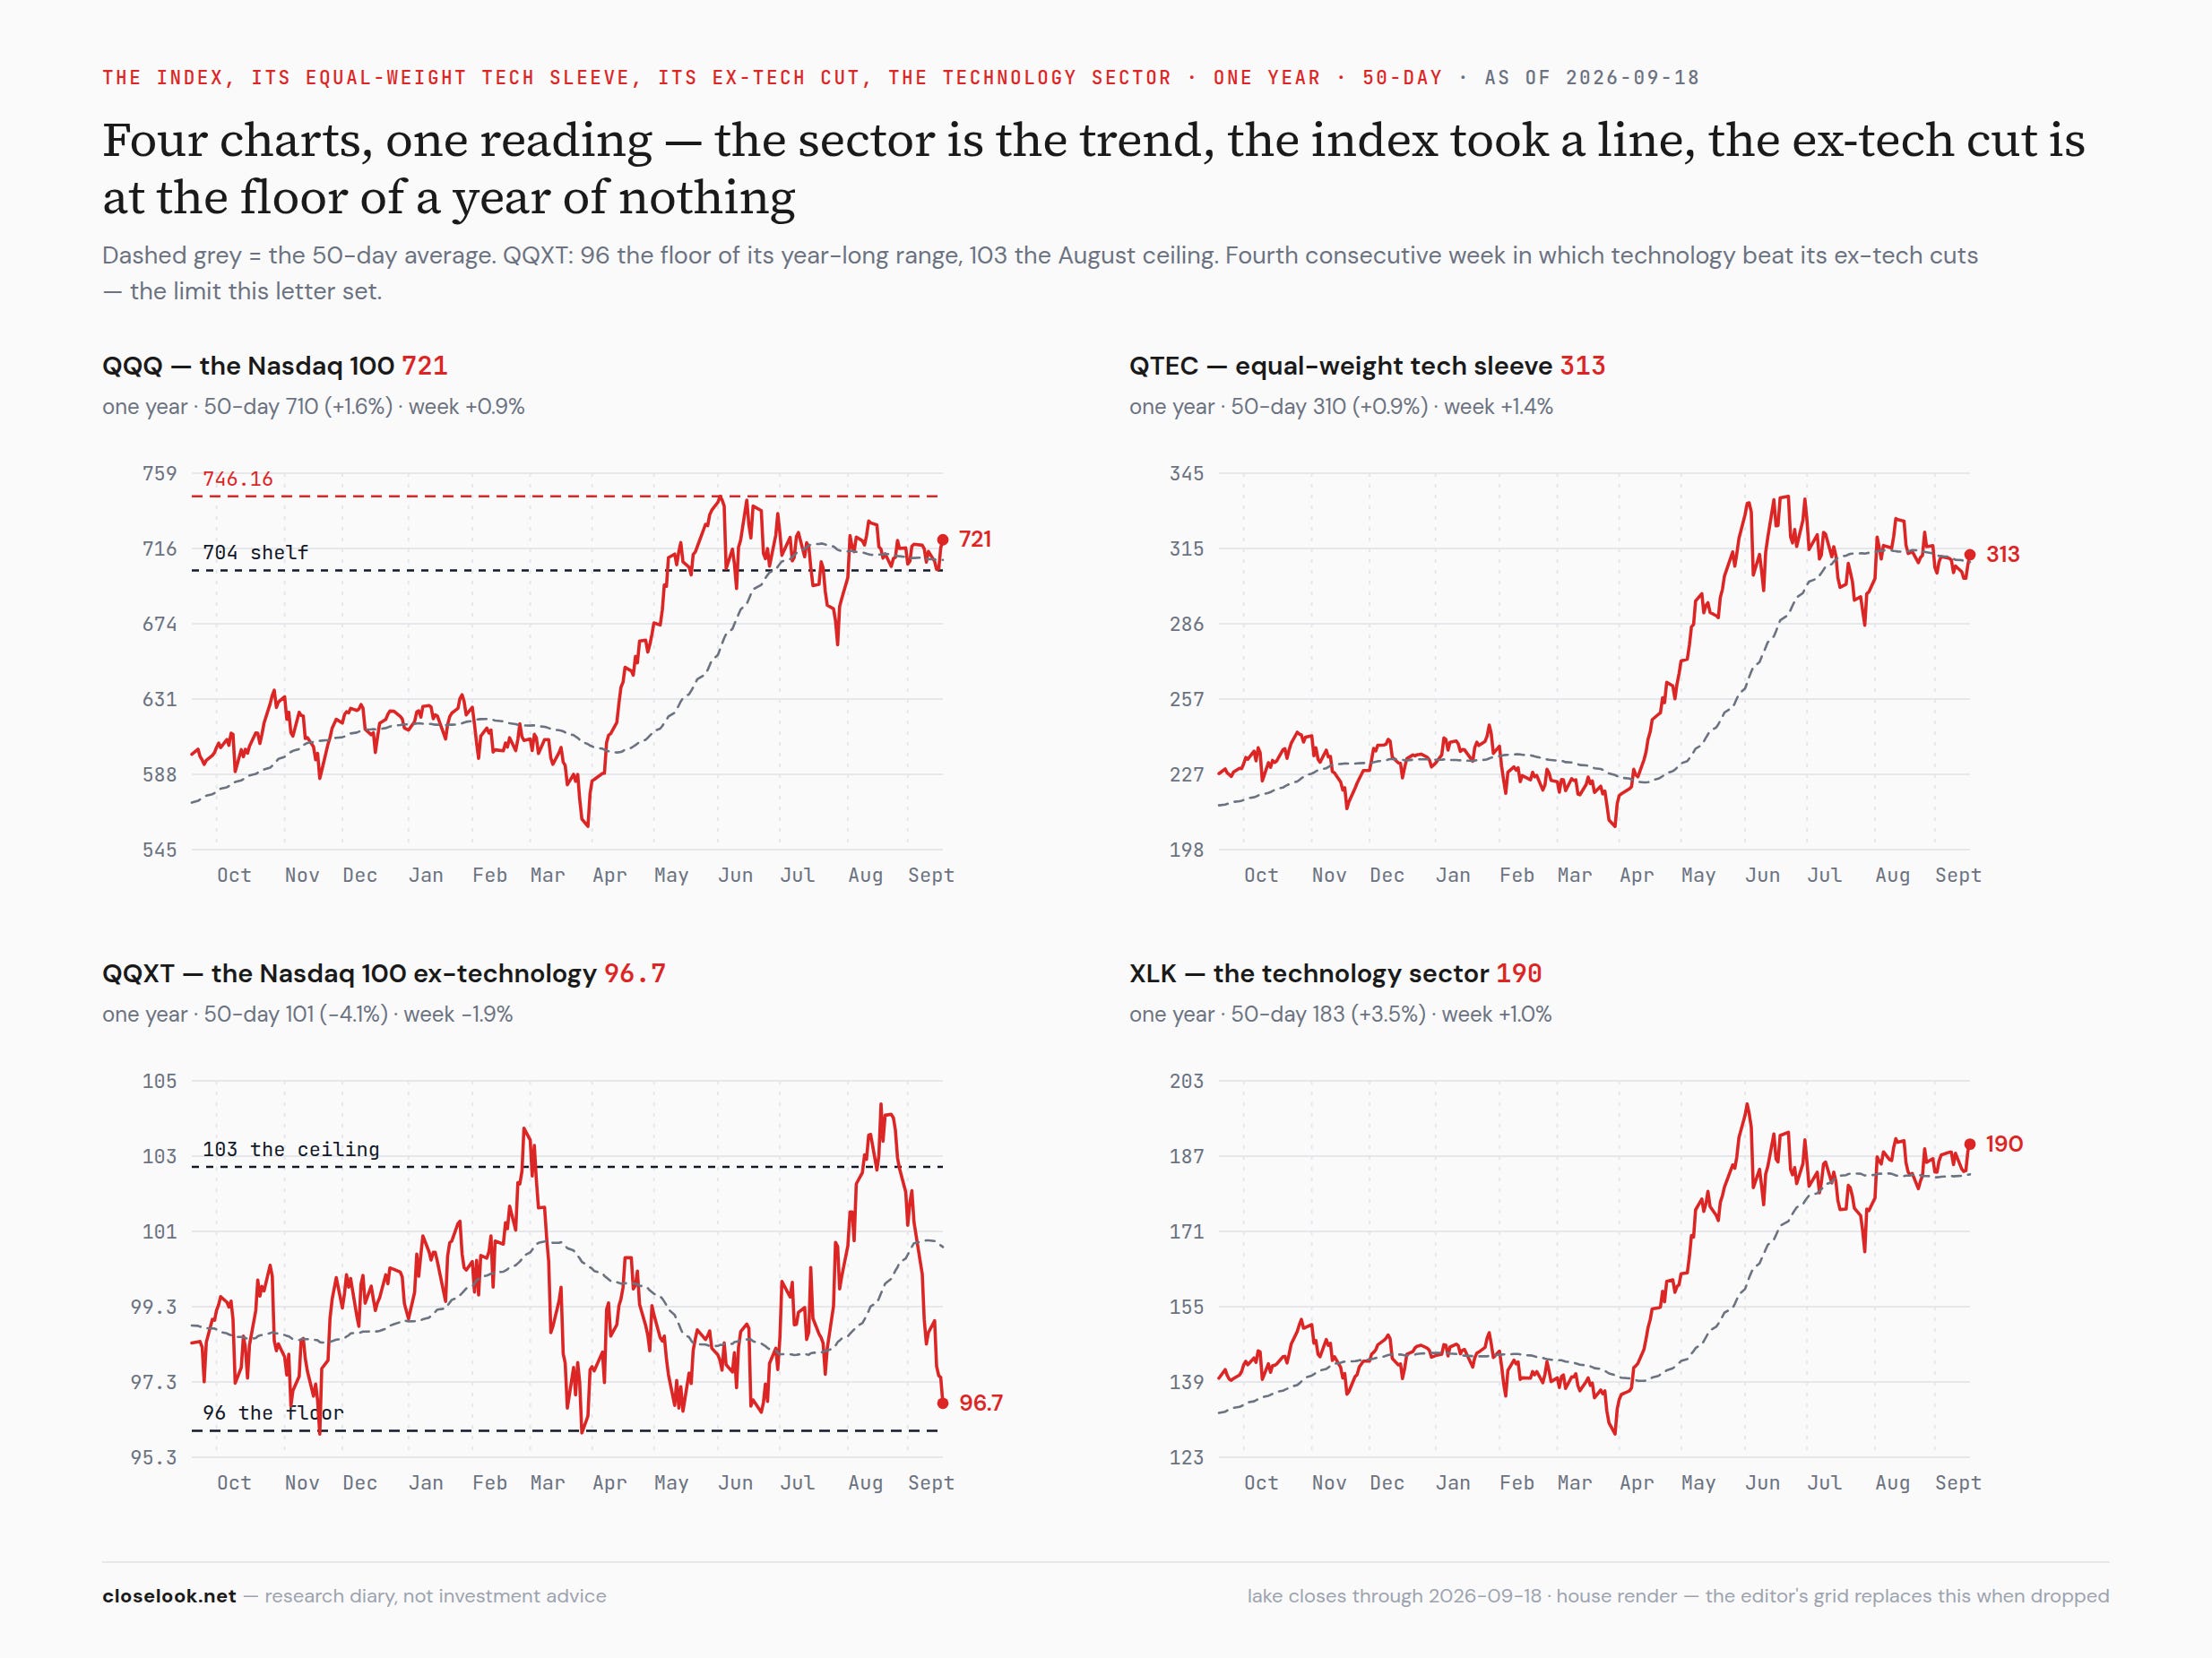
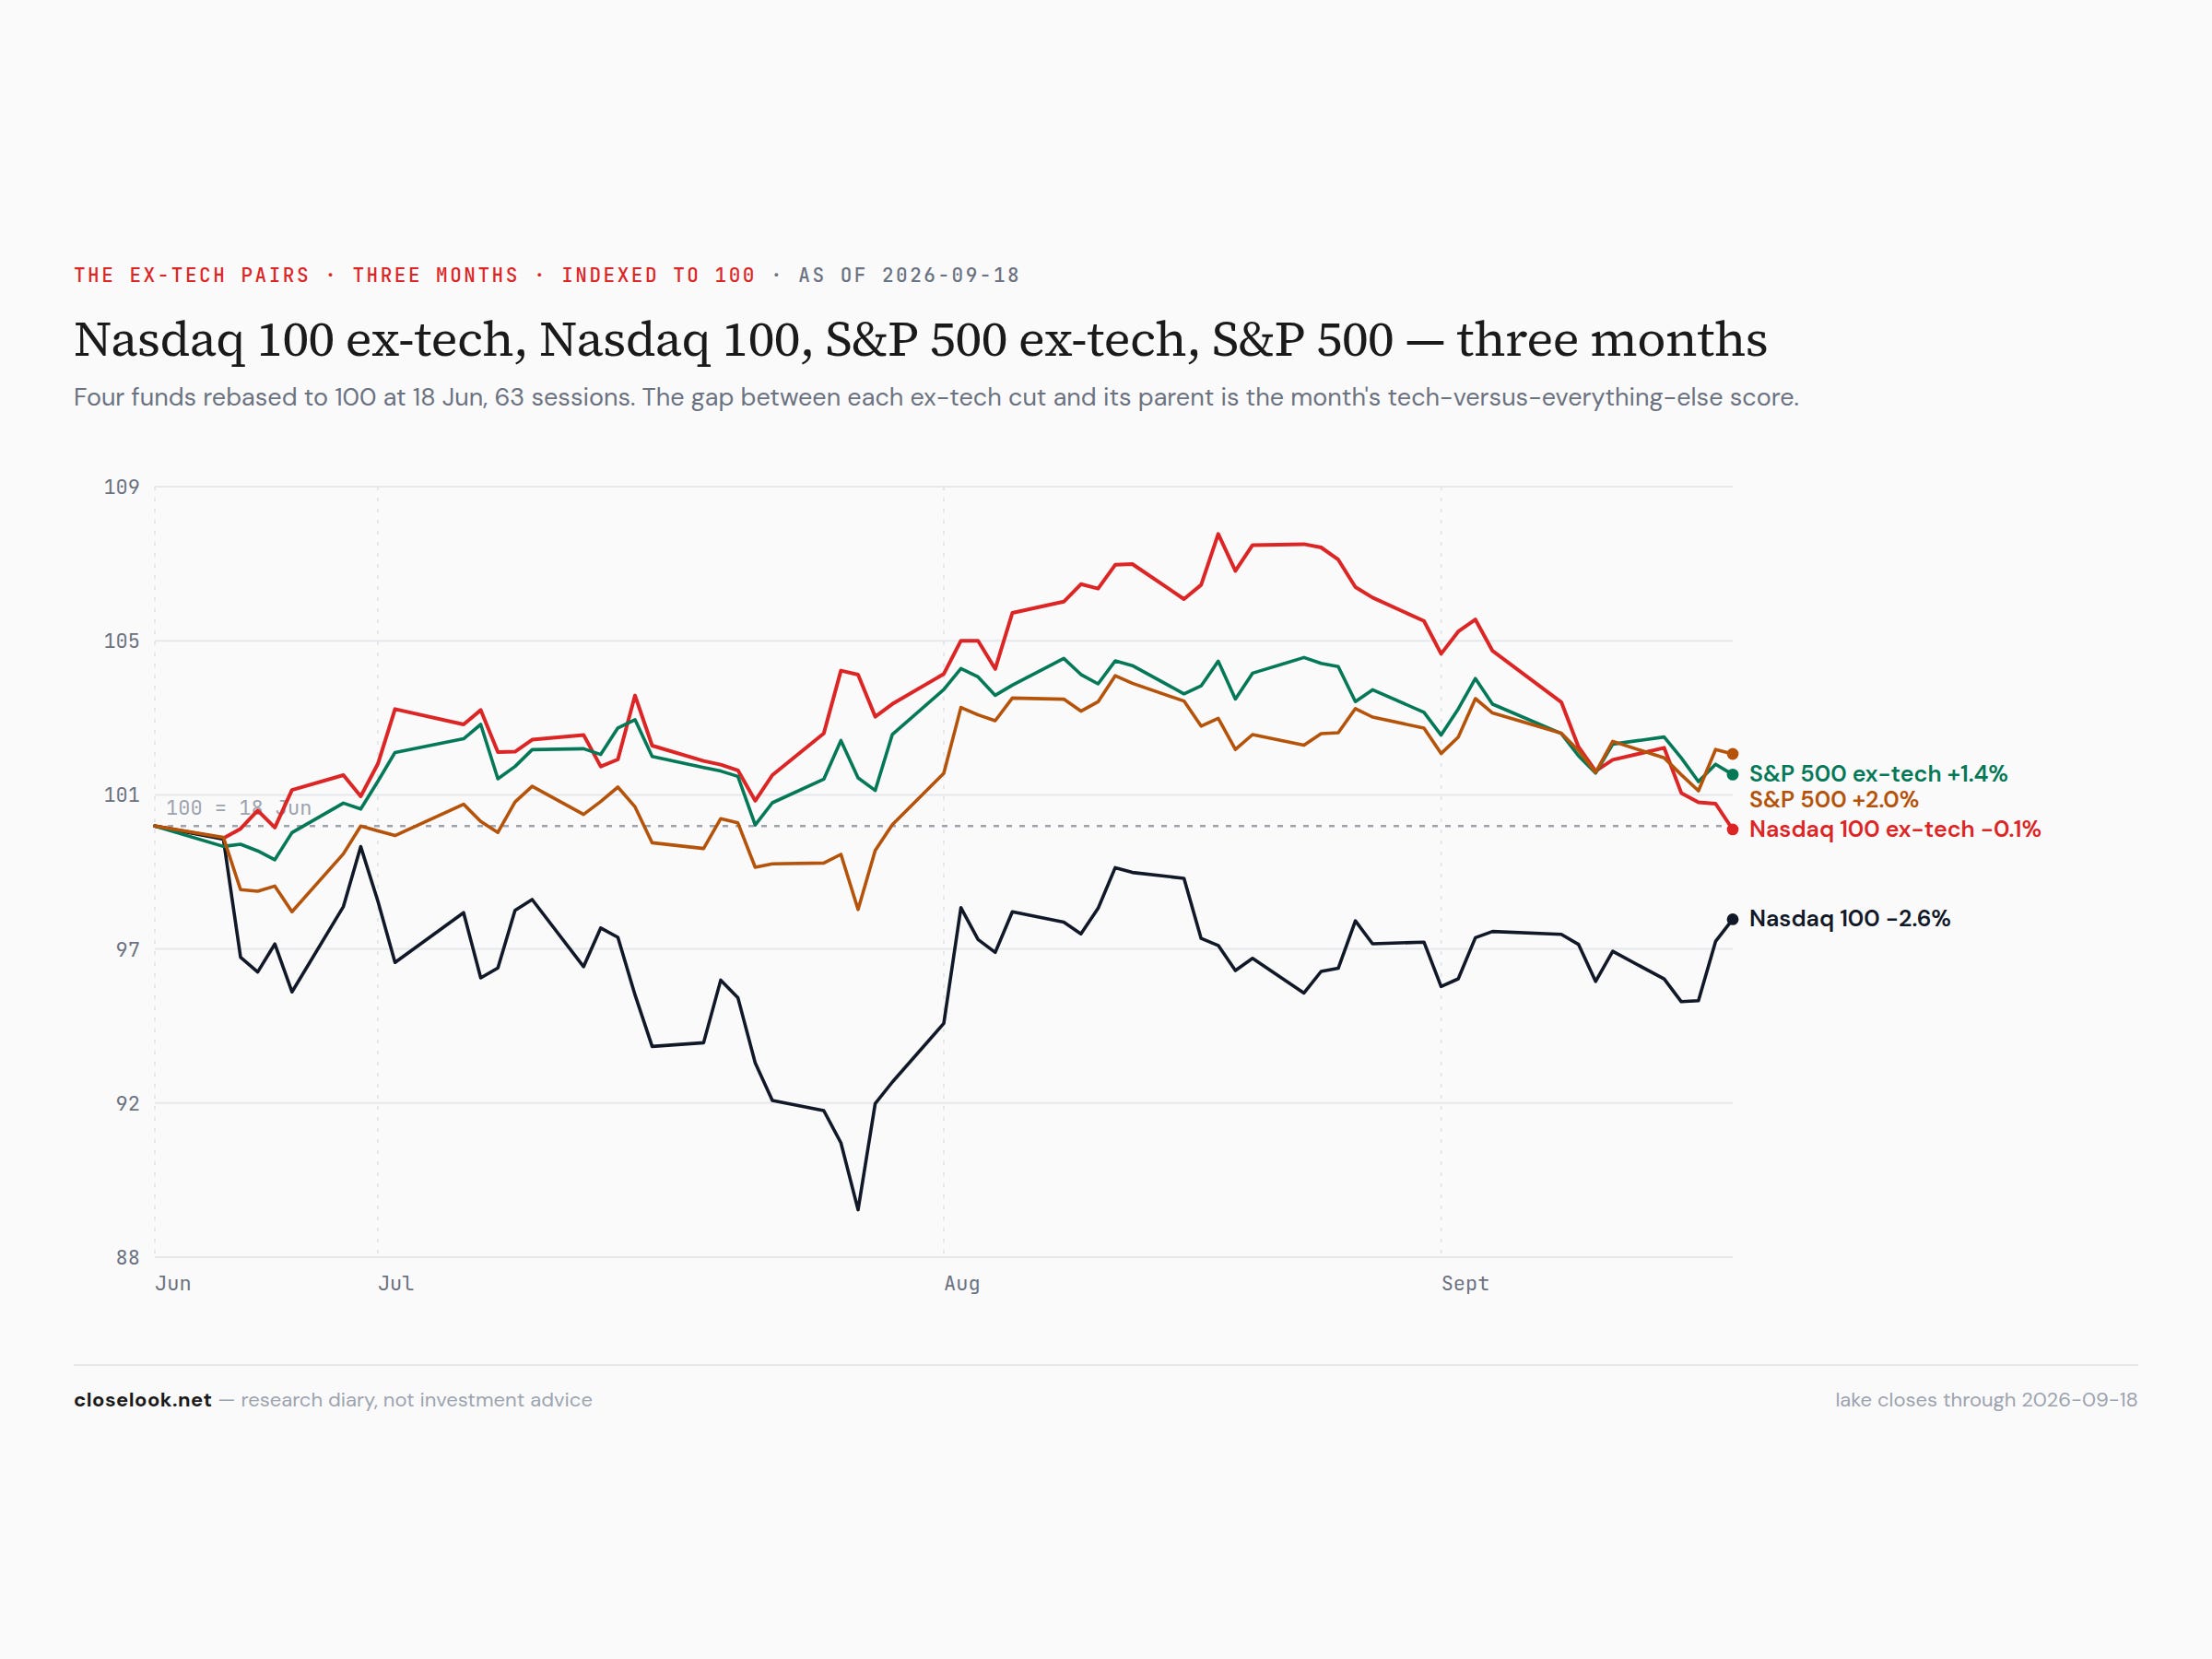
The axis, four weeks on — the count reached its stated limit. Three weeks ago this letter set a rule: tech beats its ex-tech cuts for four consecutive weeks, and the axis has to be called reversed. This week: the Nasdaq 100 ex-technology −1.90% against the Nasdaq 100’s +0.92%; the S&P ex-tech −0.82% against the S&P’s −0.34%; the S&P ex-Magnificent-7 −0.86%. Four weeks. The year-to-date order, restated: the Nasdaq 100 without its technology stocks at 96.73, −2.66% on 2026, against +17.44% for the Nasdaq 100; the S&P without tech +5.22% against +11.70%; the equal-weight tech sleeve +35.95%. The ex-tech cut lost 2.6% on a week its parent gained a percent — the widest single-week gap of the four — and it is now seven percent under the three-year high it printed on August 19. Read that plainly, as last week: every point the Nasdaq 100 has made this year has come from its technology stocks, and the other half of the index is having a worse year than the bond market’s belly. The limit is reached. The axis this letter promoted to “everything-else” in August is, by its own rule, reversed — and the letter says so in section 2 rather than pretending the fourth week did not print.
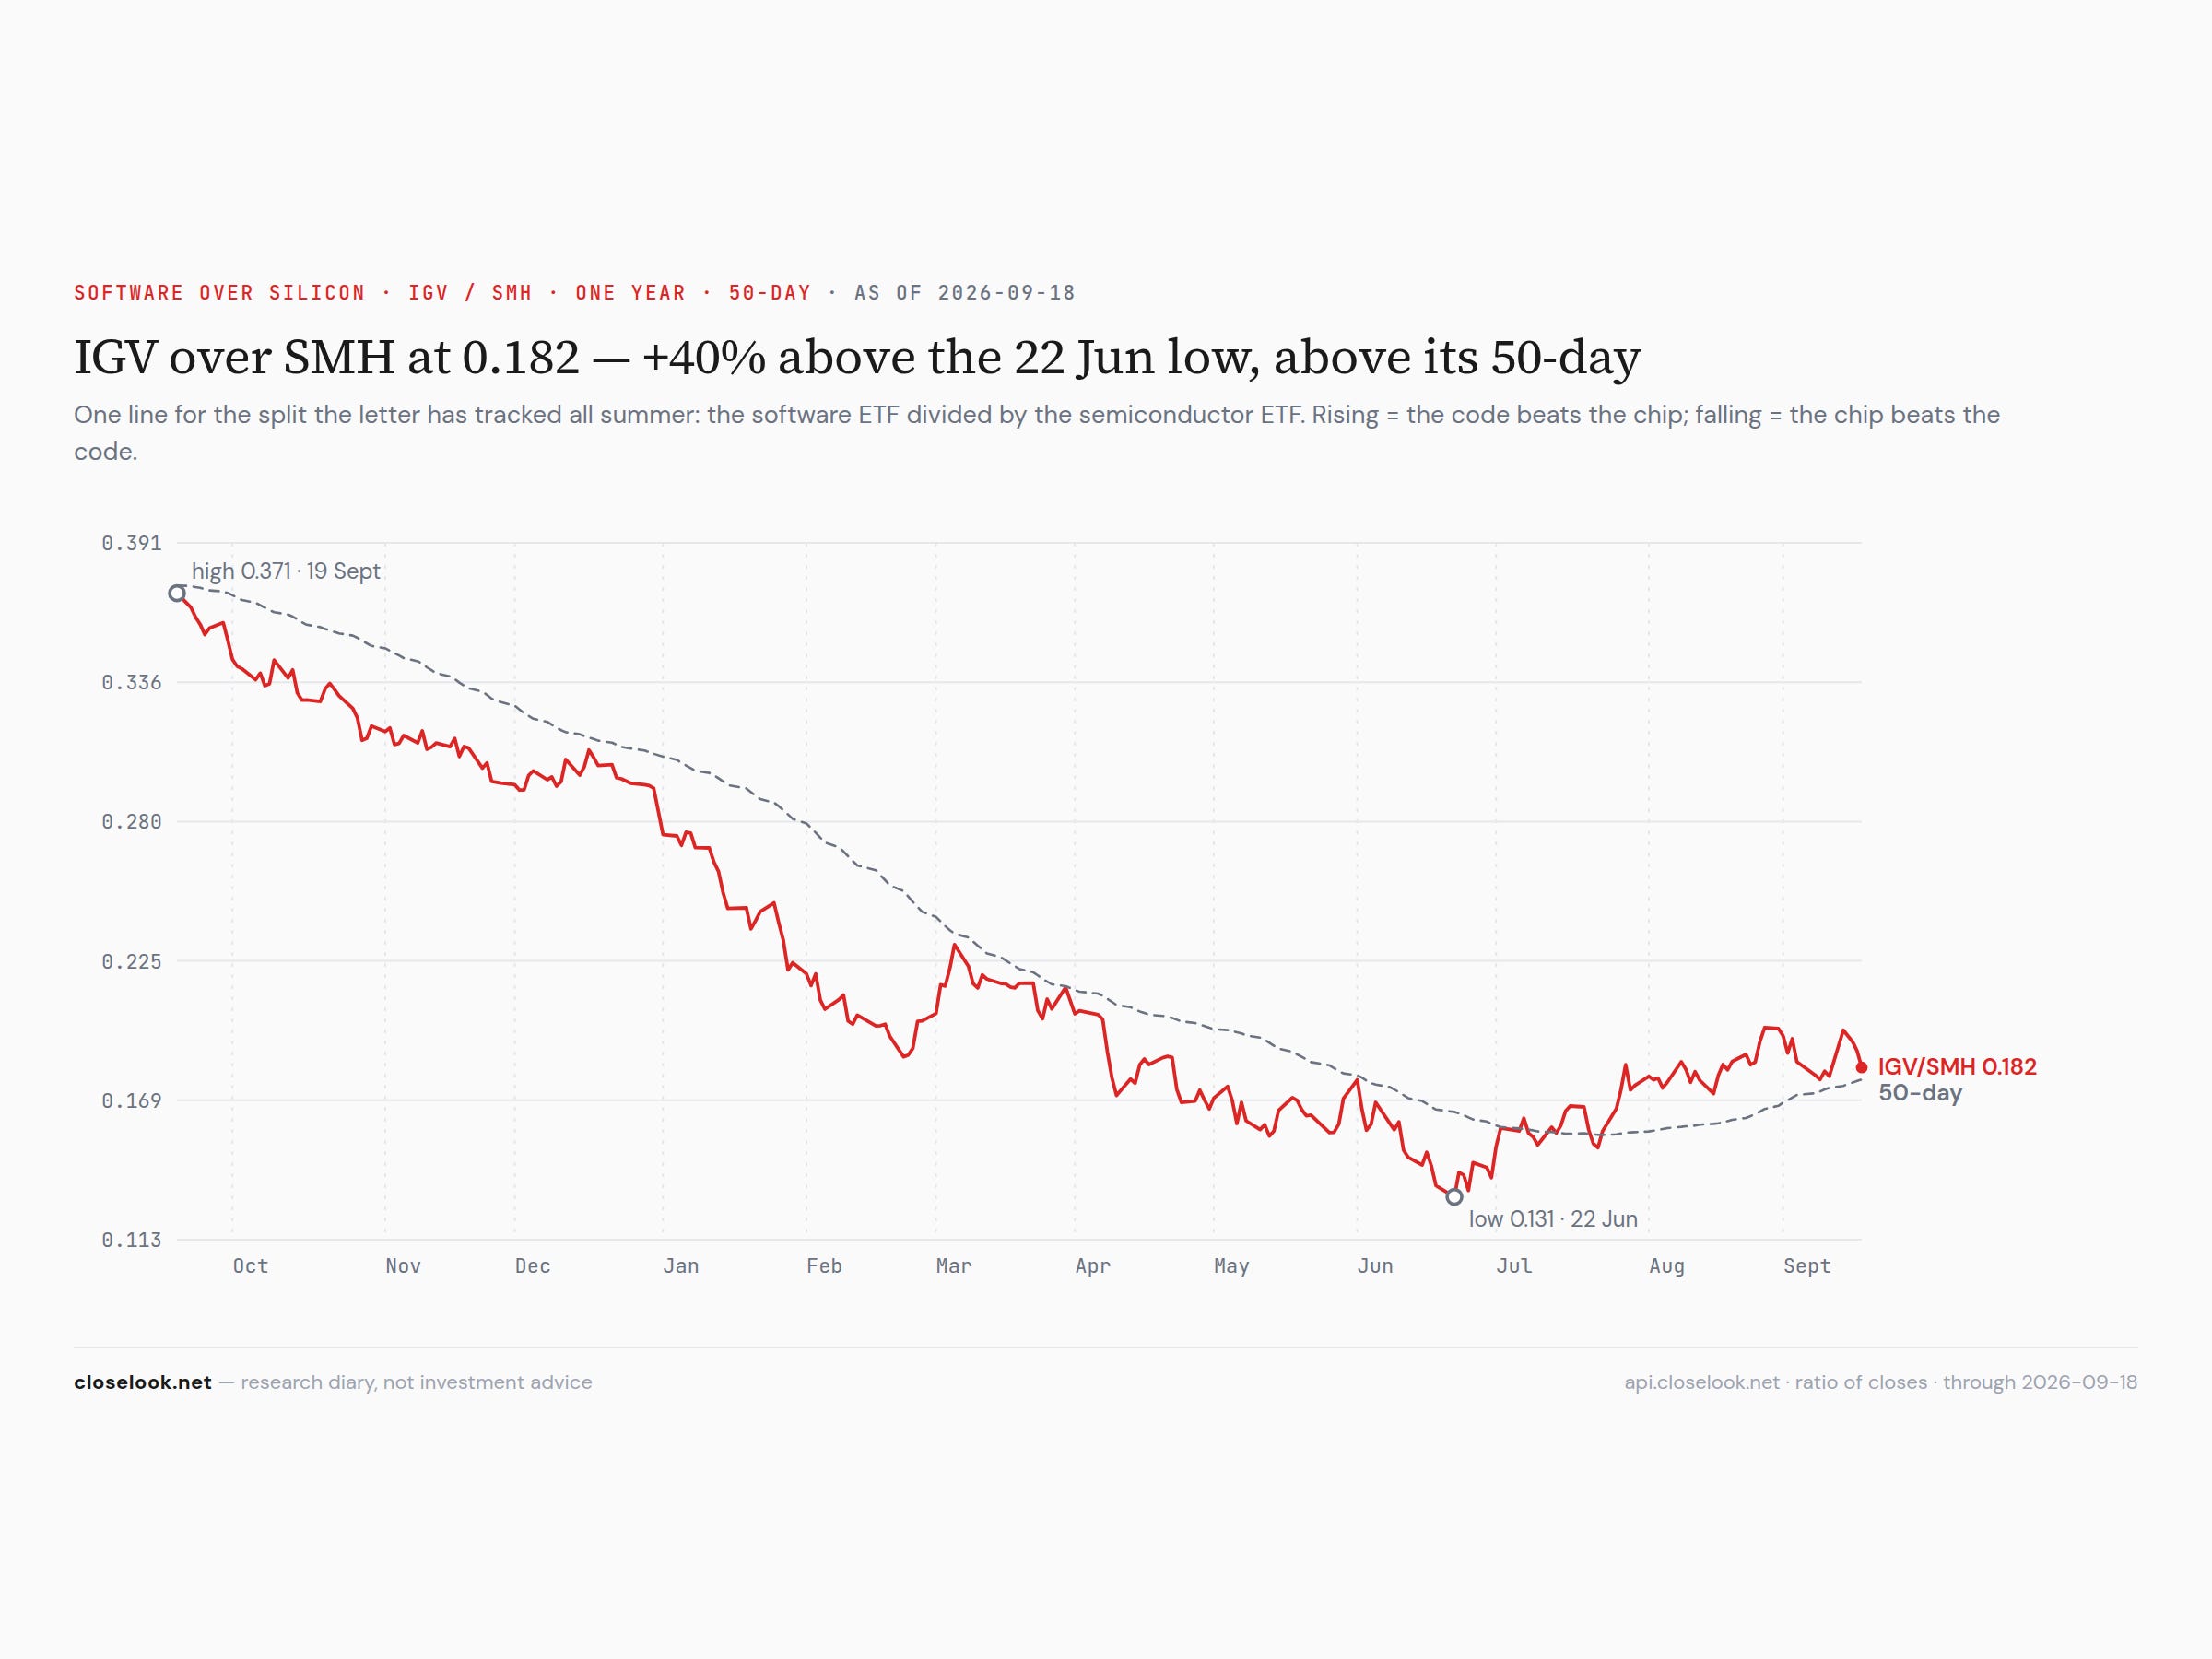
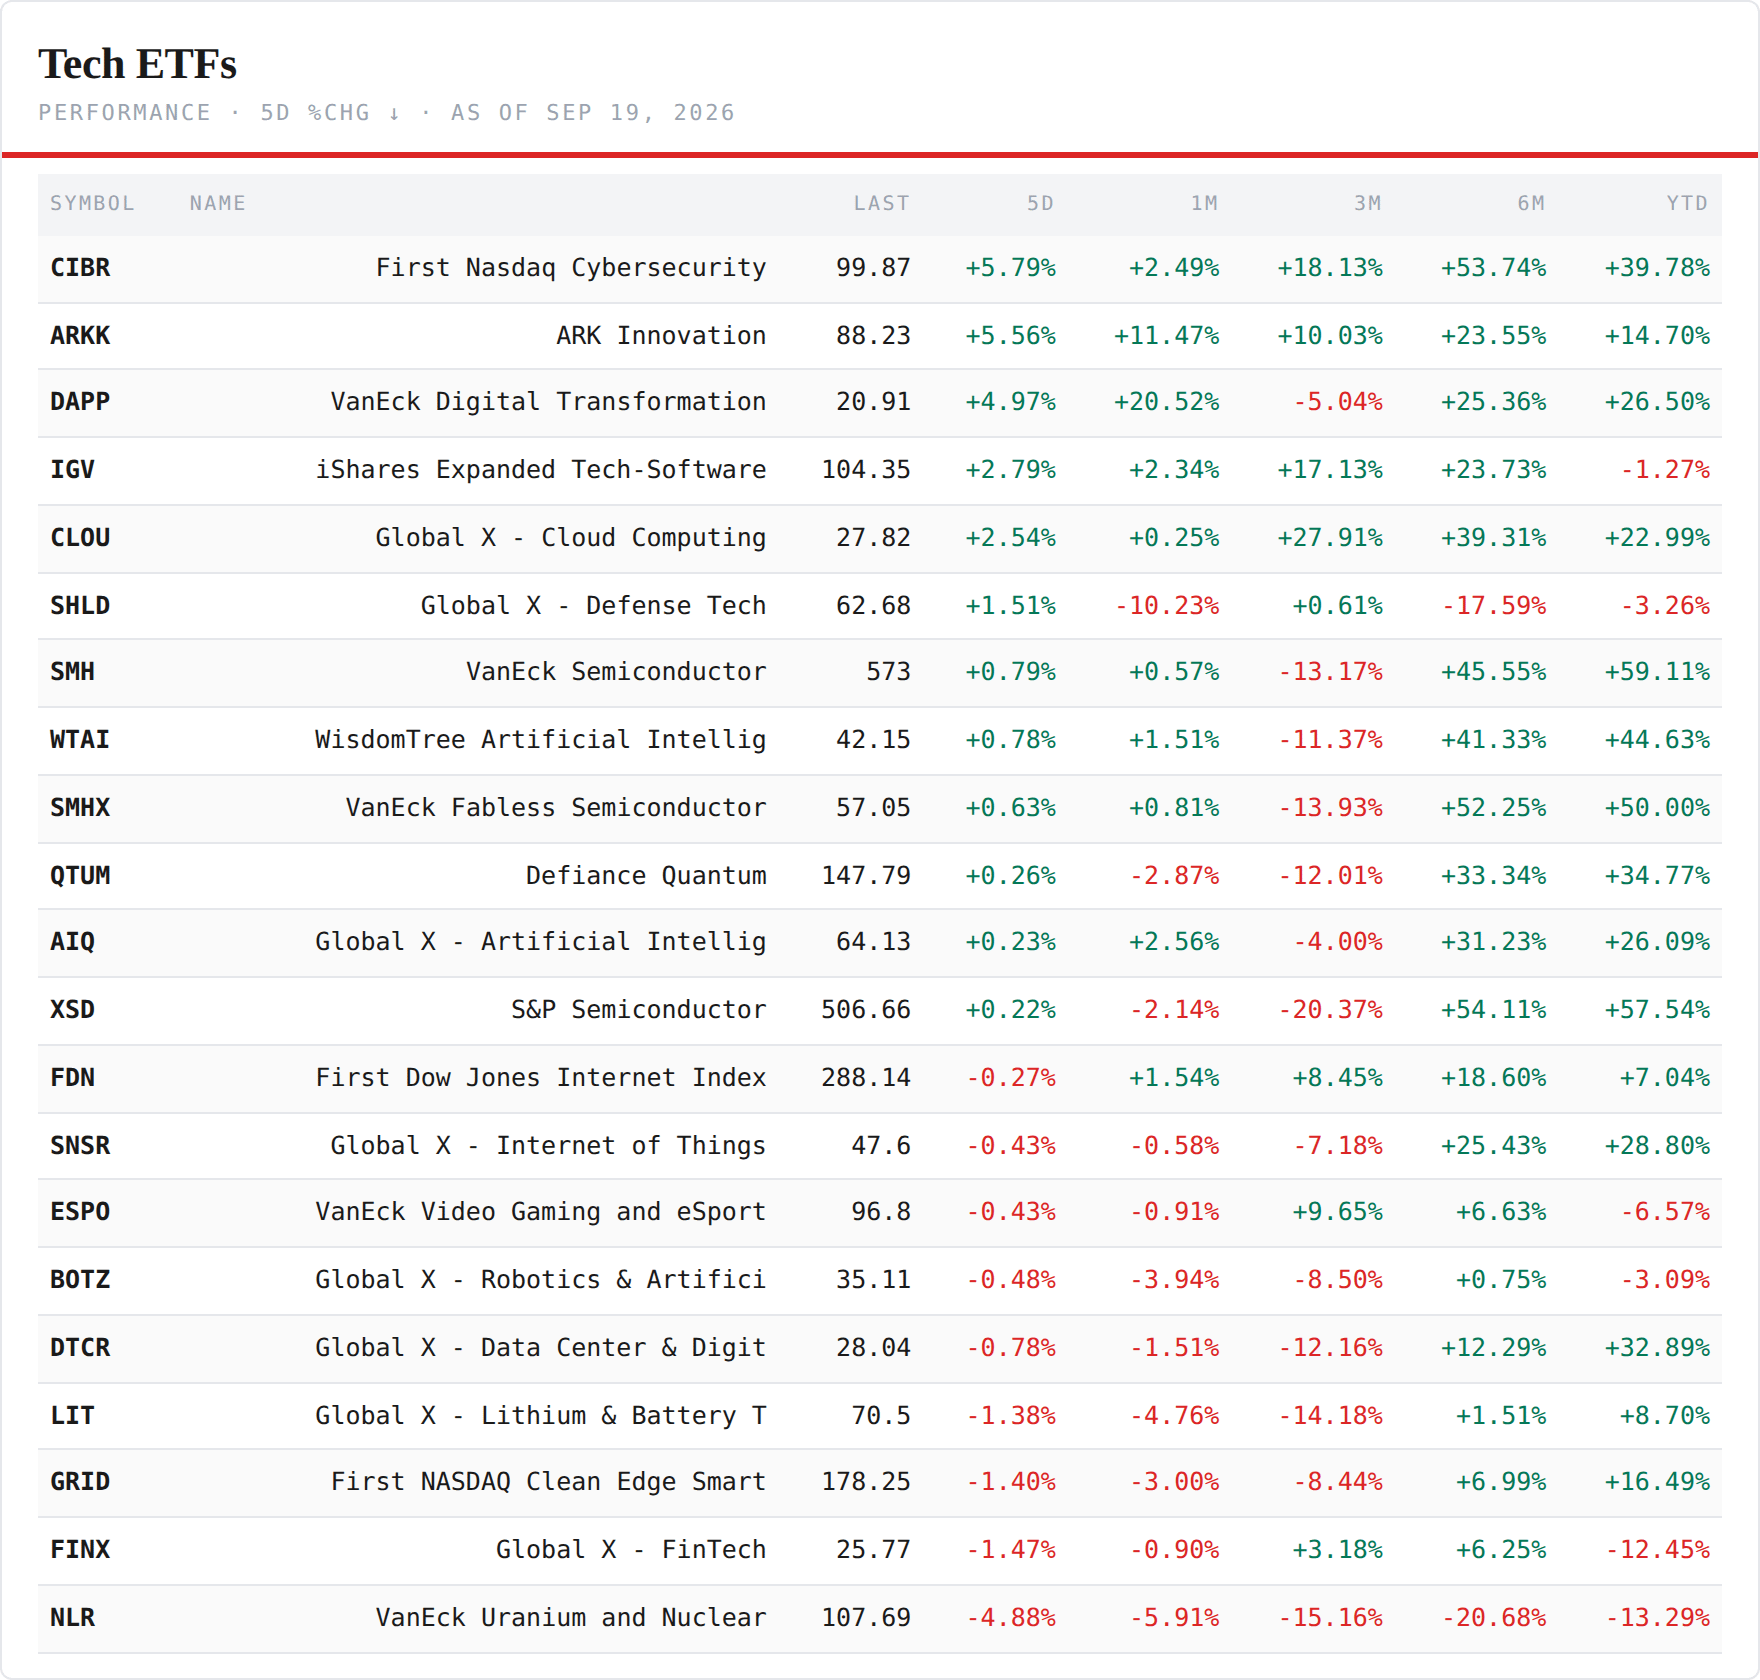
Because the money went where the sort sent it — into the code on Monday, into the chip on Friday, and the week’s total hides the order. Twelve green of twenty-one on the tech board, and the top is the layer above the chip: cybersecurity +5.79%, ARK +5.56%, the digital-asset fund +4.97% (the coin’s week), software +2.79% — after three consecutive weeks as one of the board’s worst lines — cloud +2.54%, defense tech +1.51%. Then the chips: SOXX +1.14%, SMH +0.79%, the AI basket +0.78%, the fabless vehicle +0.63%, the equal-weight semis +0.22%. The red nine: uranium −4.88% — sold with the utilities on the five-percent ten-year — fintech −1.47%, the grid fund −1.40%, lithium −1.38%, data centers −0.78%. On the week software beat the semis by two points; inside the week the order was the opposite. Monday: software +5.04% to 106.64, its best day of the year, and SMH −4.75%. Friday: SMH +2.21% and software −1.35%. Software made its week in one session and gave a piece back in each of the next four; the chips lost their week in one session and made it back in two. IGV’s path: 106.64 — above the 105.69 year-end line for exactly one close — 105.55, 104.96, 105.78, 104.35: still red on 2026, by 1.27%, from 3.95%. The pair board dates it: the software-to-semis ratio rose 1.99% on the week, to 39.5% above its June 22 low from 37% — and the pair monitor reads the spread at 0.97 standard deviations and calls it breaking. The sort that ran through the chip trade twice in five days, in opposite directions, is the week’s equity event; section 2 names it.
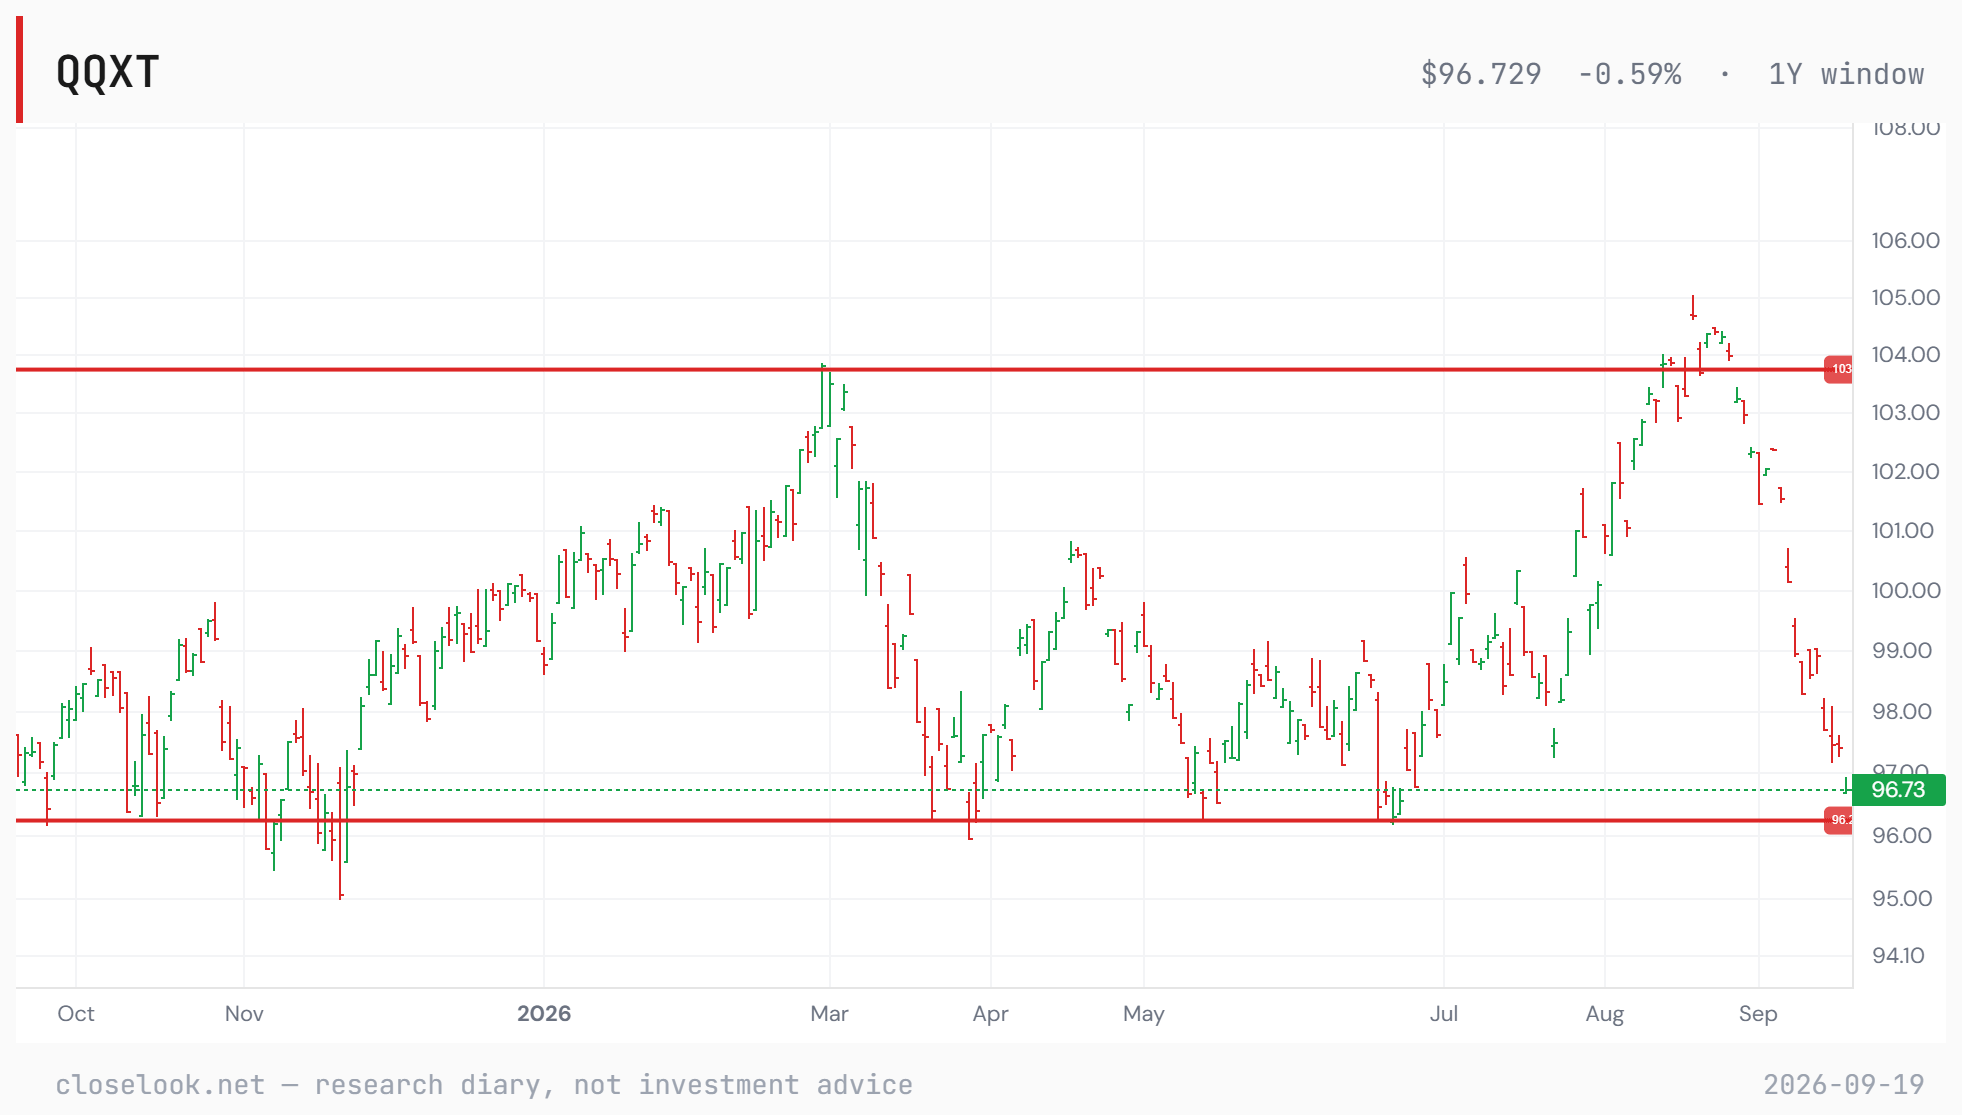
The same story on four charts — the index, its equal-weight tech sleeve, its ex-tech cut, and the technology sector. The house grid puts the four side by side on one year: the Nasdaq 100 at 721.45, back above the short descending line from the mid-August high that had capped every session for a month — Friday’s close is the first above it; the equal-weight tech sleeve at 312.97, +1.44%, back over the 308 it left last week and still under its descending line from the June high; the ex-tech cut at 96.73, at the floor of the range it has held for a year — 96.2 is the line on the editor’s chart, 103.7 the ceiling it touched in March and August, and Friday closed half a dollar above the floor; and XLK at 189.60, +1.03%, on its rising line from the April low and the only one of the four making a higher weekly close. Four charts, one reading, sharper than last week’s: the technology sector is the trend, the index just took a line, and everything else in the index is at the bottom of a year of nothing.
Underneath it, the participation statistic held a fourth week, and the basket did it again: the Magnificent-7 basket +0.82% to 70.46 — a second weekly close through the 69.5 shelf, and Thursday’s 70.78 the highest close since the May 14 record of 70.94 — against equal-weight’s −1.20%. Composition: Alphabet +3.26%, Meta +2.73%, Nvidia +1.82%, Apple +1.16%; Tesla −0.32%, Microsoft −0.37%, Amazon −1.20%. Two weeks ago the re-concentration was into the two chip expressions; last week into the two consumer-AI names; this week into the two names that were on the buying side of Monday’s sort — the buyers of compute, up two to three percent on the day the sellers of compute fell five — plus the supplier, which rose every session from Tuesday. Four weeks, four different carriers, one statistic: cap-weight over equal-weight, every week. The basket is now 0.7% from its record. Last week this letter said it was being bought because it is the basket; this week it was bought because three of its seven were on the right side of the sort, and that is a reason the basket can lose in a session.

Inside tech — twelve green of twenty-one, and the sort inside the week is the reading. Named above; the board is below. Two weeks ago silicon led with fifteen red beneath it; last week the inversion held and narrowed; this week the board reads green for the code and green for the chips at once, and the week’s total is the sum of two opposite sessions. The three-week software-over-semis trend this letter promoted to “axis” a month ago, reversed for two weeks, is back by two points on the week — and it was made on Monday, on a governance story, and it was given back a piece per session after. The chips’ week was made on Thursday and Friday, on a rates story and an expiry. Which of the two sorts is the trend is the question the letter carries into Monday; the board says both, which is what a board says on an options-expiry week.
2 · The State
The rule split — and the split is the information: the market pays the number, and this week it also sold the seller of compute. Two windows closed Tuesday at the bell, on the two cards this letter set up a week ago as the rule’s exhibits. Adobe: paid, +3.9% — from a 248.83 entry through the 256.29 paid line, the card’s second payment in eleven prints and the first since June 2024, on an eleventh straight double beat. Oracle: sold, −8.3% — from 152.94 through the 148.35 sold line, a clean double beat with a $664 billion backlog, bought after hours and sold for three sessions as the market repriced the sellers of compute. Sort the two by what the number did and the rule holds on one and fails on the other: Adobe’s raised year and the guide a shade under were paid; Oracle’s faultless quarter was sold. Sort them by layer and the split explains itself: Adobe sells software that uses compute and was bought on Monday’s sort with the rest of the code; Oracle sells compute to the labs the pacing letter was written for and was sold with the physical layer. The rule this letter wrote three weeks ago — pay what accelerates, charge what merely met — scored five for five a week ago and one for two this week. What broke it was not a number. It was the weekend’s letter, which told the market which layer’s demand had a question mark, and Oracle’s number arrived on the wrong side of it. By Friday both cards were back on the wrong side of their own lines — Oracle 147.61, under 148.35 after 150.59 on Thursday; Adobe 248.92, under 256.29. Both print next on December 9.
The hike, taken seriously — because the tape’s reaction is the week’s real information, again. No inflation print this week; the print was the decision. Wednesday, 14:00 in Washington: the Fed raised rates for the first time since 2023, “in search of a timelier drop in inflation,” and signalled one more before year-end. The curve on the day: the five-year 4.86%, the ten-year closed 5.006% — the first close above five percent of this cycle, after Monday’s 5.008% intraday print — and the thirty-year was bought to 5.35%: a bear flattener, the belly leading, the shape the Knowledge Corner unpacked a week ago. Thursday the reverse: yields fell six basis points across the curve, the Journal wrote that the Fed had regained the market’s trust, the rate-options desks said the market could absorb higher yields, and the equity market retook every line. Friday the belly gave a piece of it back: the ten-year 4.998%, the five-year 4.856%. On the week: the five-year +6.5 basis points, the ten-year +2, the thirty-year −2 — the curve flatter by eight and a half basis points from the belly, which is the hike being priced as delivered and the next one not yet. Yardeni’s cut on Tuesday — the year-end S&P target to 7,900 from 8,400, the same $425 of 2027 earnings on a multiple of 18.6 instead of 19.8, bearish odds to 30% from 20% — was the sell-side writing the discount rate down on the day it went through five. And the equity market, over the five sessions, fell a third of a percent. That is not a market that has stopped fearing the Fed; it is a market that had priced the hike, sold the physical layer on Monday for a different reason, and found on Wednesday no new information to sell. Three weeks ago this letter set the base case — about five percent of September consolidation, the trigger a hot number; two weeks ago the trigger printed and the index bought it; this week the decision landed and the index bought that too, on Thursday. The base case is three fifths delivered on the world index, two fifths on this one, and the month has two weeks left. A market that sells before the decision and buys on it is a market that is done pricing the decision. The next one is signalled, not scheduled — and that is a different kind of wait.
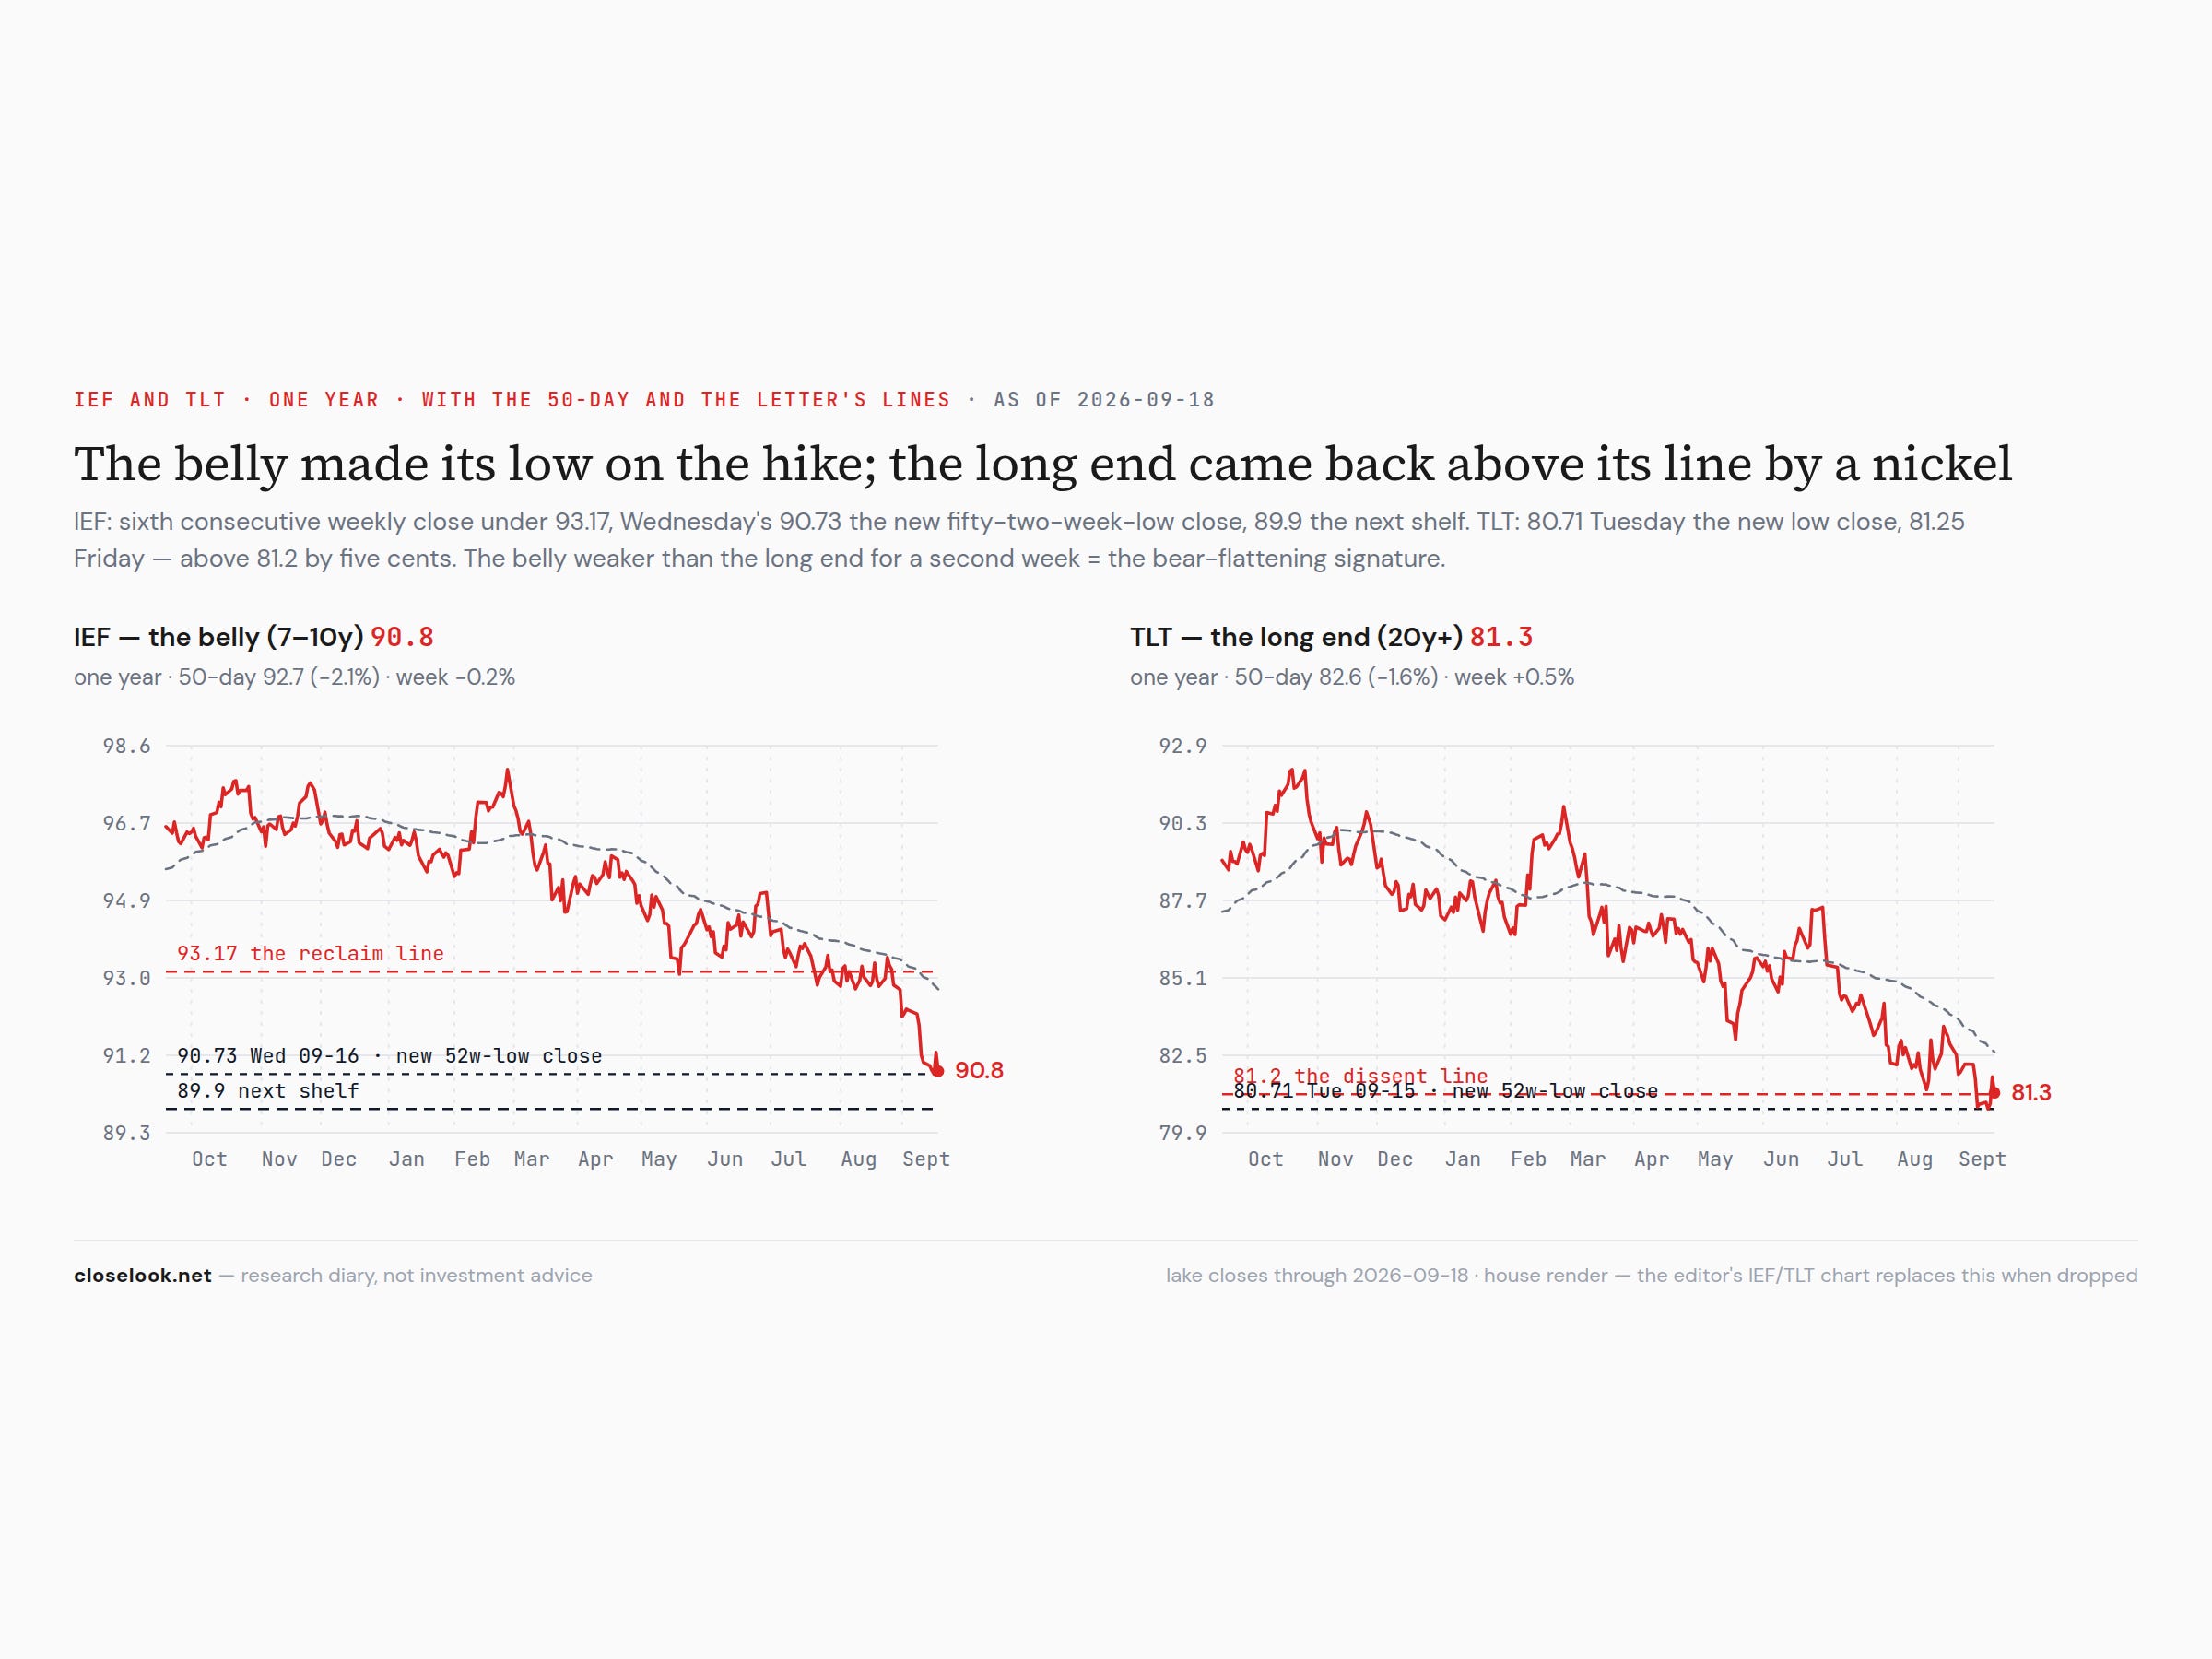
The veto, scored at the close — the sixth failure, on the hike, and the long end back by a nickel. Five weeks running the belly of the curve refused to sign the equity resolution; this week it refused a sixth time and did it on the decision. IEF: 90.93, 90.82, 90.73 — Wednesday’s close a new fifty-two-week low, on the hike — 91.25 Thursday, the first midweek push in three weeks, and 90.80 Friday, the push given back. A sixth consecutive weekly close under the 93.17 line; the fund 2.1% under its own 50-day and 4.2% under its 200-day. The pattern has now been “trying and failing,” “not trying,” “falling,” and this week “bouncing and failing”: the belly rallied on Thursday’s trust and sold on Friday’s arithmetic. TLT: 80.71 on Tuesday, a new fifty-two-week-low close; 81.78 Thursday; 81.25 Friday — above the 81.2 this letter said the long bond had to reclaim to go back to being a dissent, by five cents. Two weeks, two five-cent margins, one each way. Saturday’s letter carries the sovereign board: the ten-year equal-weight of the nine sovereigns 4.24%, +3 basis points on the week, and the pressure index down to 0.07 from 0.85 — the levels as high as they were, the rate of change gone, every G7 curve flattened into its central bank. The bond market has now declined to sign the equity resolution six weeks running. This week it signed the hike instead: a belly low on the decision, a long end that was bought on it, a curve flatter by the belly. The veto is engaged on the belly and back to a dissent on the long end — by a nickel.
The two Treasury charts, read together — the belly is still the weaker end, and it made its low on the event. The house chart of the two funds says what the ladder says, in price: IEF’s uptrend from the October 2023 low is over, the new downtrend from the spring high is intact, the 93.17 line is resistance and Wednesday’s 90.73 is the new reference low — 0.9% above the 89.9 shelf this letter named a week ago as the next support. TLT has been down longer and is trading at its support again: 80.71 on Tuesday was the fifty-two-week closing low, Friday’s 81.25 is fifty-four cents above it, and the descending line from the September 2024 high is still above the price. In yield terms the same picture: the five-year +6.5 on the week, the ten-year +2, the thirty-year −2 — the belly weaker than the long end for a second week, which is the bear-flattening signature that hurts long-duration equities most, because their discount rate lives in the belly. Two charts, one condition, one week older: the belly’s support is close and now tested once, the long end’s is being tested weekly, and the next test has no date.
The macro print was a decision, and the decision’s geography ran one way — the dollar rose on both hikes. Wednesday’s hike sold the world index to the low close of its move and bought the dollar to 100.25; Friday’s Tokyo hike sent the yen the other way, through 157, and the dollar index closed the week at 100.22, +1.1%. Saturday’s letter owns the geography — the yen that fell through its own hike, the corridor’s dollar wrappers losing their currency tailwind, Korea −3.9% in dollars on a flat week in won — and the tape’s version is one sentence: the hike was bought in the currency of the hiker and in the assets priced on that currency’s scarcity, and it was sold in the assets priced on the discount rate. The rate-hike-era pattern this letter identified on Warsh’s keynote — balance sheets bid, capex charged, hard assets sold — printed this week with one leg inverted: the balance sheets were bid (Alphabet +3.3%, Meta +2.7%, Apple +1.2%; the hyperscaler cohort +1.05%), the capex layer was charged and then bought back (Rubin −5.3% Monday, −0.4% on the week), and the hard assets were bought — the coin +5.9% on Friday, gold +0.6% on the week. The pattern’s third leg is the one that failed, and it failed on the second hike, not the first. Two weeks ago the Fed meeting was a hike question; last week a hike expectation; this week a hike delivered with another signalled, and a market that has consolidated sideways since early June arrived at the delivery with its ex-tech half negative on the year, its chips back above their average on an expiry, and its long bond five cents on the right side of its line. Sideways markets do not end on quiet weeks. This one had the catalyst it was waiting for, made its low on it, and bought it — which is the constructive resolution’s first requirement, met. What it did not do is leave the range. The house reads that as a bull that held its test, not as a bull that failed it: the lines were retaken on the decision, not before it, and the funding side of the tape — the yen — went the bull’s way on Tokyo’s hike. Thursday’s Pulse put the mechanism in a sentence the desk stands behind: moderately but durably higher US rates may have just saved the bull market in US stocks, because they keep the yen weak, the carry trade in place, and the one force that has ended two bull markets from the side — August 2024, 2007–08 — off the table for as long as they hold. This week that insurance paid its first premium.
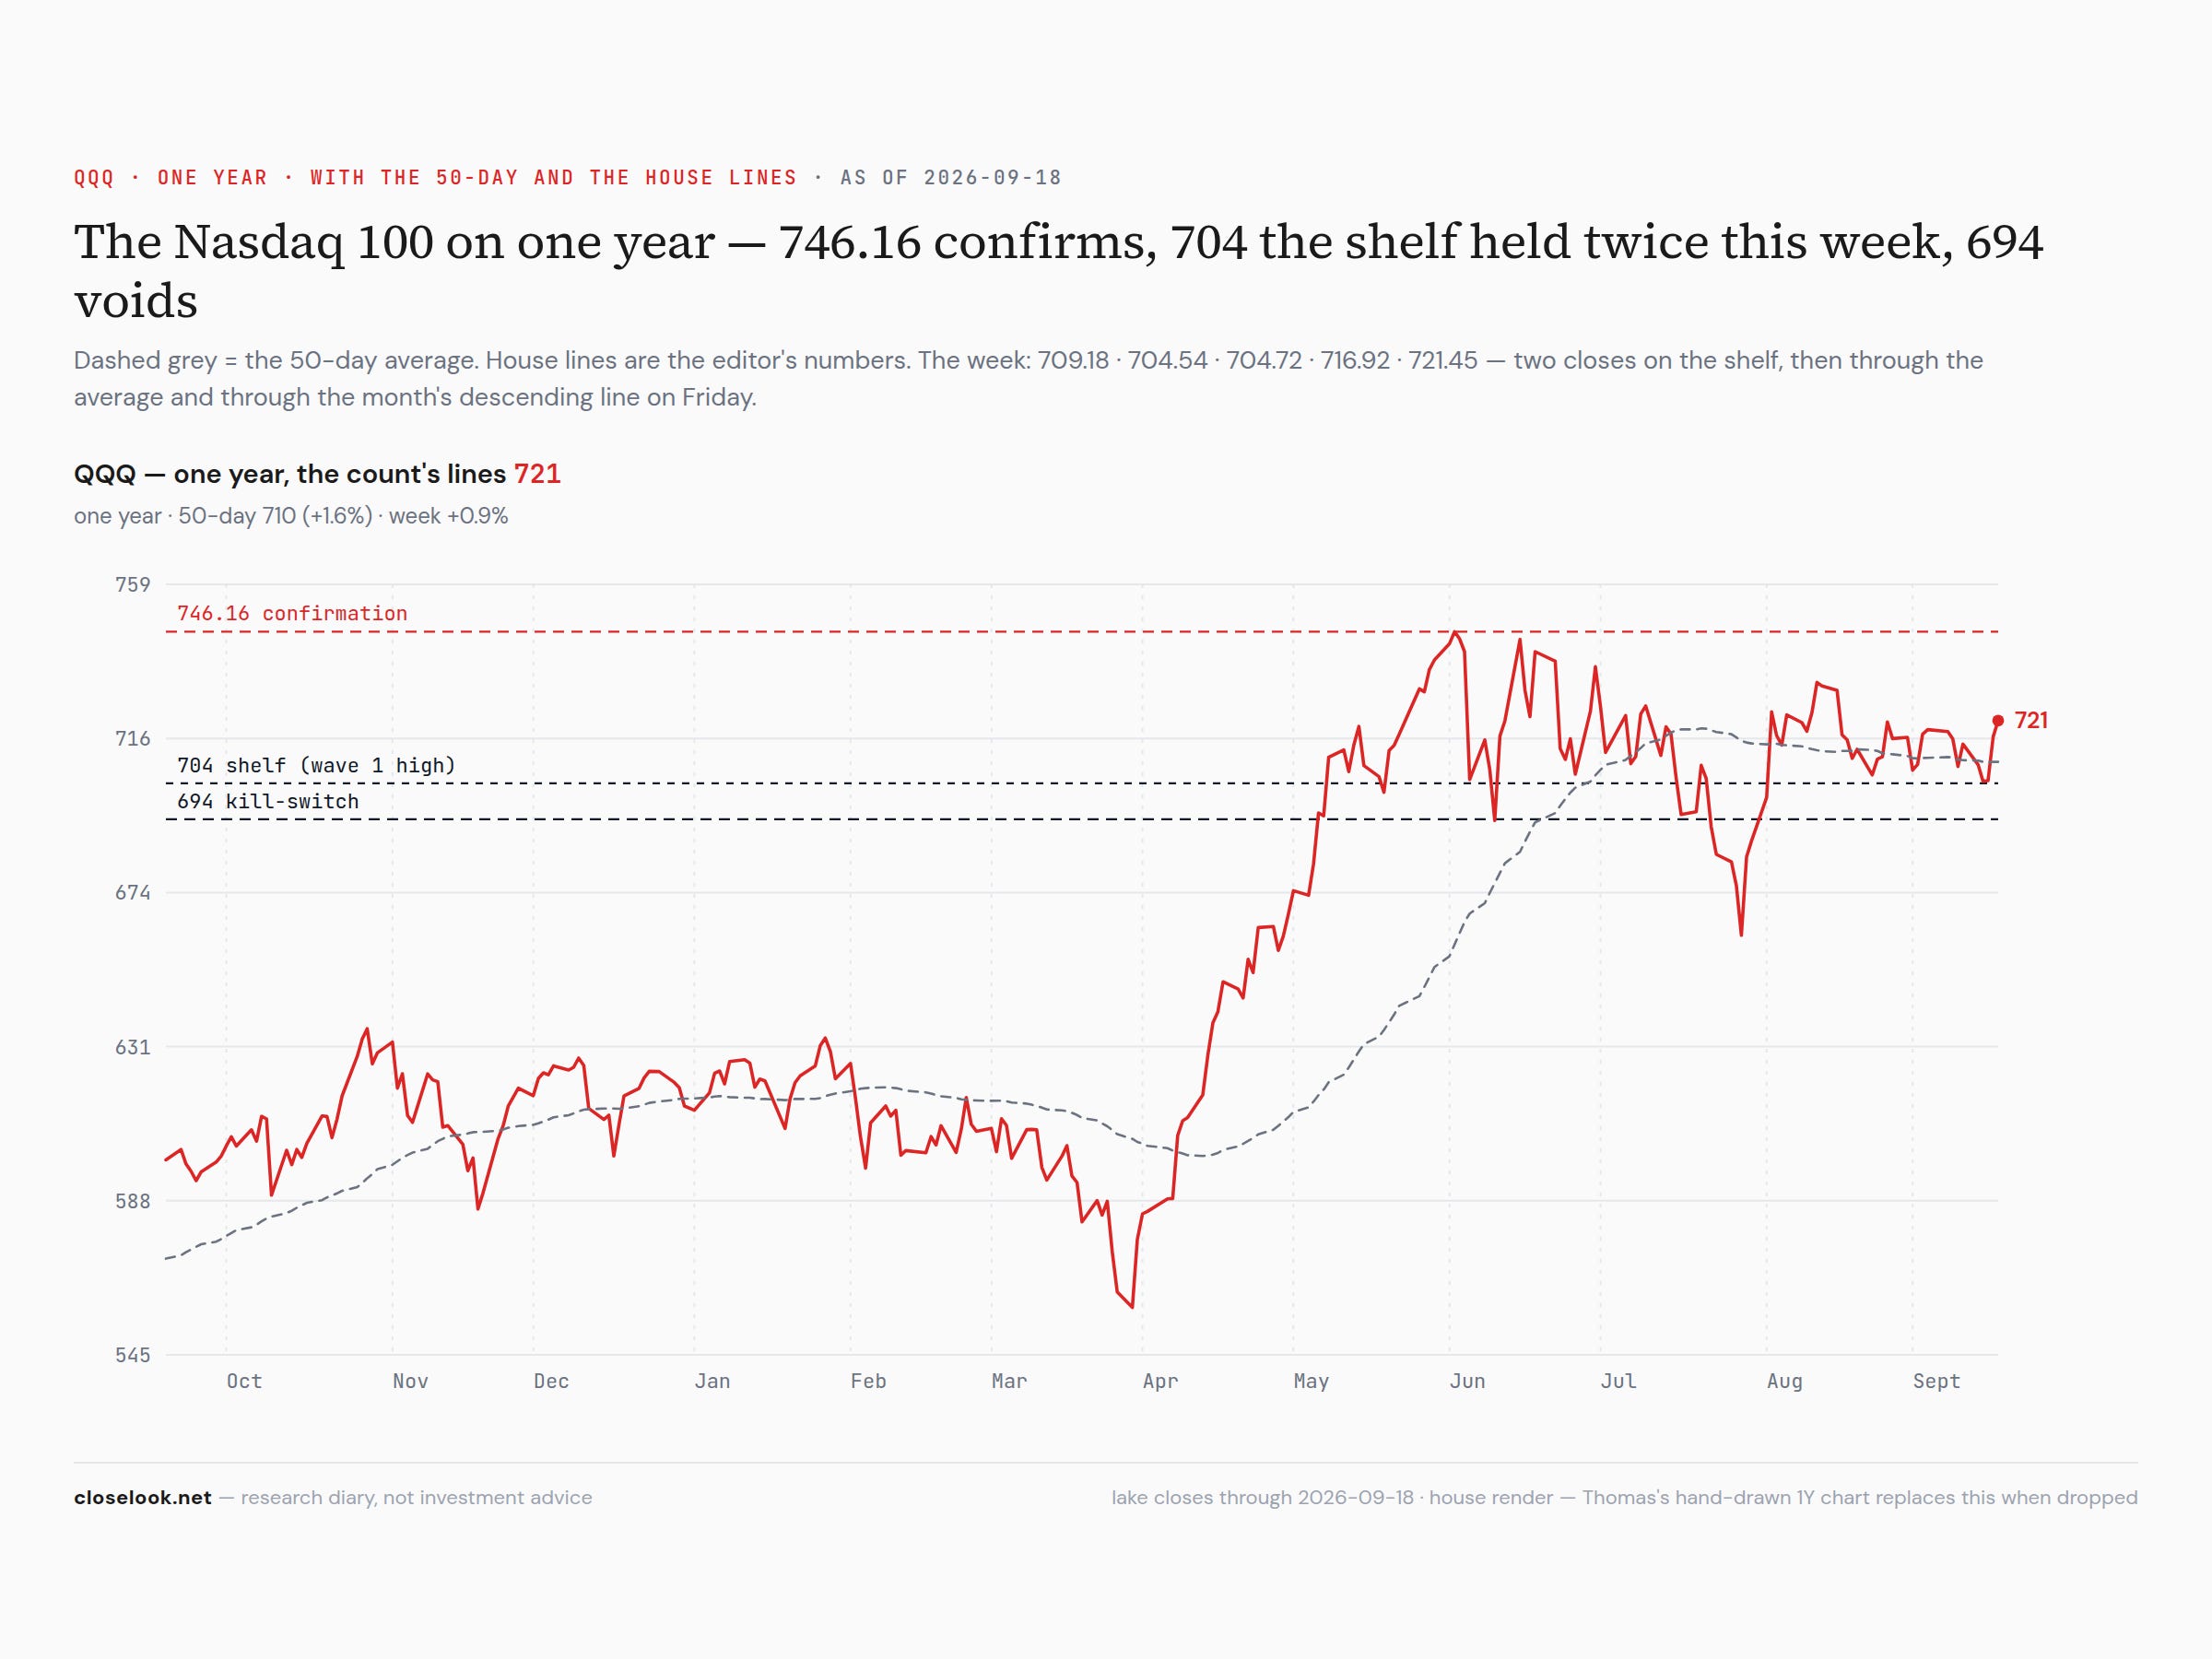
The count — above the average all week but two closes on the shelf, and Friday took the line. The Nasdaq 100 closed 721.45 against a 50-day at 709.95 — 1.6% above. The week inside: 709.18 Monday, on the sort, a session under the average that closed a fraction under it; 704.54 Tuesday and 704.72 Wednesday — two closes on the 704 shelf, the wave (1) high, to the cent; 716.92 Thursday; 721.45 Friday. The week’s low print was 700.00. The map is unchanged: 1-2 off the April low, wave 3 ongoing, 746.16 the confirmation (3.4% above), 694 the kill-switch (3.8% below) — and one line moved: the short descending line from the mid-August high, which last week’s 718.96 close sat exactly on and which had capped every session for a month, was closed above on Friday for the first time. A shelf held twice to the cent and a month-old line taken on an expiry Friday are the two facts the count has to carry into Monday, and they point in opposite directions: the shelf is a floor that has now been used, and the line is a ceiling that was taken on the one session of the month when positions are closed rather than opened. Saturday’s letter carries the five-year count on the world ex-US, which lost its second line this week and sits on its own rising trendline; the two counts agree on the structure — a third wave pausing — and disagreed on the week’s direction, which is the corridor’s dollar problem and not the count’s.
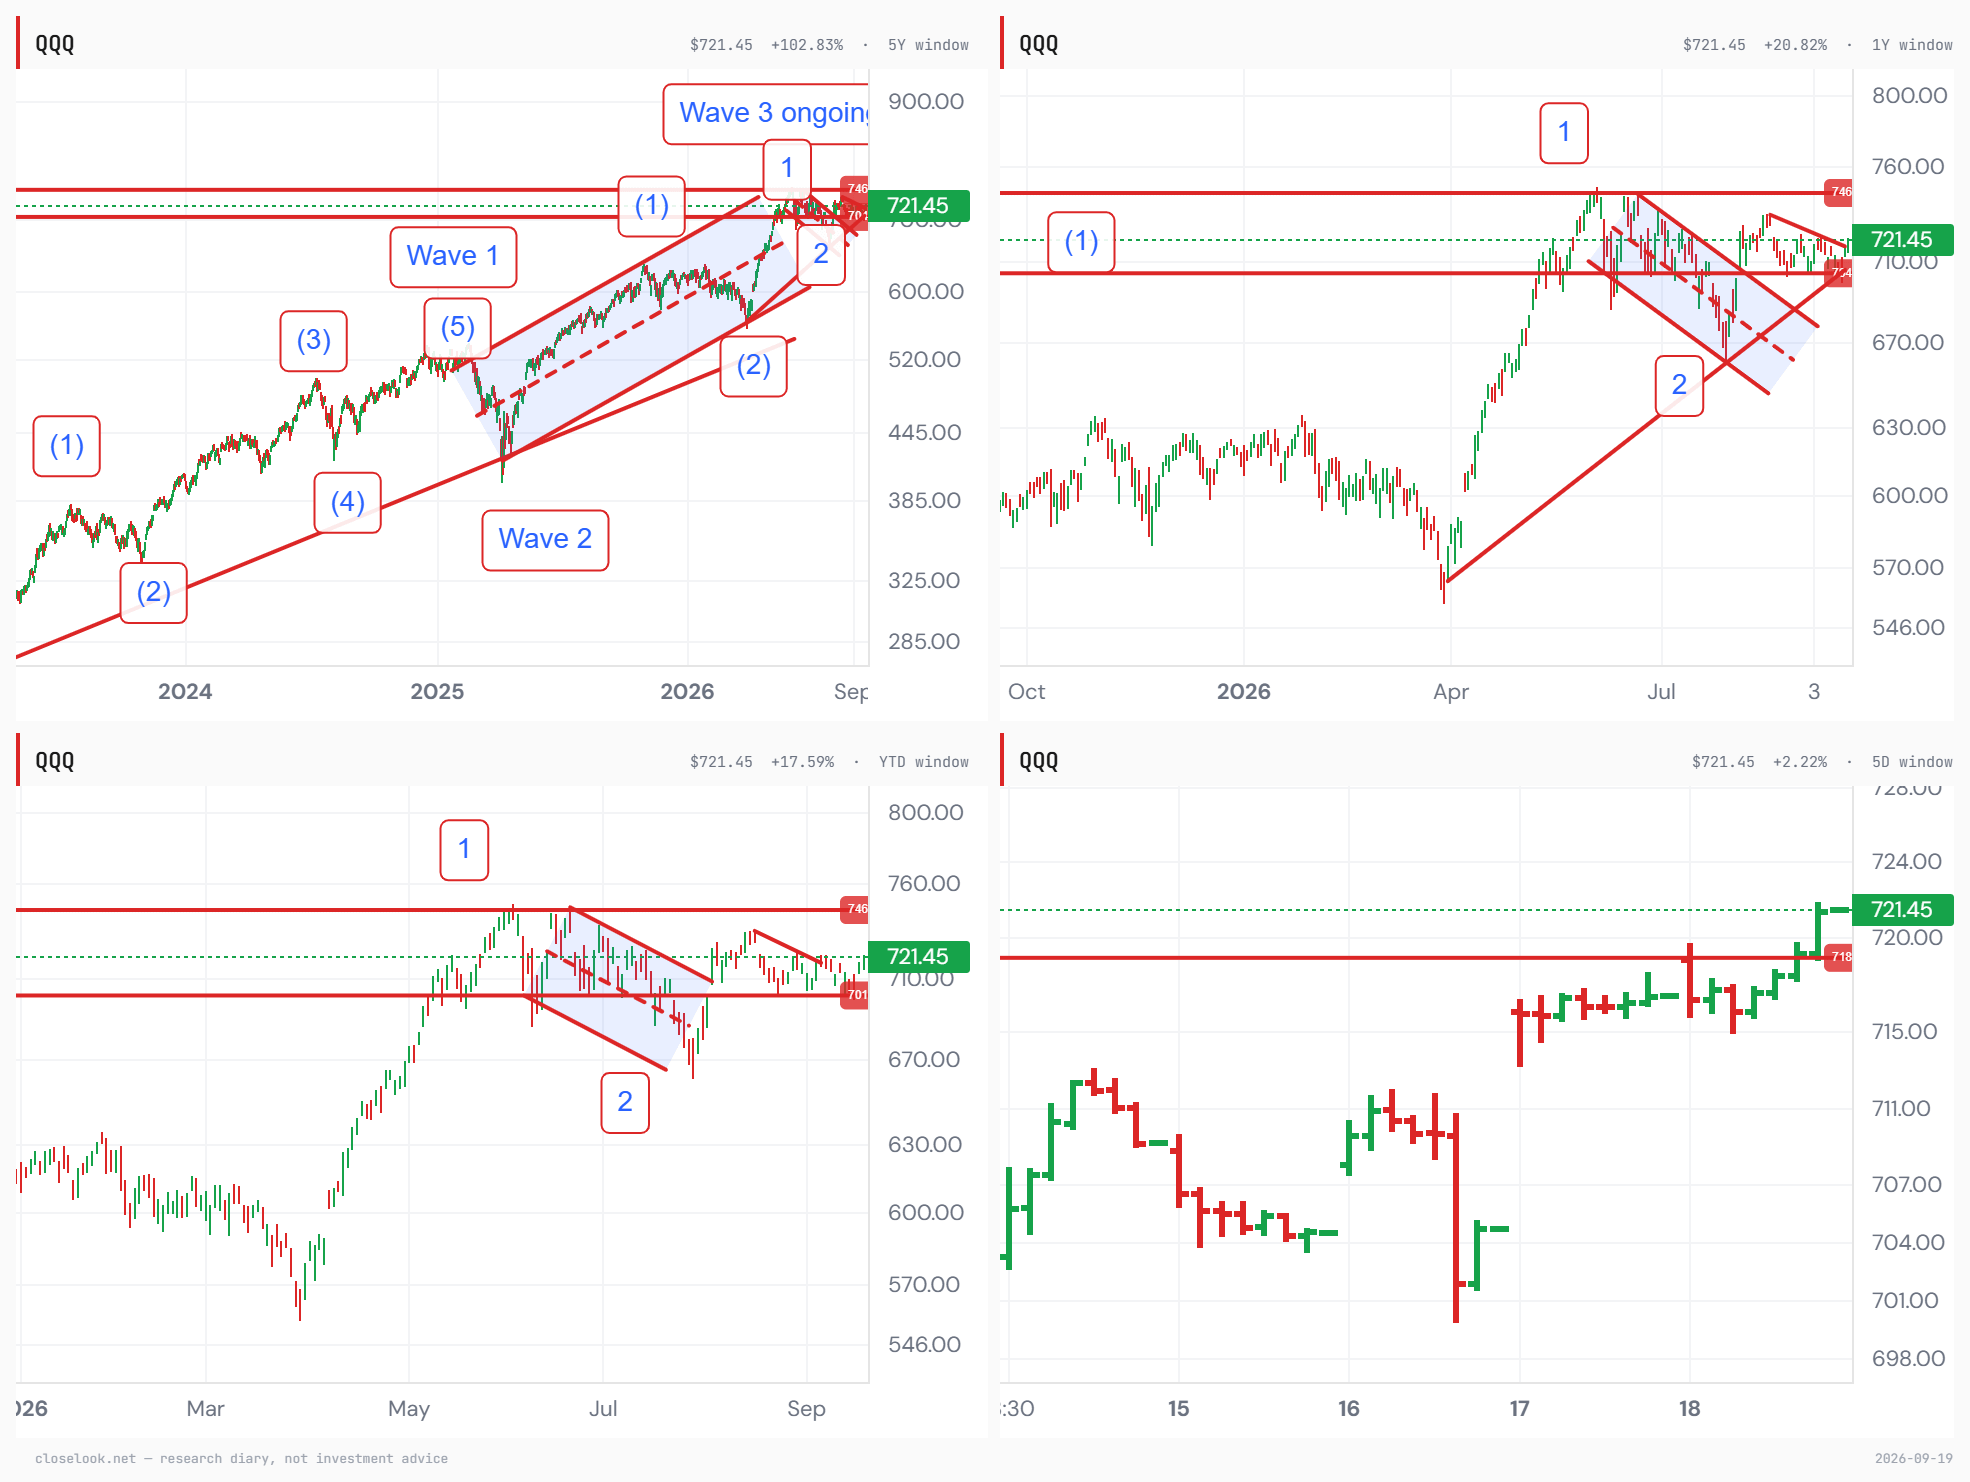
The same index at four focal lengths — and the same chart on one year. The editor’s grid above carries the five-year count (1-2 off the April low, wave 3 ongoing, the (1)-2 channel drawn), the one-year with the wave-2 channel and the two horizontals, the year-to-date, and the five-day tape with Friday’s close above the 718 line that had capped the month. The house chart on one year carries the summer’s structure at reading distance: the rising line from the April low, wave 2’s support, untouched; the descending channel from the June high, broken upward in August; the short descending line from the mid-August high — taken on Friday’s close, the first close above it since it formed; and the two horizontals, 746 above and the 704 shelf beneath, the shelf now with two closes sitting on it. The week’s own micro-structure: three lower closes into Wednesday’s 704.72 on the shelf, then +1.7% and +0.6% through the average and through the line. One chart, one reading, and it is a different reading from last week’s: last week the range was narrowing into a scheduled catalyst; this week the catalyst has passed, the range’s upper diagonal is broken, and the range’s floor has been touched twice and held. A range that survives its catalyst with its floor tested and its diagonal taken is a range that has used up its inside. The chart does not say which way it leaves. It says the next move is not a 1.4% week.
3 · The Outlook
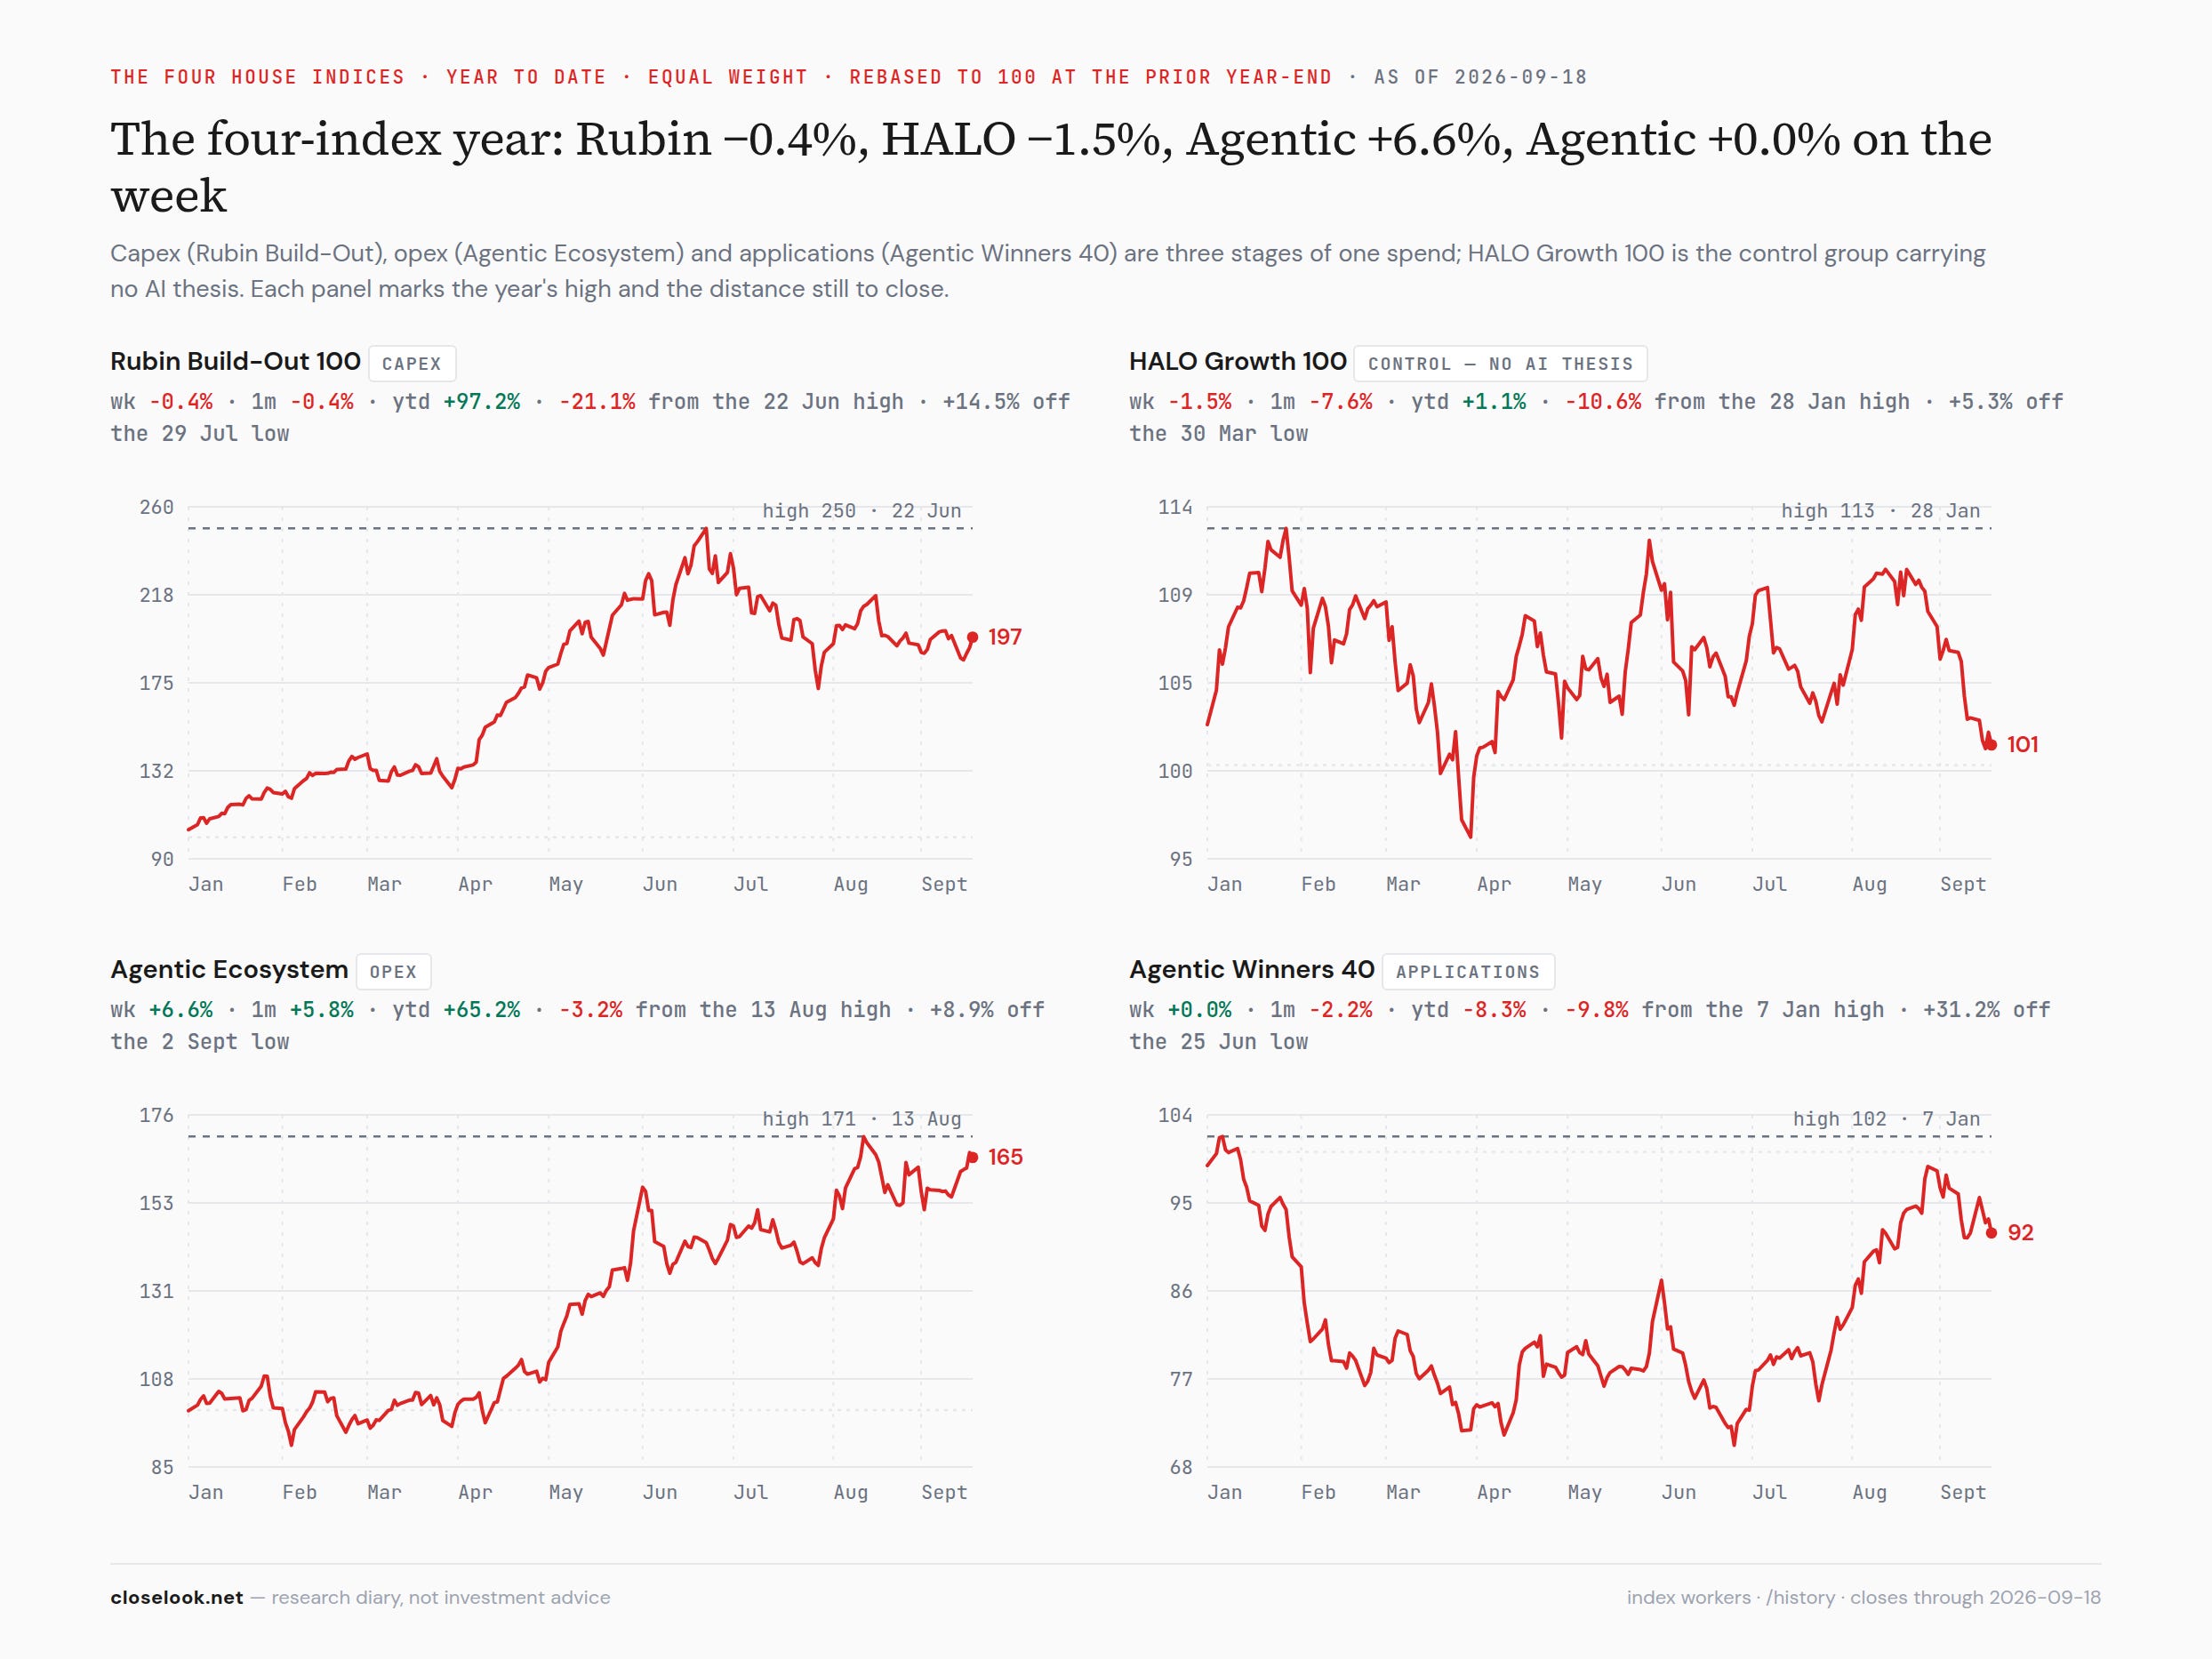
The four indices — the runner led by six points, the builder was the only red line, and the sort ran through the family in one row. The family printed the week in the order of the pacing letter: Agentic Ecosystem +6.57% (the opex layer, +65.5% on the year; its security sleeve +14.2%, its identity-and-governance sleeve +12.2% — the two sleeves the weekend’s letter wrote a demand case for), Agentic Winners +0.01% (the applications; −7.0% on the year, flat to the cent), HALO −1.46% (broad growth, no AI thesis; −1.1% on the year, red now), Rubin Build-Out −0.40% (the capex layer, +90.2% on the year — the only red line after four weeks as the only green one; it fell 5.3% on Monday to 1,855 with every layer red and recovered all but four tenths of it in four sessions, the last two on the equipment and memory names). Across the Atlantic Euro-AI −0.23%, its chip-architecture cluster +2.6% and its power-and-cooling cluster −2.6% — the same sort in Europe’s names. Last week the further from the physical layer the worse the week; this week the order inverted for five sessions and then half-reverted on the last two: the runner bought and held, the builder sold and bought back, the seller bought and sold. Three layers, one sort.
The control group fell while the stack’s middle layer rose six percent — and that is what makes this a sort week rather than a duration week. HALO −1.46%, opex +6.57%, applications flat, capex −0.40%: the no-AI growth index fell modestly while the AI stack’s middle layer was bought hard and its two ends went nowhere. Inside HALO the ladder reads three green of twenty-three — surgical and med-devices +3.08%, longevity +2.45%, autonomous defense +0.21% — and energy transition −7.00%, the speculative sleeve −6.50%, the hypergrowth sleeve −5.04%, satellites −4.01%, nuclear −3.94% at the bottom, the last of those sold with the utilities on the five-percent ten-year. Put the five weeks together: AI unwind inside a flat growth tape, AI bid inside a growth sell, growth sell with the stack inside it, growth sell led from the top of the stack, and now a growth sell with the middle of the stack going the other way at six percent. Last week’s reading was “everything priced on 2027 earnings marked down by the curve.” This week the curve did the same thing and one layer was bought through it — the layer whose demand the labs’ own letter guaranteed. That is a market sorting by news inside a market sorting by duration, and the news won the week.
Inside the indices — where the week happened, and what the month is quietly saying. Inside Rubin the top five are the corridor’s members and the designers: the Asia-Pacific ex-Japan constituents +5.20% — the Korean and Taiwanese memory and foundry names sold Monday and bought back Thursday and Friday, +139.5% on the year — the chip architects +5.17%, AI factory systems +4.43%, the design layer +3.34%, storage +2.79% (still +352.9% on the year). The bottom is the equipment’s own supply chain: machine vision and sensing −4.48%, power semiconductors −3.05%, physical AI −3.00%, gases and chemicals −2.98%, fab subsystems −2.96%. Thirteen of thirty-six sub-indices green, from twenty last week. Widen to the month and the “old leaders re-emerging” reading this letter dented a fortnight ago has a new shape: AI factory systems +16.6% and the chip architects +11.8% lead the month by a distance; then the AI factory sleeve +7.9%, the design layer +7.3%, the Asia-Pacific constituents +6.6%, foundry and integration +4.1%, storage +3.3%, HBM memory +3.2% — and at the bottom wafer processing −12.4%, fab subsystems −8.4%, manufacturing support −7.0%, gases and chemicals −6.3%, photomasks −6.2%, robotics −5.4%. The build-out is being bought at the top of its stack — the systems that are shipped this quarter and the designs inside them — and sold at the bottom, where the tools are made. Inside the Agentic Ecosystem, thirteen green of fourteen: agentic security +14.23%, identity and governance +12.23%, the govern-and-secure layer +12.20%, the US constituents +6.71%, Europe’s +6.64%; then data and memory +3.29%, compute operators +2.43%, the substrate +1.90%, edge and distribution +1.54%. The one red line: foundation models −1.68% — the one-name sub-index, Zhipu, still +488.8% on the year after losing a quarter of its value the week before. The pacing letter was read as a mandate: if the frontier is paced and evaluators get permanent access, the layer that secures, identifies and governs agents has a demand written into the labs’ own public position. The market bought that on Monday, +13% to +17% in the security names, and did not sell it on Friday when it sold the rest of the software complex. Inside Agentic Winners, five green of nine: the application leaders +1.85%, the enterprise layer +1.41%, the megacap gateway +1.15% — still the only sleeve positive on the year, at +12.8% — the control plane +0.71%, the US constituents +0.50%; and endpoints −4.58% (now −20.9% on the year), consumer −3.52%, Asia’s constituents −1.51%, Europe’s −0.42%. The control plane that lost ten percent last week gained back less than one. Two weeks ago the thesis and the tape disagreed on governance for a fortnight and this letter called it a price; this week the tape bought governance by fourteen percent in five days. A price can be un-made as fast as it is made. This one was made on a letter.
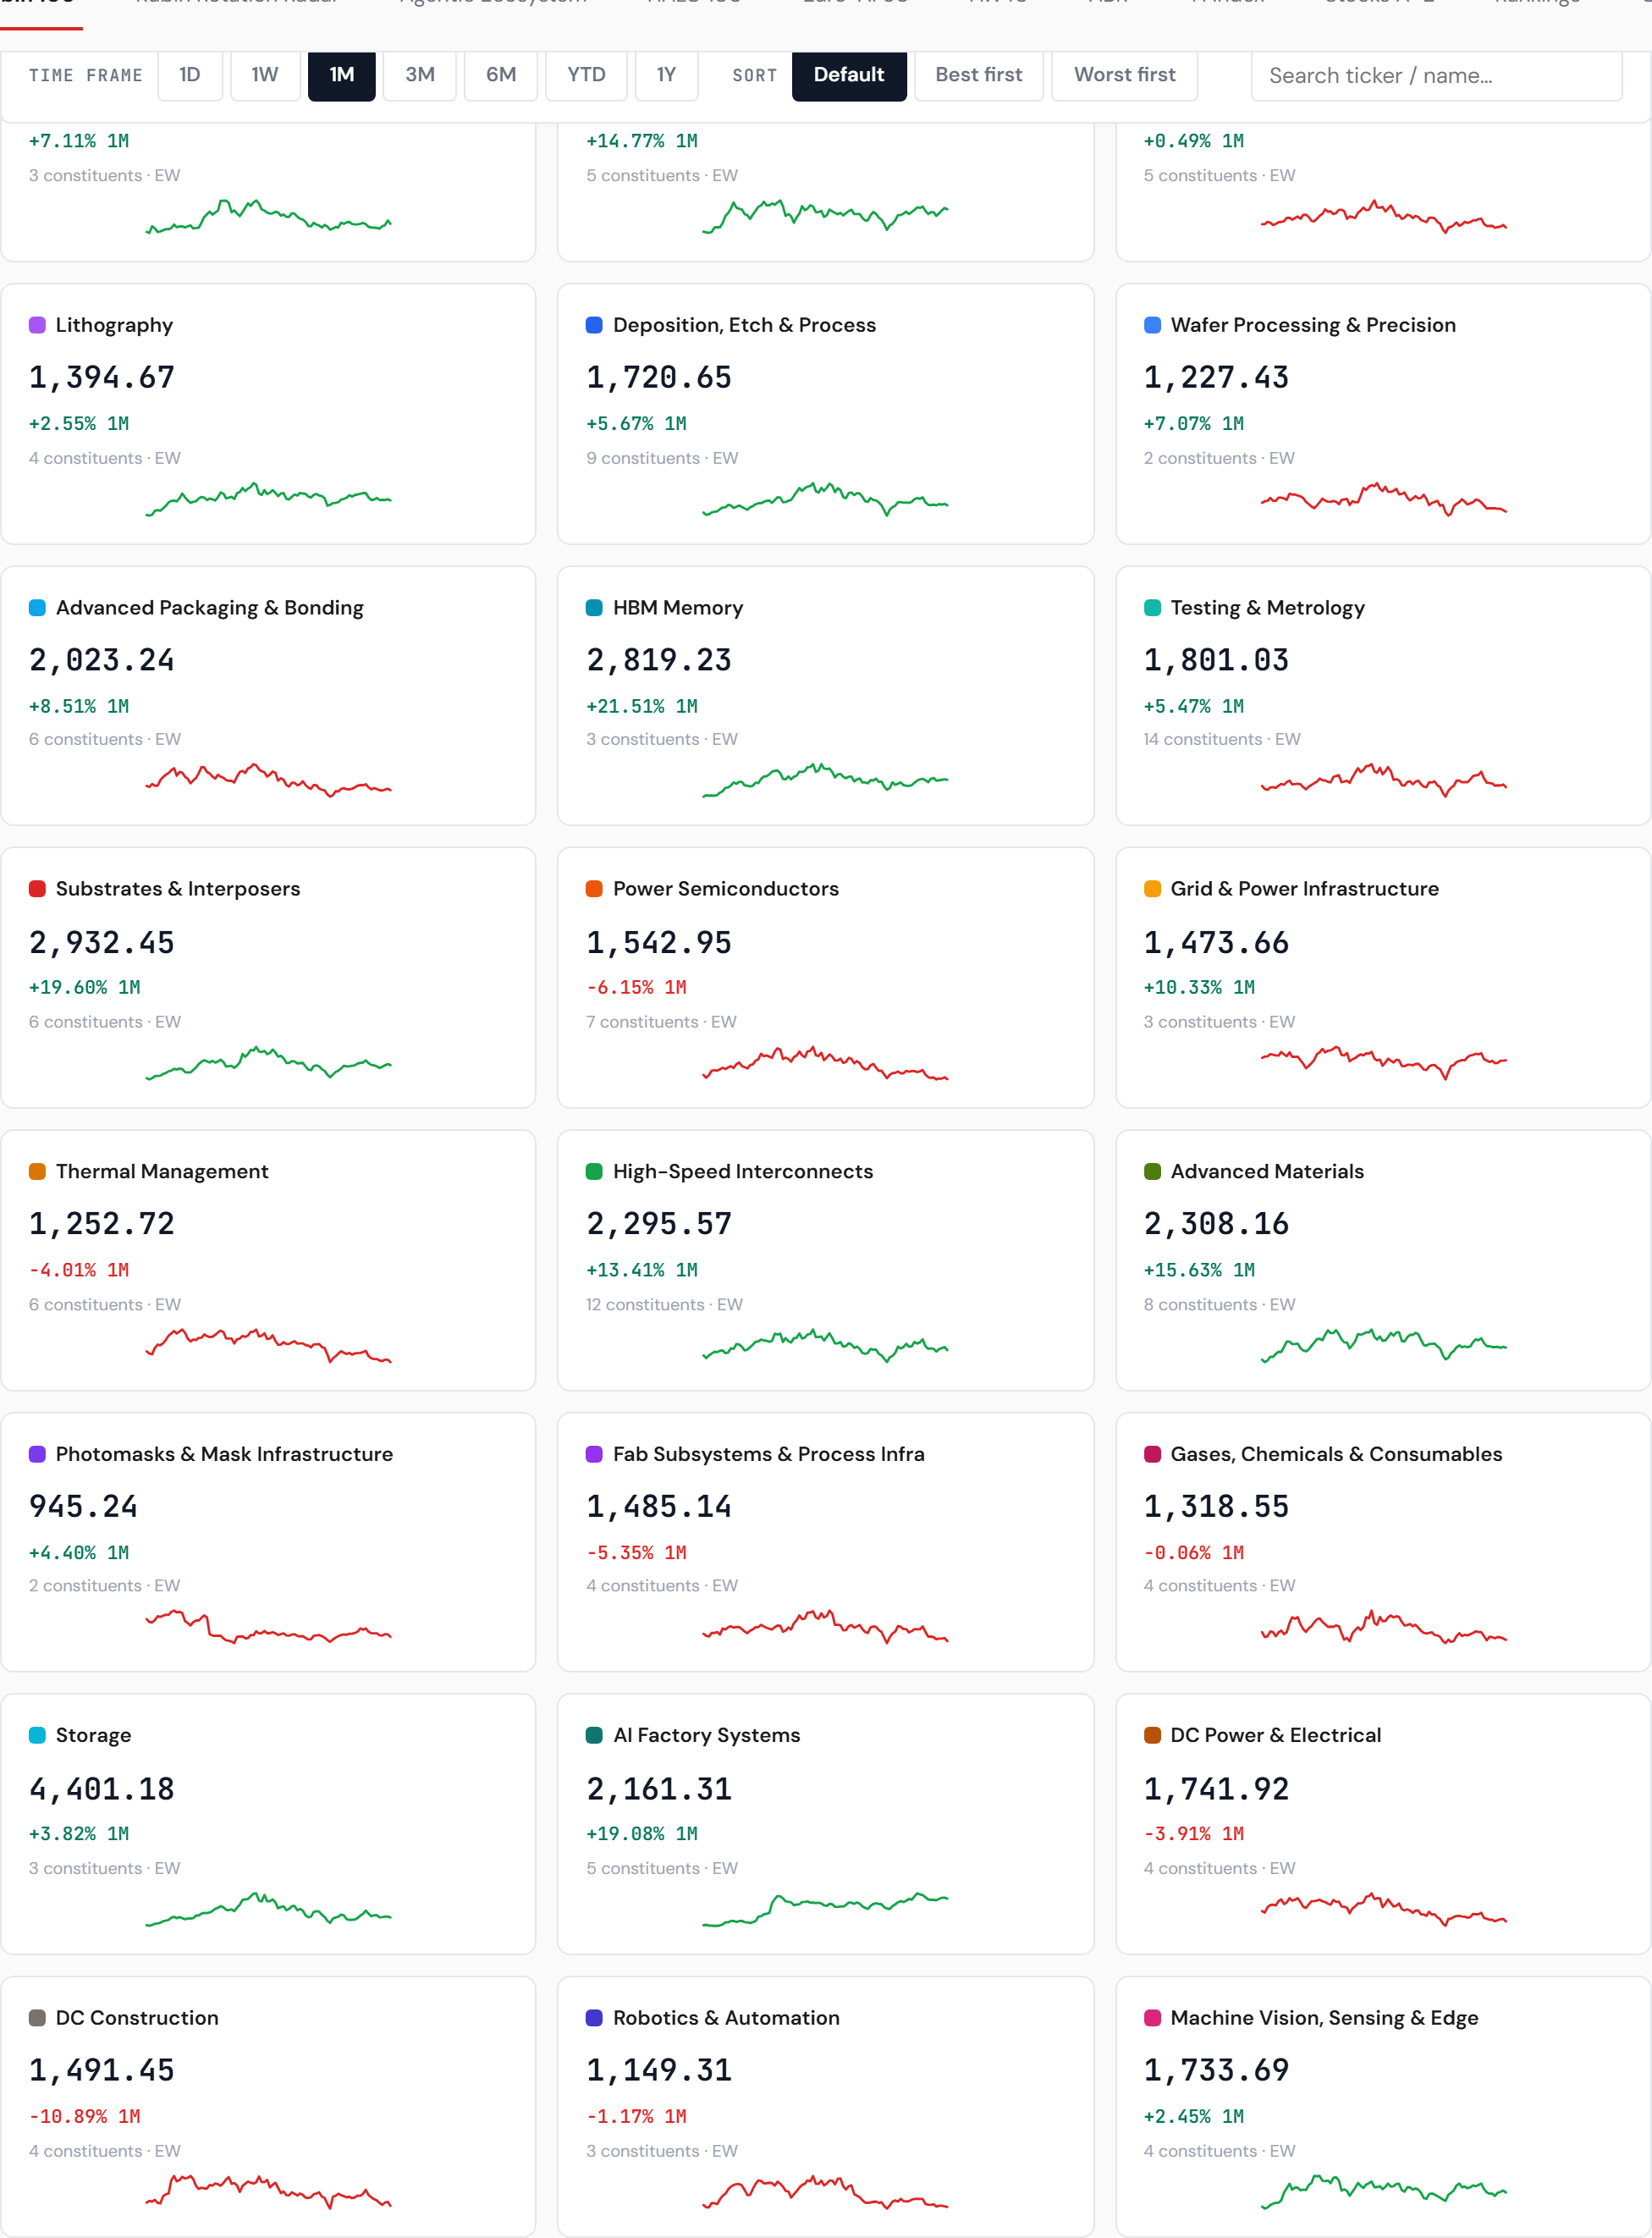
The strongest and the weakest, by index — the scorecard. Rubin Build-Out, the week: strongest Asia-Pacific ex-Japan +5.20%, chip architects +5.17%, AI factory systems +4.43%; weakest machine vision and sensing −4.48%, power semiconductors −3.05%, physical AI −3.00%. Rubin, the month: strongest AI factory systems +16.6%, chip architects +11.8%, the AI factory sleeve +7.9%; weakest wafer processing −12.4%, fab subsystems −8.4%, manufacturing support −7.0%. Agentic Ecosystem, the week: strongest agentic security +14.23%, identity and governance +12.23%, the govern-and-secure layer +12.20%; weakest foundation models −1.68% (one name), edge and distribution +1.54%, the substrate +1.90% — the “weakest” three all but one of them green. Agentic Winners, the week: strongest application leaders +1.85%, the enterprise layer +1.41%, the megacap gateway +1.15%; weakest endpoints −4.58%, consumer −3.52%, Asia’s constituents −1.51%; on the year the megacap gateway (+12.8%) is the applications index’s only green sleeve, endpoints (−20.9%) and consumer (−16.1%) its worst. Read the three scorecards top to bottom: the strongest sleeves this week are the ones the weekend’s letter named as necessary — governance, security, the corridor’s memory makers on the rebound — and the weakest are the consumer’s endpoints and the tool makers’ suppliers, which nobody’s letter mentioned.
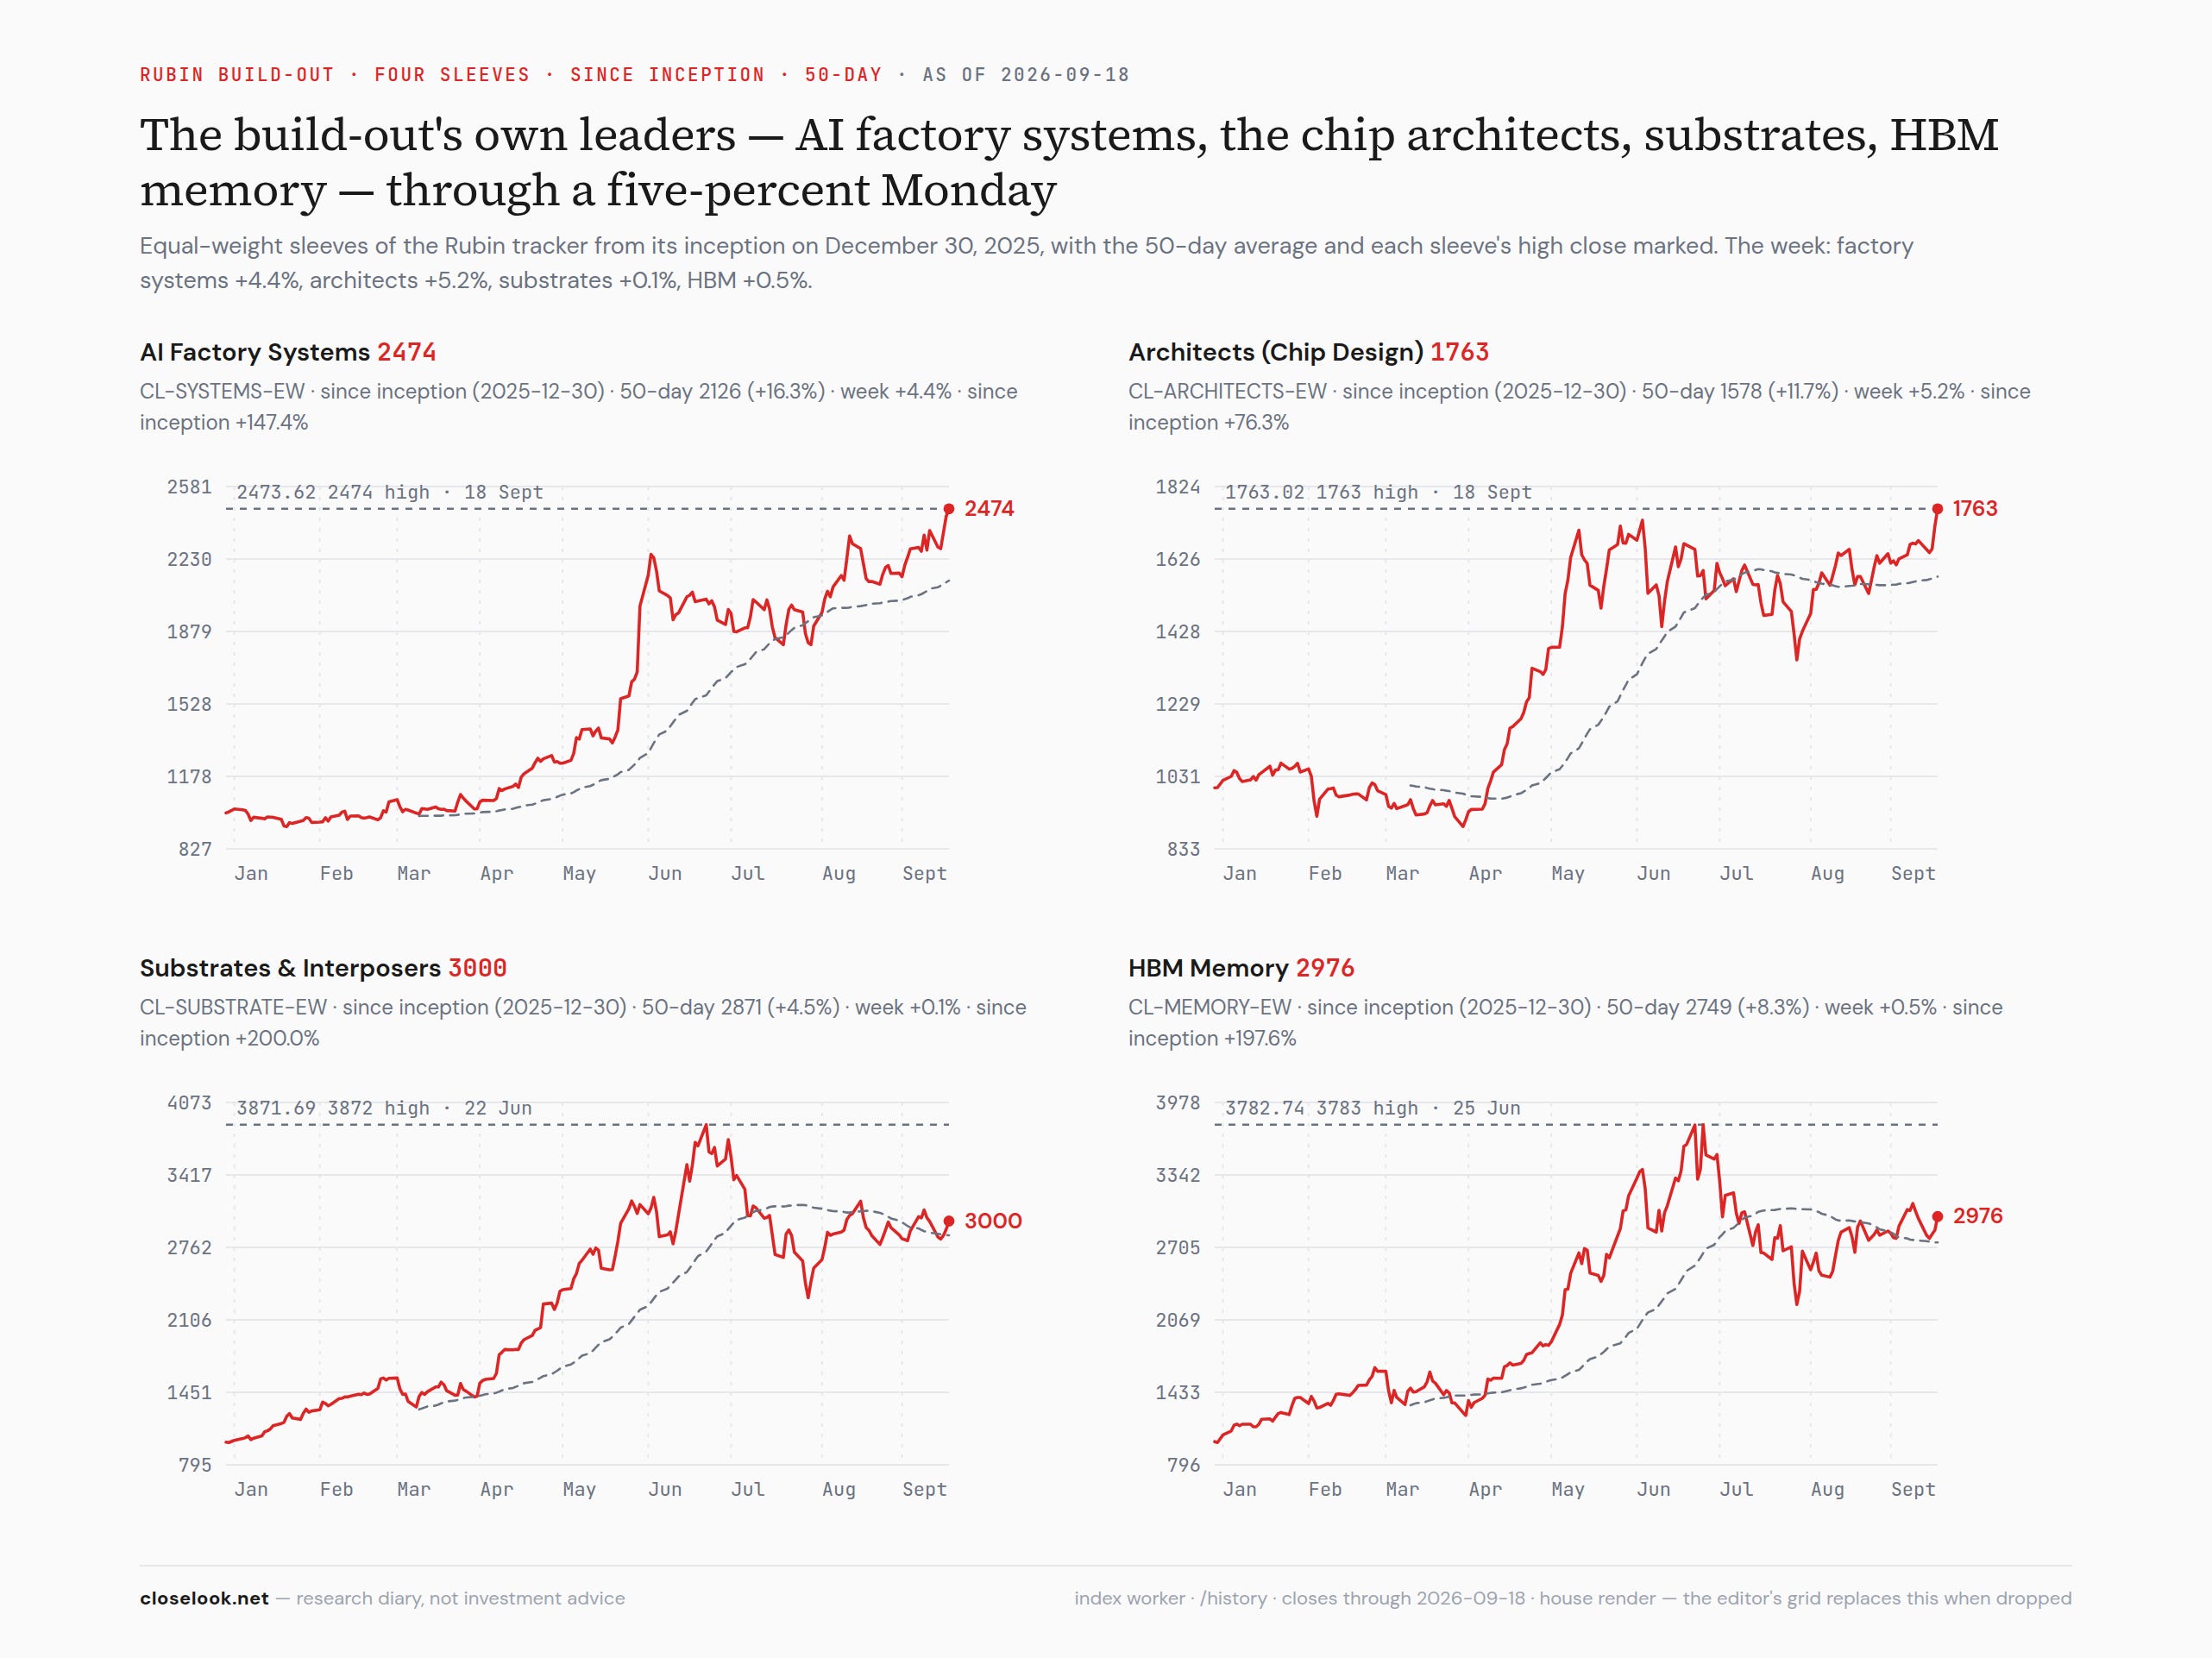
Four Rubin sectors with relative strength — the house grid of the build-out’s own leaders, one of them at a new high. Inside a tracker that is red on the week and flat on the month, the four sleeves the grid follows from the tracker’s inception held their structure through a five-percent Monday: AI factory systems, +4.4% on the week and +16.6% on the month, the sleeve that took out its June top a fortnight ago and extended it — +142.6% on the year; the chip architects +5.2% and +11.8%, through their May–June highs to a new high on Friday on the bid in Arm, Marvell and Astera; substrates and interposers +0.1% on the week, holding the July breakout level after Monday’s retest of it; HBM memory +0.5% on the week and +3.2% on the month, the sleeve that fell hardest on Monday and recovered by Friday — +181% on the year. They are the sleeves the print record has been paying and the best-by-name list is full of, and they are the sleeves that would lead a chip-led resolution if the spring’s leader leads again. One new high extended and three held retests through a sort is more than a coincidence, and less than a confirmation — the same sentence as last week, one week more evidence.
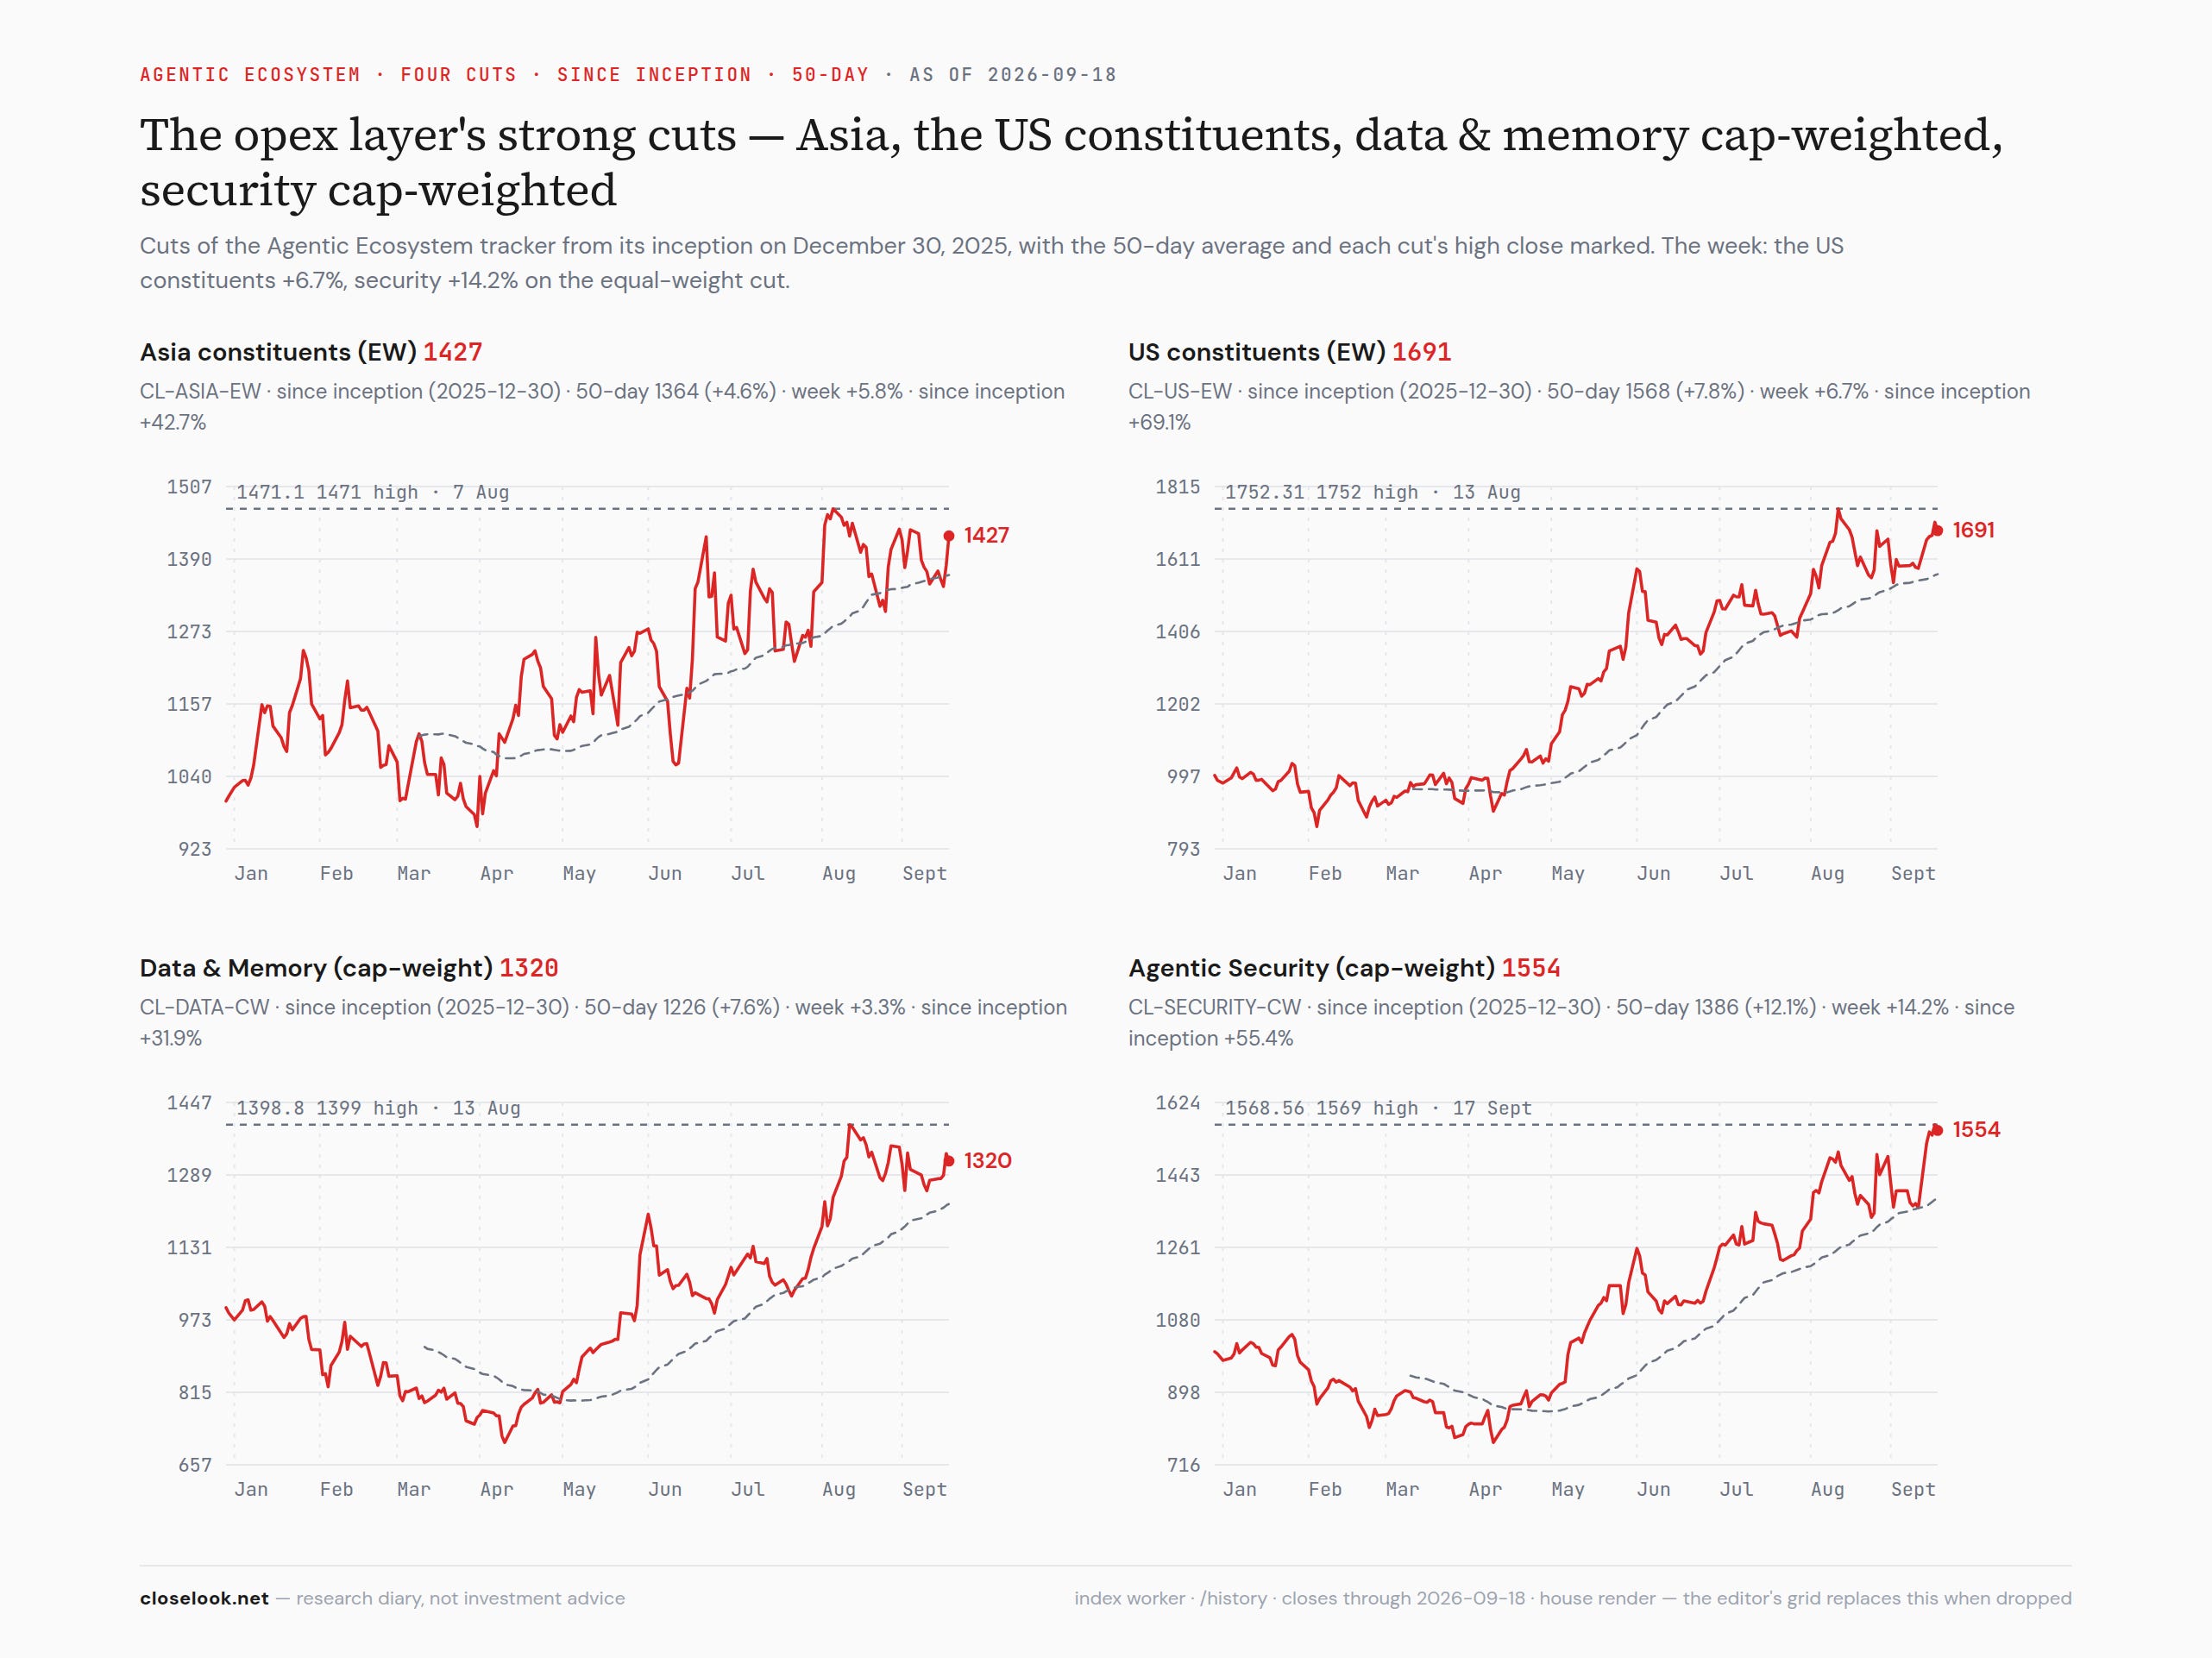
And the same lens on the opex layer — the Agentic Ecosystem’s strong cuts, all of them strong this week. The operators’ index is green on the week and the month, and the house grid reads the layer by weight: the Asian constituents, sold on Monday with the corridor and back inside the range they broke into in July; the Americas constituents, +6.7% on the equal-weight cut, through the August high; data and memory on the cap-weighted cut, on the August breakout level after Monday’s test; agentic security cap-weighted, +14% on the equal-weight cut, through the July shelf and the August high in one week. Set that against the scorecard above — thirteen of fourteen sleeves green — and the reading is the opposite of last week’s: last week the largest names held their structure while the average name was sold; this week the average name was bought harder than the largest, which is what a sort by news does — it lifts every name in the named layer, not the ones with the balance sheets. If the resolution is up, these are the operators’ candidates to lead it; if it is down, a layer bought on a letter is the first to be sold on a headline.
Best and worst week, by name — the governance sweep. Across the family’s constituents, the twelve best lines are seven operators, two builders, two HALO names and one application: Tempus AI +31.9%, Rubrik +23.2%, Lenovo +20.1%, Zscaler +19.9%, Global Unichip +16.8%, Illumina +16.1%, SailPoint +15.0%, CrowdStrike +15.0%, SentinelOne +14.0%, OVHcloud +13.3%, Lasertec +13.1%, Natera +12.3%. Security, identity, the sovereign cloud, the diagnostics names, the Taiwanese design house, the Japanese mask inspector: the layer the pacing letter named, plus the parts of the physical layer that are not the tools. The worst: Fluence Energy −26.3%, Red Cat −15.2%, Array Technologies −12.1%, Corning −9.8%, Viking −9.3%, Dutch Bros −8.8%, Advanced Energy −8.7%, CoreWeave −8.6%, onsemi −8.1%, Chipotle −7.7%, Amphenol −7.6%, CAVA −7.6% — the energy-transition names sold with the utilities, the fibre name that led two weeks ago, the neocloud, the power semiconductor, and the consumer restaurants. Sixth consecutive week in which last week’s heroes are missing from this week’s list: Aehr, Cohu, FormFactor, Bloom, Coherent, HPE, Corning led seven days ago, and Corning is on the worst list now. The medians: opex +5.89% with 27 of 34 green; capex −0.18% with 58 of 126; applications −0.83% with 15 of 40; HALO −1.25% with 34 of 99. Four layers, four medians, and for the first time in six weeks the order is not the distance from the silicon. It is the distance from the letter.
The AI Handoff Board — the up-stack run did not resume; the operate-and-trust ratios did. The handoff ratios had two weeks of the applications giving back; this week the applications were flat against the builders and lost against the operators: use-against-build +0.41% to 1.5042, use-against-operate −6.16% to 1.1169, beyond-gateways +0.13%. The ratios that moved all point at the middle of the stack: operate-against-build +6.99% to 1.3467, trust-against-execution +7.87% to 1.0967 — the security names against the execution layer, the week’s widest handoff — operators-against-suppliers +2.84% to 1.2602, design-against-physical +3.72% to 1.2478, execution-against-substrate +2.07%. And the ratios that fell are the ones that had risen last week: consumables-against-tools −1.81% to 0.9363, verification-against-design −0.29%. Read the board as one picture: the layer that runs and secures agents re-rated against everything above and below it in one week, the designers re-rated against the fabs, and the tools kept losing to what runs through them. Last week the neoclouds’ first green week in four did not get a second; this week operators-against-suppliers turned back up, +2.8%, on a week the suppliers’ index was red. The handoff the house has been waiting for — build to operate — printed a week of it. One week is one week.
The hyperscaler cohort — a second close through the shelf, and 0.7% from the record. The Mag Pulse board reads the basket at 70.46, +0.82% on the week — a second consecutive weekly close above the 69.5 shelf — with Thursday’s 70.78 the highest close since the May 14 record of 70.94. The composition moved a fourth time in four weeks: Alphabet +3.26% and Meta +2.73% carried it; Nvidia +1.82% (up every session from Tuesday); Apple +1.16%; Tesla −0.32%, Microsoft −0.37%, Amazon −1.20%. The cohort board sorts it: the hyperscaler trio +1.05% on the week, the consumer-AI pair up two on the week and twenty-two on the month for Meta, the supplier +1.8%. Two weeks ago the money in the basket went to the chip; last week to the two consumer names; this week to the two names on the buying side of the sort — the buyers of compute up on a day the sellers were down five. The shelf test is resolved twice on the weekly now, which is the confirmation last week asked for; the record is 0.7% above; and the December pivot at 62.56 is still not on the map. A basket that confirms a shelf on a week the equal-weight index falls 1.2% is the participation statistic in its purest form.
Compute tightness — the operators’ index was green, the neocloud inside it was not, and the funding backdrop got worse and then better. Last week the neoclouds were flat in the week the curve did what it did; this week the compute-operators sleeve rose 2.43% and operators-against-suppliers +2.84% — and inside the sleeve, Nebius −0.45%, CoreWeave −8.57%, IREN +6.50%. The sleeve’s week was made by the sovereign cloud and the miner-turned-host, not the two names the house watches; CoreWeave was the sixth-worst line in the whole family. The discount rate went through five percent on Wednesday and back under on Friday; the demand statement stands; the price split the names, not the difference. Saturday’s pulse carries the book’s own answer — Hypergrowth bought Nebius back thirteen dollars under where it sold it — and the tilt watches the ratio, not the week.
The financing architecture underneath it — the supplier was bought every day from Tuesday, and its customers were on both sides of the sort. Nvidia’s week: +1.82% to 222.27, from 210.96 on Monday’s sort — 210.96, 212.17, 213.90, 219.34, 222.27, four consecutive up sessions — from 10.5% under its record close to 5.7% under it. The supplier was sold with the physical layer on Monday and bought back before the physical layer was: it was green on Tuesday, when the equipment was still being sold, and green on Thursday and Friday with everything else. Its largest customers were on both sides of the week: Alphabet and Meta bought as buyers of compute, Oracle sold as a seller of it, Microsoft and Amazon down. The pattern this letter has tracked since the August platforms — the supplier that finances the factories and sells the inference silicon — printed the other way this week: the supplier was the third-best line in the basket and the factory builders’ index was the family’s only red line. The tape’s version, one sentence: the market sold the sellers of compute on Monday and bought the one company that sells to both sides of the sort.
Structural inflation — contained, the one hot bucket is still expectations, and the Fed hiked into it. The house composite in the macro lab reads 49, “Contained”, direction 48 “Flat”, structural character 32 “Leans transitory” — unchanged in state from a week ago, the score down a point. The supply-shock impulse registers (z +1.52, spreading: no) and the barrel that drove it fell 5.6% this week. The one hot bucket is long-run expectations — z-score +1.09, score 64 — the same bucket, a fraction cooler than last week’s +1.12. Core cost pressure 46, labor 40, shelter 43, breadth 43 with a momentum score of 33, the lowest on the board. The gauge and the market agreed last week on the decomposition and disagreed on the conclusion; on Wednesday the Fed took the market’s side: it hiked into a “contained” composite, and its statement named a “timelier drop in inflation” as the reason — which is the expectations bucket, in the central bank’s words. The gauge’s next print says whether a delivered hike cools the bucket it was aimed at. If it does not, the second hike is the one that is not yet priced.

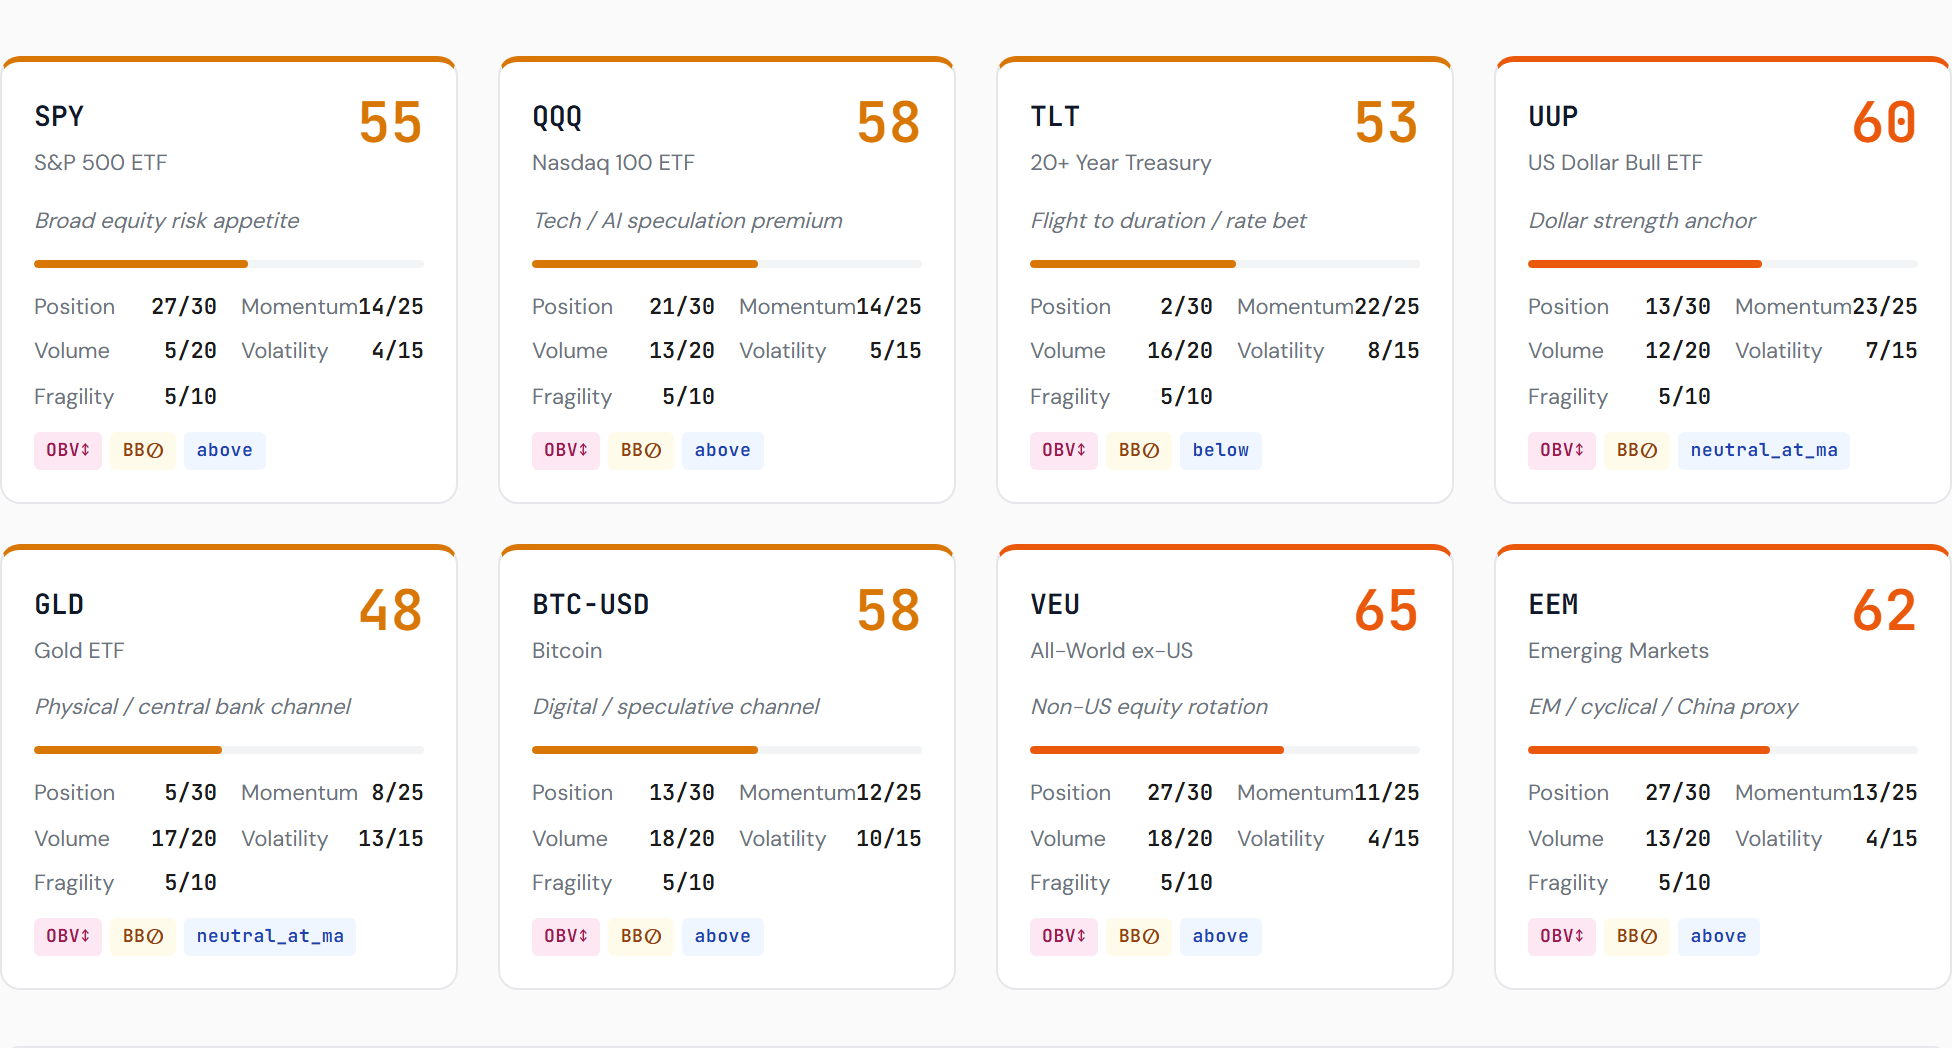
Breadth and temperature — cooling into the hike, warming on the reclaim, and flat on the week for the first time in a month. Equal-weight lost 1.20% against cap-weight’s −0.34%, the fourth cap-weight week, while the Money Temperature composite went 50 to 46 on the sort, 44 on the rates day, 45 on the hike, 55 on the reclaim, and 50 on Friday — “mixed / transitional” at low confidence every session, from “risk-on rally” at moderate confidence a week ago. The instrument gauges: the dollar the warmest at 68, the Nasdaq 100 59, bitcoin 58, the S&P 49, emerging markets 47, the long bond 41, gold 40, the world ex-US 40. A gauge that cooled six points into the decision and recovered ten on the reclaim, to finish where it started, is reading the week the index read: nothing net, everything gross. The spread underneath moved: risk appetite +9 from +19, speculation +10 from +12, dedollarization −19 from −13, duration −8 from −16. The duration spread narrowing on a week the belly made a new low is the same awkward internal as last week; the dedollarization spread widening on a week the dollar rose 1.1% is the gauge saying the dollar’s bid was the hikes, not the flows. Saturday’s letter has the world’s row; the tape’s row is that the warmest instrument on the board is the currency, and the second-warmest is the index this letter counts.
The count, restated for the week ahead, with the calendar that decides it. Above the 50-day by 1.6%, 3.4% from confirmation, 3.8% from the kill-switch, with the shelf held twice, the August line taken on Friday, the expiry’s positions released on Monday, and Micron’s print — the vendor calendar says September 30, the house card carried the 22nd, the date is confirmed before a window is minted — as the first order-book fact of the resolution month. Three weeks ago the referees were earnings; two weeks ago macro; last week one referee that met on Wednesday. This week there is no referee. There is a Monday, and there is a memory order book, and October opens after eight more sessions.
4 · What May Lie Ahead
The levels, updated — every equity line held or retaken, the chips through their average, the bond lines split by a nickel. QQQ: 721.45, above the 50-day (709.95) by 1.6%; 746.16 remains the confirmation, 3.4% above; 694 remains the kill-switch, 3.8% below; the 704 shelf held on two closes; the descending line from mid-August was taken on Friday. IGV: 104.35, +2.79%, still under the year-end line of 105.69 — −1.27% on 2026 — after one close above it on Monday; 110.32 (August 27) the high water, 5.7% above; the 50-day at 100.01 is 4.2% below. CLOU: 27.82, +2.54%, 4.6% under the 29.11 door, 4.7% above its 50-day at 26.57. SOXX: 533.07, +1.14% on the week, 1.4% above its 50-day at 525.67 — the first weekly close above the average since June — after three closes under the 505 floor (497.40, 498.85, 502.06), a reclaim on Thursday and a 2.7% Friday; 505 remains the floor, 5.3% below; 517.43 the line that was lost and retaken inside the week; the June 22 high at 655.01 is 22.9% above. MAGS: 70.46, a second weekly close through the 69.5 shelf; 70.94, the May 14 record, 0.7% above. IEF: 90.80, the sixth failure, with a new fifty-two-week-low close at 90.73 on the hike — the 93.17 line is 2.6% above, the 89.9 shelf 1.0% below. TLT: 81.25, above the 81.2 line by five cents; 80.71 (Tuesday) the new low. SPY: 761.69, a second close above the 757.83 line this letter carries; 777.88 the August record, 2.1% above; Wednesday’s 754.05 the reference below. Last week the bond lines were gone and the equity lines were all live with less room than at any point since June; this week the equity lines are still all live, one bond line is back by a nickel, and the room is the same. The catalyst did not spend it.
The week’s calendar has no central bank in it, and that is the calendar. Monday: the expiry release — Friday’s reclaim put the memory vehicle through 58, the chip index through its 50-day, the Nasdaq 100 through its August line and the S&P back above its line, all on a quadruple-witching session; Monday’s close says which of those were held and which were the expiry. The Kospi opens at 6,894 with Friday’s 2.7% not yet in the dollar wrapper; the ten-year opens at 4.998%, a fifth of a basis point under five; the yen at 157 with the Bank of Japan done and the ministry of finance not yet heard from; Brent under $100 for the first time in two weeks. Micron — the vendor calendar says September 30, after the close, estimate $31.27 on roughly $50.59 billion; the house card carried the 22nd; the date is confirmed before this letter or Sunday’s mints a print-record window. The card’s last four prints: four double beats, two paid (+22.6%, +9.2%), two sold (−5.5%, −12.4%) — the biggest name in memory gets graded on the cycle, not the quarter, and the cycle’s price just closed above 58 on a Friday. Wednesday through Friday: nothing scheduled that this letter scores. And behind the week: October, eight sessions away.
The calendar exhibit — the September frame, three weeks in, and the October frame one week nearer. Three weeks ago Saturday’s letter set the house expectation and this letter carried it at tape altitude: September is seasonally the worst month of the equity year, a hike is more probable than it was, and the base case for a consolidation continuation is a decline of about five percent; anything better is constructive; the trigger would be a hot CPI. Three weeks in: the S&P is 2.1% under its high, from 1.75%; the Nasdaq 100 3.3% under its June range high, from 3.9%; the equal-weight index −3.4% on the month; the ex-tech Nasdaq −2.66% on the year; the world index three fifths of the way to the base case. The trigger printed two weeks ago and the index bought it; the decision landed this week and the index bought that too, on Thursday, and gave nothing back on Friday. Now the frame this letter added last week, in the house’s words, one week on: the market has moved sideways since early June, and sideways movements resolve into bigger moves, up or down; the catalyst may be the meeting and the rate decision; and October is the month where, often, you get either the big upswing after a late-summer consolidation or the real leg down. The meeting has come and gone and the range is intact — which does not falsify the frame, it moves the catalyst: from a decision to a release, from a scheduled event to an unscheduled one, from the Fed to the order book. The house does not call the direction. It names the lines — 746.16 and 694 on the index, 525.67 and 505 on the chips, 69.5 and 70.94 on the basket, 757.83 on the S&P — and it will read the resolution on the close that takes one of them.
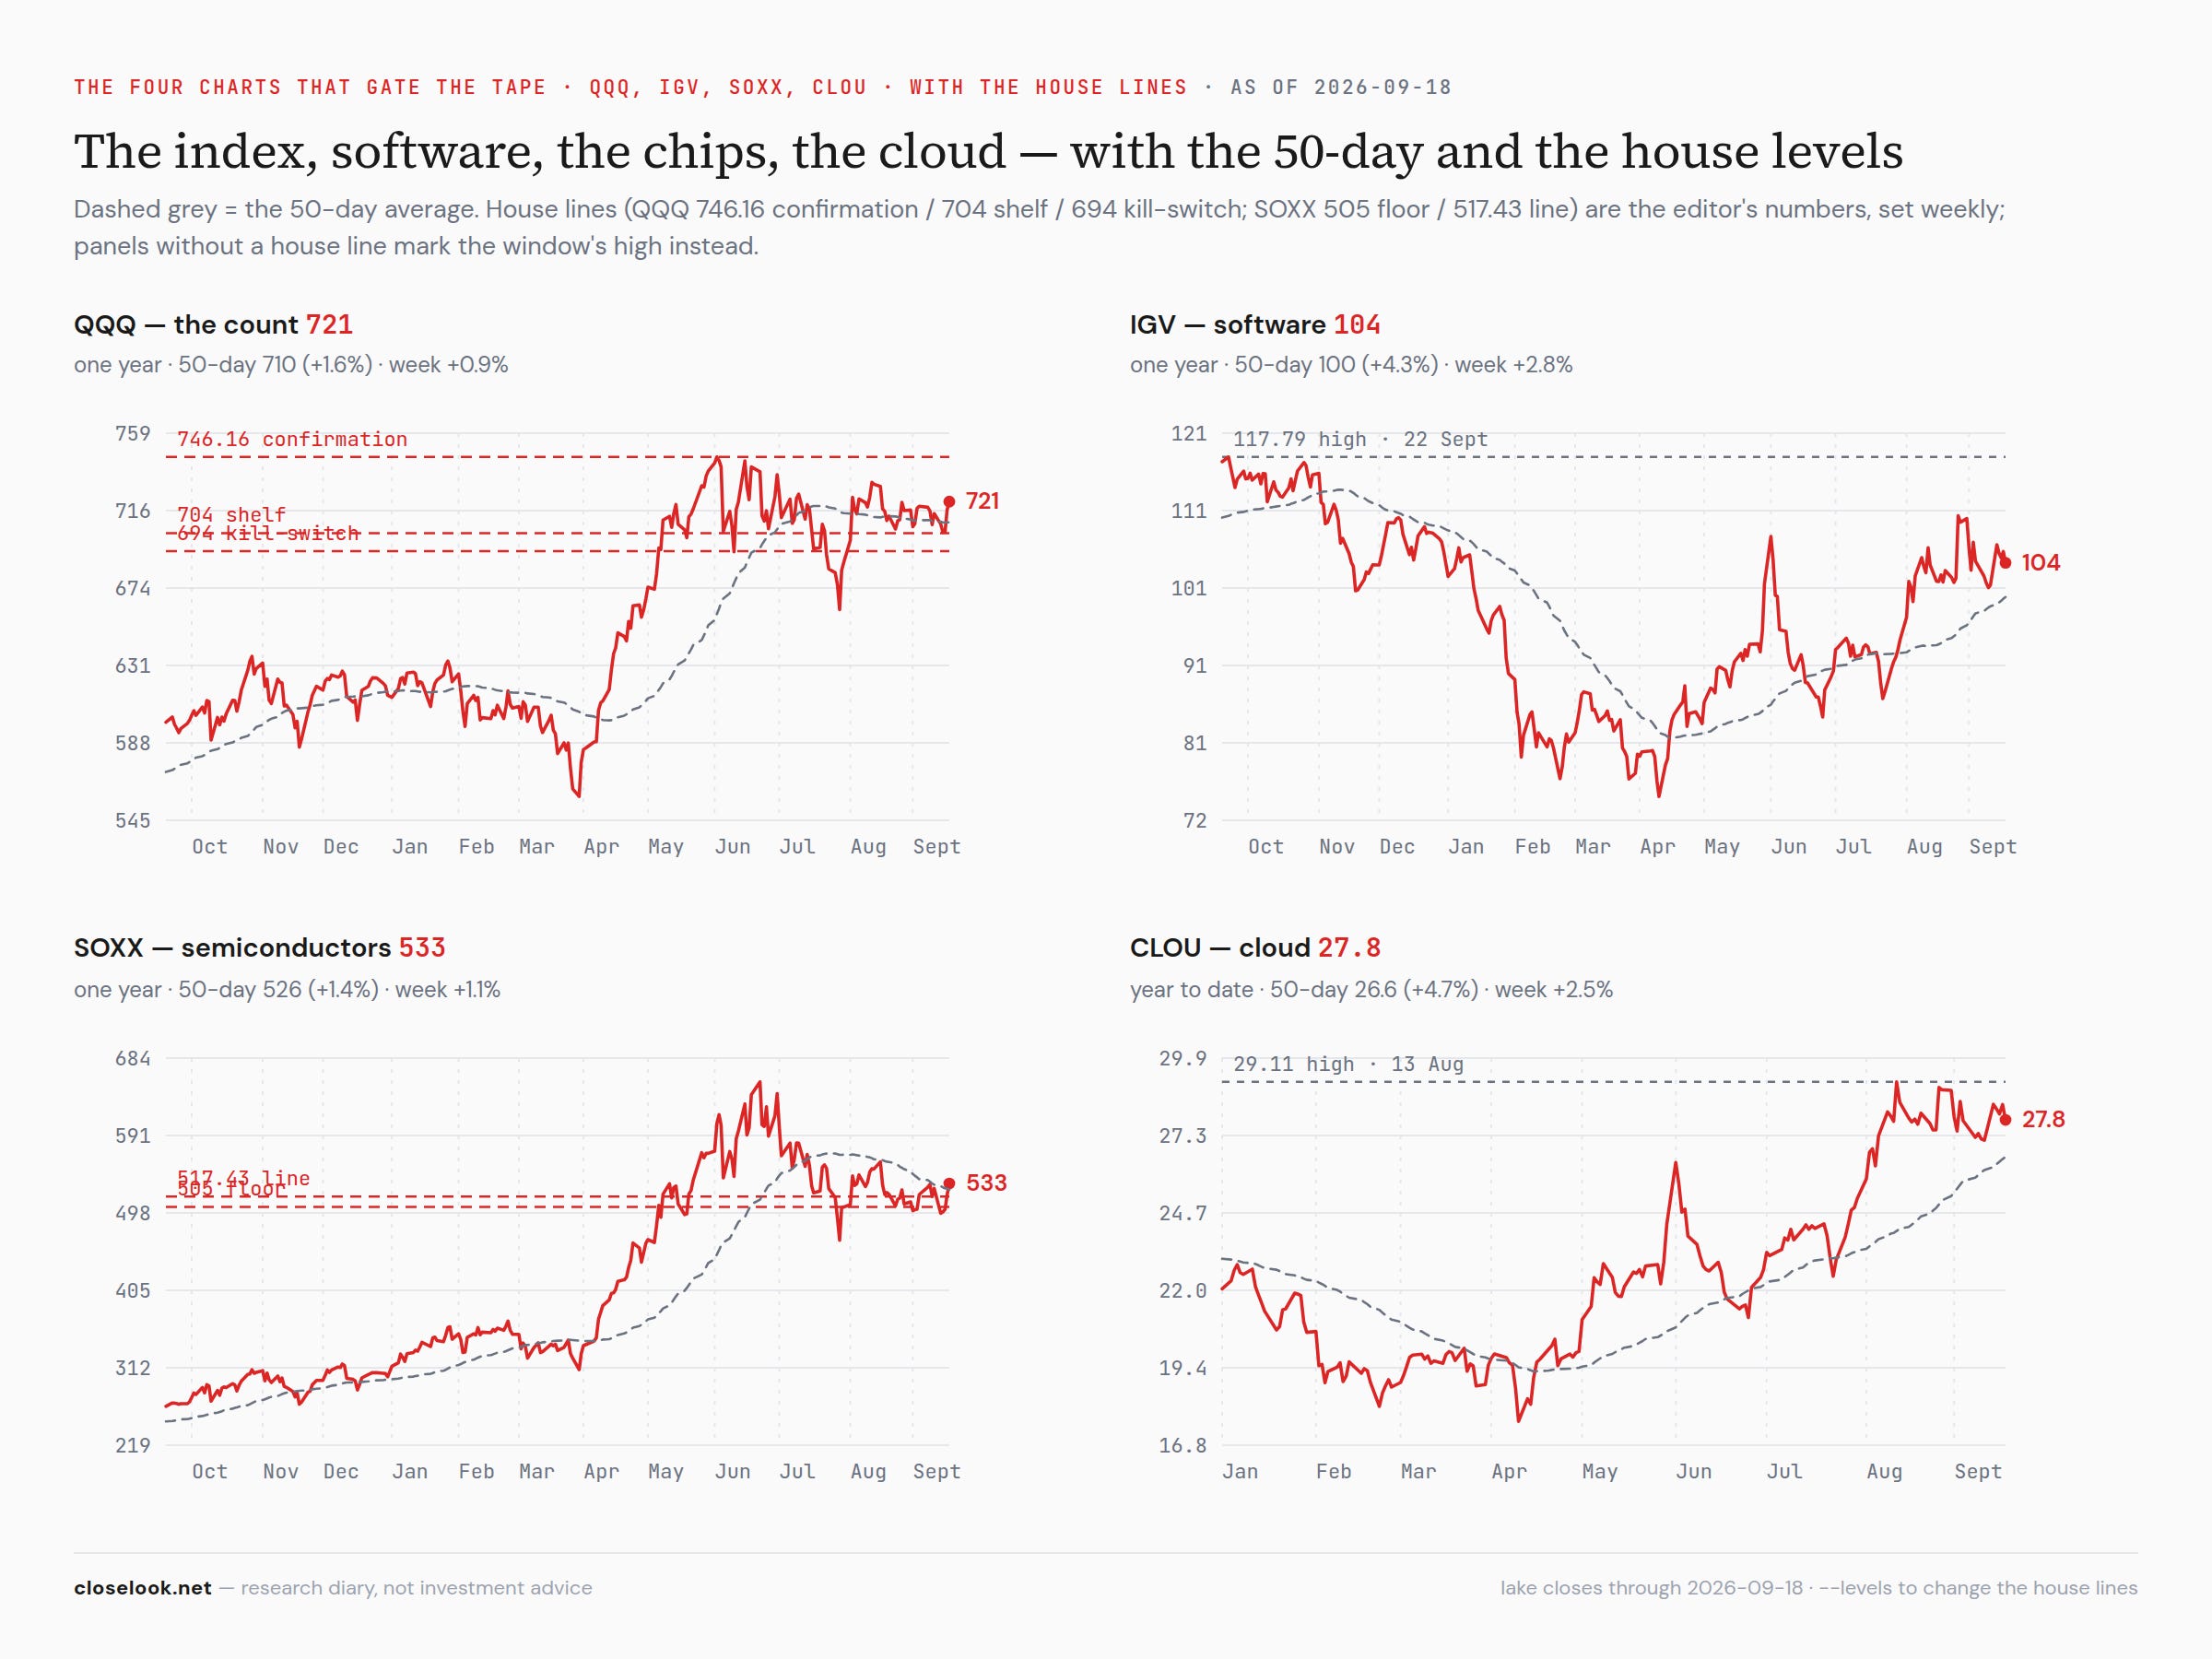
The four charts that gate the tape — two of four pointed up this week, and both of them are the ones that were down. Last week the grid confirmed: index over its average, software lower, cloud lower, chips higher from underneath. This week it split again, and the split is the sort: the index over its average and through its line, the chips through their average, software and cloud up on the week and down on Friday — which is the same two halves as last week’s grid in the opposite order.
QQQ — above the average all week on the closes, the shelf held twice, the August line taken. 721.45 over 709.95, the count intact, 746.16 and 694 both live. A week that closed on the 704 shelf twice — 704.54 and 704.72, to the cent — and never closed under it; a Thursday that took the average back by 1.7% and a Friday that took the month’s descending line. The index is 3.4% from one line and 3.8% from the other, inside a range that has now produced a shelf test and a diagonal break in the same week. That arithmetic is the whole reason this letter still expects the range to end — and the reason it no longer expects the end to be scheduled.
IGV — the year retaken for one session and lost again, and the software week was made on Monday. 104.35, +2.79%: 106.64 Monday, above the year-end line for the first time since September 3; then 105.55, 104.96, 105.78, 104.35 — four closes back under it. Red on 2026 by 1.27%, from 3.95%; 5.7% under the August high water; the 50-day 4.2% below. The read, in the words this desk used three weeks ago: September 3’s green-on-the-year close was a short-term top — and Monday’s was a second one, made on a governance story and sold into the chip bid by Friday. The release calendar that started on Labor Day is still the layer’s calendar; the pacing letter added a second kind of headline to it, one that buys the security names and sells the sellers of compute in the same session. Oracle was that session’s exhibit. The next fear leg, if it comes, comes from the same calendar and not from a print — and the two software cards that scored Tuesday are both back on the wrong side of their lines.
CLOU — toward the door again, on a Monday, and the 50-day is still the nearer line. 27.82 against the 29.11 August high, +2.54% on the week: 28.35 Monday, the best close since August, then 28.19, 28.02, 28.34, 27.82 — the same shape as software, made on Monday and given back through Friday. 4.6% under the door, 4.7% above its 50-day at 26.57. The layer bid that had it at the door three weeks ago came back for one session and left.
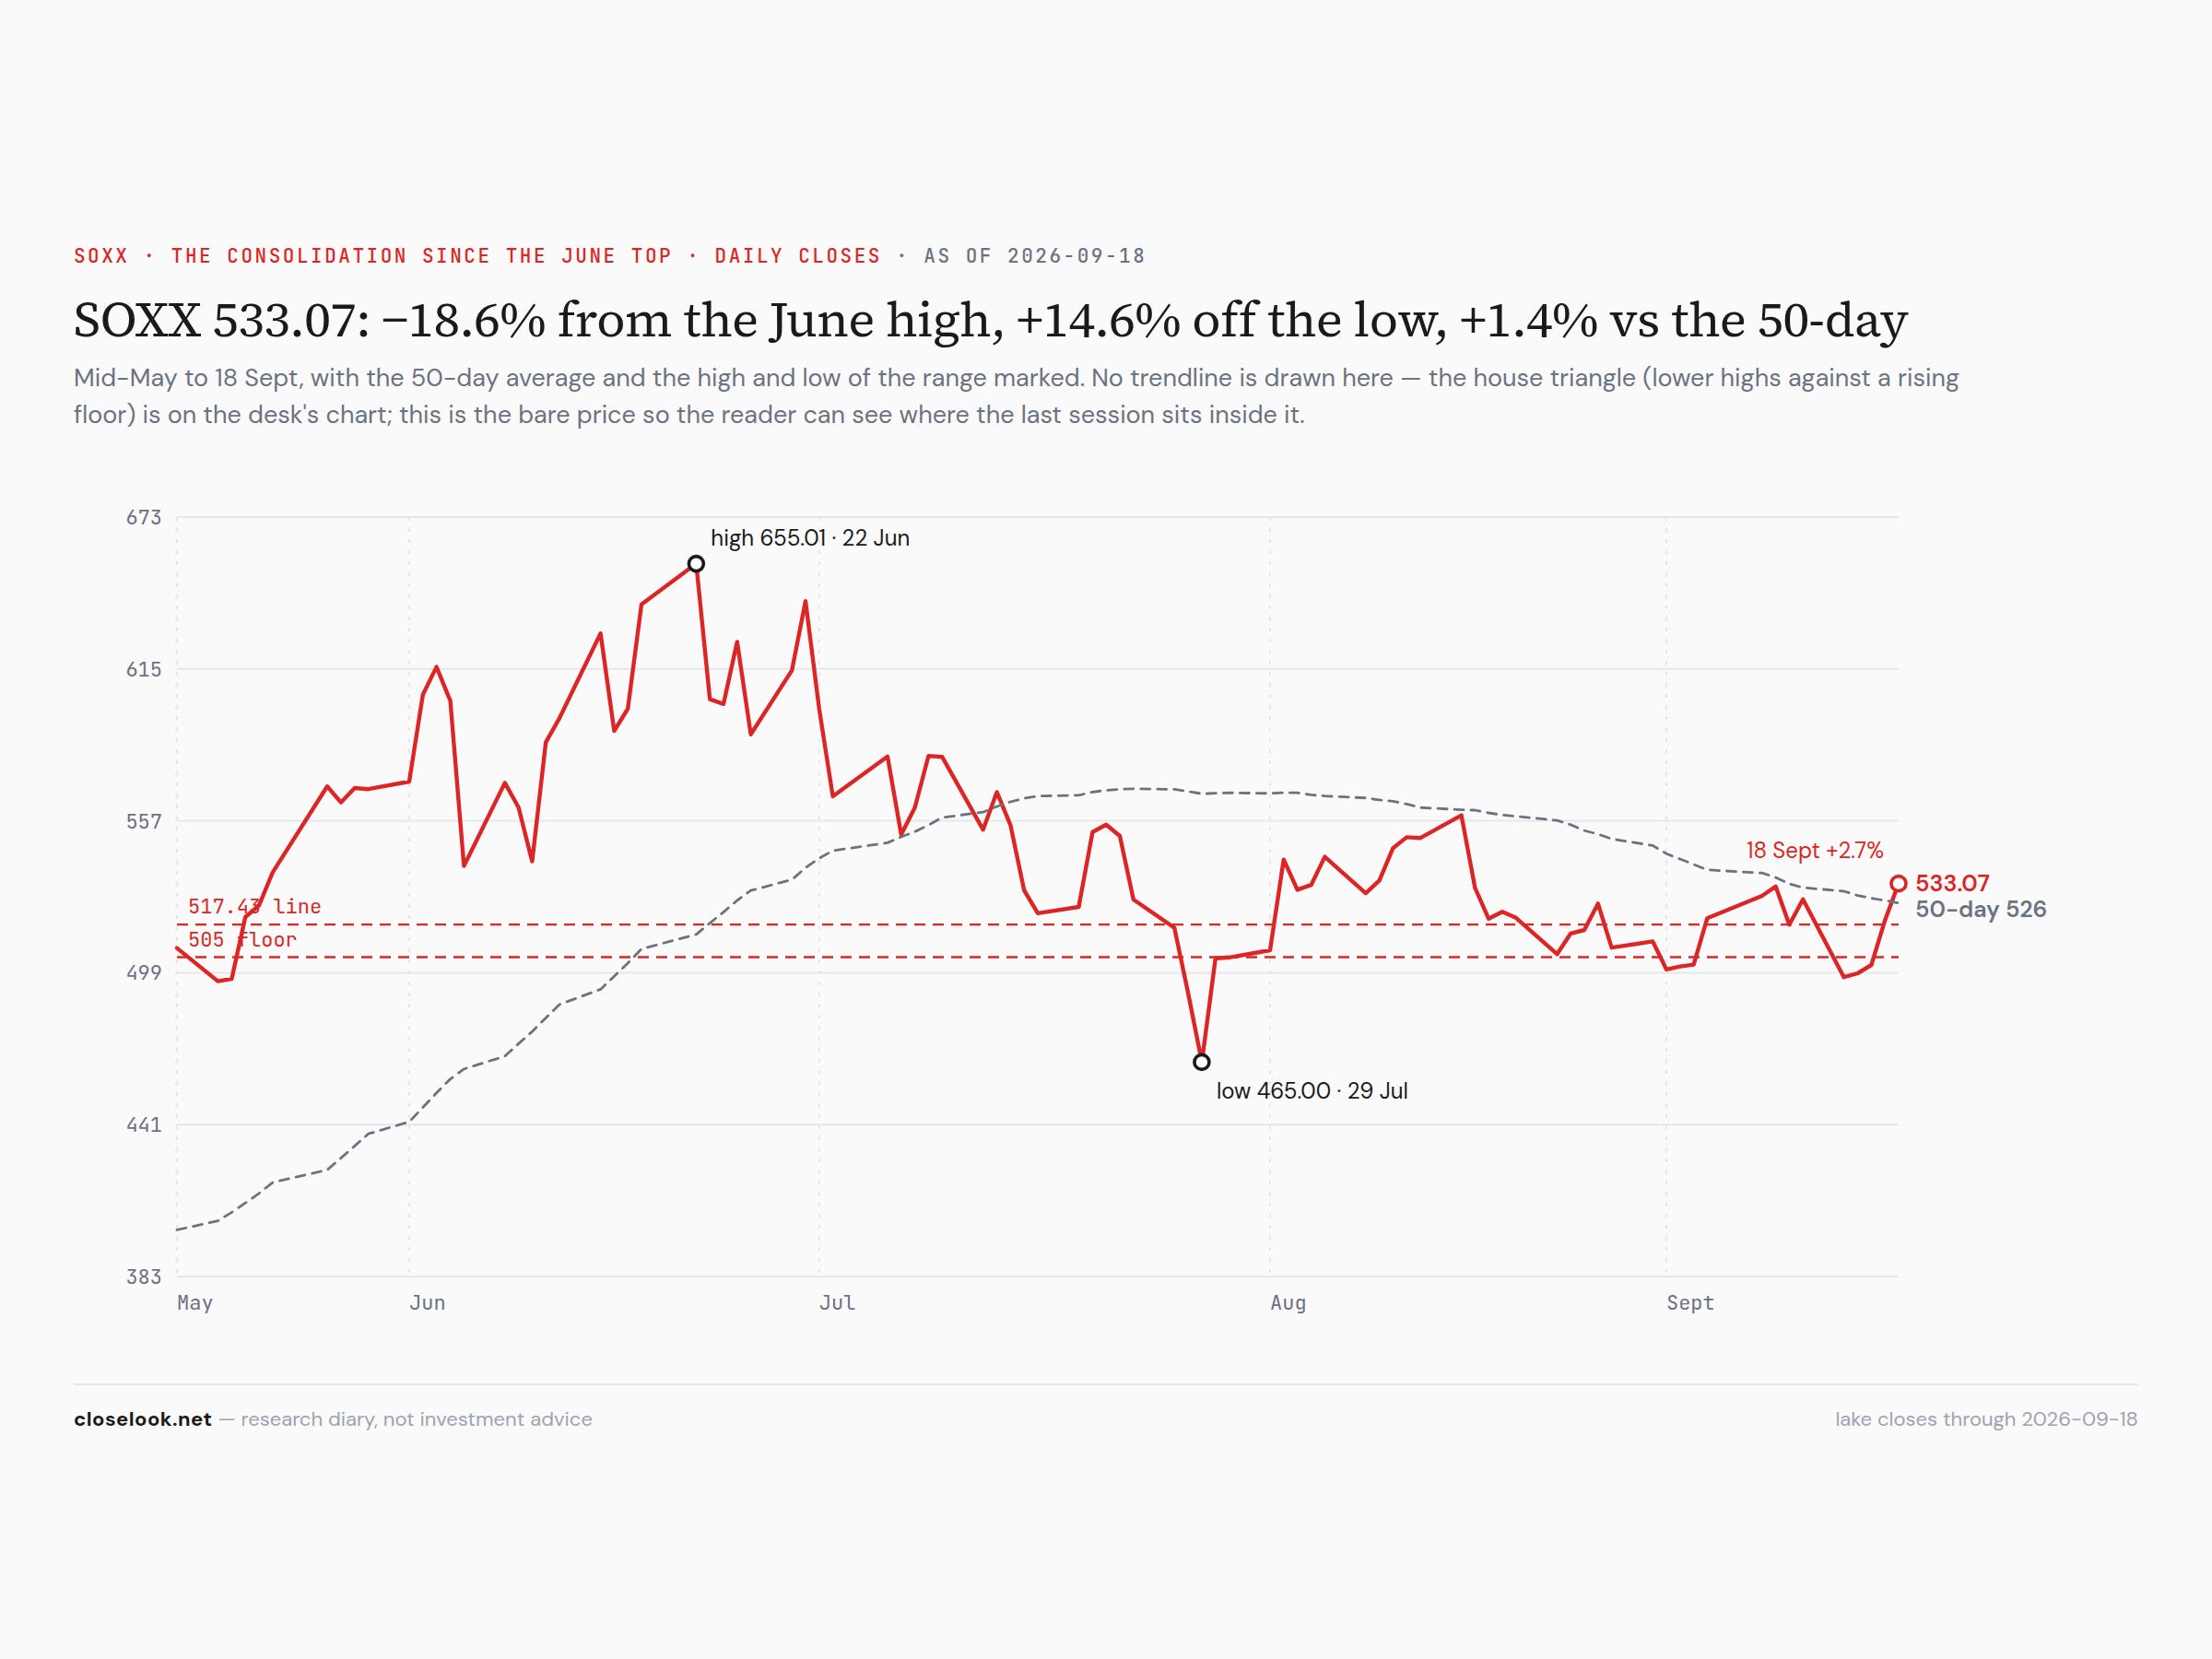
SOXX — through the average on a Friday, after losing the floor on a Monday; the consolidation ended on the chart and it ended on an expiry. 533.07, +1.14% on the week, +7.2% from Monday’s 497.40 close, +2.65% on the month on the Mag Pulse’s window. Two charts carry the read. The three-year chart in the grid below is a rising channel from last November’s low; Monday’s 497.40 was a close under the channel’s lower line for the first time since the channel formed, Tuesday and Wednesday two more, and Thursday’s 519.10 put the index back inside it. The mid-May-to-September chart is the same consolidation drawn as a triangle — lower highes from the June top, a rising floor from July 29 — and this week the index broke the floor on Monday and the upper line on Friday, in the same five sessions. The chart says: resolved upward on the weekly close — the 50-day at 525.67 reclaimed for the first time since June, the triangle’s upper line taken — with an asterisk the size of the session it was resolved on. The relative says the same thing it said last week, louder: three weeks of beating the S&P — by 1.5 points this week on a −5.6% Monday — with the memory names no longer sitting the bounce out: Micron through 1,000, SanDisk +11% on Friday, the memory vehicle back through 58. A chip index rising against the market with its memory names joining is a different leadership from last week’s, and it is the leadership of June. And it raises the question the house asks of every October, one week nearer: the leader of the spring rally — SOXX from 309.79 on March 30 to 655.01 on June 22, +111% — may be the leader again in a potential October-to-December rally. Three weeks of relative strength, the last of them through the average, is the second form of that evidence. The proof is Monday’s close.
Read the grid as one picture: the index above its average and through its line, the chips above their average for the first time since June, software back under its year after one day above it, cloud away from its door after one day near it. Last week the grid was three charts pointing down and one pointing up; this week it is two pointing up on the week — the index and the chips — and two pointing up on Monday and down on Friday. The two that the market is paying are the two it paid on Thursday and Friday, and Thursday and Friday were a bond rally and an expiry.
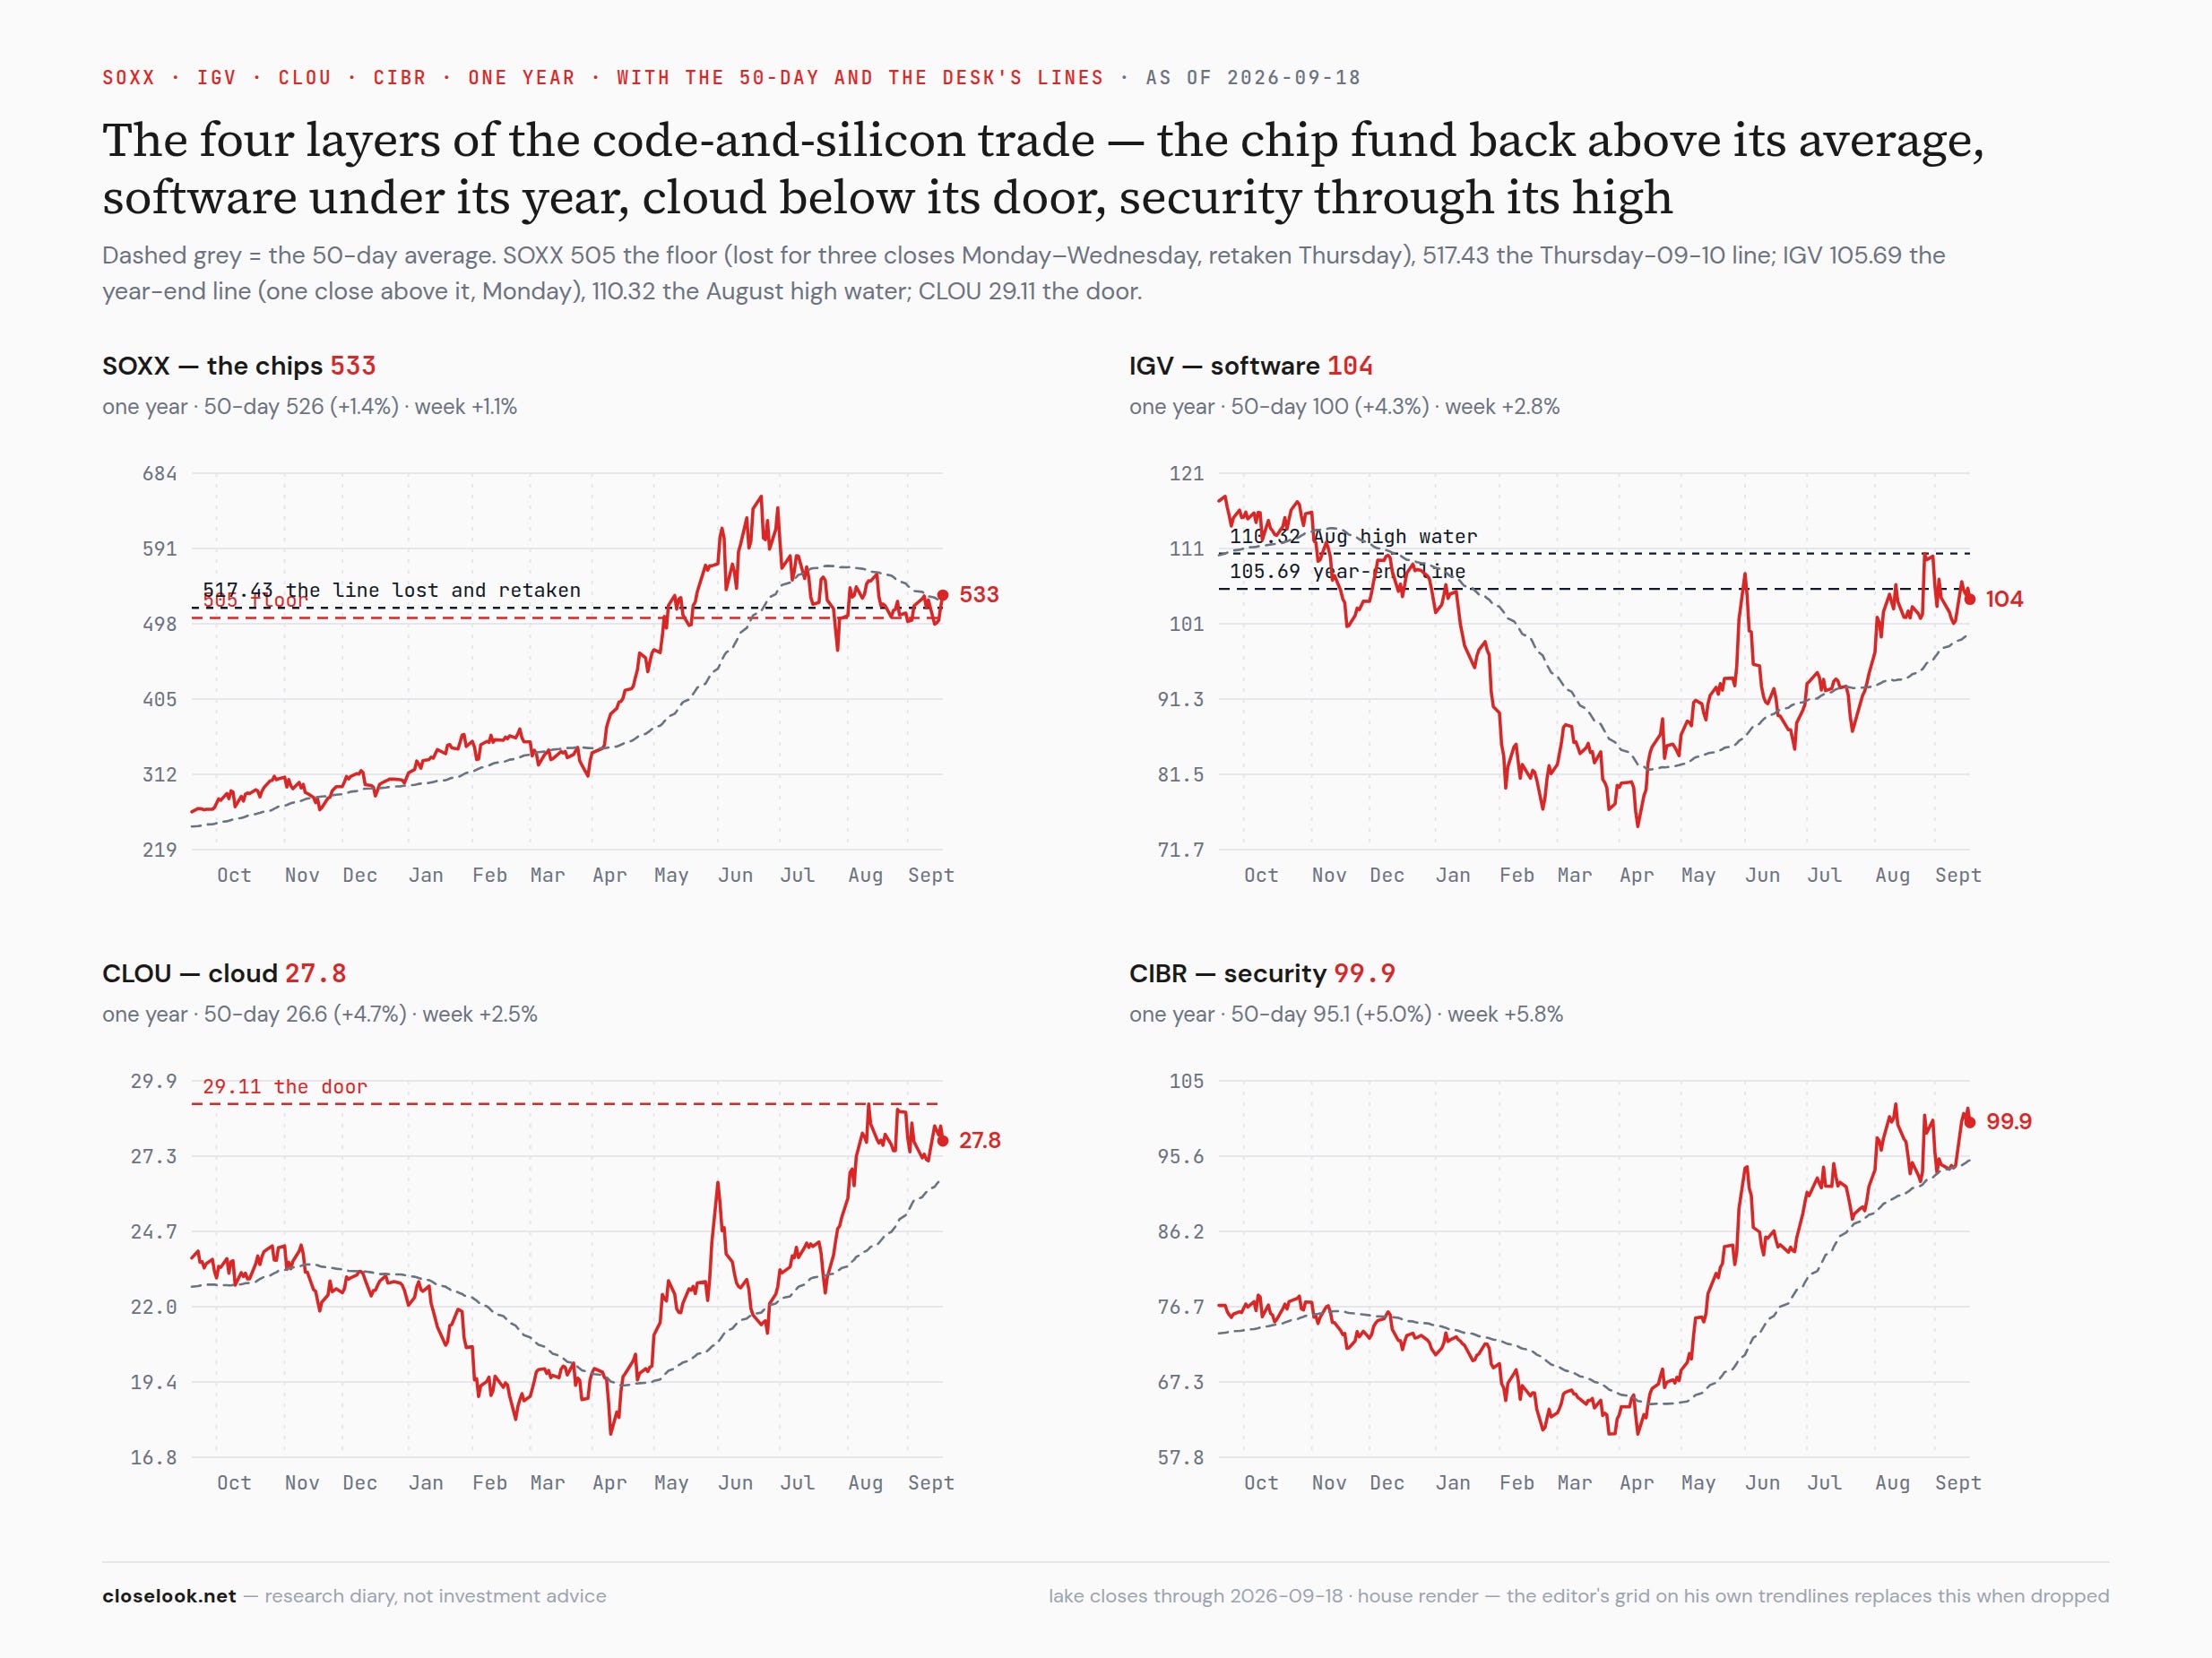
The same four layers on the desk’s own lines. The house grid runs the four funds at the window that shows their structure: SOXX on three years inside the rising channel from the November low — Friday’s 533.07 back inside it after three closes under its lower line, the first break of the channel and the first reclaim in one week; IGV on three years under the 110 line it failed at in August, with the rising line from the April low still lost and the year-end line now a ceiling that held four of five sessions; CLOU on one year above its rising line from the April low and above the 26.4 shelf, the two supports that keep the door at 29.11 in play; CIBR on three years, +5.79% on the week, off the rising line from the April low it was sitting on last week and through its August high — the security fund is the code-layer fund the sort bought. Read across: the chip fund back in its channel, the software fund under a ceiling with its trend gone, the cloud fund above its trend, the security fund through a high. Last week three of four had a line within a session of being taken; this week two of them were taken — the chips’ channel floor on Monday, the security fund’s high on Tuesday — and both went the way the sort said.
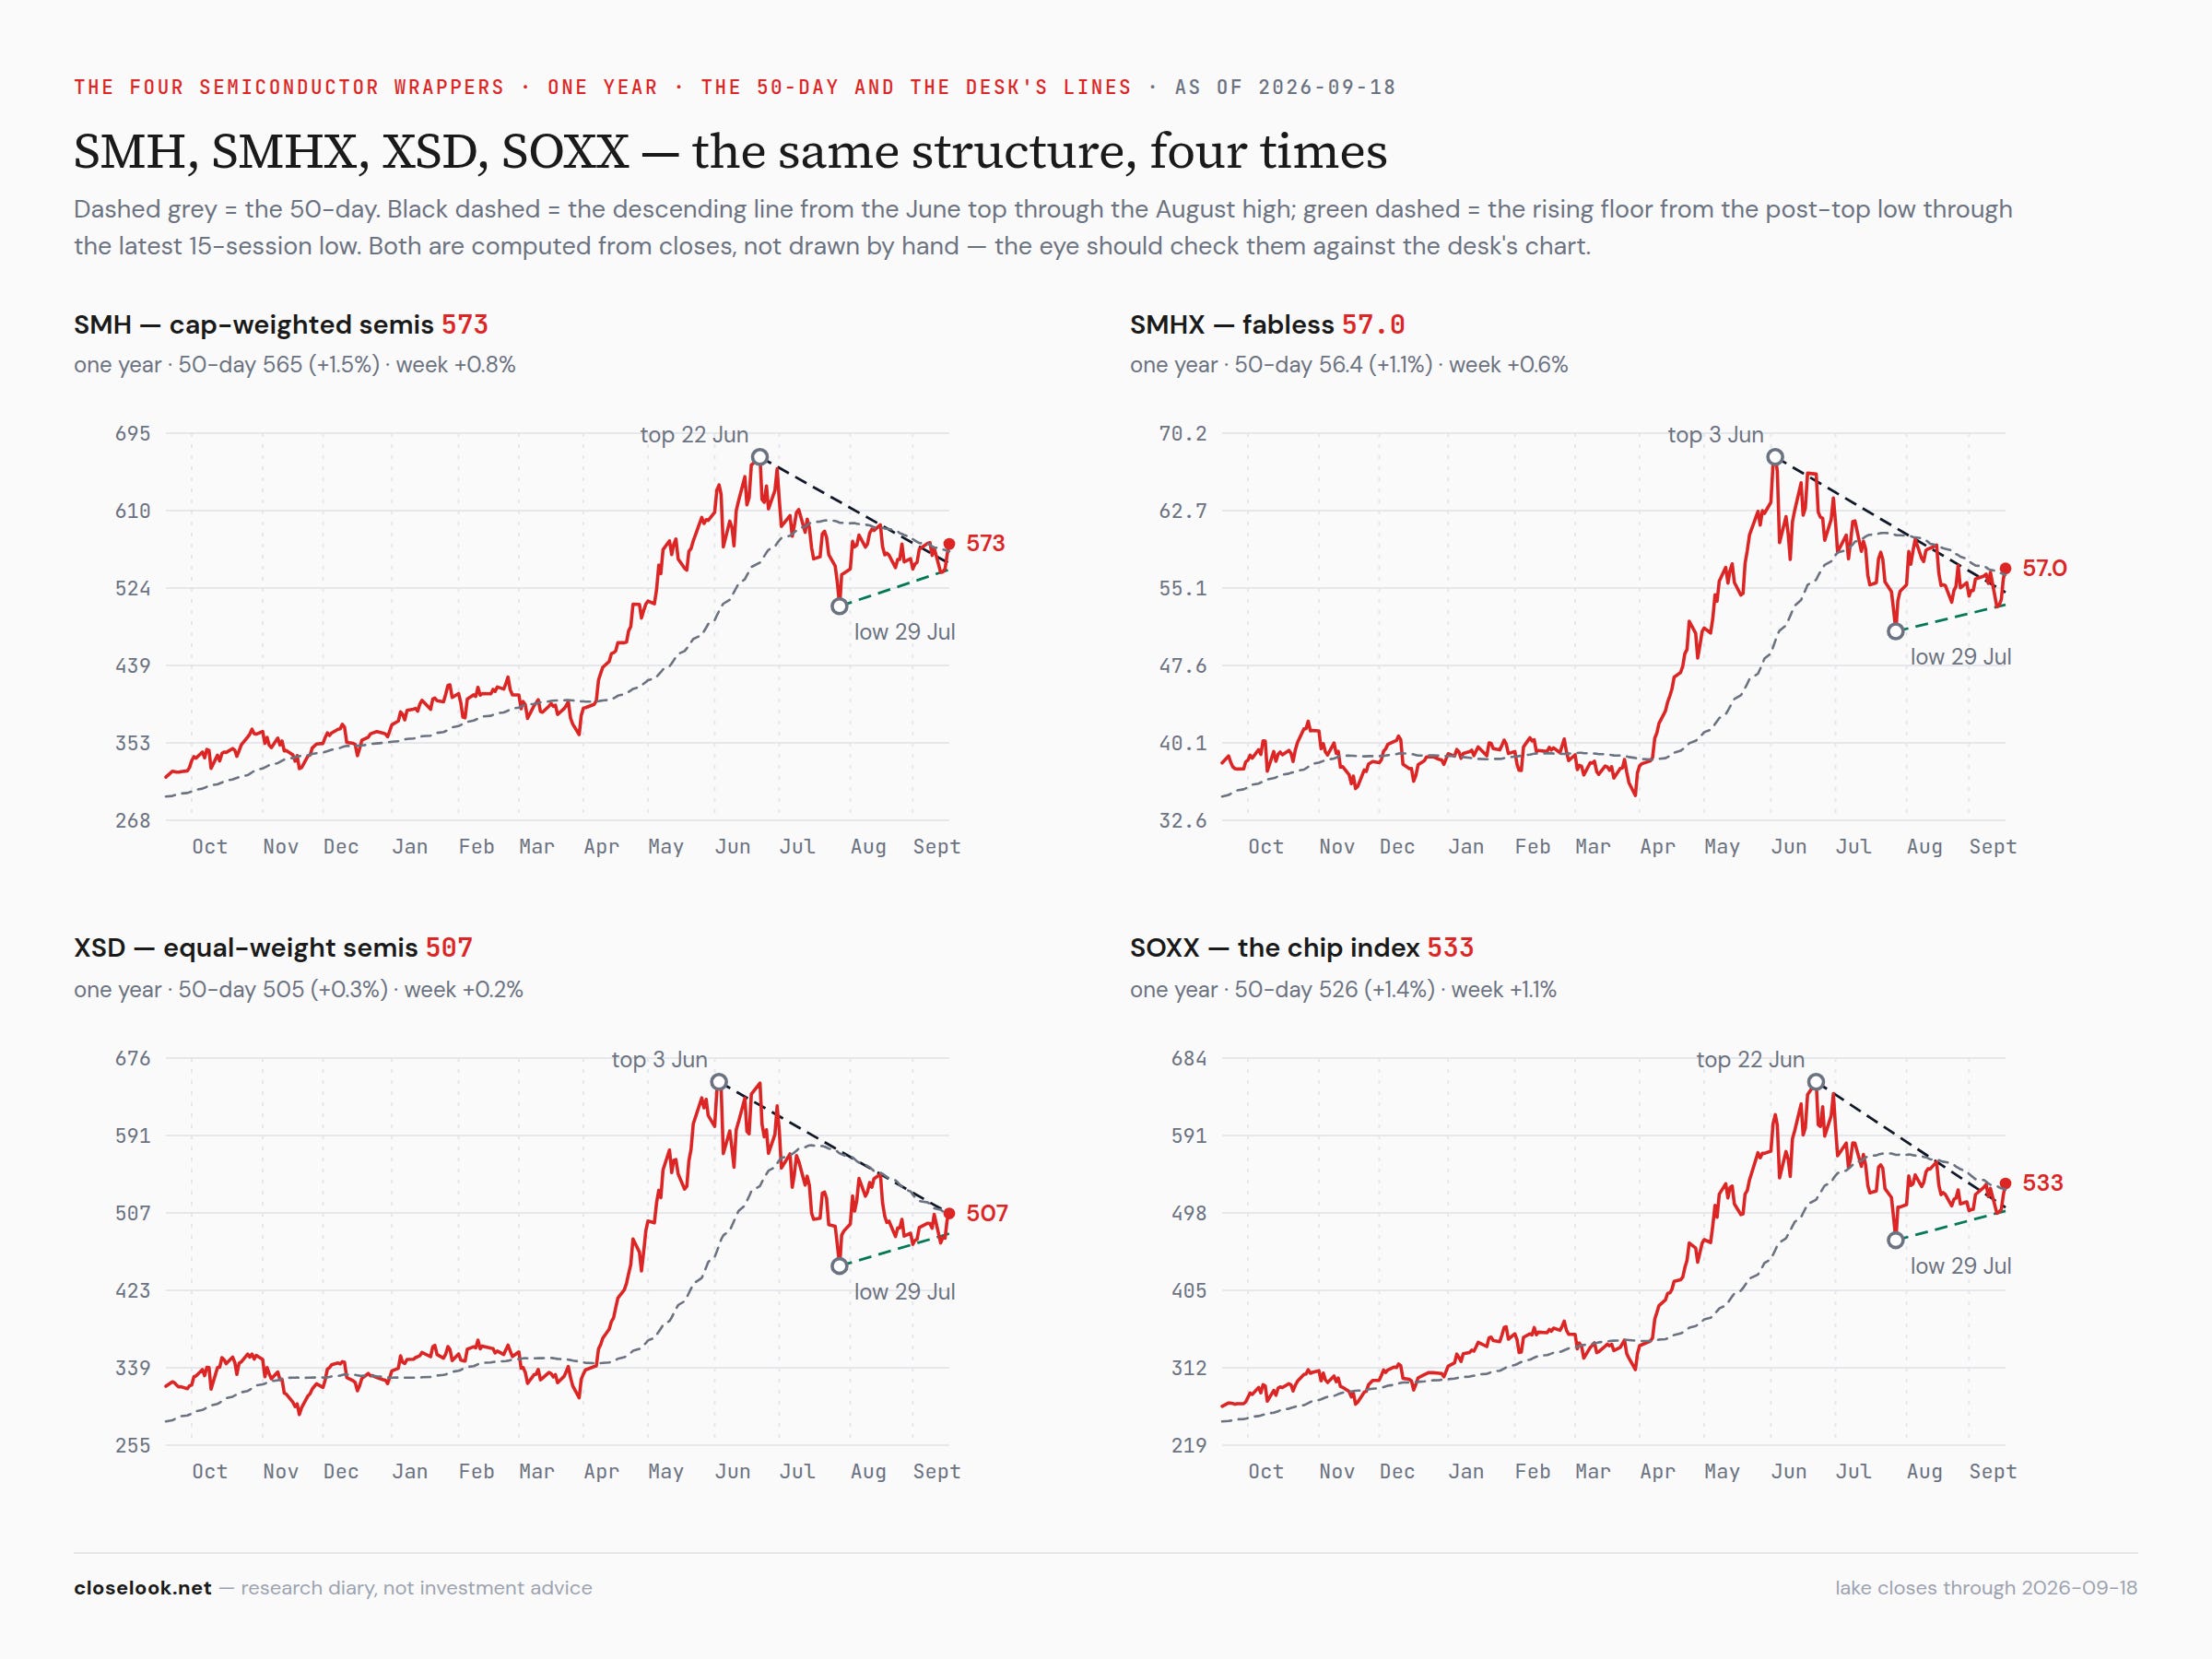
The four wrappers — the same structure, four times, and every one above its average on the weekly close. The desk’s grid puts the four semiconductor funds side by side on one year: SMH at 573.00, +0.79% on the week, 1.5% above its 50-day at 564.78 after 541.50 on Monday; SMHX at 57.05, +0.63%, 1.1% above its average at 56.41; XSD at 506.66, +0.22% on the week and +6.9% from Monday’s 474.62, 0.3% above its average at 505.36 — the equal-weight fund took its average by a dollar and thirty cents; SOXX 1.4% above. With the desk’s lines — the descending line from the June top through the August high, the rising floor from July 29, the 50-day in each — the condition from a week ago resolved: last week none of the four had closed above its 50-day on a weekly basis and all four were within a session’s move of doing so; this week all four did, and the session that did it was the last one of the week. Monday broke every rising floor in the grid; Thursday and Friday took every average. The equal-weight fund was the best wrapper on the way down on Monday (−6.1%) and the weakest on the week (+0.2%) — which says Friday’s buying was narrower than Monday’s selling: it was the memory names, the CPU maker, the designers, and the largest name in every cap-weighted wrapper up four sessions running. Four charts, one condition: resolved on the weekly close, on an expiry, with the floors broken on the way.
The three bellwethers. Nvidia: +1.82% to 222.27, from 210.96 on Monday — 210.96, 212.17, 213.90, 219.34, 222.27 — the only megacap up every session from Tuesday, from 10.5% under its record close to 5.7% under it. The derivatives book’s December-2027 160/320 spread rides it with fifteen months of runway and the stock is 39% above the lower strike. The memory pair: Micron +4.16% to 1,015.80 — its first close above 1,000, on Friday’s +3.9% — SanDisk +9.70% to 1,791.82 with an 11.0% Friday, Western Digital −1.30% to 441.36 after a +4.1% Friday — the reverse of last week’s −4.07%, −6.13%, −4.34%; the storage sub-index +2.79% on the week after −3.52%; and on Friday, the session in which the whole chip complex was bought, the memory names were bought most. Last week the flow was right and the price followed it down; this week the price led and the ledger has not yet caught up — the directional-flow scan’s heat list is software (Atlassian at the top) and its cooling list has the optics name Applied Opto at the bottom, and neither memory name is on either. Saturday’s letter carries the Korean half — SK hynix −1.35% on the week in New York after +6.0% in Seoul on Friday, the wrapper owed a session. HPE: −2.14% to 60.76, after +19.40% a week ago — the hardware name that was paid twice gave a tenth of it back on a week its layer was sorted; the card’s window is closed and the next print is December 3. The rule’s exhibit in the direction the market is paying, one week on: the physical layer’s names were sold on a demand story and bought back on an expiry, and the one that had been paid most was the one that gave back.
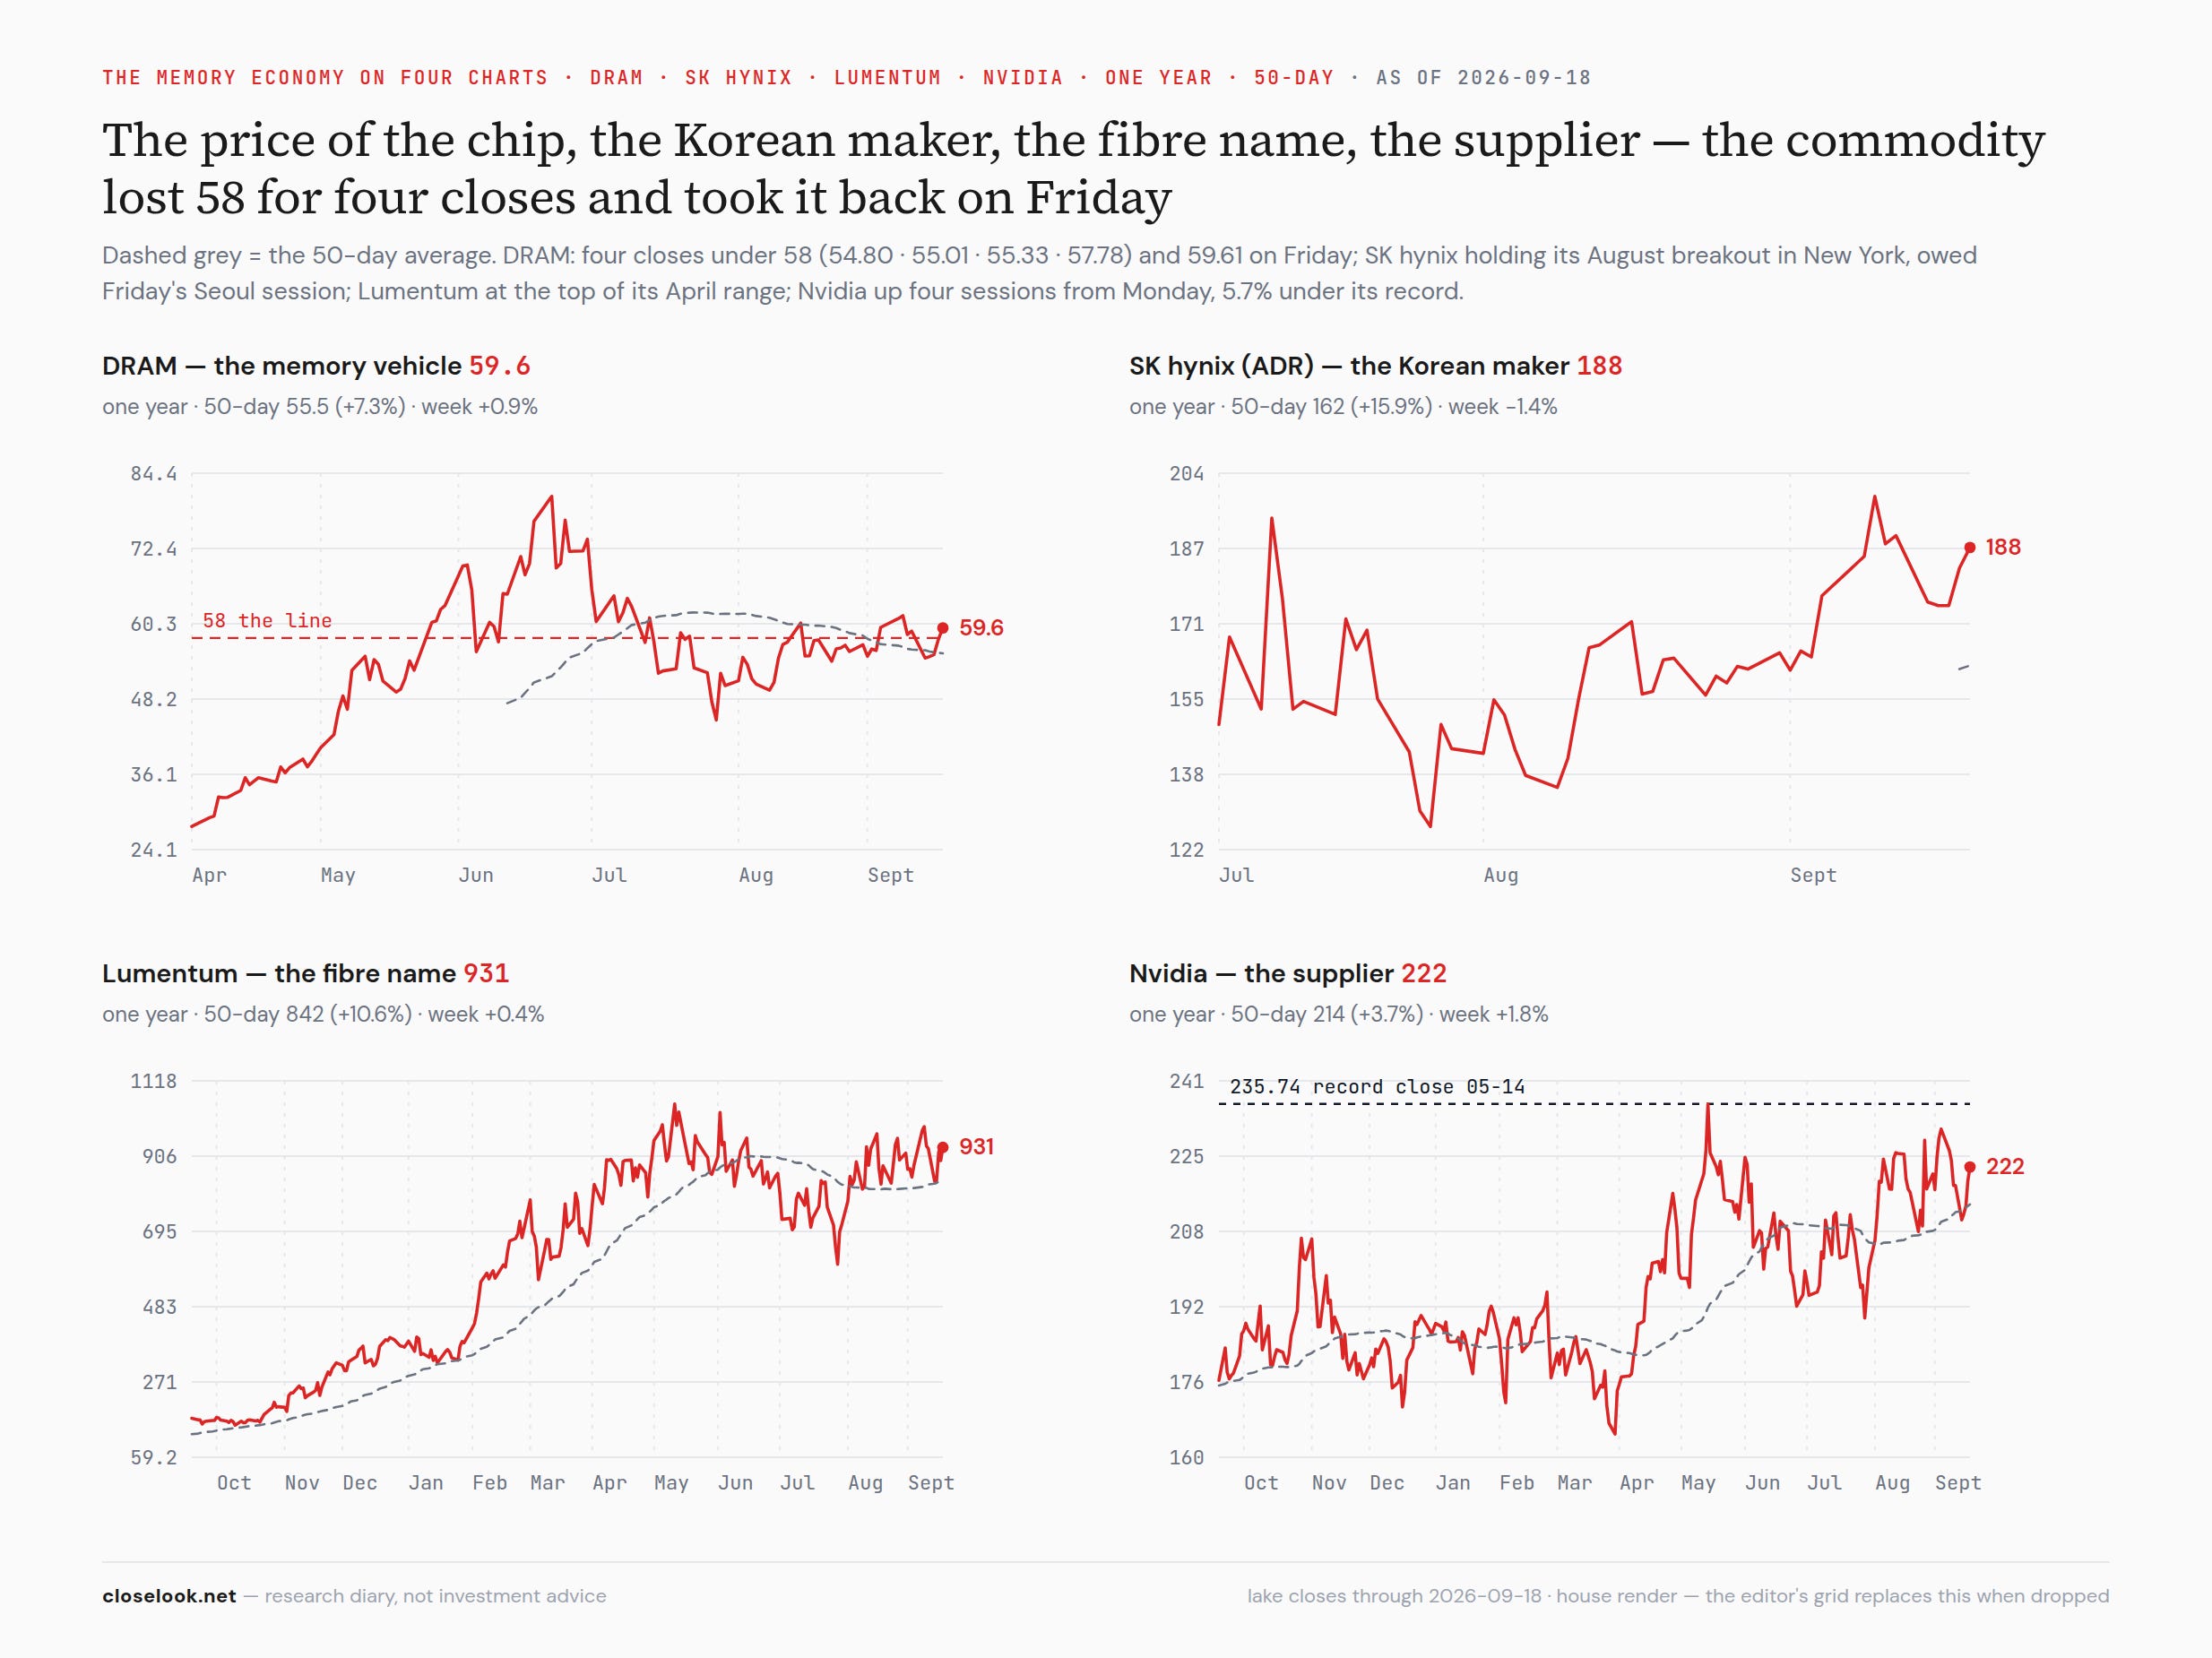
The memory economy on four charts — the price of the chip, the Korean maker, the fibre name, the supplier. The house grid: the DRAM contract price at 59.61, +0.86% on the week and about +115% on the year, after four closes under the 58 line — 54.80, 55.01, 55.33, 57.78 — and a 3.2% Friday back through it; SK hynix at 187.50, −1.35% in New York, holding its August breakout on the weekly close after Monday’s −7.6% and owed Friday’s Seoul session; Lumentum at 930.91, +0.42%, at the top of the range it has held since April after a +4.2% Friday; Nvidia at 222.27, above the rising line from the April low and 5.7% under its record. Two of the four held their breakouts through a sort that took the commodity under its line for four days; the supplier was bought four days running; and the commodity underneath all of them lost its line and took it back inside one week. The memory economy is still being repriced by name and by geography — but this week the price of memory moved too, both ways, and finished where it started. Section 6 says what a second loss of 58 would mean.
5 · The AI Build-Out Portfolio
▤ Portfolio table as published — the live book is at /portfolios/ai-buildout/.
The book, marked — up two and a half percent on a week the index fell, and not traded. The AI Build-Out book’s equity lines closed Friday at a market value of about $575,131 — the engine mark, units against Friday’s closes — +2.57%, or about +$14,404, on the week. The cash line stands near $128,600 on the fixture; net liquidation by the engine mark is about $718,000 (last week’s $704,000 plus the week’s line change; the weekly USD export is pending and will replace the approximation), a headline return of about +43.7% on the $500,000 deposited, from +40.8%. No transactions: two dividend reinvestments — 0.03 units of Alphabet on Monday and 0.09 units of Qualys on Tuesday — and nothing else; the trade log shows the last fills as September 4’s tools. Saturday’s Pulse carries the equity books’ ledger for the week — Hypergrowth bought Nebius back thirteen dollars cheaper and wrote four calls, the derivatives book closed its Cloudflare put — and this book, which owns the stack from the tools to the governance layer, sat still through a sort that ran through every layer it owns.
What paid and what charged — the governance names, the diagnostics names and the Chinese assembler paid; the fibre name, the Korean conglomerate and the tool makers charged. The payers: Tempus +31.9% (+$3,766, the book’s best line — the applications index’s best name), Rubrik +23.2% (+$3,009, the security-and-recovery name the sort bought), Lenovo +15.2% (+$2,567), Natera +12.3% (+$2,023), Cloudflare +5.6% (+$1,280), the cybersecurity fund +5.8% (+$1,095), DigitalOcean +5.9% (+$1,078), Palantir +6.2% (+$1,041), ASE +5.5% (+$871), SanDisk +9.7% (+$792), Datadog +3.9% (+$653), BlackBerry +4.2% (+$640), Coherent +3.9% (+$600), Samsara +3.1% (+$468), Alphabet +2.7% (+$449), Nvidia +1.8% (+$399). The charges: Corning −9.8% (−$1,629, the book’s worst — two weeks after it was the book’s third-best), Samsung −6.1% (−$906), Qualys −5.0% (−$794), Infineon −4.3% (−$722), Tokyo Electron −3.3% (−$561), MKS −5.7% (−$457), BESI −2.1% (−$370), Kulicke & Soffa −3.5% (−$299), SK hynix −1.4% (−$257), Broadcom −1.2% (−$220), Siemens −1.0% (−$181), Western Digital −1.3% (−$116), Nebius −0.5% (−$76). Twenty-two lines green, fourteen red, and the split is the letter’s: the names that govern, secure and diagnose paid the book; the names that make the tools and the glass charged it. Last week the payers were the fibre, the Korean memory and the power names and the charges were the tools and the American memory; this week the American memory paid, the Korean memory charged, the fibre name went from best to worst, and the tools charged again — a third consecutive week, including the three bought on September 4.
The watch, scored — “the book would add to the tools, not the memory, ahead of the flow” was the wrong side of the week, and the book did not add. Last week’s watch was the memory-and-storage complex leading by price with the ledger draining, and the discipline was the tools over the memory. This week the memory was bought — Micron through 1,000, SanDisk +11% on Friday — and the tools were sold a third week, including on the Friday the equipment names rose six and seven percent: Applied Materials, Lam and KLA finished the week down two to three percent each despite their Friday, and the book’s Tokyo Electron, BESI, MKS and Kulicke lines all charged it. The watch resolved as a non-payment on the discipline and a payment on the names the discipline had declined — the book owns both, which is why it was up two and a half percent on a week its discipline was wrong. The new watch is the letter’s: was Friday a close or an expiry. If Monday holds the memory vehicle’s 58, the chip index’s average and the S&P’s line, the tools are the layer with the most catching up to do and the book’s three September-4 fills are the cheapest way it owns that. If Monday gives them back, the memory names that led on Friday are the ones with the most to give.
What we plan to do — nothing on Monday, and act on Monday’s close. No central bank, no print this letter scores before Micron, no expiry until October. The core is not for sale after a catalyst that the market bought; the increments do not go to work on an expiry Friday’s close either. The book’s rule for the week is the one it wrote for the month — act on the close, not on the day — and this week the close that matters is Monday’s, with the expiry’s positions released and nothing scheduled to replace them. If that close holds Friday’s lines, the increments go to the tools, which are the layer the sort has not yet paid; if it loses them, the book waits for the order book on the 30th with its cash intact. Either way the book acts on a close that is not an expiry.
The four tradable books, open for inspection. Alongside the reference portfolios on this site, the four Closelook-companion wikifolios — the tactical book, the AI-cycle thesis book, the ETF core, and the non-tech growth compounder — publish their own ledgers on the wikifolio platform, every transaction visible trade by trade, via Trade the Look. Same diary, harder currency. A research diary made investable for its author; not a recommendation.
6 · What May Go Wrong
One: the chips’ Friday was the sort’s expiry, not its resolution — the caveat on the constructive read, and the only one that prints on Monday. Monday sold the physical layer on a demand story and bought the governance layer on the same story; Friday bought the physical layer back on a quadruple-witching session, with the equipment three joining on the last day and the memory vehicle reclaiming its line on the last close. An expiry session is a session in which positions are closed, not opened. If Monday gives back the memory vehicle’s 58, the chip index’s average and the S&P’s 757.83, then Friday was the sort’s expiry and the week that ends with Micron’s order book starts with the physical layer’s lines lost a second time. The house opex index’s +14% security week does not reverse on Monday either way; it is the only part of the sort that was bought and held through the week.
Two: the second hike is the one the curve has not paid for, and it has no date. The Fed delivered the hike the curve had priced and signalled another before year-end; the five-year rose 6.5 basis points on the week, the ten-year closed above five percent once and a fraction under it on Friday, and the belly made its low on the decision. The market bought the delivery. It has not priced the signal: the belly’s sixth failure at a new low says the pricing has started, and a seventh at a lower low says it is done. A scheduled catalyst can be sold into and bought on; an unscheduled one is sold on every data point that argues for it. The falsifier is stated: IEF under 90.73 on a weekly close with the ten-year above five percent on a Friday is the second hike being priced, and the 694 line is 3.8% away.
Three: the axis has reached its stated limit, and the letter that set the limit has to honor it. Four consecutive weeks of tech over its ex-tech cuts; the ex-tech Nasdaq negative on the year at the floor of a year-long range; the equal-weight index −3.4% on the month; financials with 17% of members above their 50-day; industrials with 11%. The house frame for October is a resolution up or down, and the down version is already drawn in everything that is not technology: it is a market whose index is held 2.1% from its high by one sector on its trend, one basket 0.7% from its record, and one chip complex that just took its average on an expiry. If technology loses a week to its ex-tech cuts now, the axis is back and the down version has its confirmation; if it wins a fifth, the leadership is narrower than it has been since June, and narrow leaderships end in one session.
Four: bitcoin through 80,000 on a hike is either the funding side saying the carry is back, or the last liquidity trade before it is not. The coin +5.9% on the Bank of Japan’s Friday, through 80,000, into the upper half of its zone; gold flat on the week and under its line; the pair ratio turning toward the coin. The bull’s insurance, Saturday’s pulse called it — a yen that fell on its own hike keeps the corridor funded and the liquidity asset bid. What reverses it is not a third hike; it is the ministry of finance answering 157, or a growth shock that closes the differential from the American side, and the two precedents — August 2024 and 2007–08 — were both carry unwinds that started with a currency and ended with a stock index. The falsifier is the coin’s own: a weekly close back under 77,000 with the yen under 155 is the carry loop closing, and the assets it funded — the corridor’s wrappers, the chips, the basket — are the ones that are sold to pay for it.
Five: the consumer is still the leg the tape has not priced, and this week the consumer’s own index said so. The applications index’s consumer sleeve −3.52% and its endpoints −4.58%, now −20.9% on the year; discretionary −1.71% and −5.4 against the index on the month; the restaurants — Chipotle, CAVA, Dutch Bros — on the family’s worst list; Booking −3.5%, the cruise line −5.5%. The structural-inflation gauge reads “contained” on nine buckets and hot on the one that measures what people expect, and the Fed just hiked into it with a second one signalled, into a consumer whose gasoline was a third of the last CPI and whose sentiment printed at its weakest since May. A consumer that stops on a hike-plus-hike combination is a leg down that does not show up in the AI stack’s ratios until it shows up in the hyperscalers’ guides — and the first of those is a month away.
Each of these has a falsifier that prints within a fortnight — most of them within one, and one of them on Monday. The book acts on prints, not on the fear of them.
7 · Knowledge Corner
Quadruple witching — why an expiry Friday’s close is a weak witness, and what the house does with it. Four times a year — the third Friday of March, June, September and December — four kinds of derivative contract expire on the same session: stock-index futures, stock-index options, single-stock options and single-stock futures. Every open position in those contracts has to be closed, rolled or exercised by the bell, and the closing does not care about the business: a dealer who sold call options on the chip index in July and hedged them by holding the chips has to sell those chips as the calls expire, and one who sold puts and hedged by being short has to buy them back. The result is a session — this Friday was one — in which volume runs two to three times normal, the largest prints of the day cluster into the last hour, and the closing price is set by the mechanics of positions leaving the market rather than by anyone’s view of Monday. That is why this letter calls Friday’s close a witness rather than a verdict. Three of the lines this letter carries were retaken on Thursday, on a bond rally, and one — the chip index’s fifty-day average — was taken on Friday, on the expiry; the first three have a reason, the fourth has a mechanism. The house rule is simple and old: a level taken or lost on an expiry Friday is confirmed by the next session’s close, not by the expiry’s, because Monday is the first day the positions that set Friday’s price are gone. The same logic runs the other way on the pinning effect — prices gravitating toward strikes with large open interest into the bell, which is why the S&P closed within a dollar of Thursday’s level and the Nasdaq 100 at a round-looking 721 — and it is the reason the memory vehicle’s reclaim of 58 on a 3.2% Friday is on Monday’s docket rather than in Friday’s ledger. The framework side lives in /101/market-regime/; the vocabulary in /glossary/covered-call/ and /glossary/cash-secured-put/.
8 · Final Words
The Fed raised rates for the first time since 2023 and the S&P finished the week a third of a percent lower, inside the range it has held since June. Underneath it, the week sorted the AI trade twice — chips sold and software bought on Monday’s letter, chips bought and software sold on Friday’s expiry — put the ten-year through five percent on a close and back under it, made a new low in the belly on the decision and a five-cent reclaim in the long end, and sent bitcoin through 80,000 on the second hike while gold did nothing. The chip complex closed above its average for the first time since June. The megacap basket confirmed its shelf and sits 0.7% from its record. The ex-tech half of the Nasdaq 100 is negative on the year for a second week, and tech has now beaten it for four — the limit this letter set. The print record split: Adobe paid, Oracle sold.
The house reads that constructively, and says so: a market that makes its low on the hike and buys the hike for two sessions has held its test — the chips through their average, the factor gauge at the 97th percentile, the index through its August line, the liquidity asset through 80,000, and the yen weaker on Tokyo’s hike, which keeps the carry trade in place and the one mechanism that has ended two bull markets from the side out of the picture. Thursday’s Pulse said moderately but durably higher US rates may have just saved the bull; this week’s tape is the first evidence for it. The caveats are real and they are narrower than the read: the chips’ reclaim was an expiry’s, everything that borrows money sits at the bottom of every board, and the everything-else trade is at the floor of a year-long range. The chart says the range survived its catalyst with its floor tested twice and its diagonal taken, that every equity line is live, that one bond line came back by a nickel, and that the next catalyst has no date. The house says: the bull held its test; the resolution is still coming; October is the month that usually settles it; and the first honest witness for the chips is Monday’s close.
Price is the only truth. This week it paid the governance layer and the liquidity asset, sold and rebought the physical layer inside five sessions, charged everything priced on the discount rate, took the ten-year through five and gave it back, and moved the index less than the argument underneath it — for a fourth week. The base case from here is unchanged and scoreable — about five percent of September consolidation, two fifths delivered on this index with two weeks left, anything better constructive — and this week was better: the test was taken and held. One line revised: it resolves, and the thing that resolves it is no longer on the calendar.
The Closelook letters — where this one sits. The house thesis, compressed: the stock market is a growing system at the aggregate level in which most constituents slowly fade while a small group massively outperforms — and that group changes dynamically; it never stays static. Own the aggregate, know the current winner group, watch for the rotation. Right now the winner group is the AI stack, and the live question is which of its layers — building, operating, using — earns the next leg; this week the market answered “operating, on a letter, and building again by Friday”. Three letters read that question at three altitudes: Closelook@Global Stock Markets (Saturdays) follows the geography of the money — regions, cross-asset, the core thesis owned through ETFs. Closelook@US Stock Markets (Sundays) reads the tape — the four-layer AI thesis at sector and index degree, the levels, the print records. Closelook@Hypergrowth (Sundays) reads the names — four growth buckets, the flow ledger, the tactical sleeve. Same market, top down. This is the tape altitude.