


Underneath that flat surface, twelve points of regional dispersion: Korea +8.2%, Brazil −4.0%. And both quiet tells turned against the tape on Friday.
1 · This Week’s Action
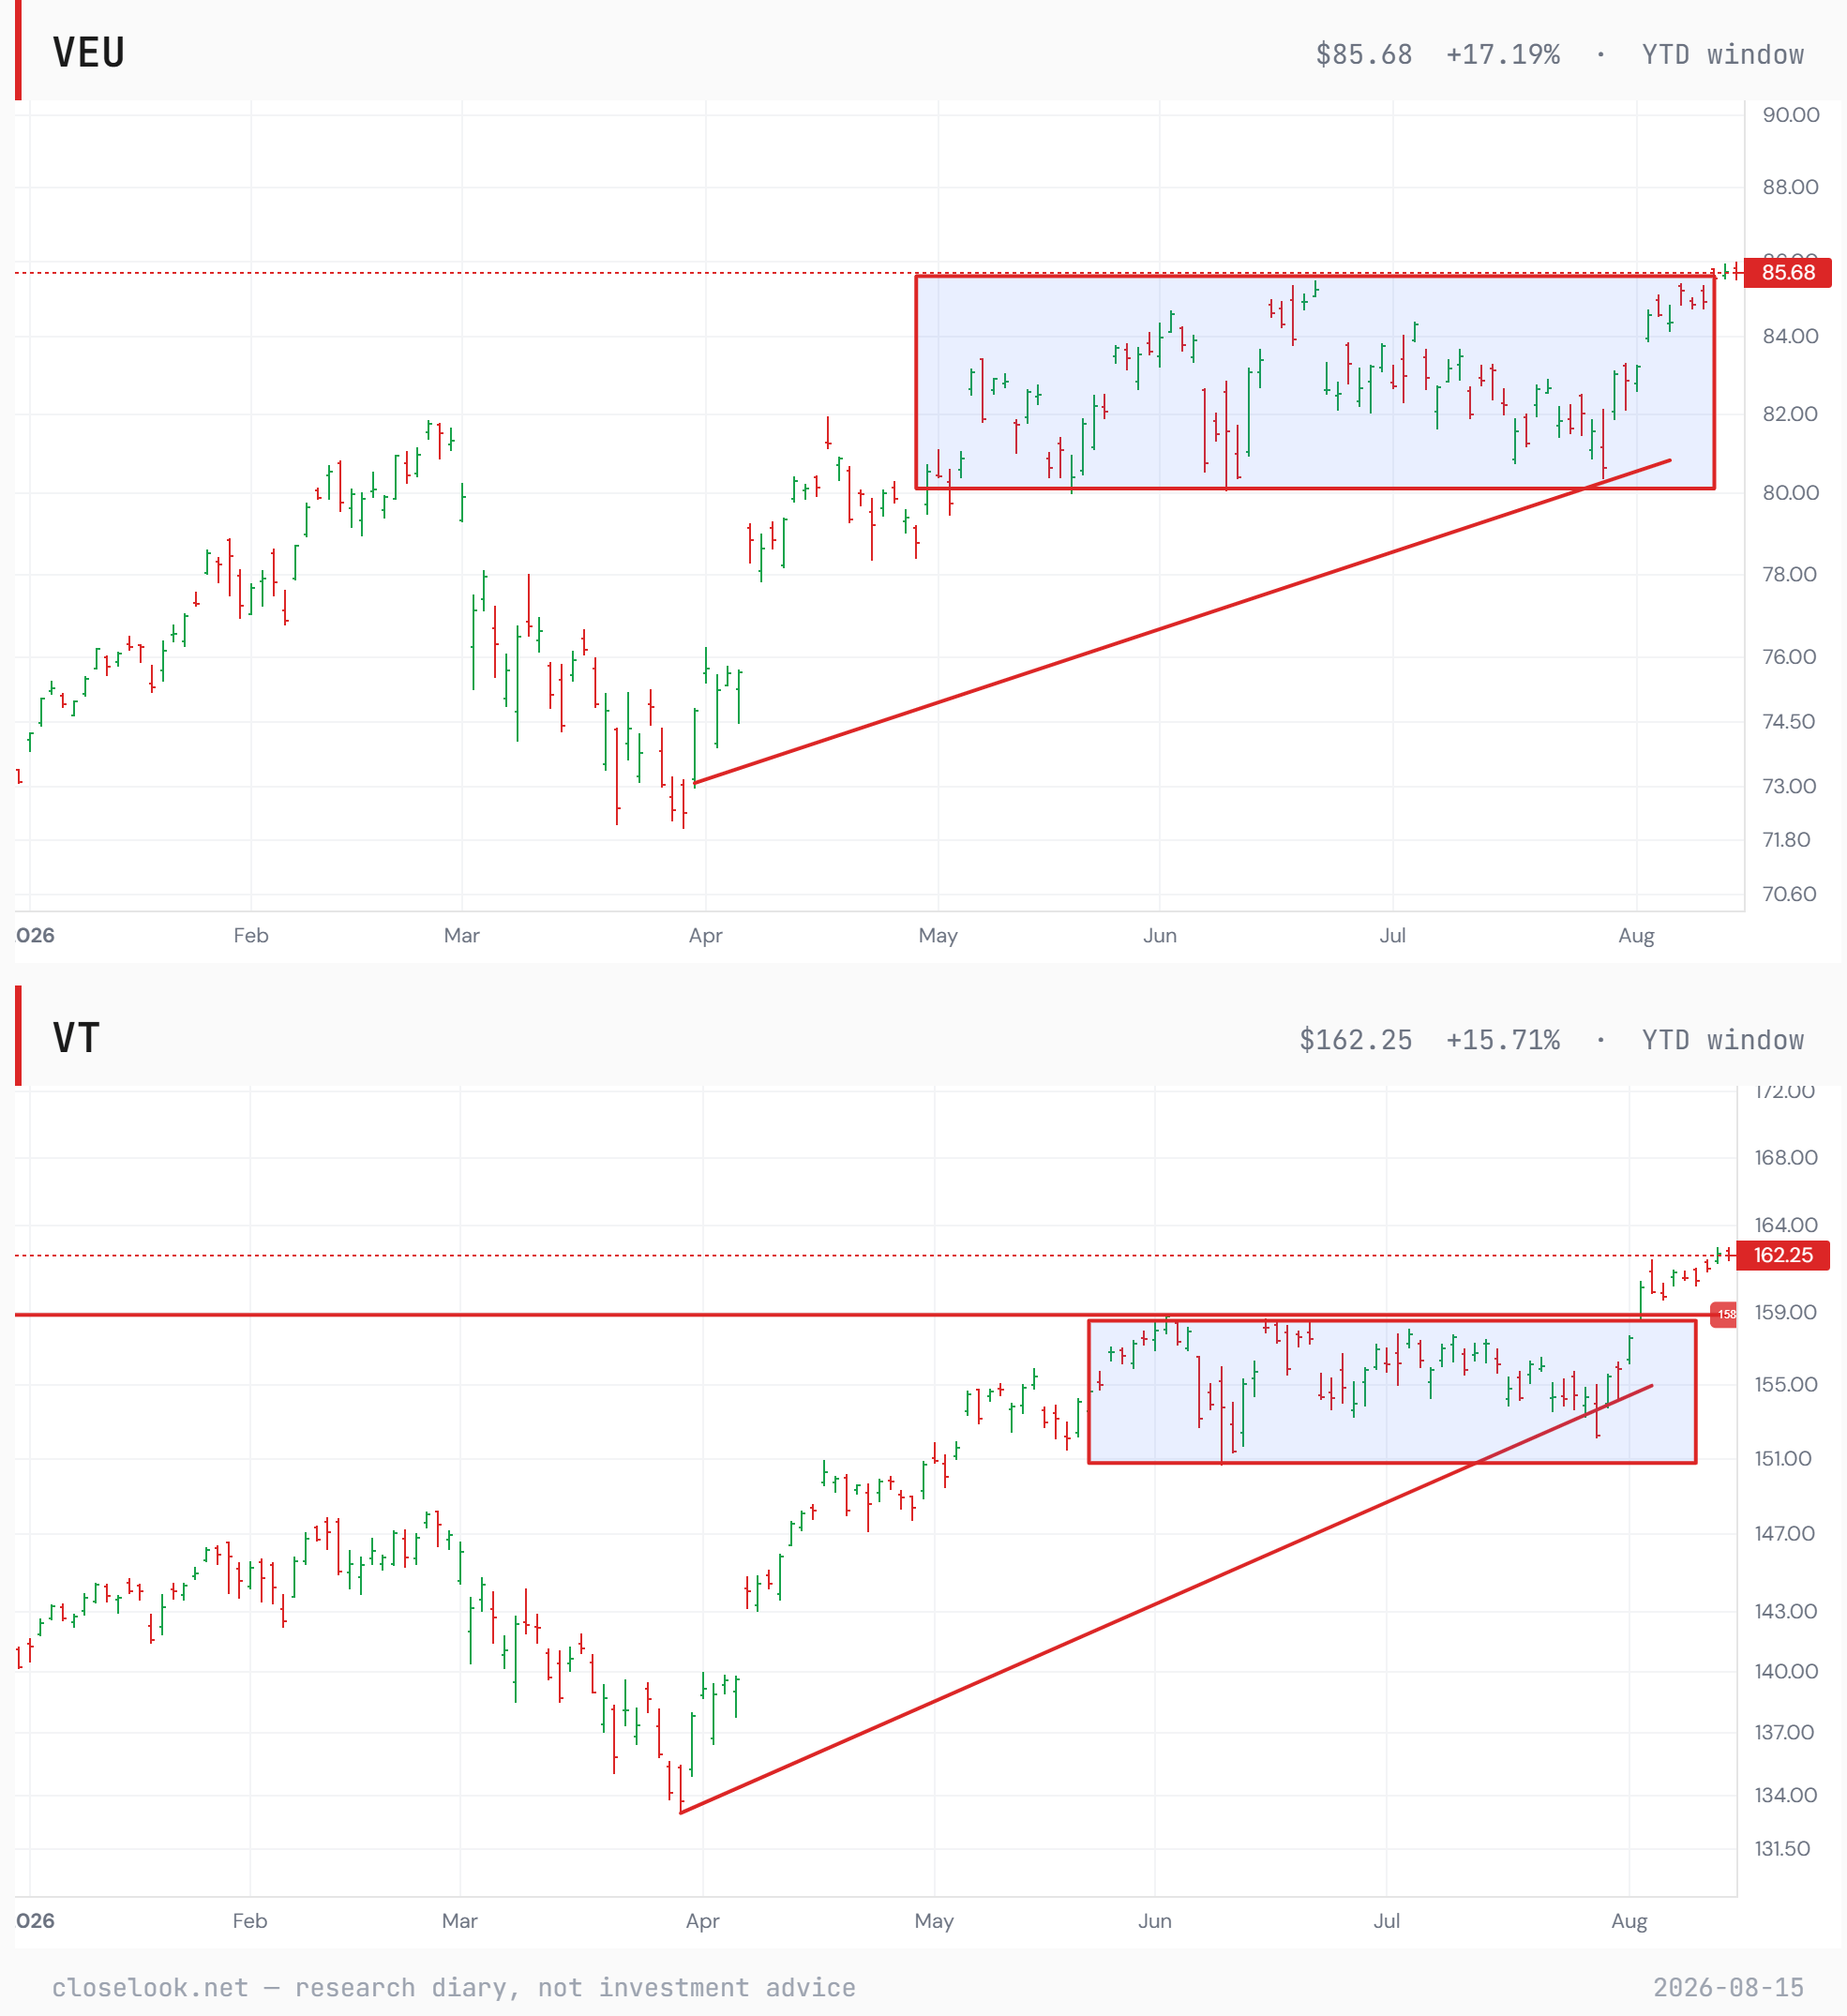
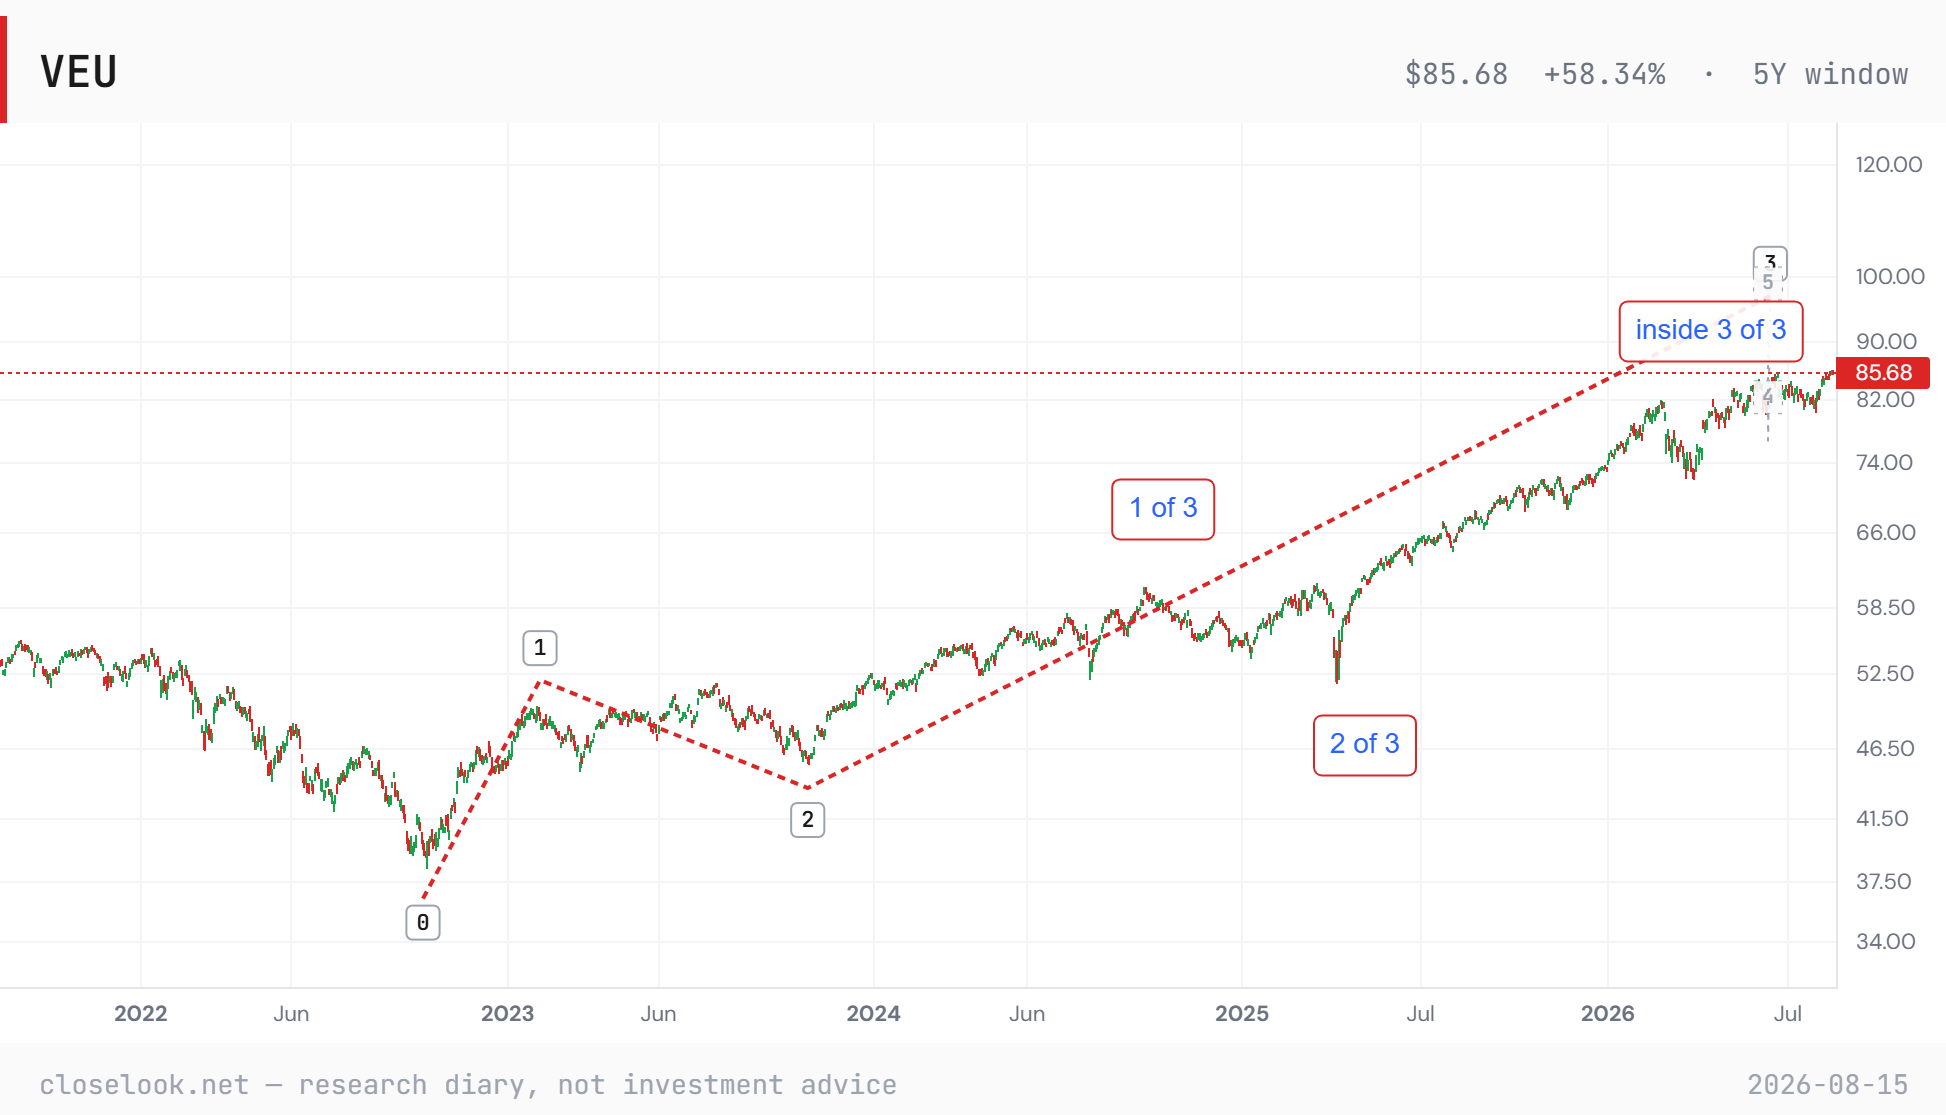
The global view. The ex-US world index closed the week at 85.68, up 0.54%; the all-world index at 162.25, up 0.59%. Two flat numbers — and on Thursday the first of them printed 85.71, taking out the record close this letter has been marking since June.

The year underneath those numbers has not changed its mind. VEU is +16.5% for 2026, VT +15.0%, the S&P +13.9%. Owning everything outside America still leads owning America; owning the whole world sits between the two. But read the week rather than the year and the order inverts — VT beat VEU. Including America helped this week, which is the first thing this ratio has done in America’s favour in some time, and it is worth marking before it is explained away.
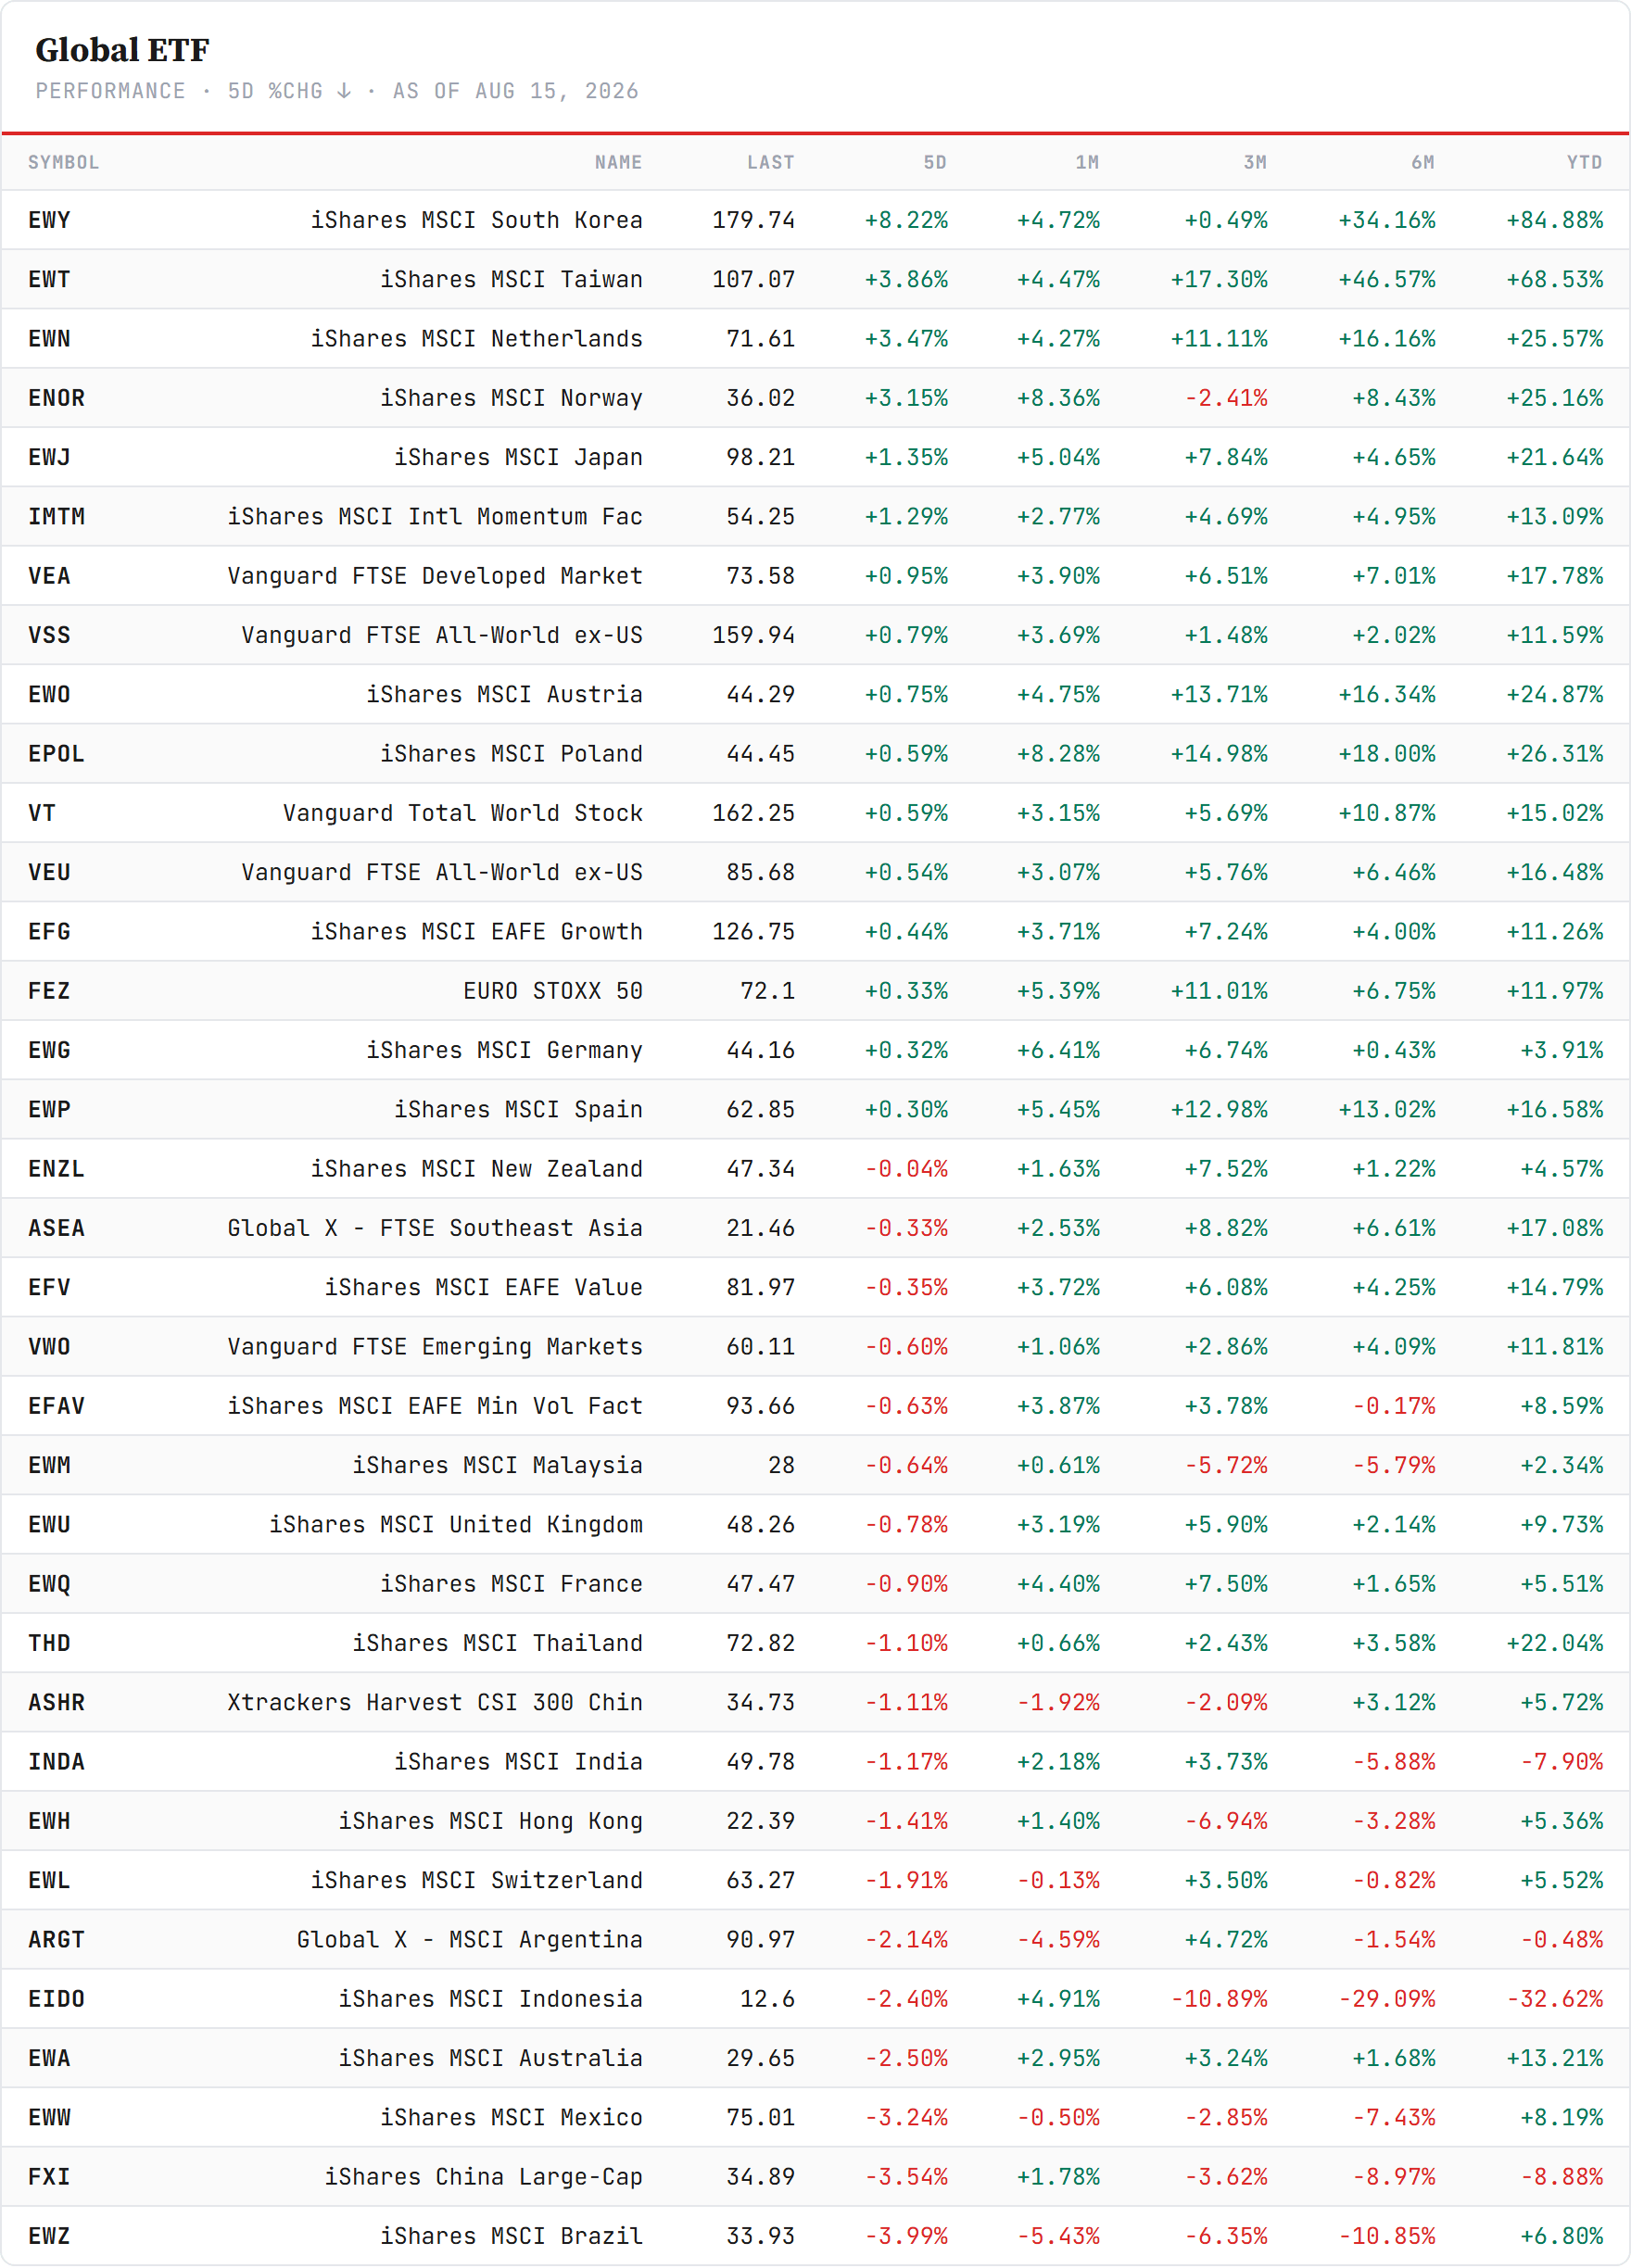
Korea is where the week actually happened. Seoul gained 8.22% in dollar terms — the strongest single-region week on this board all year, and now +84.9% for 2026. It entered a bull market on Thursday and ran a fourth day on Friday, more than 22% above its 30 July low.
Behind it, Taiwan +3.86% (+68.5% on the year) and — the board’s genuine surprise — the Netherlands +3.47%, Europe’s single-country lithography proxy, third on a thirty-five-fund table. Then Japan +1.35%. At the other end: China −3.54% and Brazil −3.99%, the two large non-AI emerging markets, falling in the same five sessions Korea ran.
Twelve points from best to worst, while the world index moved half a percent. The average did not describe a quiet week. It concealed a violent one.
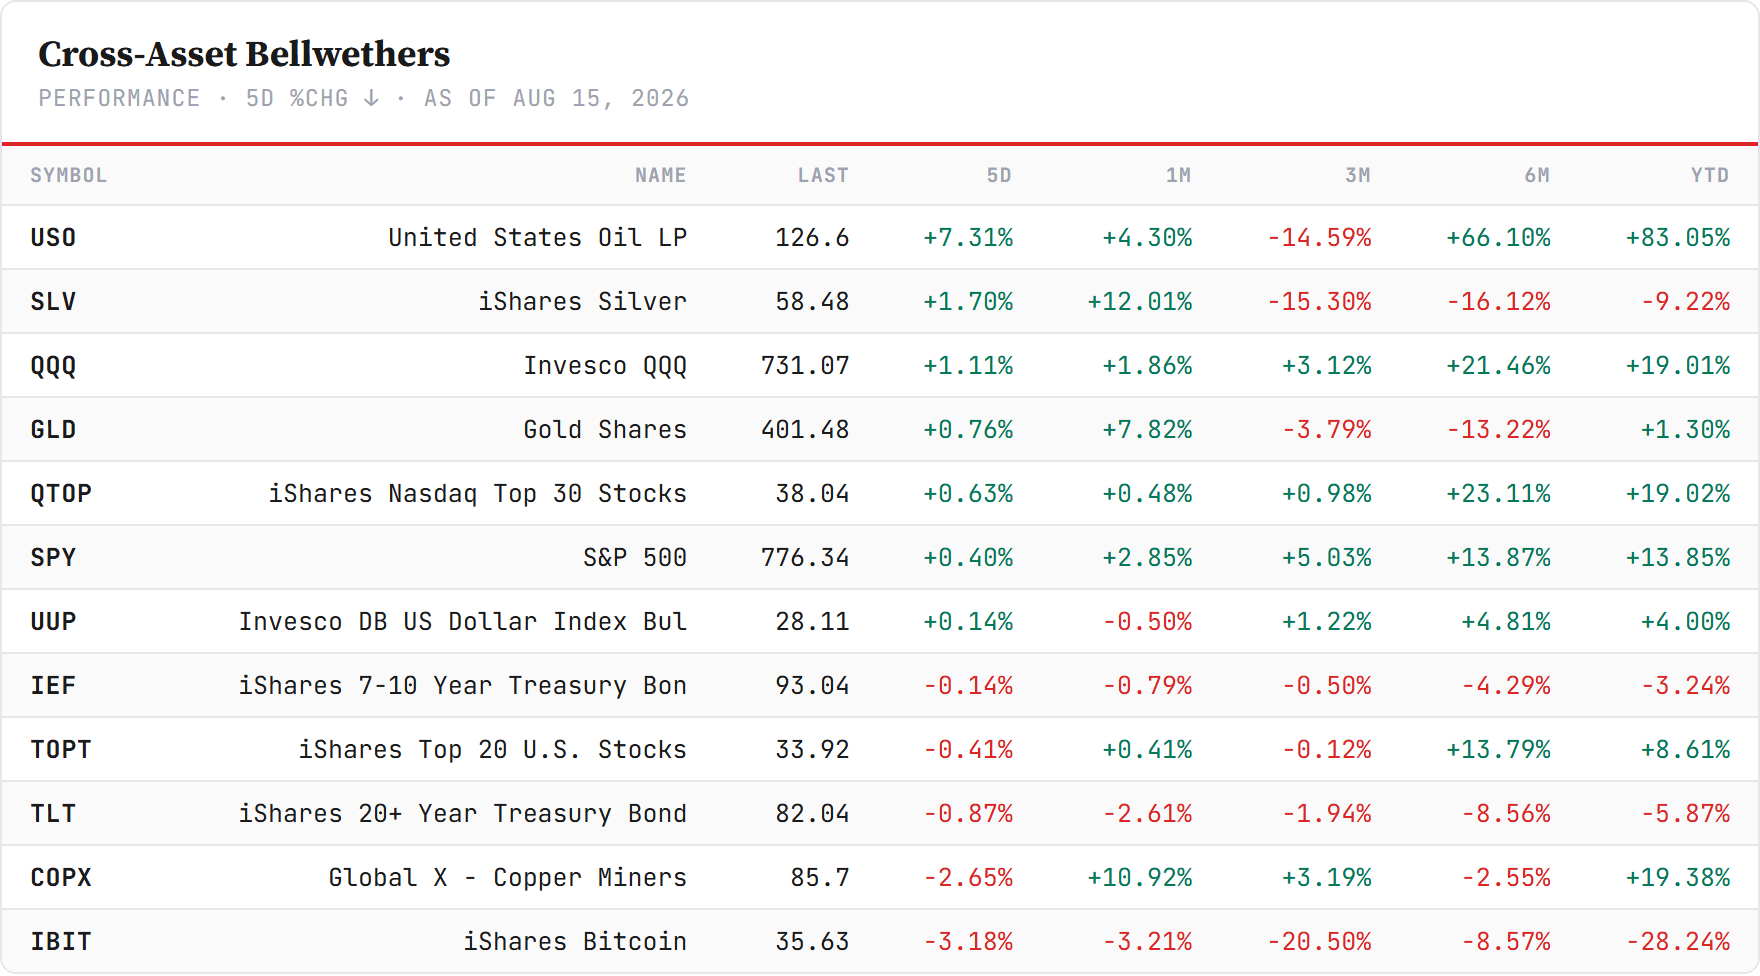
The cross-asset backdrop. Oil was the mover: USO +7.31%, taking back nearly all of last week’s 8.7% fall, and now +83.1% on the year — the single strongest line on this board in 2026. Silver added 1.70%, gold 0.76% after rejecting 4,400 a second time. Against that, copper miners lost 2.65% and bitcoin’s fund lost 3.18%, leaving it −28.2% on the year while every equity index it is compared to sits green.
The bond end went the wrong way for the equity story: TLT −0.87%, closing at 82.04 within five cents of its 52-week low, and IEF −0.14% at 93.04. The dollar barely moved, +0.14%.
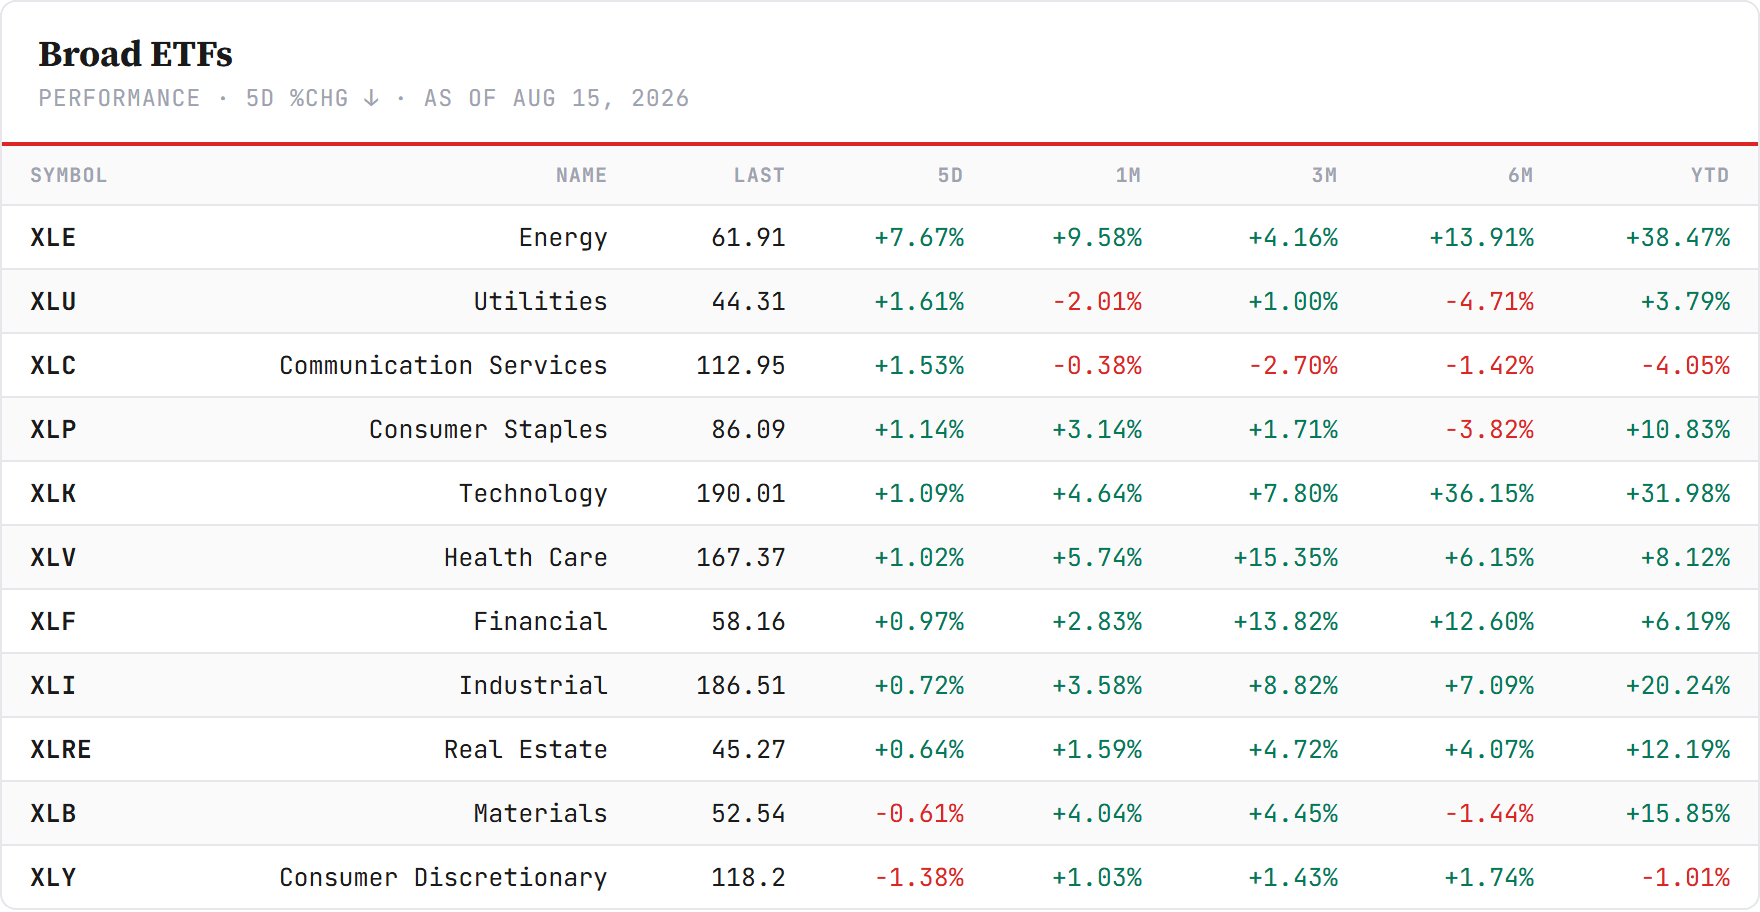
The US sectors. Energy ran away with it at +7.67%, and the honest reason is the barrel rather than a thesis — crude round-tripped, and the equities went with it. Utilities +1.61% and communications +1.53% followed. Only two of eleven closed red, and they were the demand-facing ends: materials −0.61% and discretionary −1.38%.
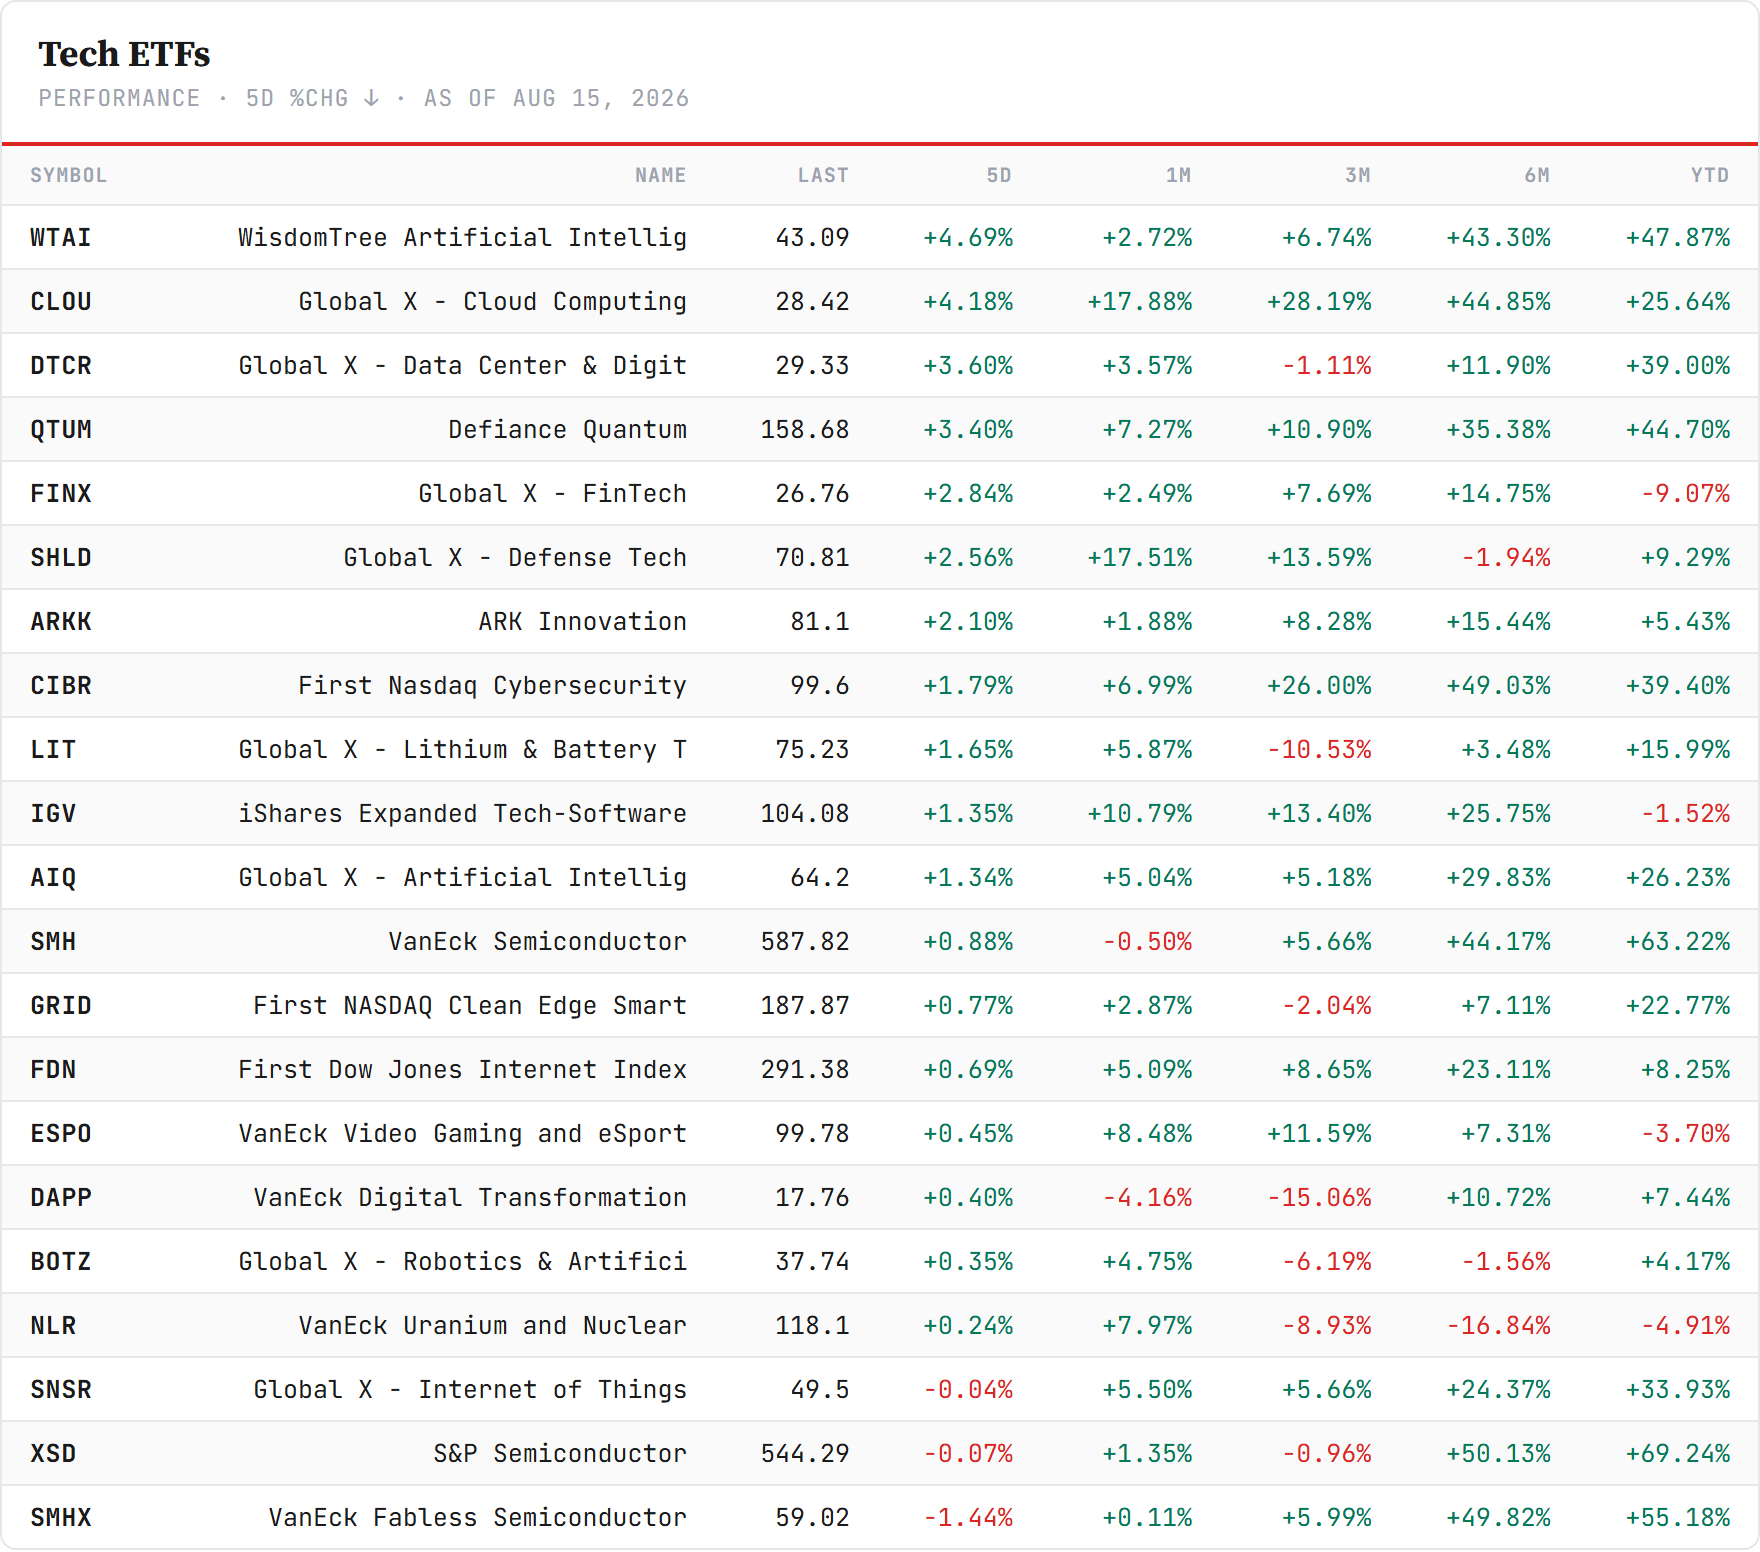
The tech ETFs. The AI-infrastructure cut led — WTAI +4.69%, cloud +4.18%, data-centre REITs +3.60%, quantum +3.40%. Software managed +1.35% and remains −1.5% on the year, the board’s reminder that the software de-rating has not been repaired by a good fortnight. Semis added just +0.88% despite sitting +63.2% for 2026.
The bottom is the tell: fabless semis −1.44% and small-cap semis −0.07%, both red in a green group, both up more than 55% on the year. The names that ran hardest into this week did the least in it.
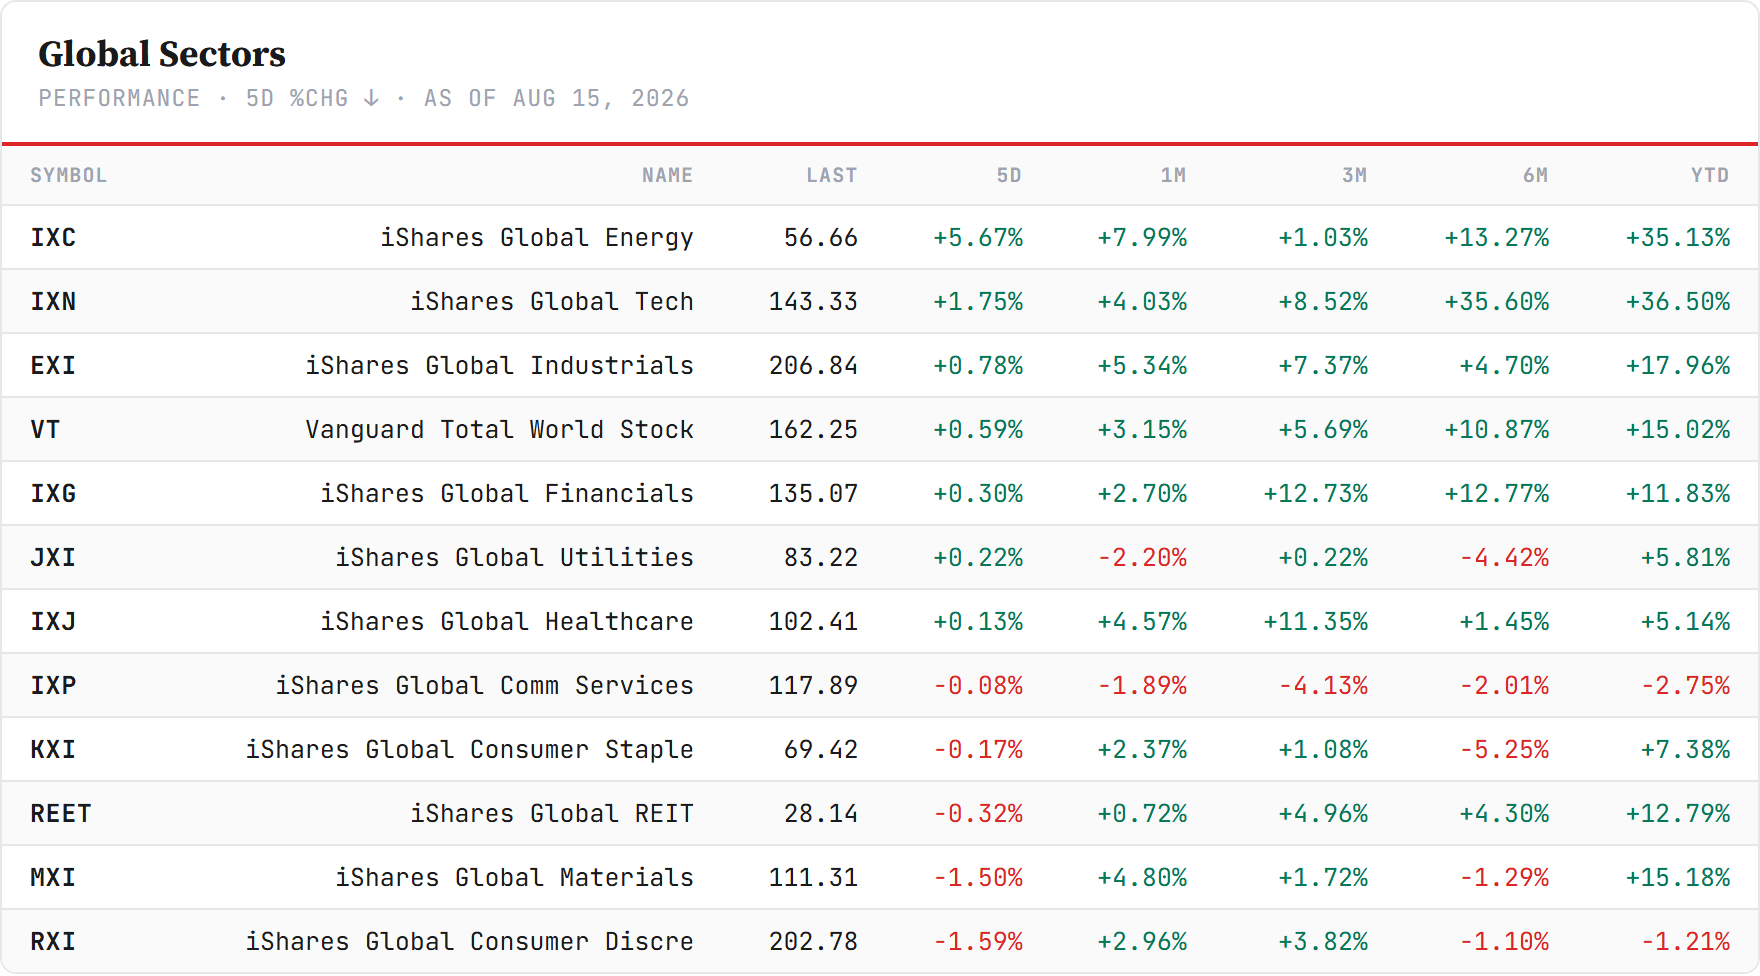
The global sectors. The same crude bounce, one layer out: global energy +5.67%, two points behind the American cut. Global tech +1.75% followed, ahead of the world’s +0.59% but far short of the US tech tape — an American move wearing a global label.
Then a flat middle — industrials +0.78%, financials +0.30%, utilities +0.22%, healthcare +0.13% — and two red lines that both matter. Global materials −1.50% reverses last week’s headline directly: seven days ago materials seized the month outright on the metals bid, and this week handed it back. Global consumer discretionary −1.59% was the board’s worst, matching the US table’s own worst line. Discretionary weakest in both cuts, in a week of two cool inflation prints, is the demand signal Friday’s Michigan number then confirmed.
The Global Compass
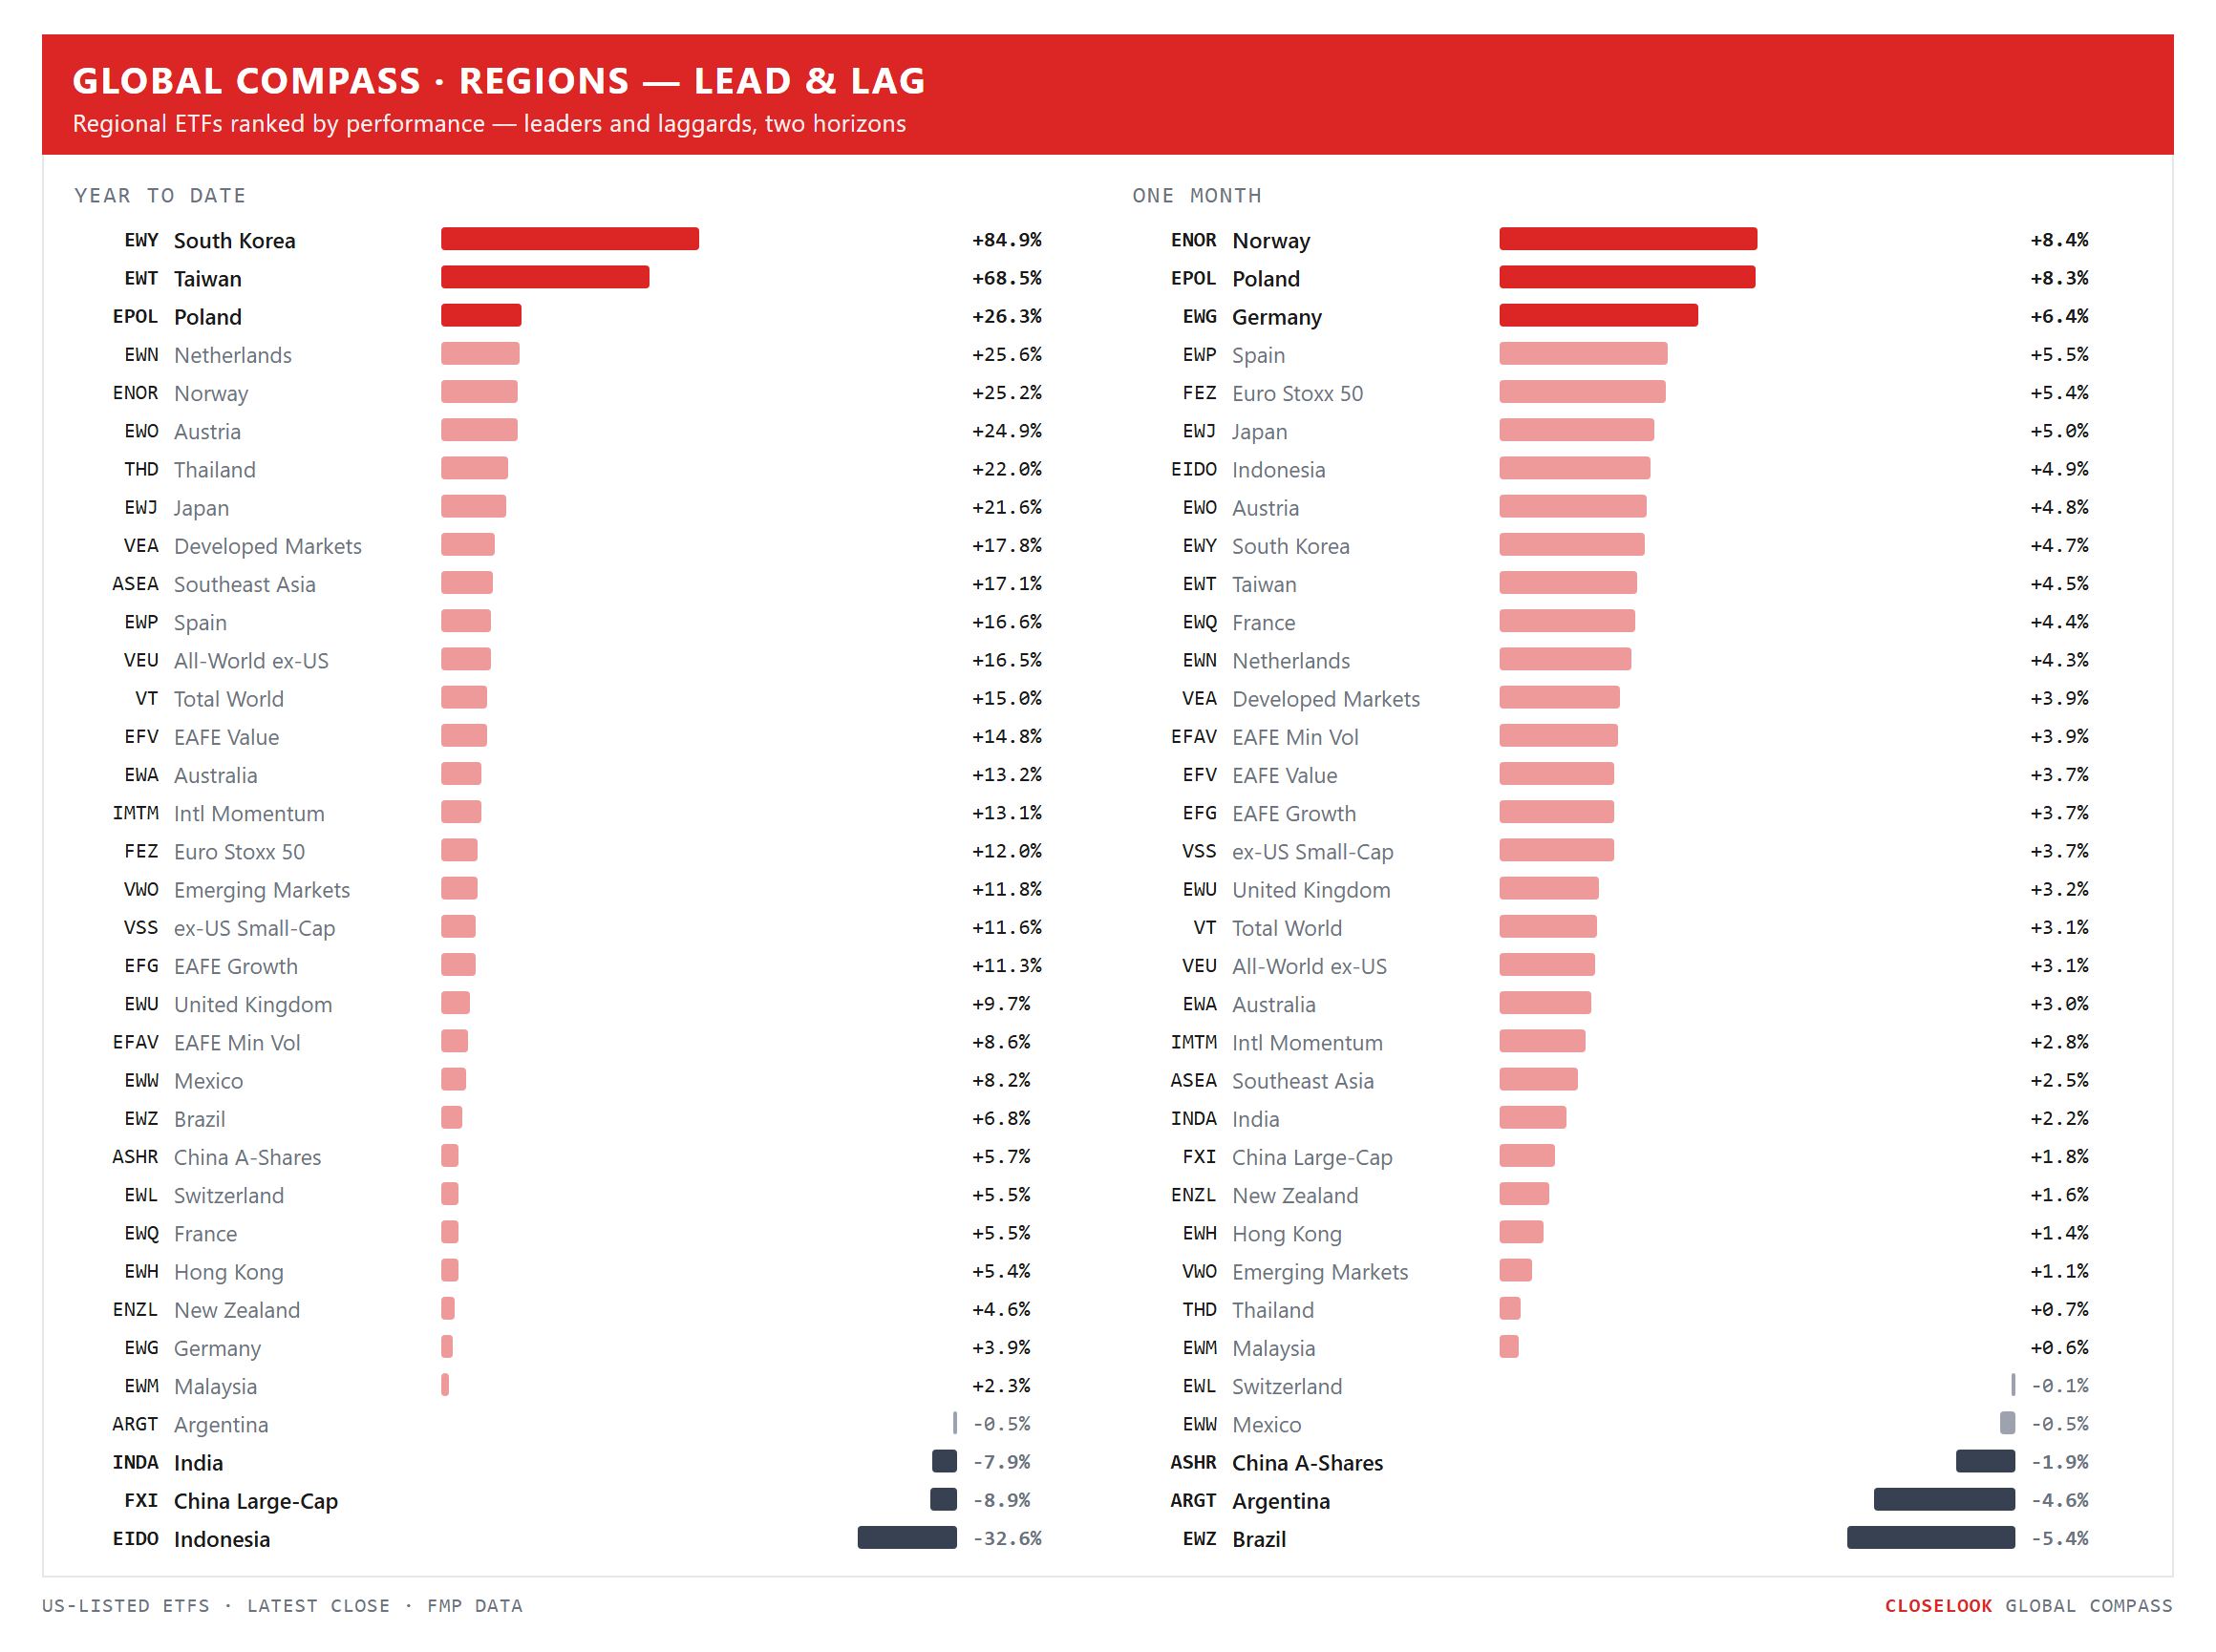
Regions: the leaders narrowed rather than broadened. Last week this board printed twenty-six of twenty-nine funds green and we called it the broadest participation since spring. This week inverted it: breadth collapsed into one corridor, the periphery went quiet, and the two big non-AI emerging markets went backwards. One week of concentration does not undo a month of broadening — but the broadening stopped paying, and that is the opposite of last week’s read.
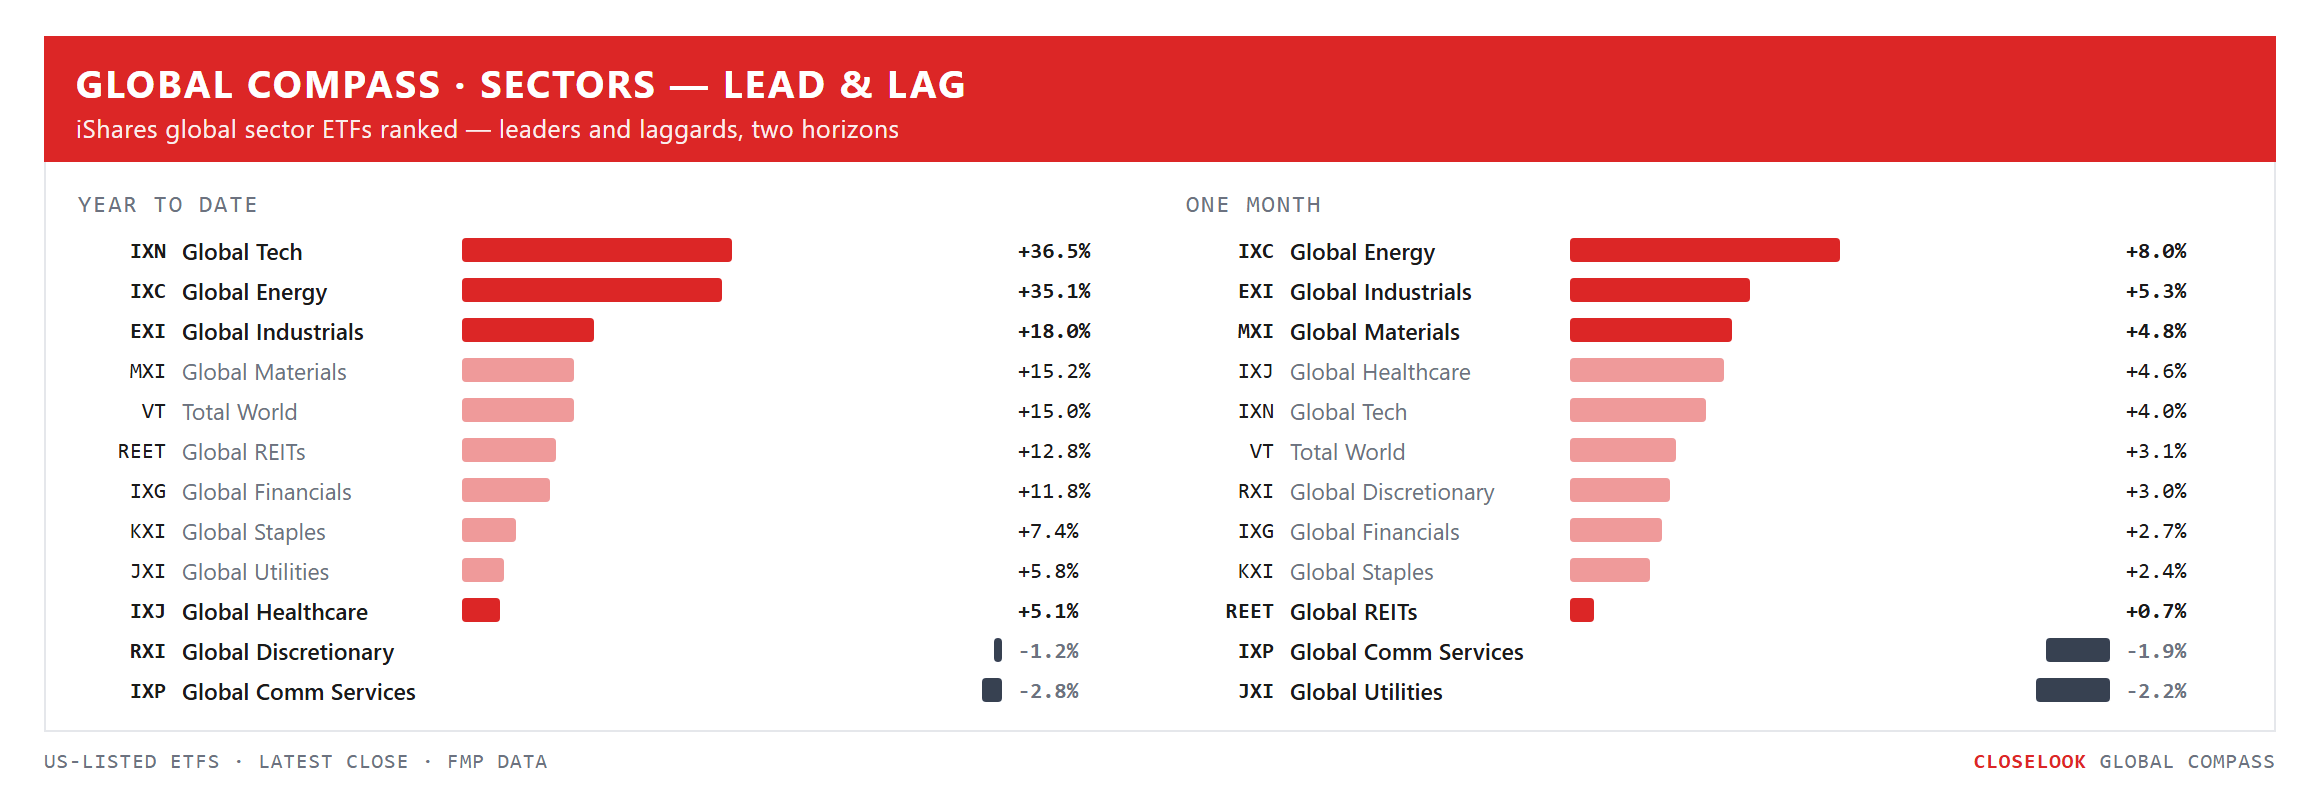
Sectors: energy answered, materials gave it all back. Last week recorded global tech retaking the year’s lead from energy, with materials seizing the month on the metals bid. Five sessions later energy has answered at +5.67% globally and +7.67% in the US, and materials is the second-worst line at −1.50%. A metals bid that leads one week and lags the next was a move, not a regime.
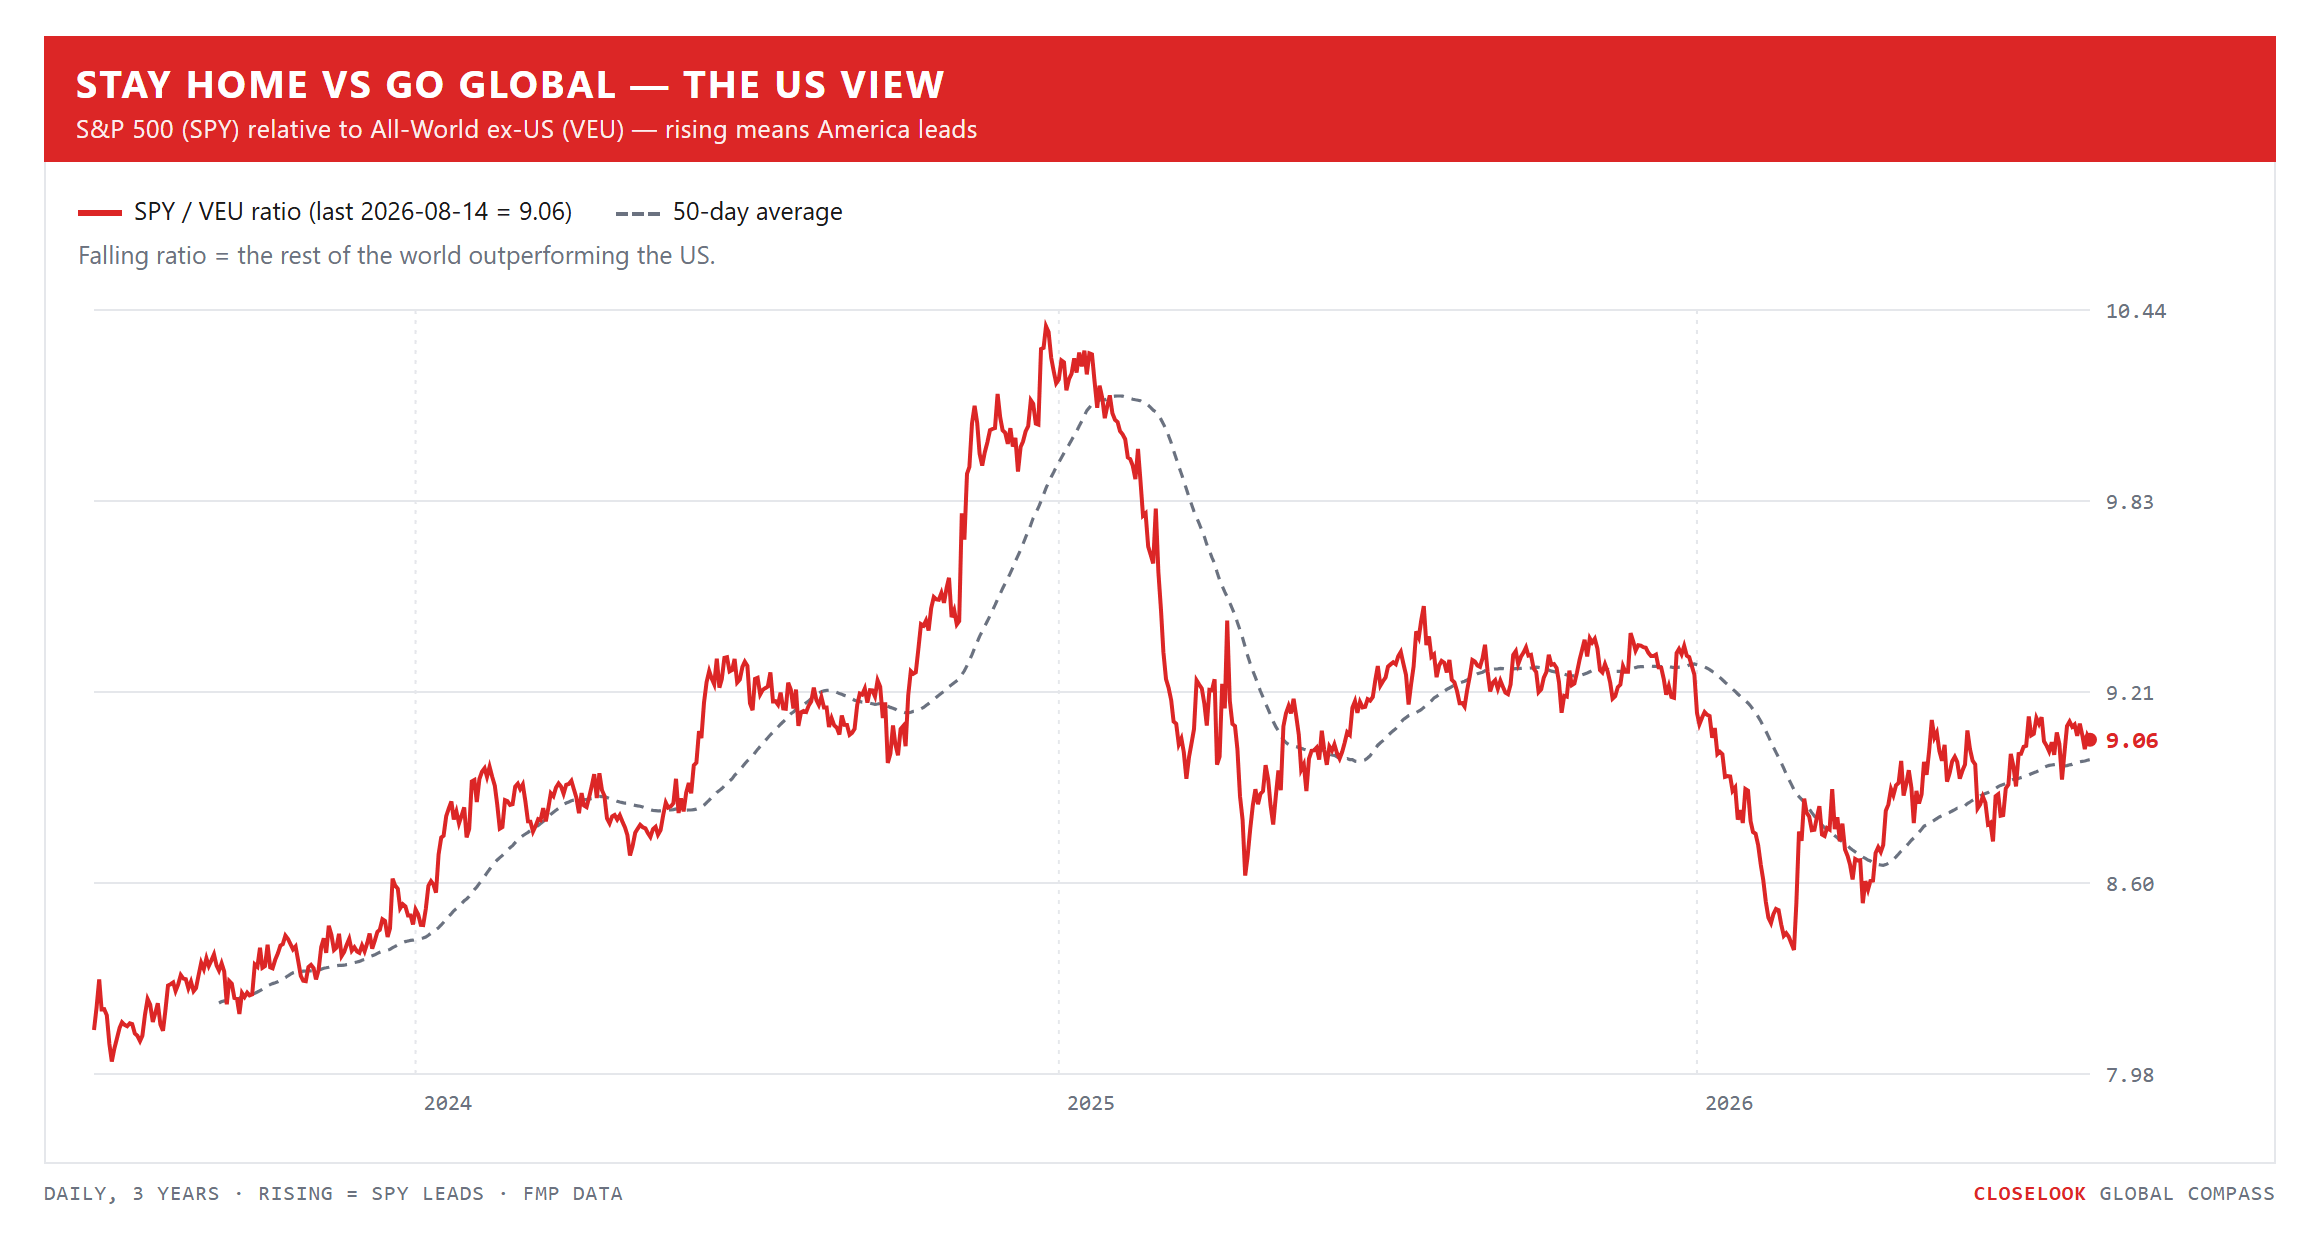
Stay home vs go global — the US view. Both readings belong on the page because they disagree. On the week: VEU +0.54%, VT +0.59%, SPY +0.40% — the ex-US cut beat America, but the all-world cut beat them both, so carrying America helped. On the year: VEU +16.5%, VT +15.0%, SPY +13.9% — the ex-US case is intact and leads by two and a half points. The honest summary is that the ex-US trade is winning 2026 and lost the argument about this particular week, which is what a real trend looks like from close range.
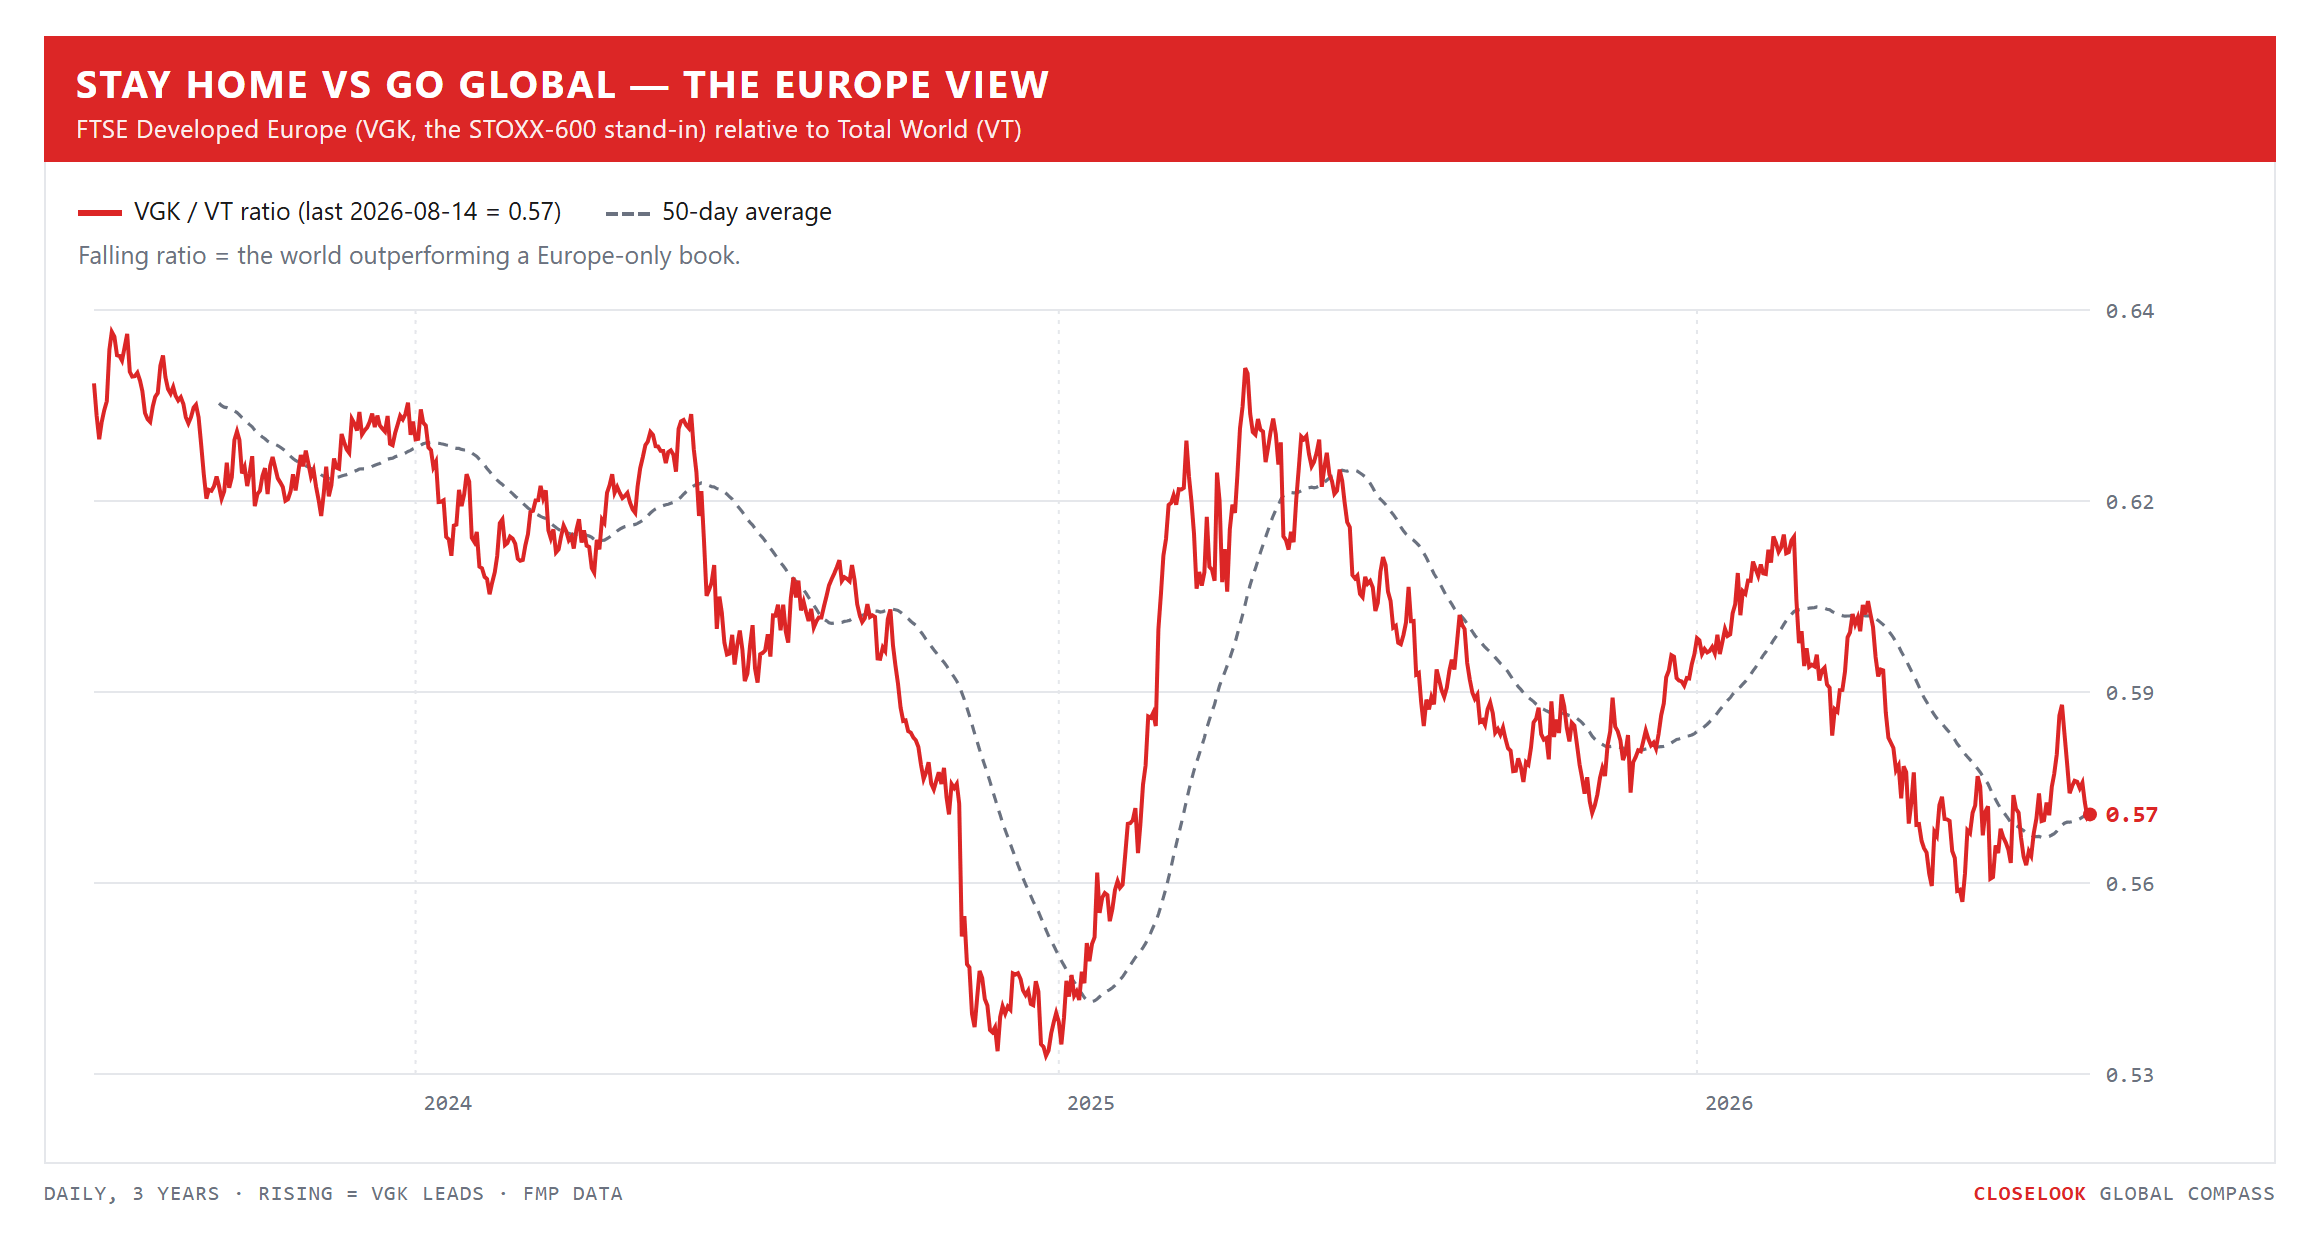
Stay home vs go global — the Europe view. The bloc managed +0.33% against the world’s +0.59% — participation without leadership, unchanged for three years at ratio level. But the Netherlands printed +3.47%. Europe did not join this week’s bid; one Dutch supply-chain position did. That is the same sentence Korea and China are writing at the two ends of the table, and it is the sharpest version of this letter’s standing view: the bid is not a continent, it is a position in a chain, wherever that chain happens to run.
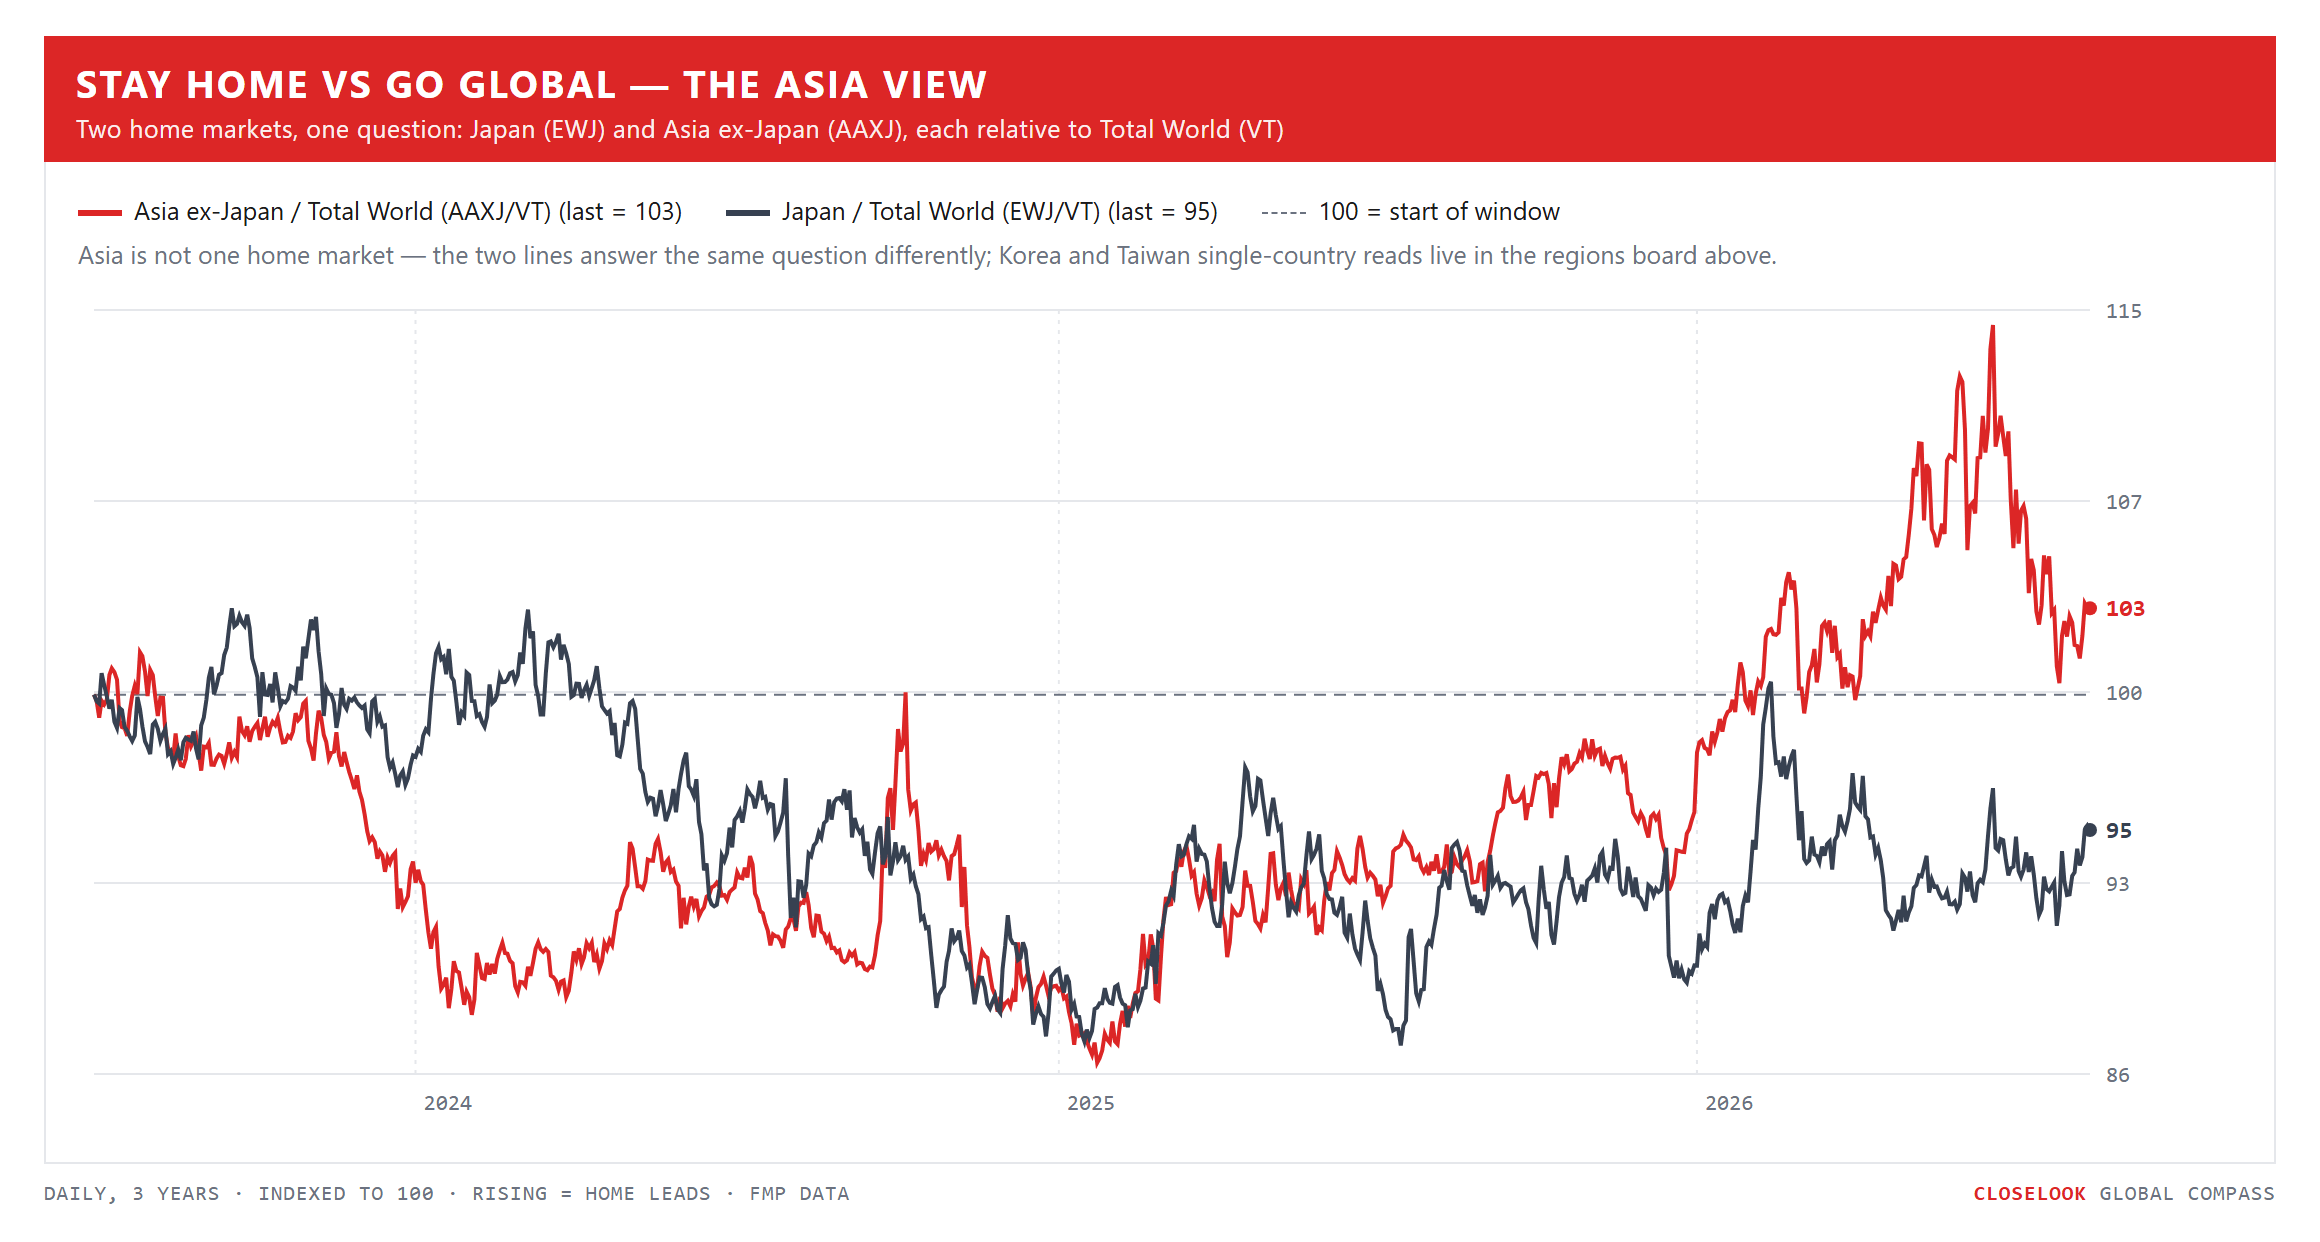
Stay home vs go global — the Asia view. The regional re-rating resumed, in one country. Korea’s +8.2% arrived without Japan (+1.4%), without China (−3.5%), and only partly with Taiwan (+3.9%). Last week’s question was whether July ended the re-rating or merely rested it. This week voted rest — emphatically, and narrowly. It gets to keep voting.
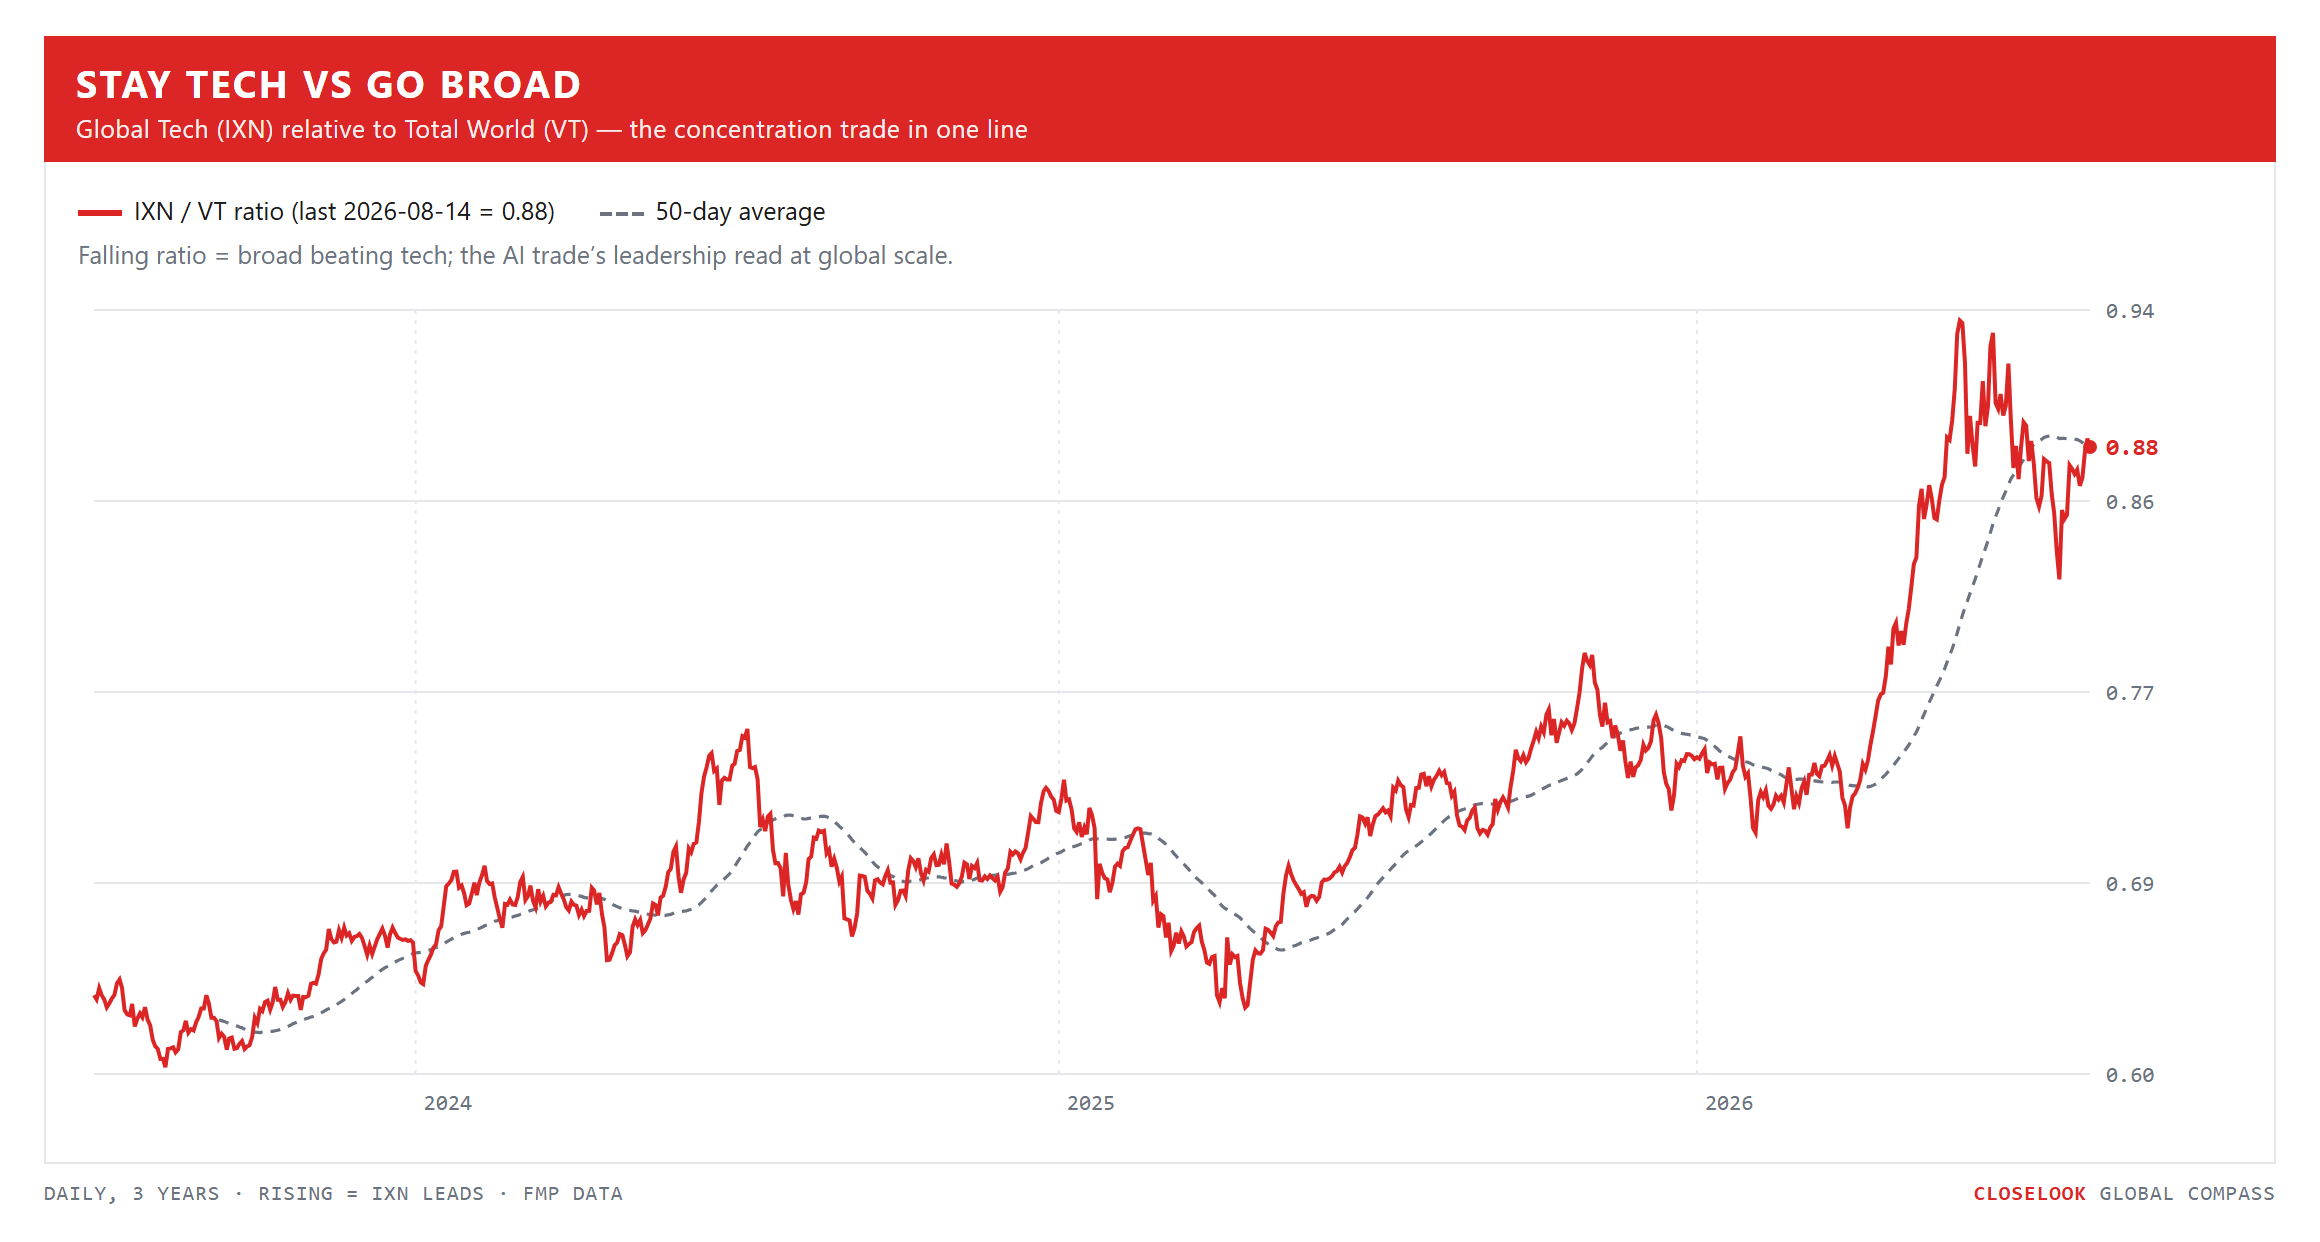
Stay tech vs go broad. Tech participated without the defaults: the Nasdaq 100 added 1.11% against the S&P’s 0.40%, while inside the tech board the year’s biggest winners were its weakest lines. Broadening and leadership at once, with a hole where the largest names sit.
Momentum vs defensive — the global cut. The US has run on momentum over low volatility all year, at the 95th percentile of that spread. Outside America the same factor pair now exists on this board, and it says something more interesting. International momentum added 1.29% on the week and is +13.1% on the year; international min-vol lost 0.63% and is +8.6%. Momentum leads by 1.9 points on the week and 4.5 on the year — so the momentum regime is not an American artefact.
But read where each one sits rather than how each one moved. Momentum closed at 54.25 against a 22 June high of 54.35 — a fifth of one percent below it. That is a breakout being tested, not a breakout completed; it needs a close through next week to confirm.
And the defensive end is not rolling over while momentum tests. Global min-vol closed Friday at a new high, though the strictly ex-US cut of it remains 1.3% below its February peak — the difference is America, which is the same story VT told against VEU at the top of this letter. Both ends of the factor barbell rising at once is a bull broadening: a market where the aggressive end leads and the defensive end still makes highs is not a narrow bid wearing a broad costume. It is the real thing, with the caveat that the defensive half of it is being carried by the market this letter does not own.
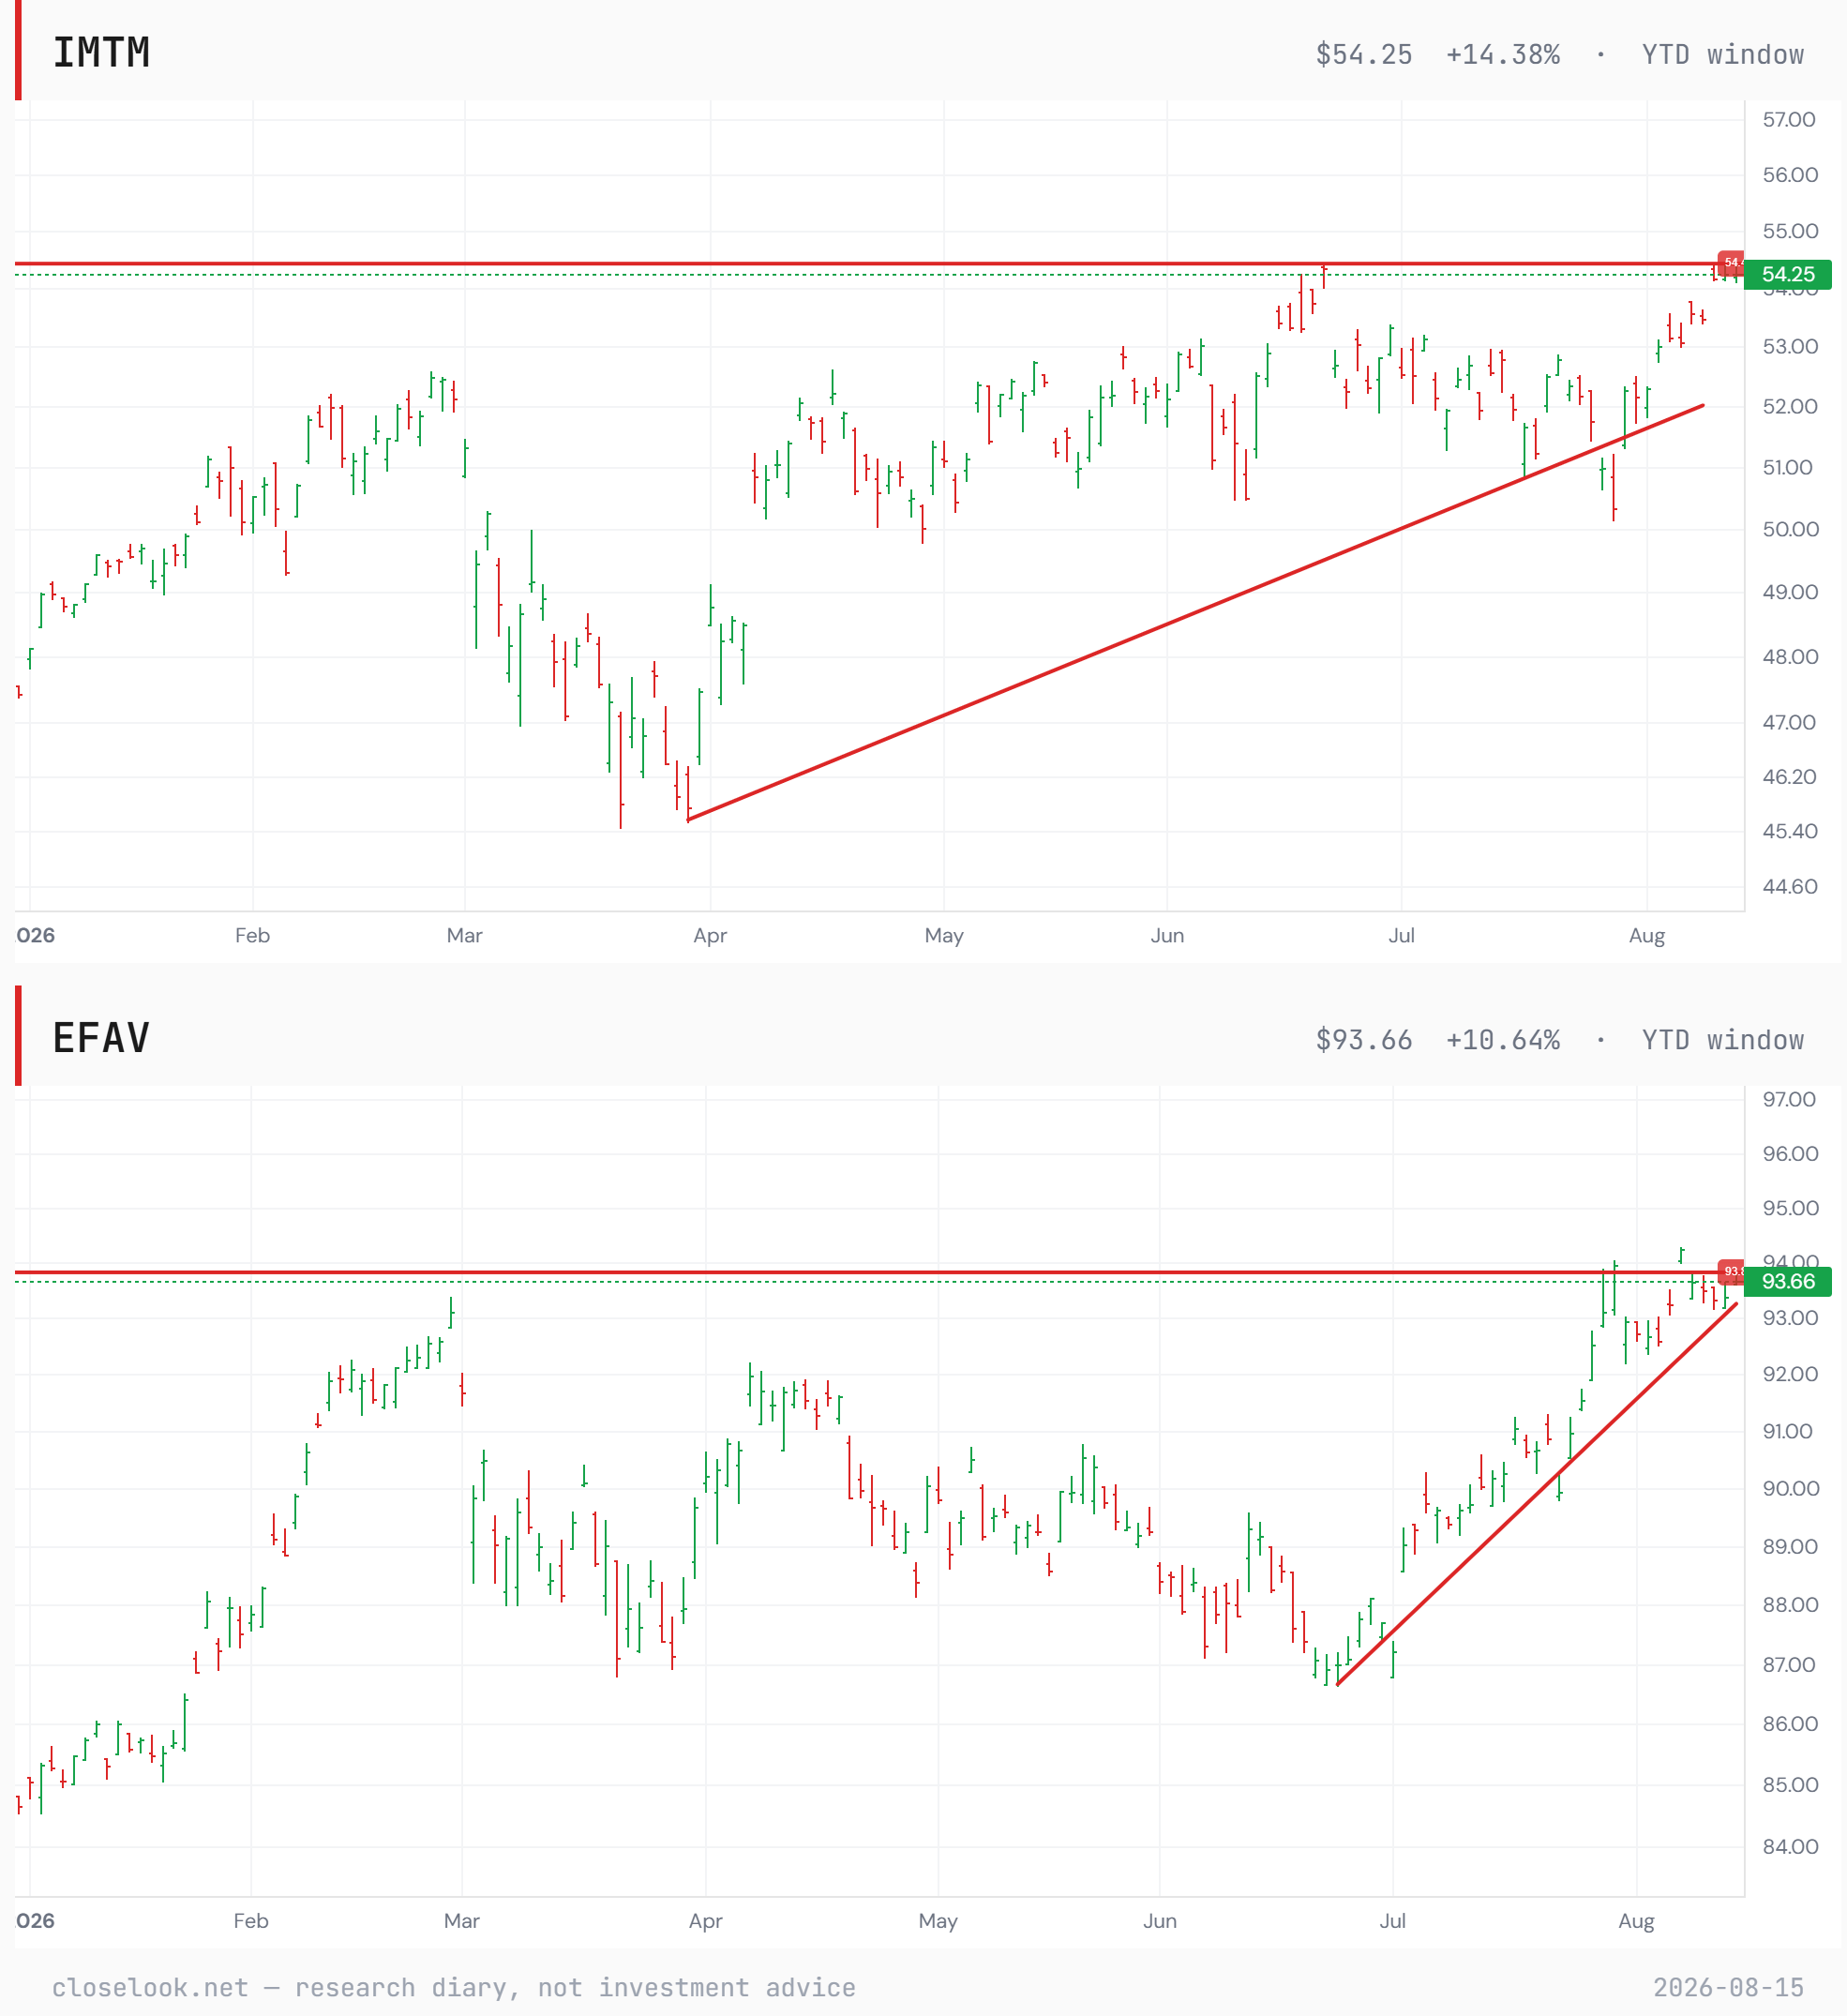
One more pair the board carries, pointing the other way. EAFE growth added 0.44% against EAFE value’s −0.35% on the week — but on the year value leads growth outside America, +14.8% against +11.3%, which is the reverse of the US. Outside America 2026 has belonged to value and momentum simultaneously. Those two usually travel in opposite directions, and when they do not, it is worth noticing.
The Closelook letters — where this one sits. The house thesis, compressed: the stock market is a growing system at the aggregate level in which most constituents slowly fade while a small group massively outperforms — and that group changes dynamically; it never stays static. Own the aggregate, know the current winner group, watch for the rotation. Right now the winner group is the AI stack, and the live question is which of its layers — building, operating, using — earns the next leg. Three letters read that question at three altitudes: Closelook@Global Stock Markets (Saturdays) follows the geography of the money — regions, cross-asset, the core thesis owned through ETFs. Closelook@US Stock Markets (Sundays) reads the tape — the four-layer AI thesis at sector and index degree, the levels, the print records. Closelook@Hypergrowth (Sundays) reads the names — four growth buckets, the flow ledger, the tactical sleeve. Same market, top down. This is the map altitude.
2 · The State
The mechanism, named: a record taken in silence. Last Saturday this letter left a number on the board — VEU’s record close at 85.23 from 22 June, the record intraday print at 85.74, and Friday one cent short. On Thursday the index closed 85.71. The record is taken, four cents under the all-time print, in a week the S&P moved four tenths of a percent.
But it cleared by a hair and closed below itself. Thursday’s 85.71 beat the old record close by 48 cents — six tenths of one percent. Friday gave three back to 85.68. A breakout that clears by half a percent and finishes below its own weekly high is a level taken on paper and an open question in practice.
The memory bid is the engine, and it has a postcode. Korea +8.2%, Taiwan +3.9%, the Netherlands +3.5% — three of the top five regional lines are the same supply chain in three jurisdictions, while China and Brazil fall. Inside our own capex index the identical sort appears: Storage +21.1%, HBM Memory +15.3% at the top, EDA & Chip IP −1.3% at the bottom. Two boards, built from different instruments, describing one trade.
Oil, the other half of last week’s sentence. Seven days ago this letter recorded the barrel losing 8.7% on expectations that the Iran war was ending in fact rather than in communiqués. This week it took nearly all of it back, +7.31%, and closed the year at +83.1% — the strongest line on the cross-asset board in 2026. Hold both halves honestly: one diplomatic week did not unwind a structural bid, and one bounce does not restore it. The barrel has now round-tripped a full fortnight and settled almost exactly where it started, which is its own kind of answer.
And both quiet tells turned on Friday. IEF broke 93.17 on Monday, reclaimed it Thursday on the cool PPI print, then closed the week at 93.04 — below. The weekly close is the only close that settles it, so the break stands and the reclaim failed. Dollar-yen closed 159.35, refusing 159.5 a fourth straight week, through two cool inflation prints that should have made the level easy.
The macro print was the wrong shape. Retail sales −0.6% against +0.1% expected, ex-autos −0.3% against +0.2%; Michigan sentiment 51.0 against 54.5, with one-year inflation expectations up to 4.3%. Weak demand with firming expectations is the first stagflation-shaped print of this run, and it landed the same day the world index took its record.
Hold both halves. The index cleared its line. The bond market and the currency market spent the week declining to agree.
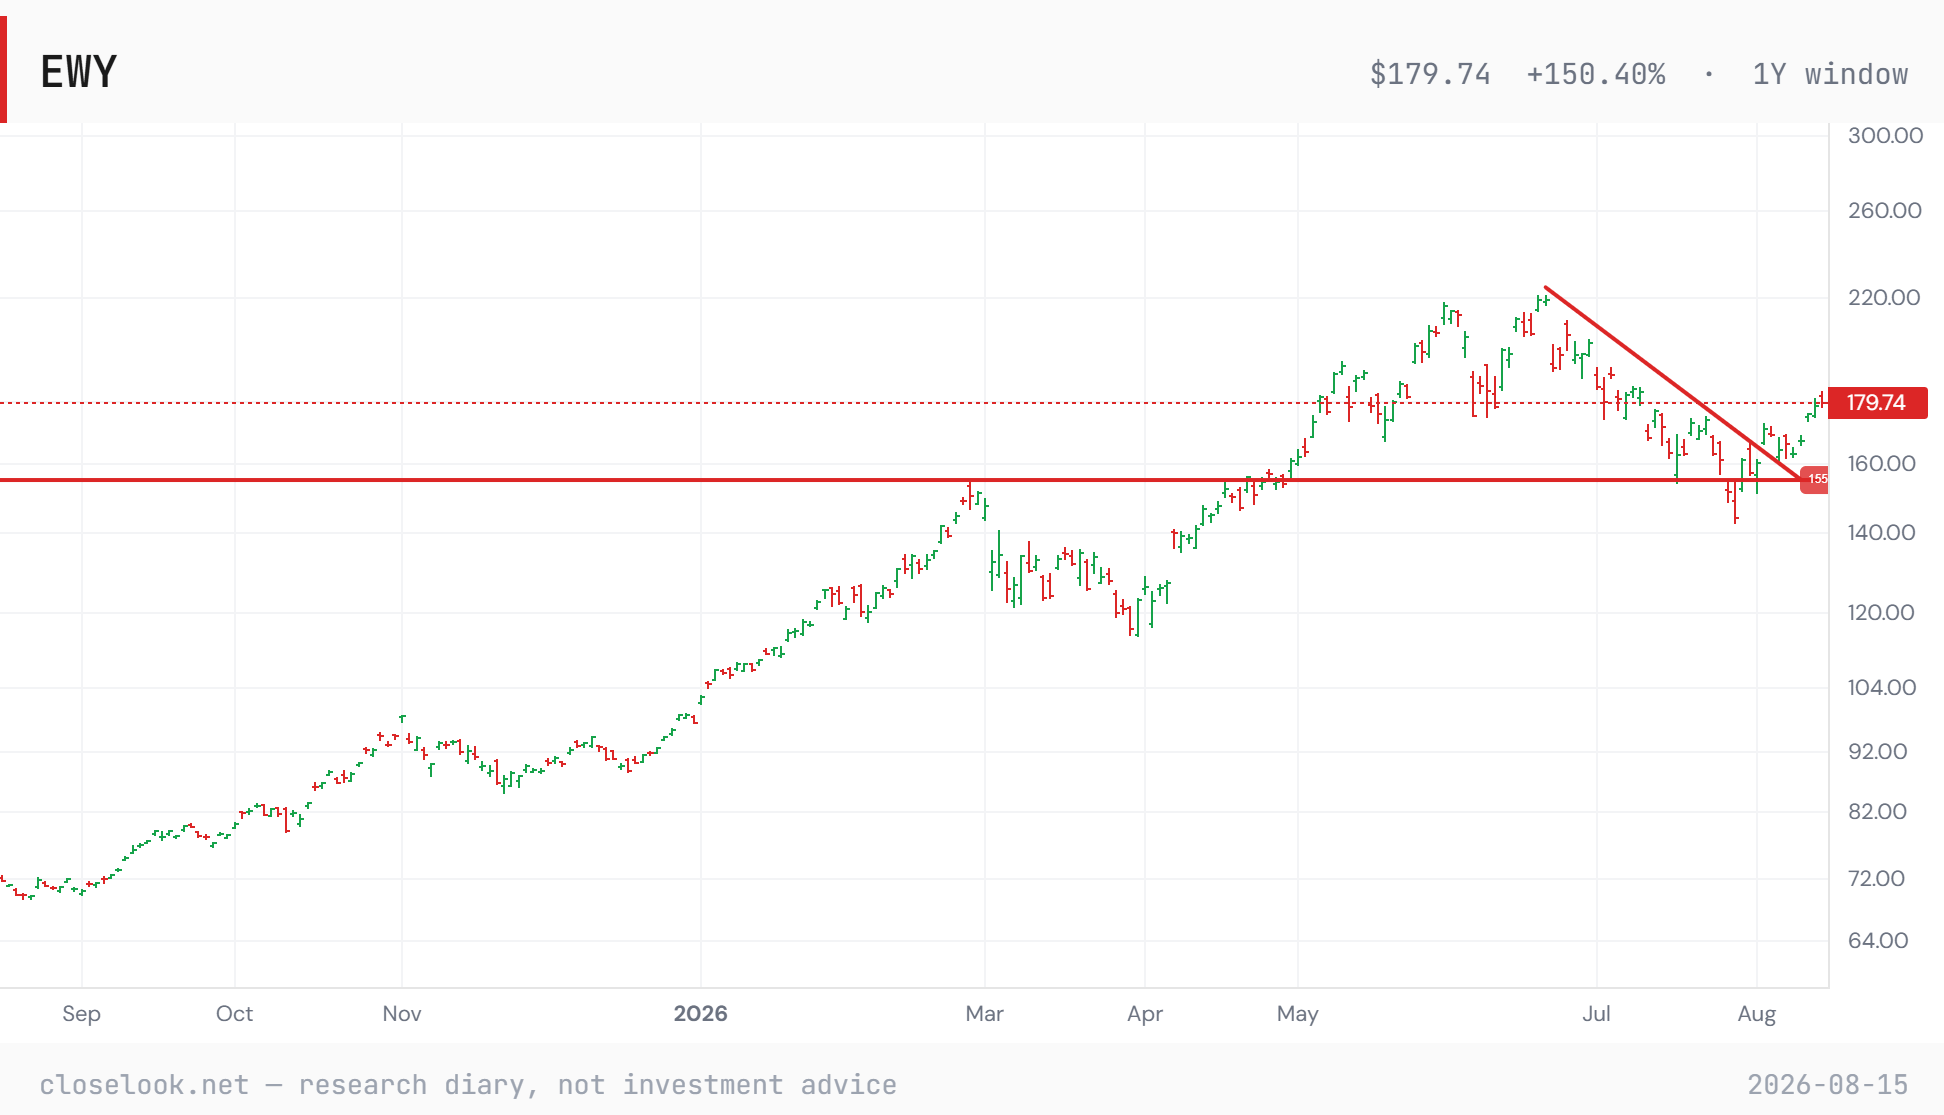
The structural read — Korea’s chart is further along than its week. The Korea fund is in the book, and the pattern it has drawn this year is the cleanest on the regional board. A clean breakout first. Then consolidation above the descending trend-channel line — the part that matters, because holding above a broken channel is what separates a genuine change of trend from a bounce inside a downtrend. Then, as the double bottom completed, the sharp move up and the break.
That sequence is textbook, and it is why this letter has treated Korea as structural rather than tactical since the July low.
But it is now sitting at major resistance around 180, and Friday closed 179.74 — under it by a quarter of a point after an 8.2% week. That level is the whole question. Break it and the year’s +84.9% is a trend continuing; fail it and everything since 30 July was a mean-reversion trade that ran further than most. The chart has earned the benefit of the doubt. It has not yet been given the confirmation.
3 · The Outlook
The three-index read — the middle stage led. We read the three together because they are three stages of one spend: capex (Rubin Build-Out, what gets built), opex (Agentic Ecosystem, what it costs to run), applications (Agentic Winners, what gets sold on top).
Opex +7.5% on the week, +69.4% on the year. Capex +4.9% and +107.4%. Applications +3.3% and −7.0%. Money still goes into the buildout — the year is unambiguous — but the fastest-moving claim this week was on running the thing rather than building it, which is the direction the whole thesis says the money eventually travels.
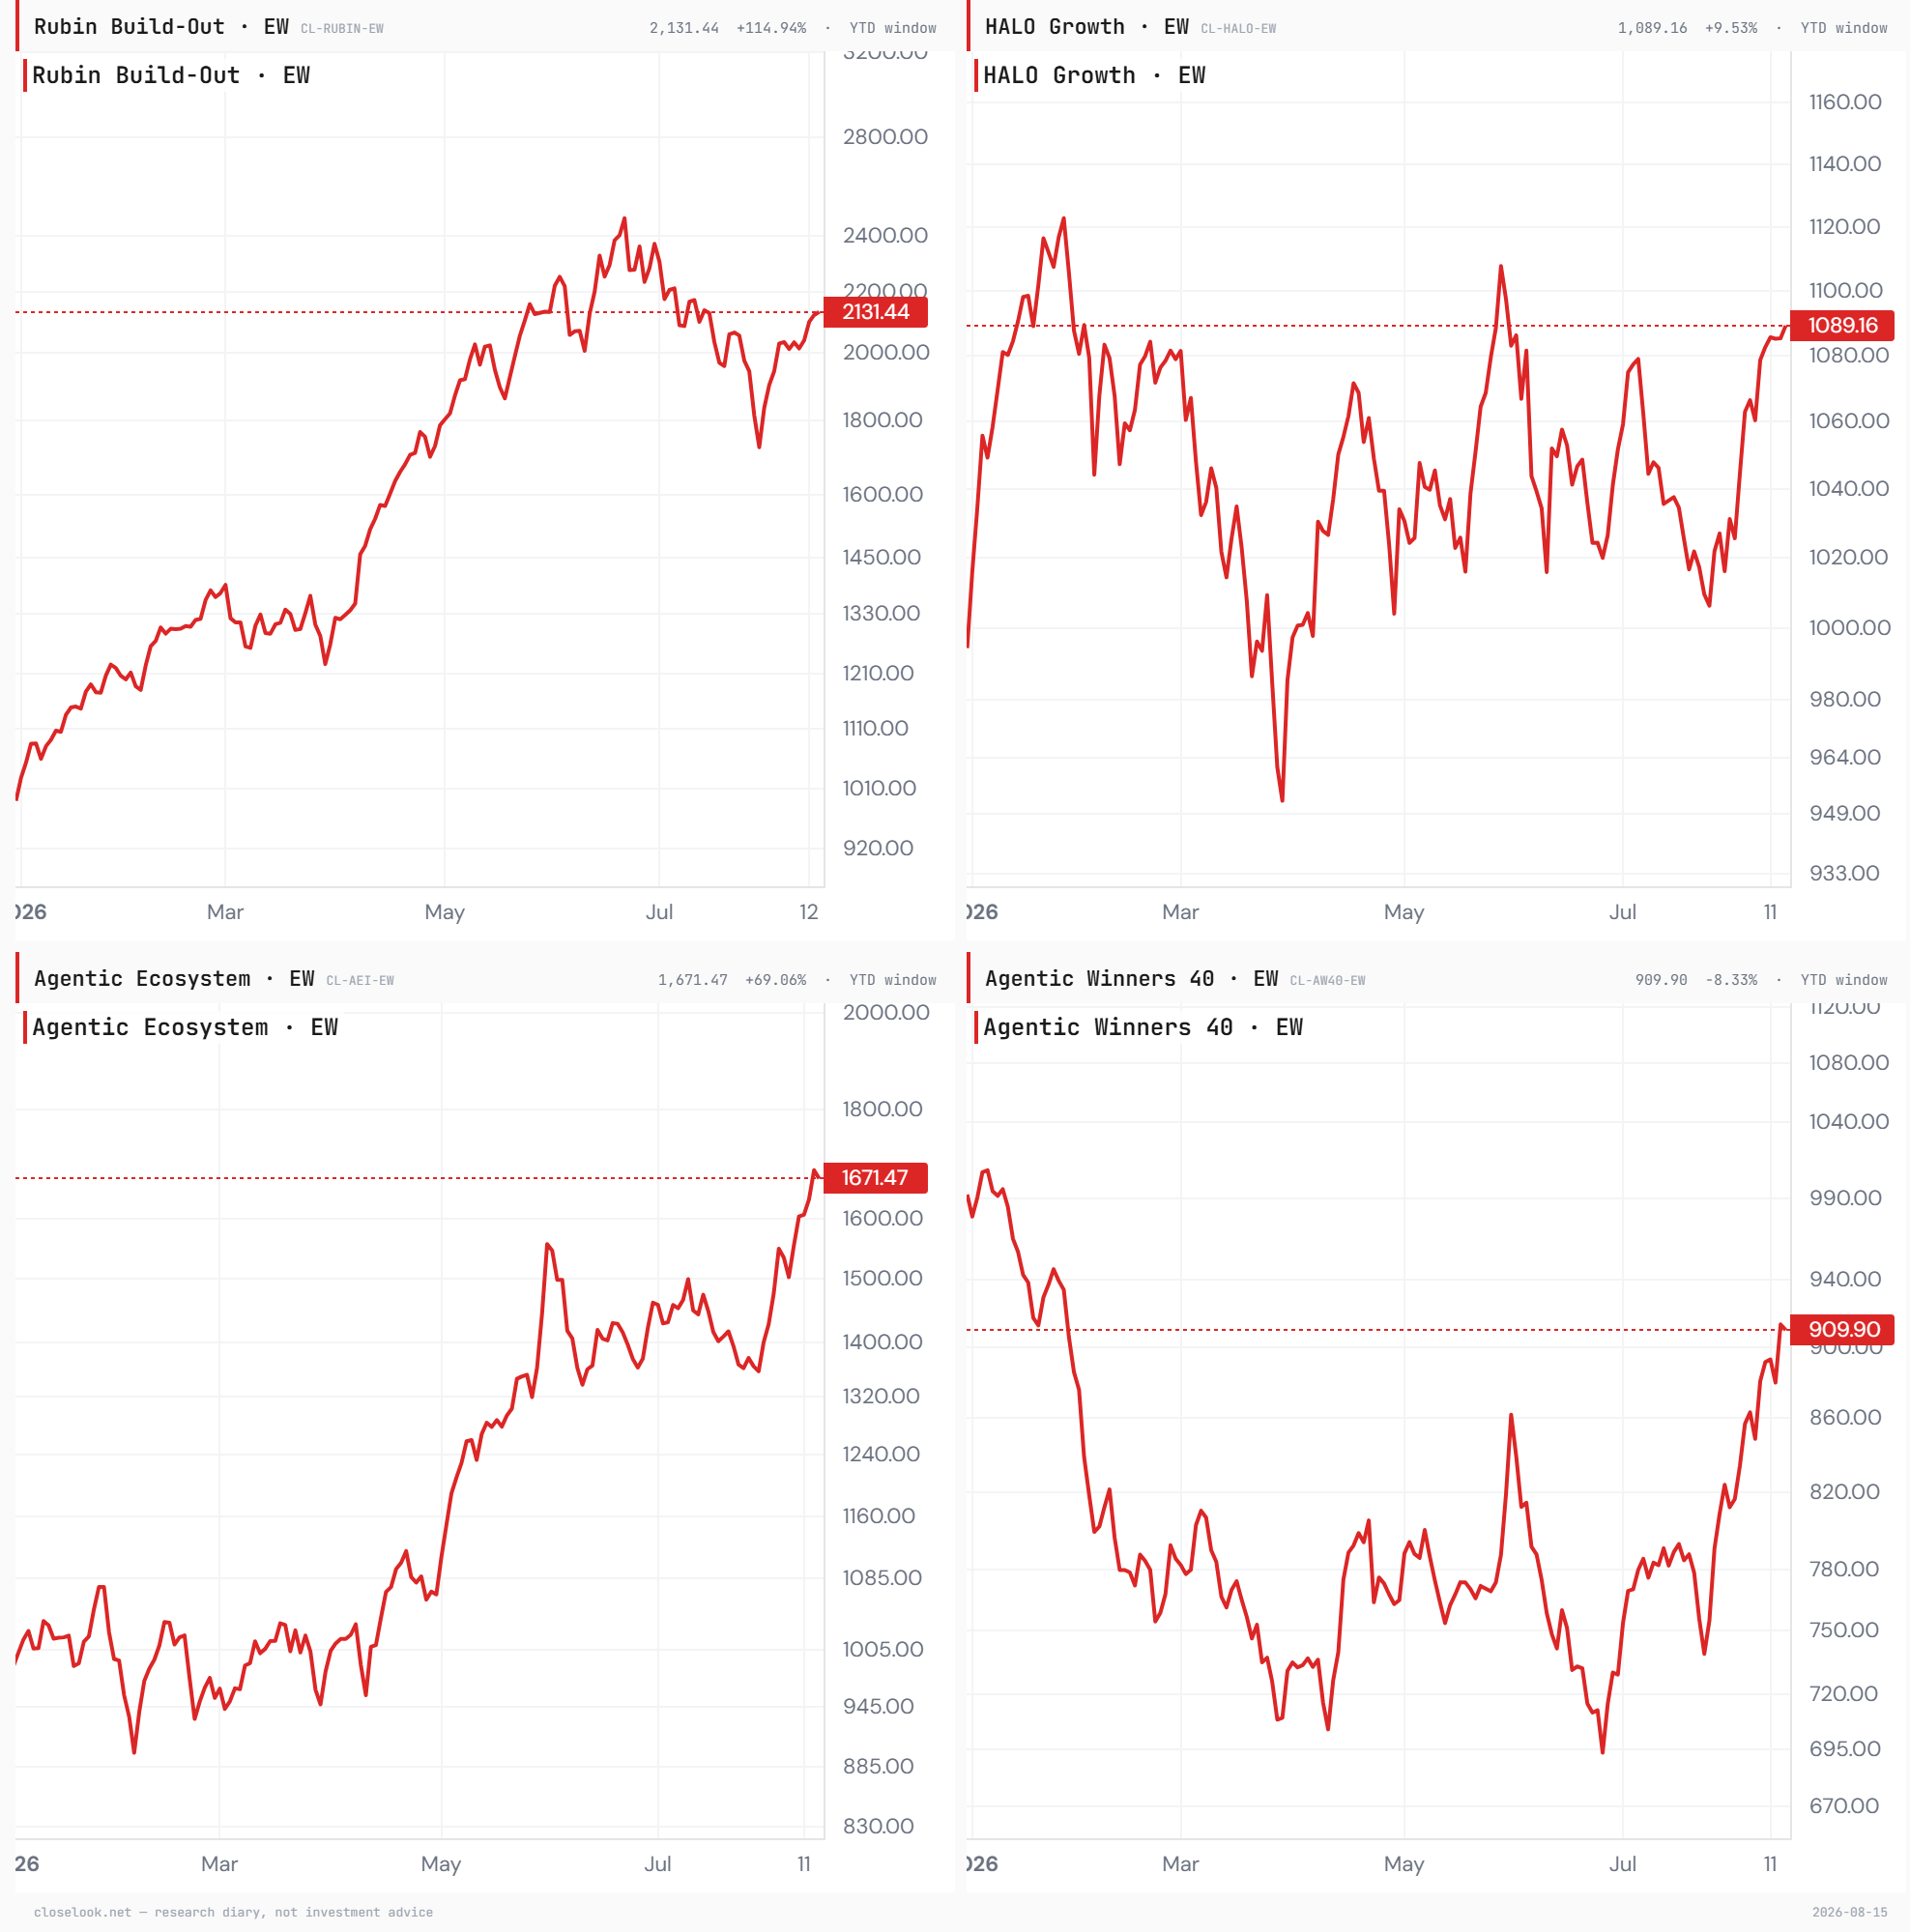
Read the three windows together, because they disagree, and the disagreement is the signal. On the year capex leads and it is not close: +107.4% against opex’s +69.4% and applications’ −7.0%. On the month the order inverts — opex +18.0%, applications +14.8%, capex +4.8% — which is the relative outperformance of the application layer that has been building since July. On the week opex led again. Steady growth in the operating layer across every window; a laggard year and a strong month in applications; a dominant year and a flat month in the buildout.
The correction lows say the same thing earlier. Capex and opex both bottomed on 29 July and are +23.6% and +23.1% off those lows. Applications never made that low: it bottomed on 25 June, five weeks earlier, and is +31.2% off it. An index that declines to confirm the others’ low, and then leads the recovery off it, is showing relative strength in the only way that is measurable rather than rhetorical.
And we have seen this exact behaviour before, from the other side. In the spring downturn the roles were reversed: capex and opex bottomed together on 5 February while applications kept falling until 10 April — nine weeks behind. The index that bottomed first that time was Rubin, and Rubin went on to lead the year by a distance, +107.4% and counting. This time it is the applications layer that refused the later low. The pattern does not guarantee the sequel — but the last index to do this went on to own the year, and that is worth stating before the fact rather than after. Probability, not prophecy.
And the structural line settles it. Opex and applications have both cleared their summer highs — the operating layer by 7.3% above its 1 June peak, the applications layer by 5.6% above its own. Capex has not: Rubin sits 13.7% below its 22 June high. Last Saturday this letter announced a tilt toward the opex and application layers and cited the build layer as seventeen percent below its own high. Four weeks of recovery later that gap is 13.7% — narrowing, but the two lighter layers have made new highs while the heaviest has not. The tilt announced before it was executed is being confirmed by the tape rather than by the argument.
Inside capex: the physical layer paid, the design layer charged. Storage +21.1% led the entire table and is +357% on the year; HBM Memory +15.3% (+168%). At the other end EDA & Chip IP −1.3%, the weakest of twenty-four. What Korea exports sits at the top; what sells into everyone equally sits at the bottom.
Inside opex: everything green, and the winner stood still. Edge & Distribution +12.8%, Data & Memory +12.3%, Substrate +11.4%, Compute Operators +11.1%. Then the tail: Foundation Models +1.9% against +858% on the year, Runtime & API Gateways +0.6% against +155%. The two names that made 2026 did nothing in the week their infrastructure was bought.
Inside applications: the inversion runs the other way. Application Leaders +4.9%, Enterprise (B2B) +3.6%, Control Plane +3.5%, Endpoints +3.4%, Consumer +2.7% — every one still negative on the year. The only sector up in 2026 is Megacap Gateway at +9.7%, and it was the only one red this week at −1.6%. The applications layer spent the week buying what it had spent the year selling.
The control group. HALO — our growth index carrying no AI thesis — gained 0.97%. Against opex at +7.5%, that settles what kind of week this was: an AI bid, not a growth bid. Inside it only Autonomous Defense & Drones (+5.9%) kept pace, while Energy Transition −2.0% and Destination Economy −2.5% were the clearest laggards anywhere in the house. The regime gauge. The Money Temperature instrument board sits at a composite of 51 — the middle of its range, and cooler than the equity tape’s mood would suggest after two cool inflation prints and a record in the world index. Read it plainly: this is not a chase, and it is not early either. It is the reading where rotations get funded — and where first mistakes get funded too.
