


This week’s edition of Closelook@US Stock Markets, dated July 5, 2026 — closes through July 2, with U.S. markets shut July 3–4. We have described a narrow tape leaning on one sector for several weeks; this week, the tape did something more revealing. It split in two.
Almost everything rose — but the two ends of the barbell we live on went opposite ways, and the divide ran straight through technology. The read below holds that this is rotation, not risk-off, with a rising earnings bar behind it. The schedule of our other publications is at the end.

1 · This Week’s Action
Five boards, top to bottom: the macro backdrop first, then the US sectors, technology, the regions, and the world. Each is sorted by Weighted Alpha, leaders at the top.
The cross-asset backdrop. The bellwethers set the tone before equities open. This week, long bonds softened as yields firmed, the dollar drifted lower, gold held its ground, and Bitcoin pushed higher through the long weekend — a backdrop that leans risk-friendly, with the one caveat that rising yields sit under the rate-sensitive corners of the equity market.
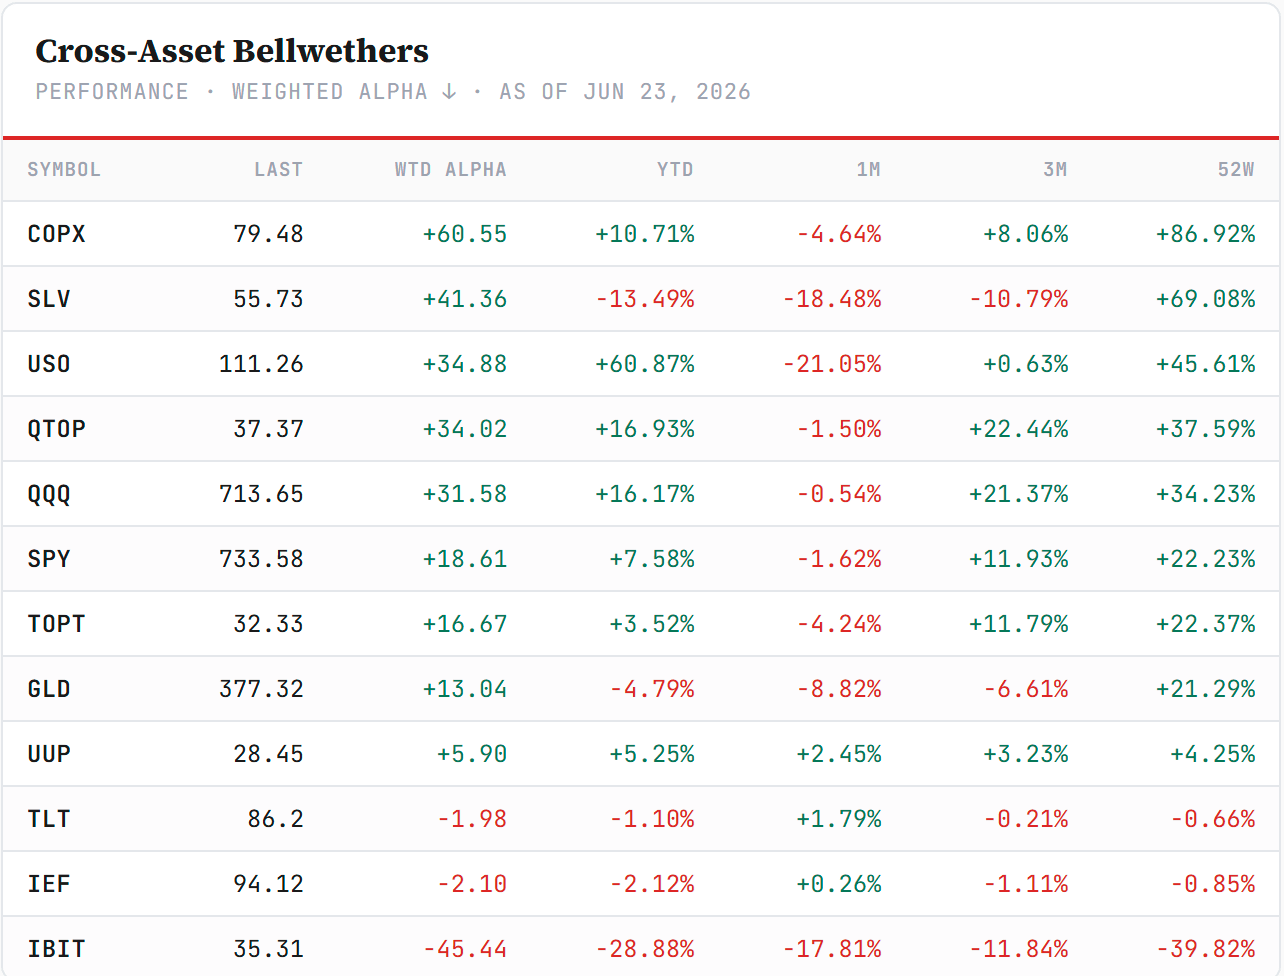
Sorted by Weighted Alpha (leaders → laggards) · Barchart, close of week.
The tell here is what is absent: no haven bid, no credit stress, no scramble for protection. Volatility fell on the week even as one corner of the market was repriced hard — the fingerprint of repositioning, not de-risking.
The eleven US sectors. The broad market had a good week — the S&P and its equal-weight version rose together, so participation was genuinely wide. Underneath, financials and communication services did the leading; the defensives and the rate-proxies — utilities, energy, real estate — sat at the bottom. Technology finished near flat, which sounds unremarkable until you look inside it.
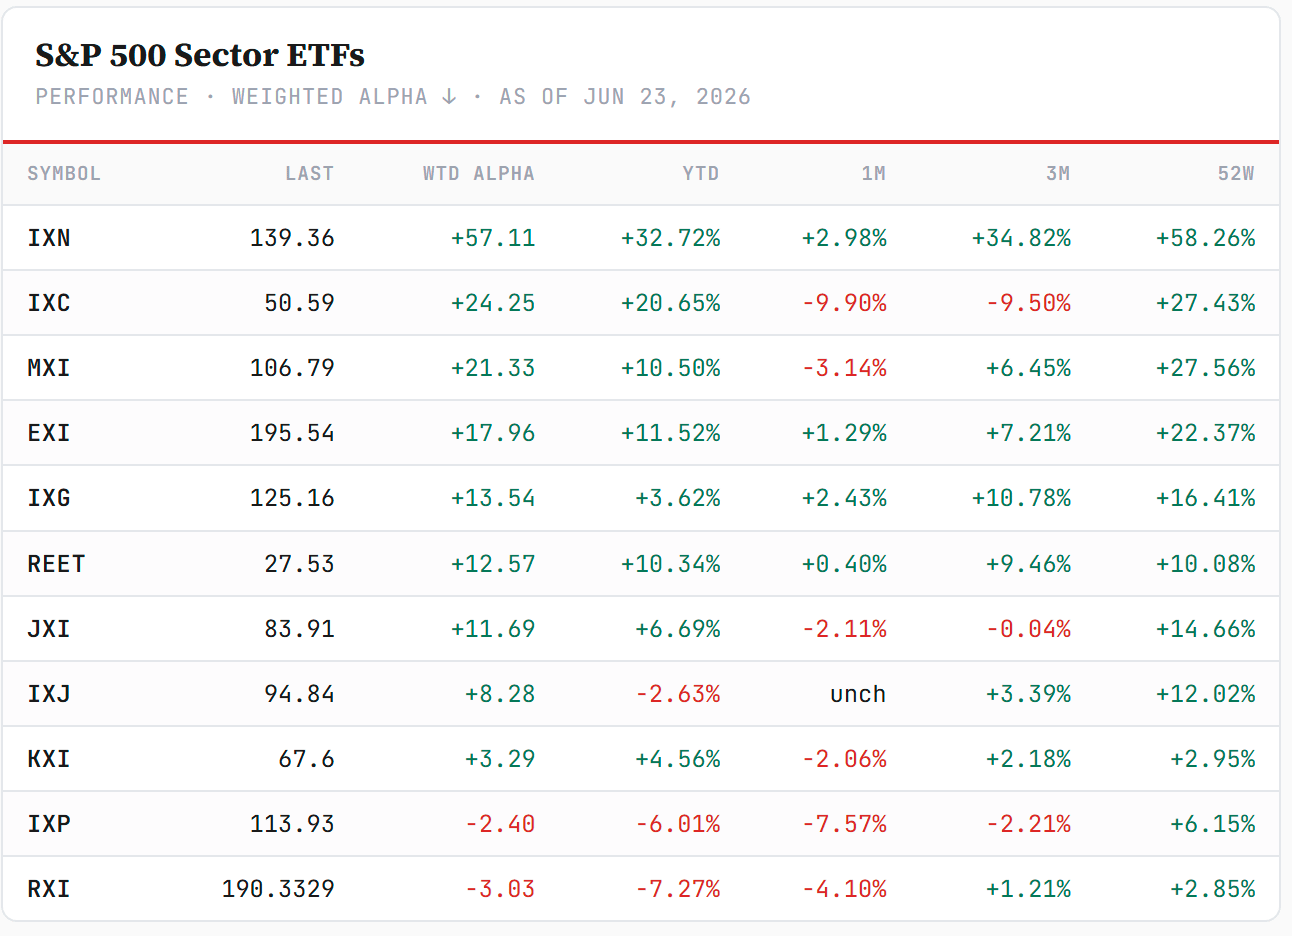
Sorted by Weighted Alpha (leaders → laggards) · Barchart, close of week.
Read top-to-bottom, this was a mixed board that leaned decidedly green: most of the eleven sectors finished higher, a textbook risk-on rotation with banks and communications on top, and only the bond proxies — utilities, energy, real estate — plus a near-flat technology in the red. The anomaly is not that tech led or lagged; it is that the sector’s flat headline hides the widest internal split we have seen since the spring.
Inside technology. Here is the week’s real story. The tech shelf broke cleanly in half: software and cloud ran hard, while the entire semiconductor complex fell — and the heavier the equipment and memory tilt, the deeper the damage. A double-digit gap opened between the software baskets and the semis in five sessions.
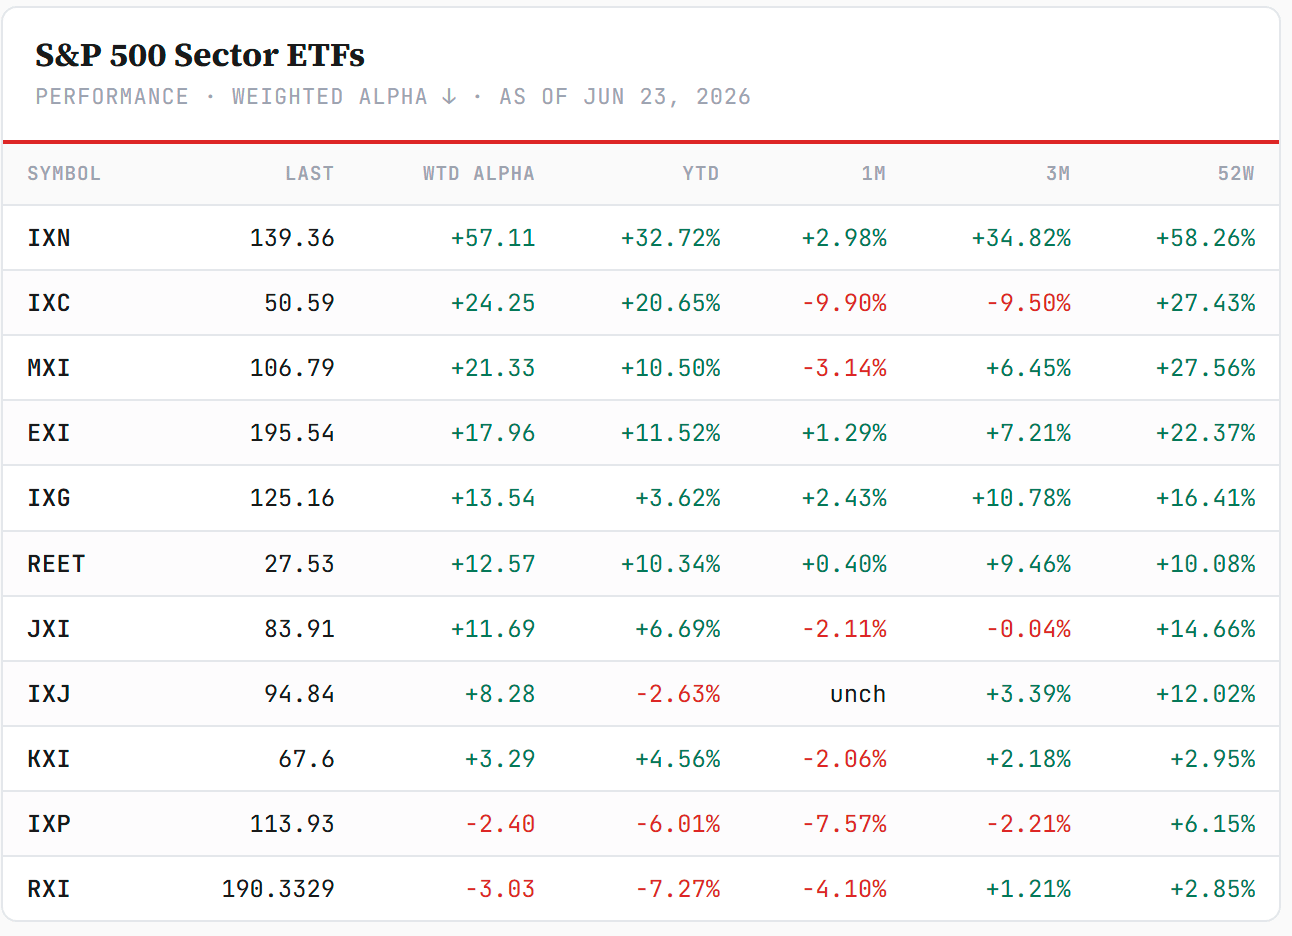
Sorted by Weighted Alpha (leaders → laggards) · Barchart, close of week.
The split inside tech — software firm, silicon soft — is the cleanest tell on the board, and the one we lean on most below. Note the path, not just the close: the semis were up sharply at midweek before giving it all back and more into the holiday, and the memory and equipment names were the epicenter.
Across the regions. Regionally, the US kept a relative bid while Europe stayed firm, and the emerging complex was mixed. Nothing here argues for a leadership change away from US large-cap yet, though the softer dollar quietly helps the non-US books.
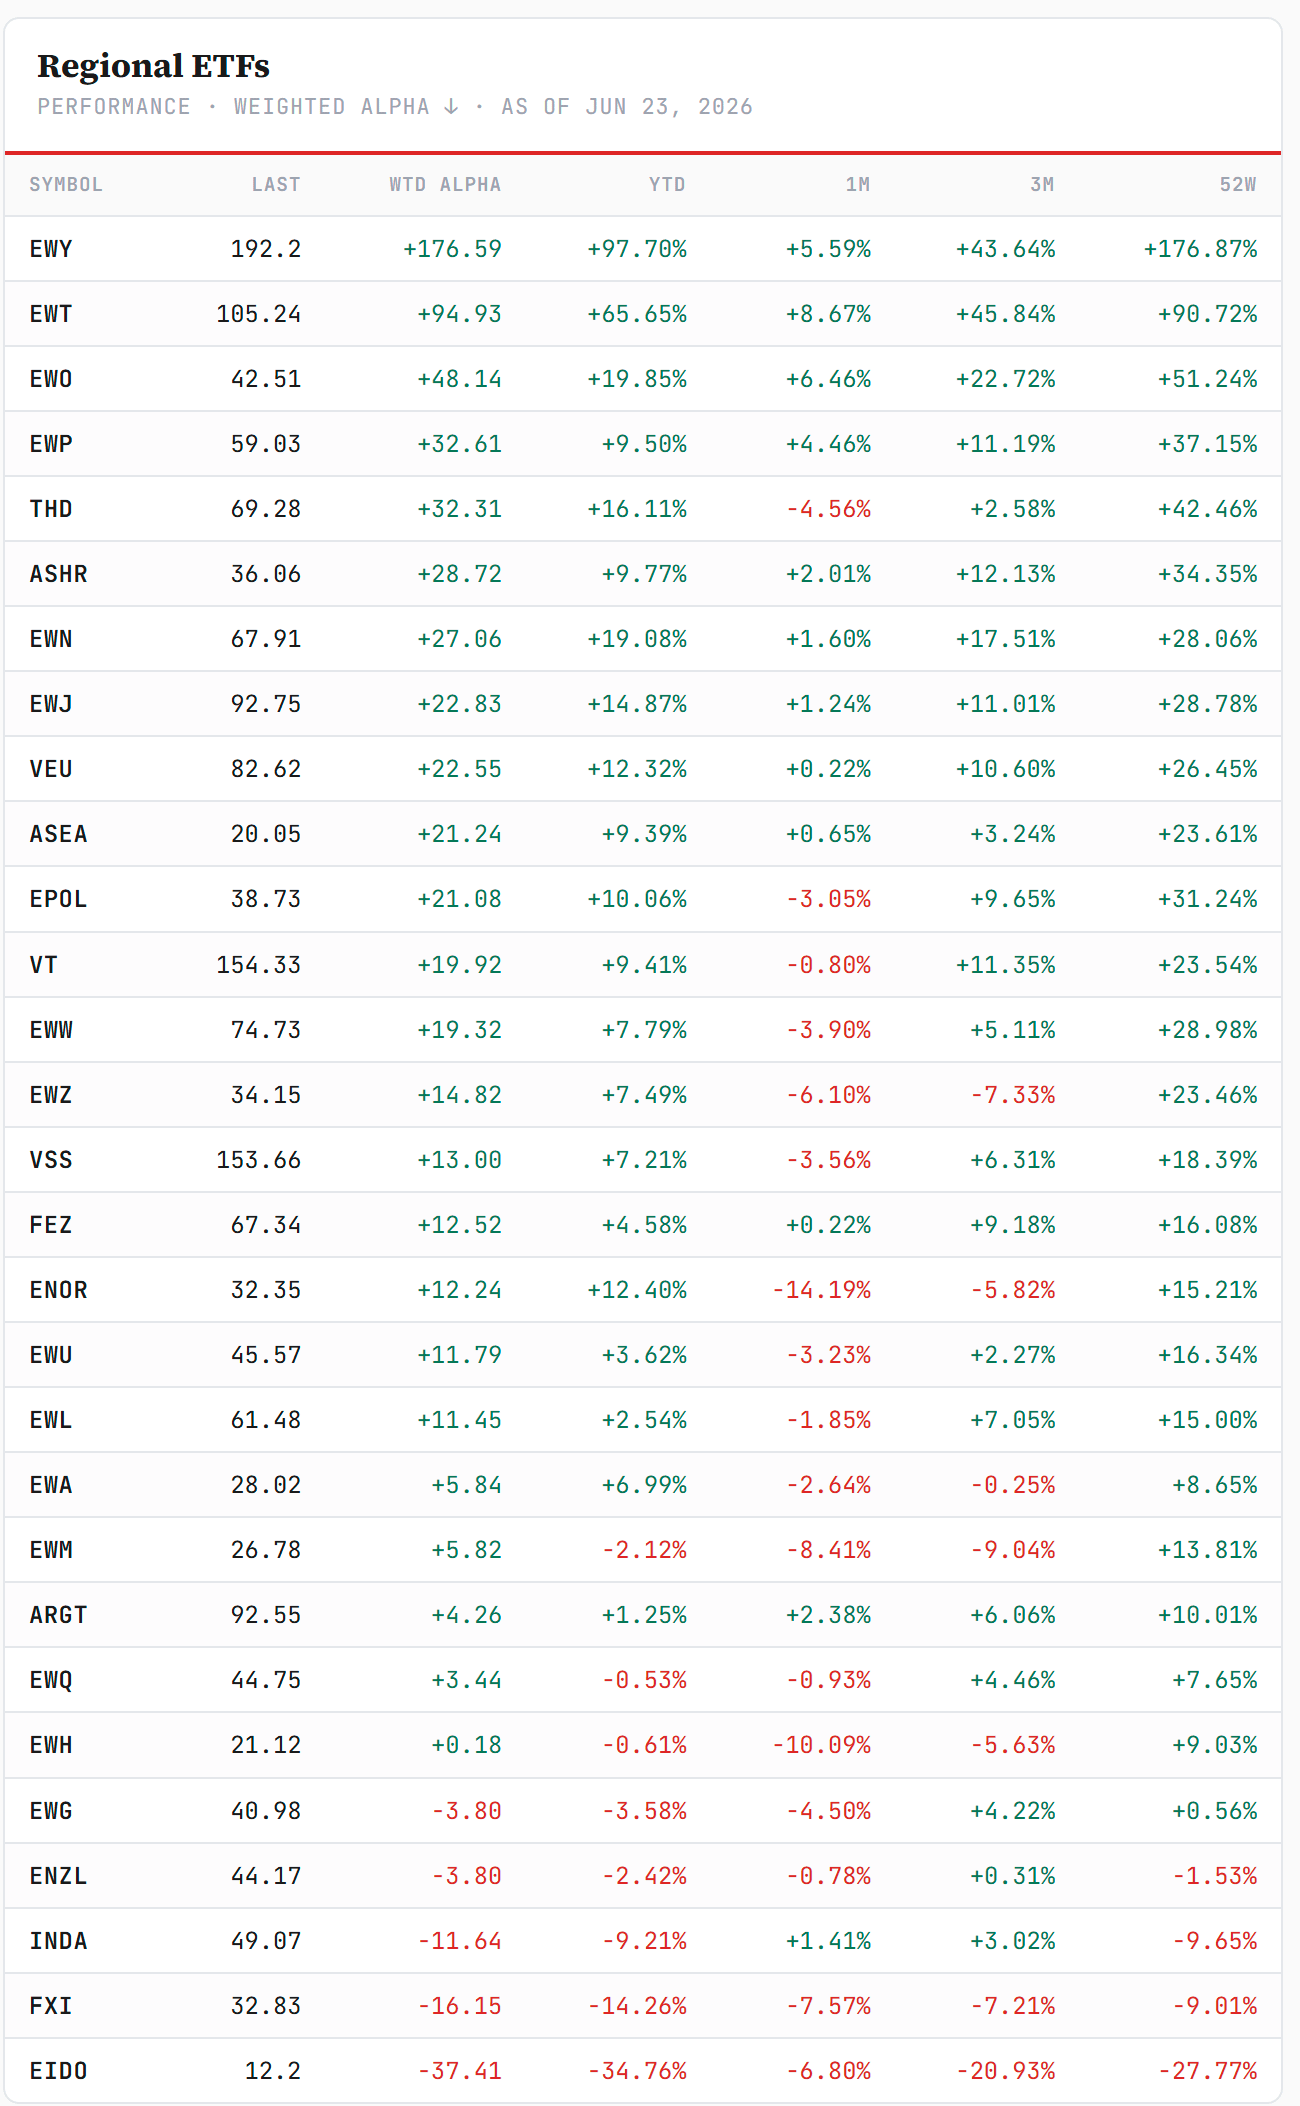
Sorted by Weighted Alpha (leaders → laggards) · Barchart, close of week.
The global sector picture. Globally, the same signature repeats — growth-and-cyclicals lead, defensives lag — which tells us the week’s move is a factor story, not a US-only one.
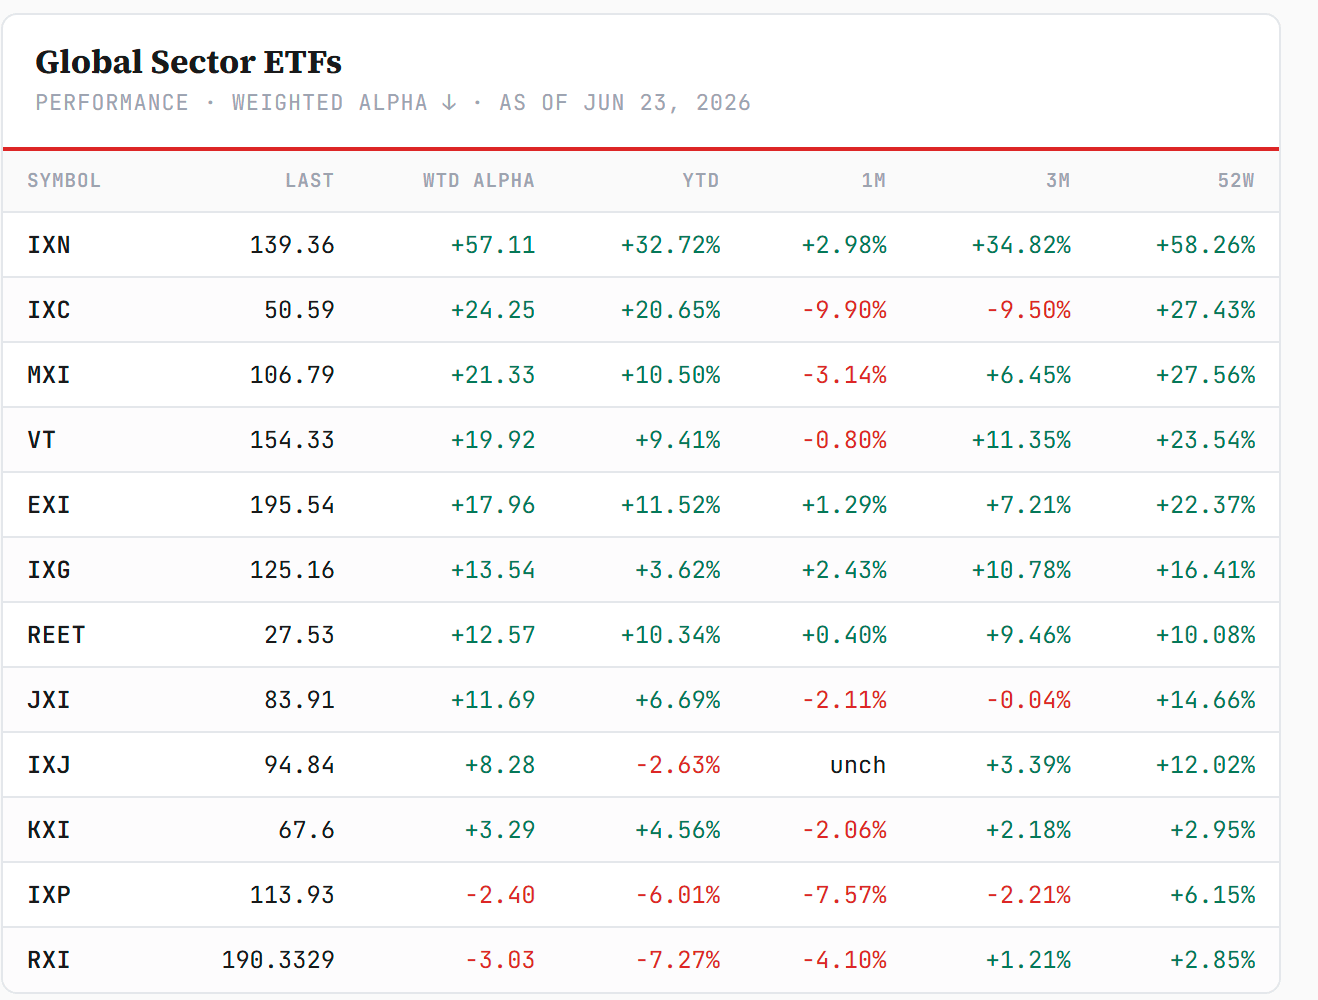
Sorted by Weighted Alpha (leaders → laggards) · Barchart, close of week.
Whether the software leg is durable broadening or a violent one-week rotation against a still-unresolved semi selloff is the next section’s question.
2 · The State
The US market map. Read through the relative-rotation lens, the eleven sectors cluster the way the boards imply: financials and communications sit in the Leading quadrant, the defensives are Lagging, and technology sits astride the divide — because the sector is no longer one thing.
The one-line reduction: broad participation on the surface, a deep fault line underneath.
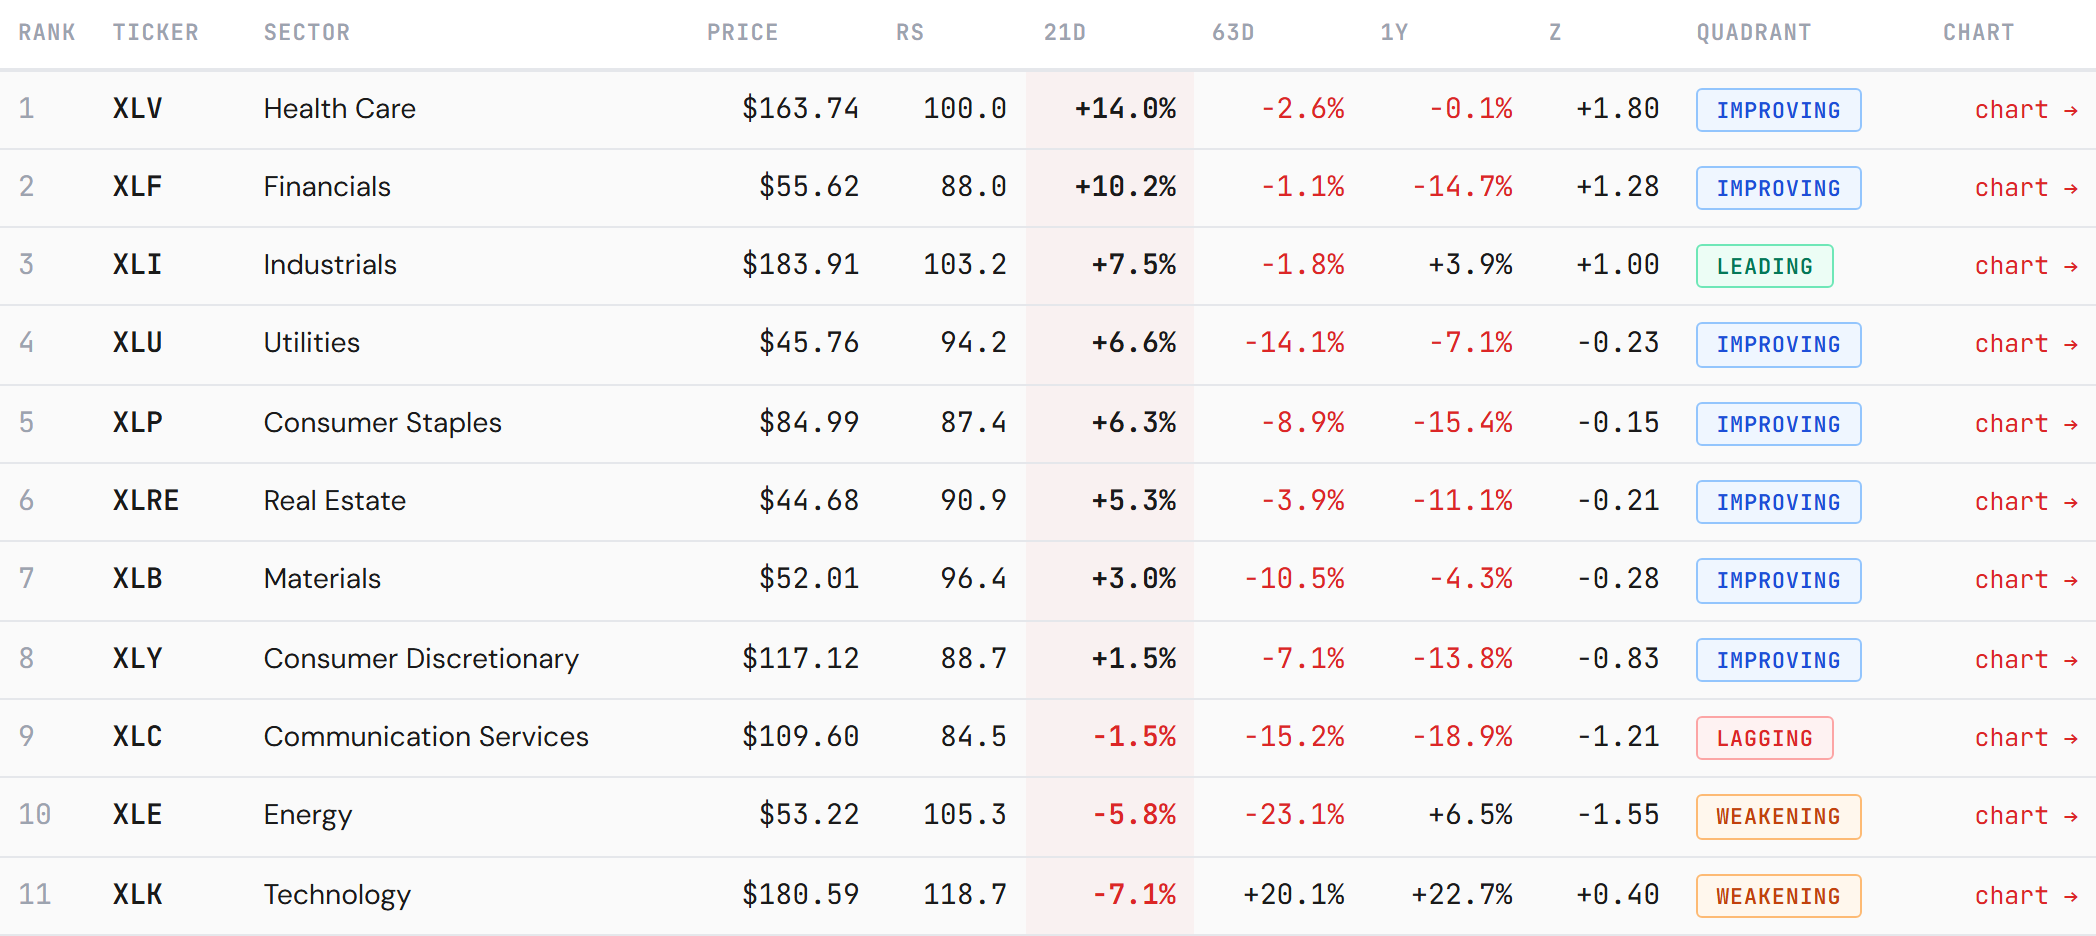
The thesis. The tape is risk-on and broadening at the index level, but the broadening is uneven — and the single most important relationship on our screen, chips-versus-software, just inverted hard. For a year the AI trade meant buy the build-out; this week the market paid for what uses intelligence and sold what builds it.
How wide — the software-over-semis spread is the widest in months, and it opened in a single week. Spreads this wide, this fast, tend to be either the start of a genuine leadership change or a repositioning that snaps back — rarely nothing.
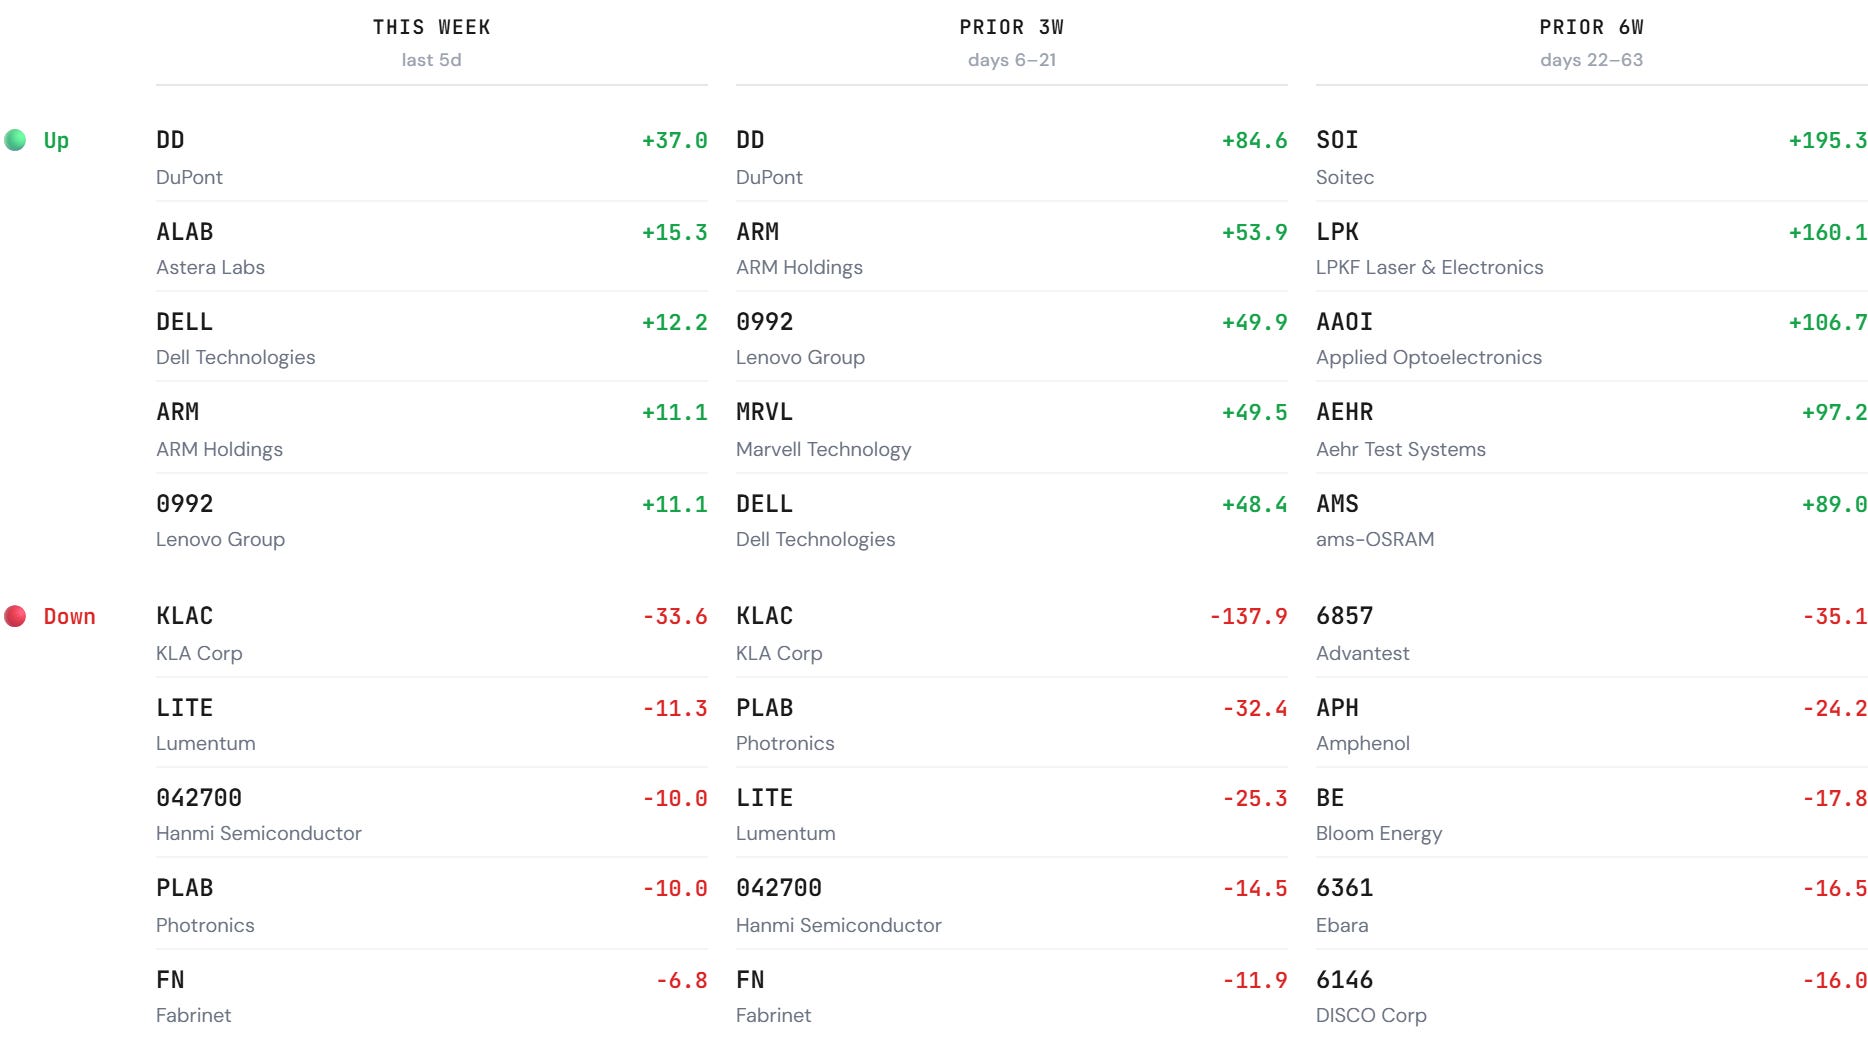
Where the damage concentrated — not “big tech,” and not broad semis evenly. It was the most capex-sensitive nodes: memory, storage, and the equipment names. The application and software layer was not just spared — it led.
The earnings backing — the reason the market can rotate rather than de-risk is the profit picture behind it. Consensus still carries an unusually high 2026 earnings bar, and it is concentrated: tech and infrastructure carry the heaviest projected growth, the low-expectation half of the market much less. This week the low-expectation half rallied while the highest-expectation corner repriced — a rehearsal of what a bar this high does to a small miss.
Seasonality — July is historically one of the Nasdaq’s better months, which argues for continuation; but 2026 is a midterm year, and the run into a midterm has historically been the weakest stretch of the four-year cycle. The tilt argues both ways — we hold both.
Leadership across the themes. The more useful cut this week is thematic, and it maps directly to our own indices — the deployment side of the trade and the build-out side went opposite directions by a wide margin in five sessions.
Leading — the agentic and deployment cohort: applications, security, identity, the names that run on AI. This is the AW40 and HALO side of the barbell.
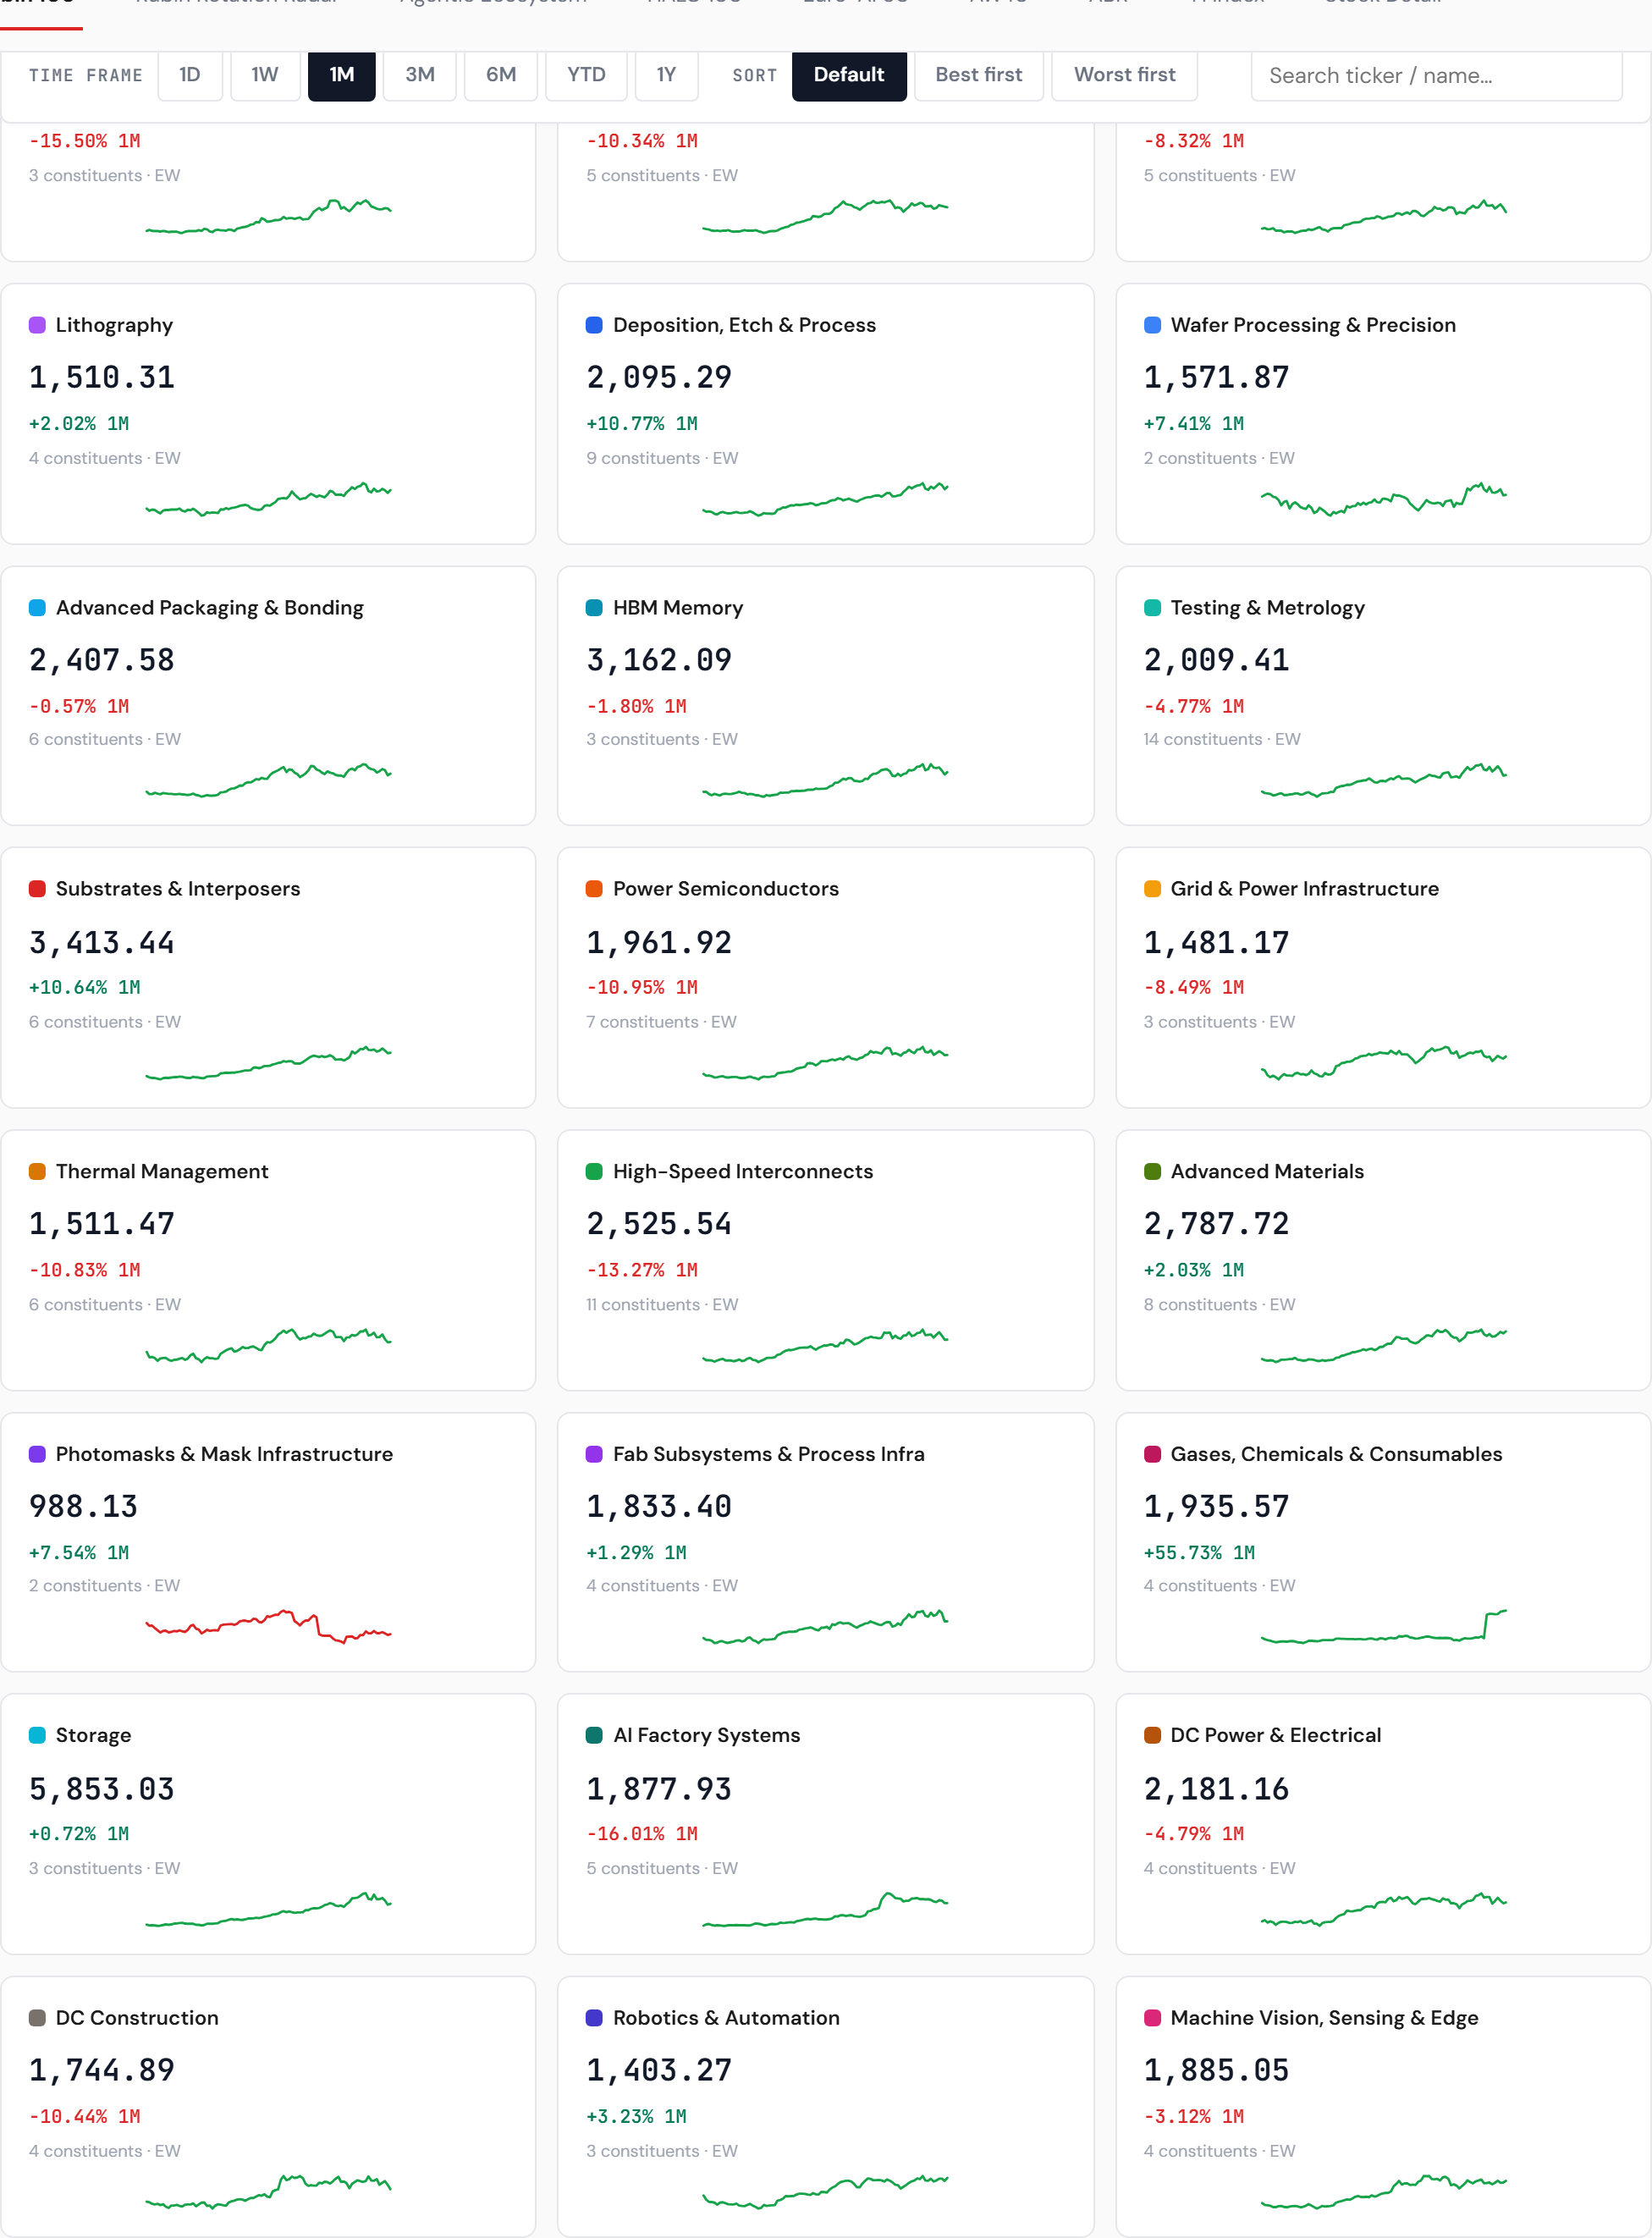
Lagging — the build-out core: memory, storage, foundry and fab subsystems — the Rubin side, where the capex sensitivity is highest.
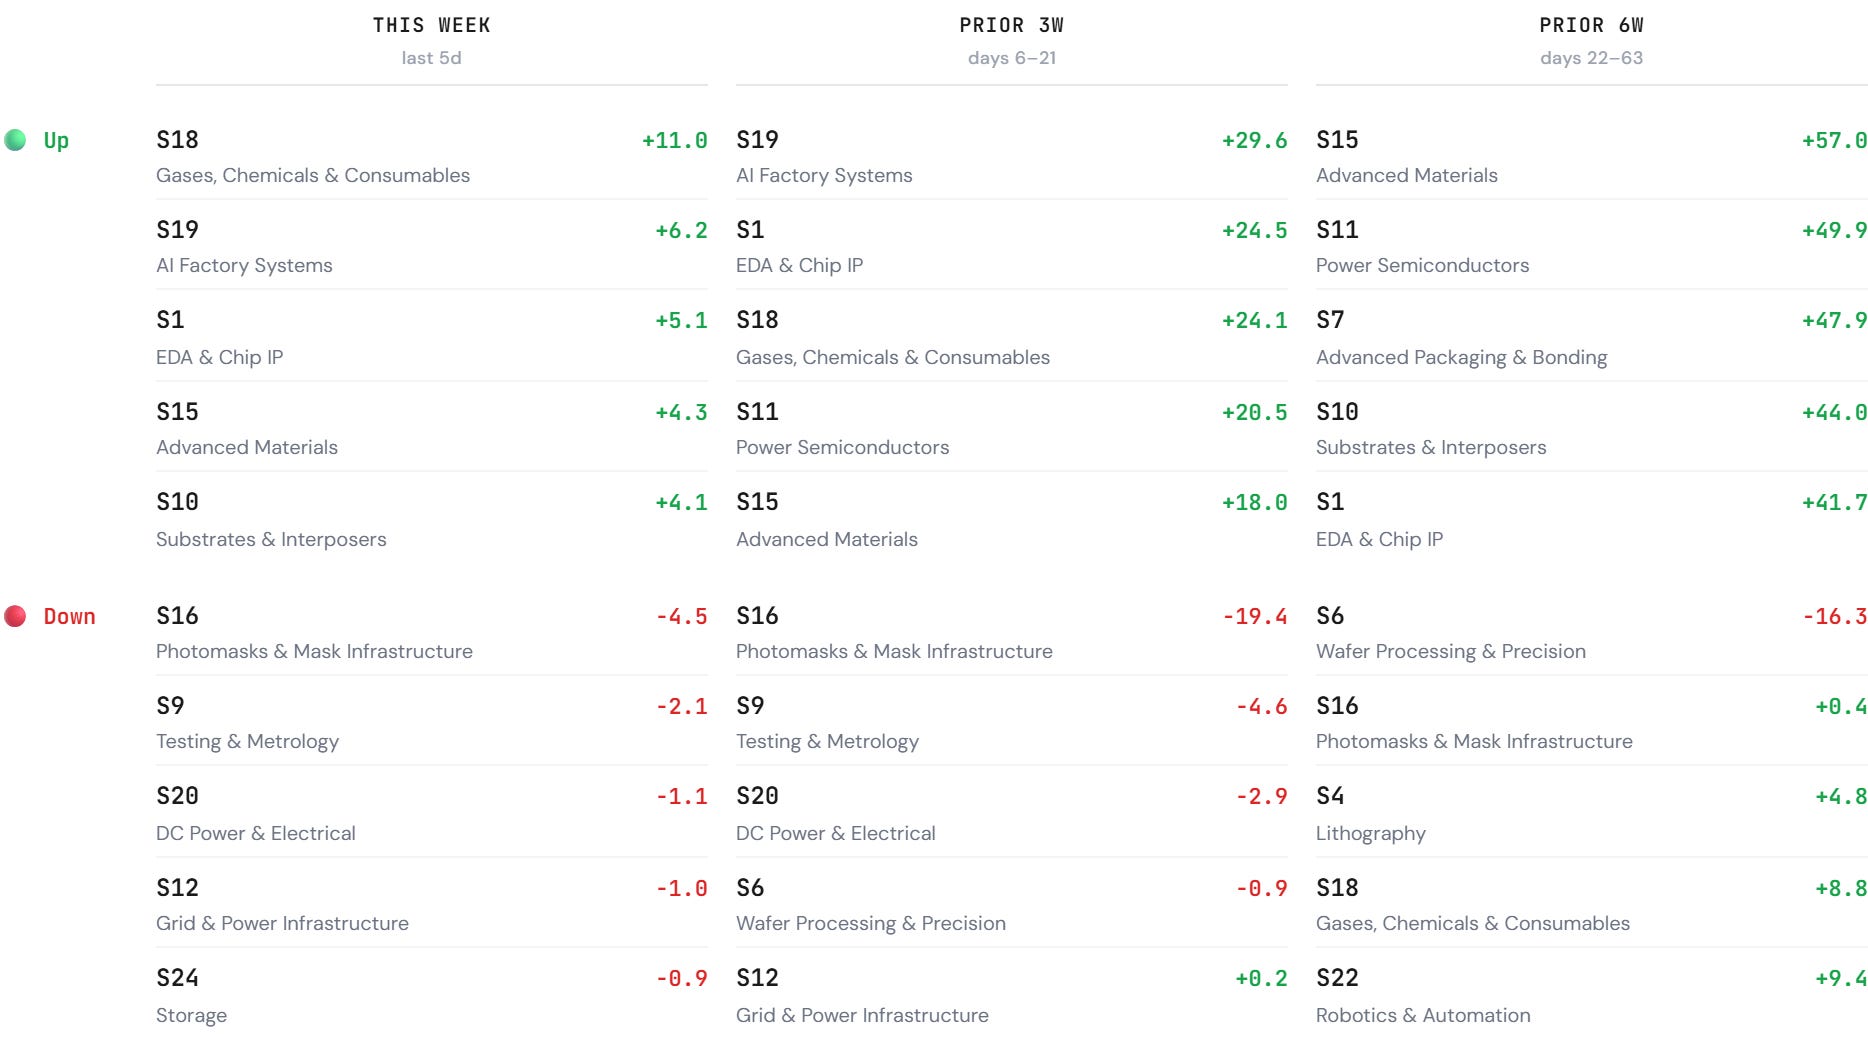
But the damage inside the build-out was selective, not uniform — and the internal tell cuts the other way. Inside Rubin the periphery held while the crowded core cracked: the previously-lagging peripheral sectors (materials, vision, grid) actually led the index on the week, while the consensus core (memory, storage, foundry) took the hit. That relative-laggard outperformance is a mean-reversion signal worth flagging — the money leaving the crowded core did not leave the thesis, it rotated within it.
That chips-over-software split — deployment over build-out — is the single relationship we would watch break first if the regime is turning, in either direction.
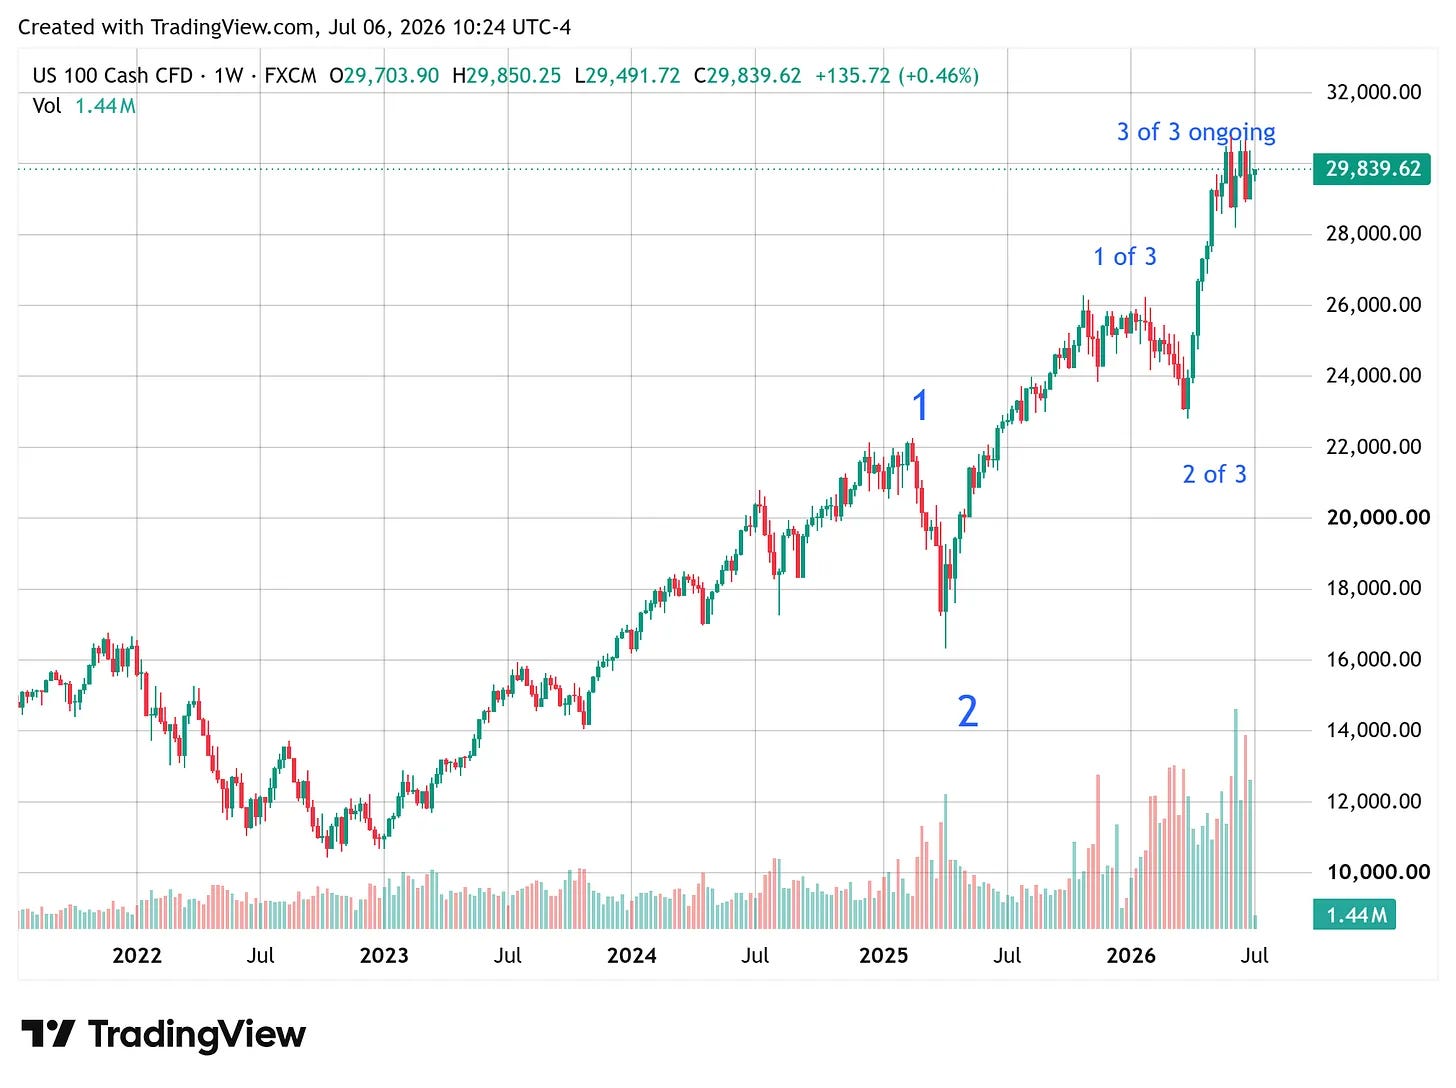
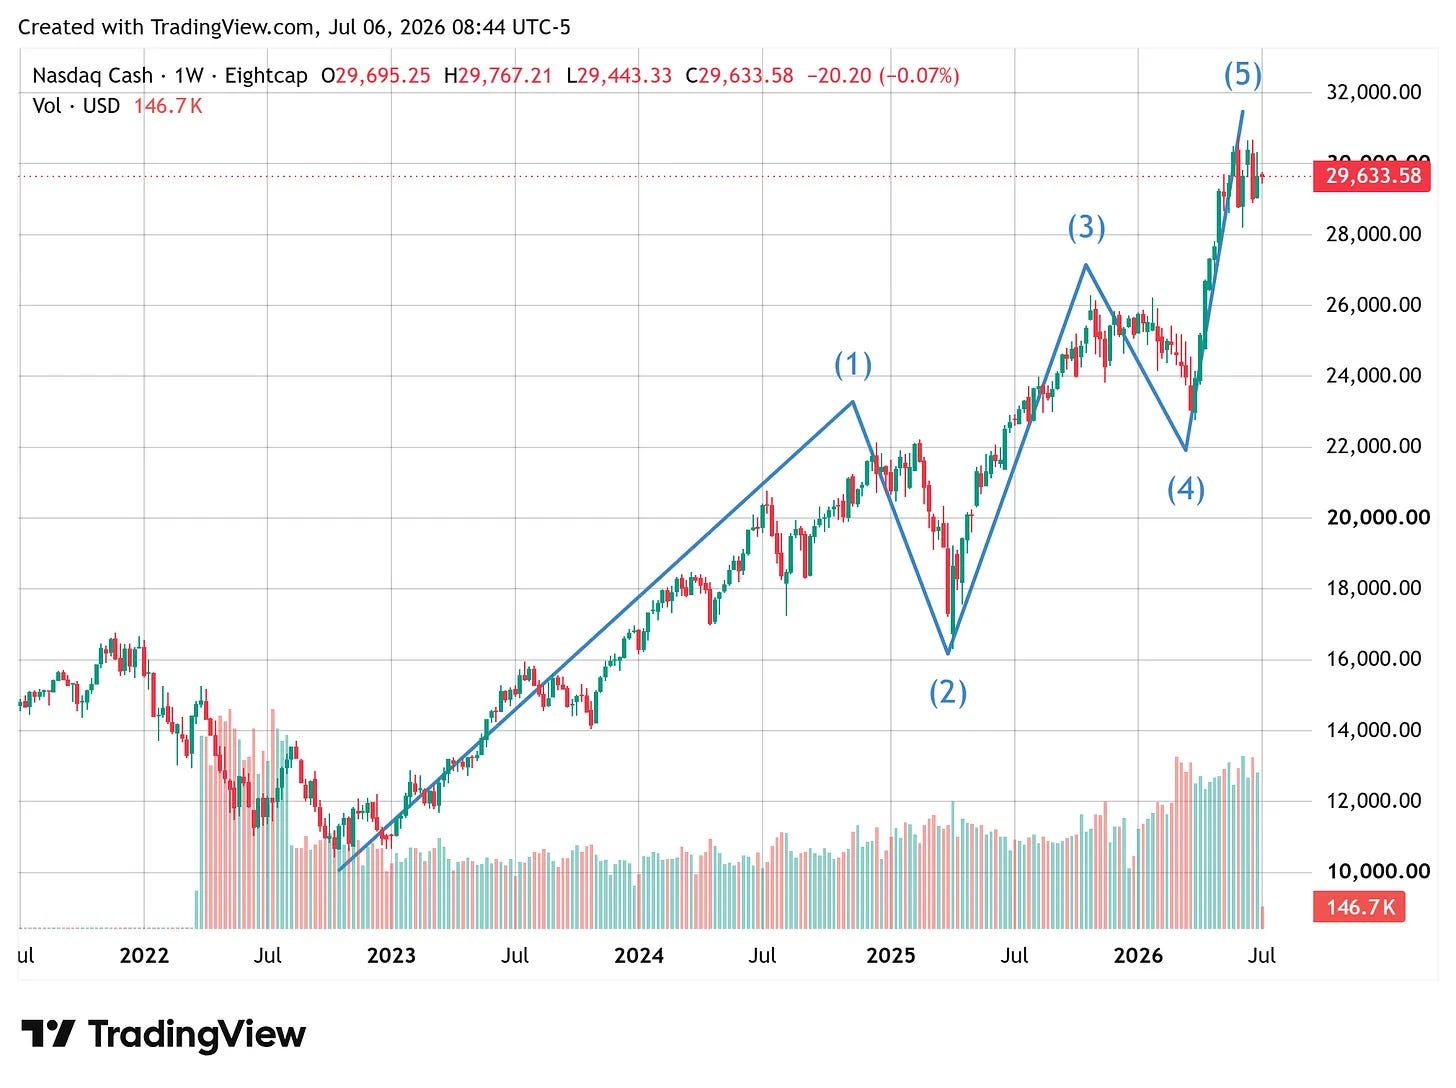
The structural read — two counts, one fork. The Nasdaq-100’s weekly Elliott picture is genuinely two-handed this week, and the distance between the two readings is unusually wide — so we hold both.
The bullish count — an extended third wave, no end in sight. On this reading the advance off the 2025 low is a large, extending third wave that is nowhere near finished. Count the sub-structure and it is still early: wave 1-of-3 ran into the end of 2025, wave 2-of-3 corrected into April 2026, and we are now inside wave 3-of-3 — the most powerful stretch of any impulse, and the one that tends to extend rather than terminate. If this is the right label, the recent chop is a pause inside a third wave, not a top, and the trend has room well beyond the prior high.
The bearish count — a completed five. On the mirror reading, the same rally is a finished five-wave sequence from the 2022 low: the recent high in the 31–32k zone is wave (5), not wave (3). If that is the label, the impulse is complete and the correction now due is of a larger degree than anything since 2022 — a months-long affair, not a dip.
The two agree on the near term — a pause here — and disagree on everything after it. We do not need to pick today; we need the level that tells us which, and the semis are the cleanest early tell.
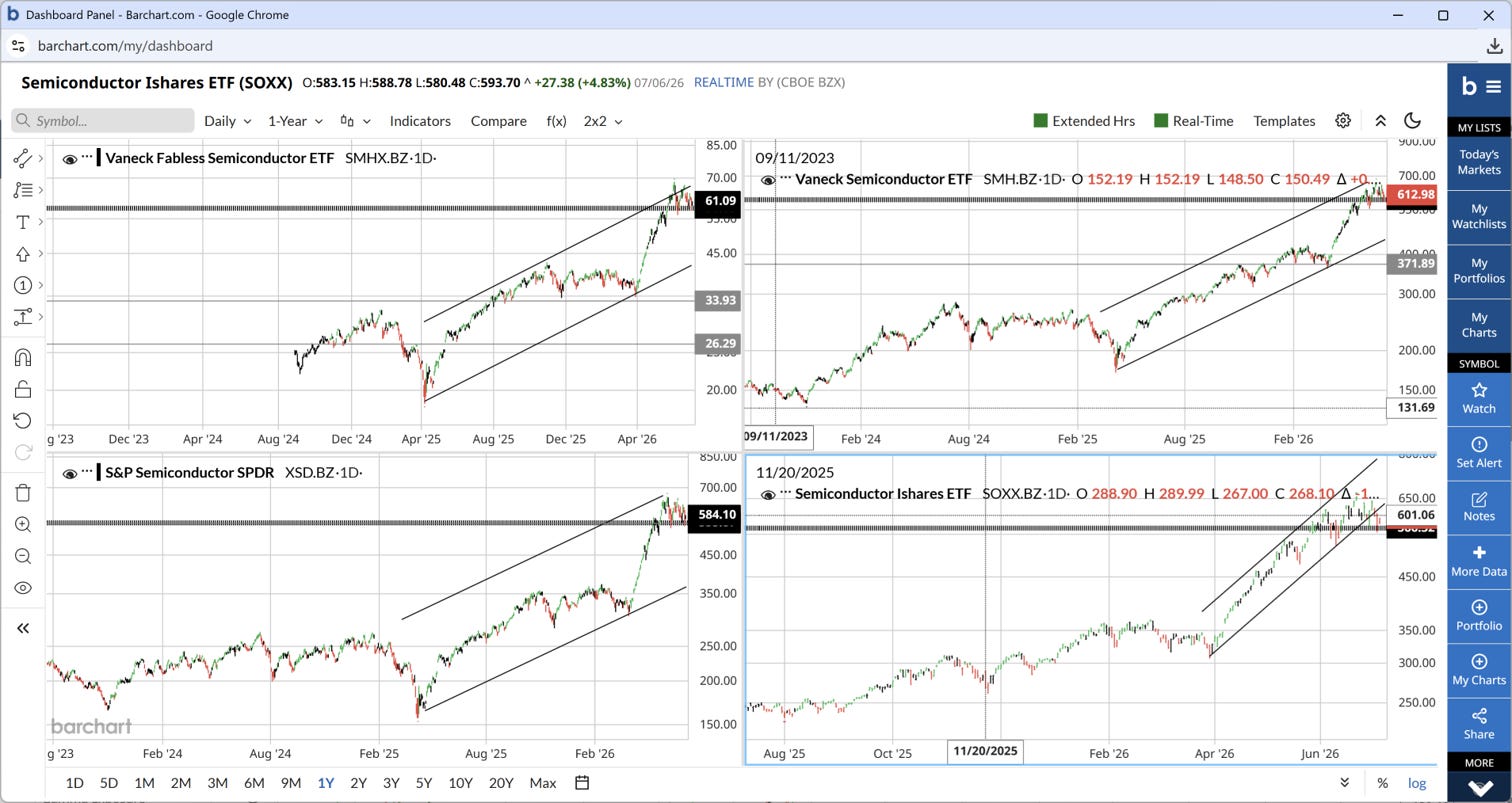
Inside the semis — a broken steep trend, a double bottom, one clean test. The semiconductor complex (SOXX) ran in a very steep uptrend from early April; that steep line is now broken and over. A broken steep trend is not a broken bull — steep trends almost always give way to shallower ones or a pause, not necessarily a reversal. Price now sits at double-bottom support, and the normal, constructive path from here is another bounce attempt off that base.
The read stays bullish as long as the double bottom holds. It turns only on one of two failures: if the double-bottom low gives way, or if the bounce that follows cannot carry price back to a new all-time high. Either failure argues for a more prolonged correction — and would be the semi-side confirmation of the completed-five count above.
The internals behind the map. The same picture, three ways down: the sector indices show where the absolute return is being made, the rotation map shows what is shifting beneath the surface, and the single-stock movers name which stocks did the leading and the wrecking.
3 · The Outlook
The forward read we hold lightly and reset each week — the price will tell us before the narrative does. This week the question is a single one, and it is a level: does the semi dip get bought.
The four indices — the clearest read we have. We track this cycle through four functional indices, and last week they separated in a way that tells the story better than any single number.
The build-out side — Rubin — was the only one red, dragged by the semis. The three that lean to the deployment of AI were all green: the agentic-opex index (AEI), the agentic winners (AW40) and functional growth (HALO) — with AW40 and HALO out in front of AEI. Read alongside software’s leadership, it suggests the bottom in the software and application complex (IGV) is probably in.
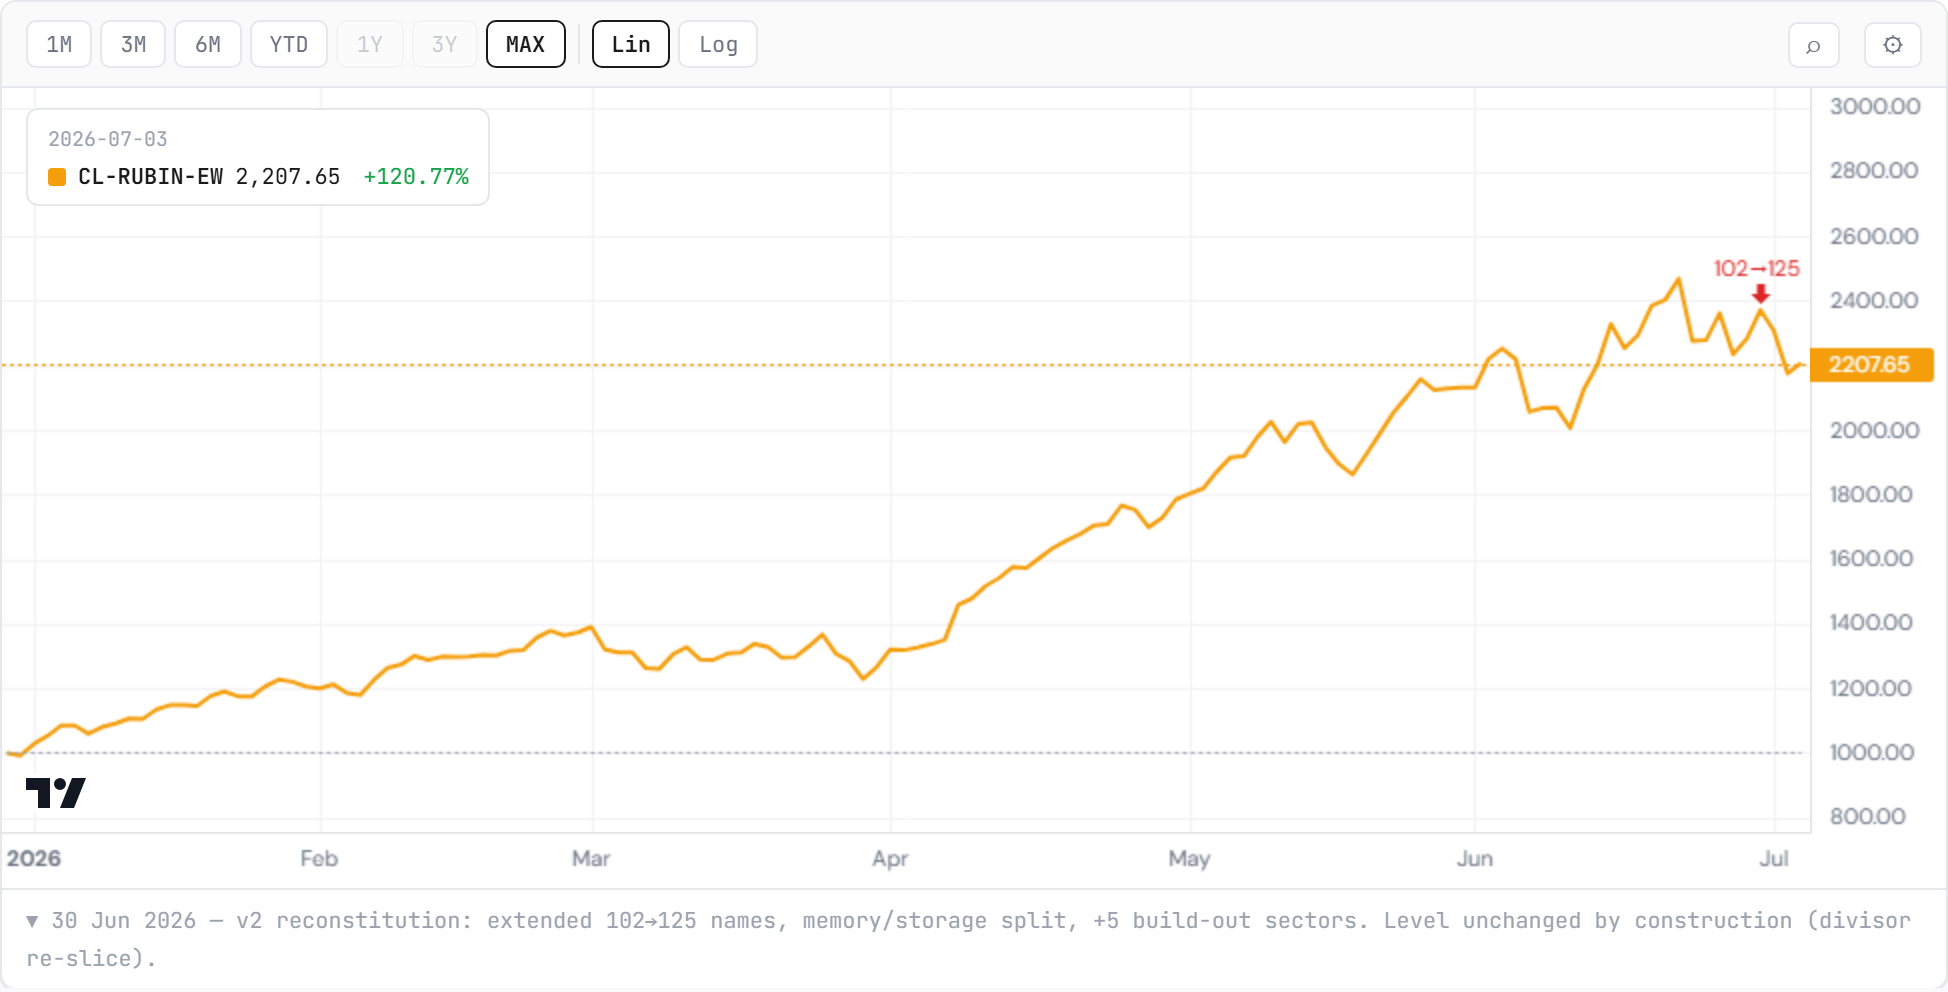
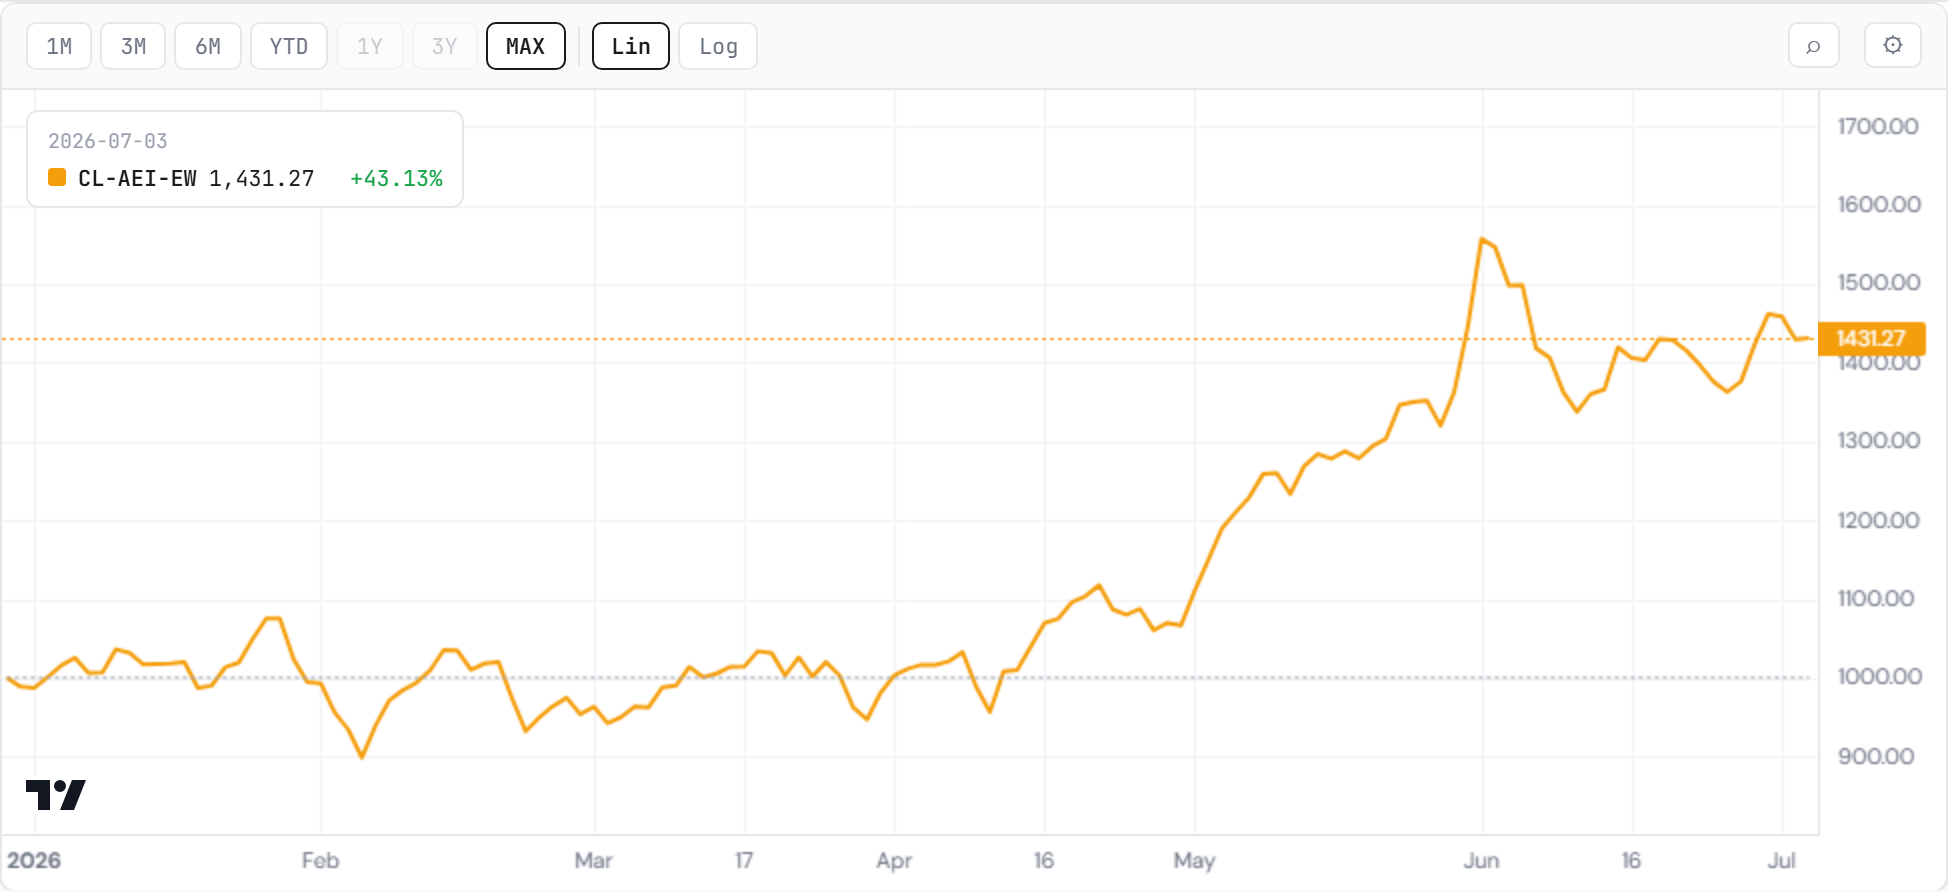
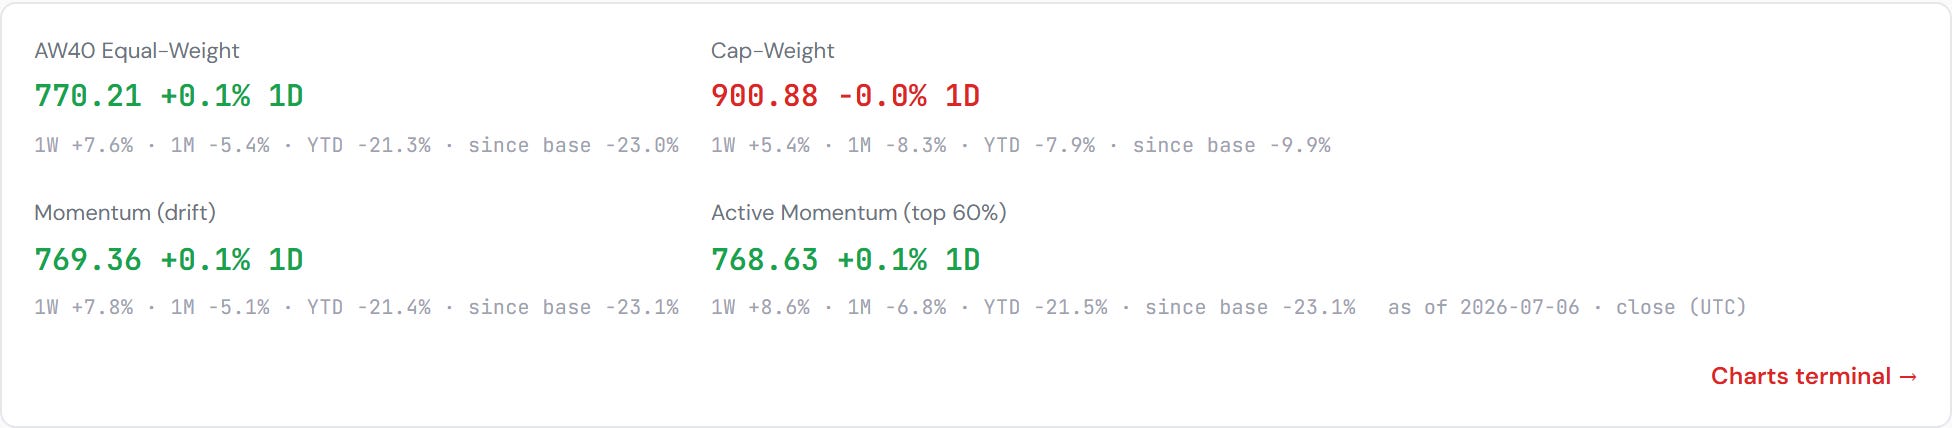
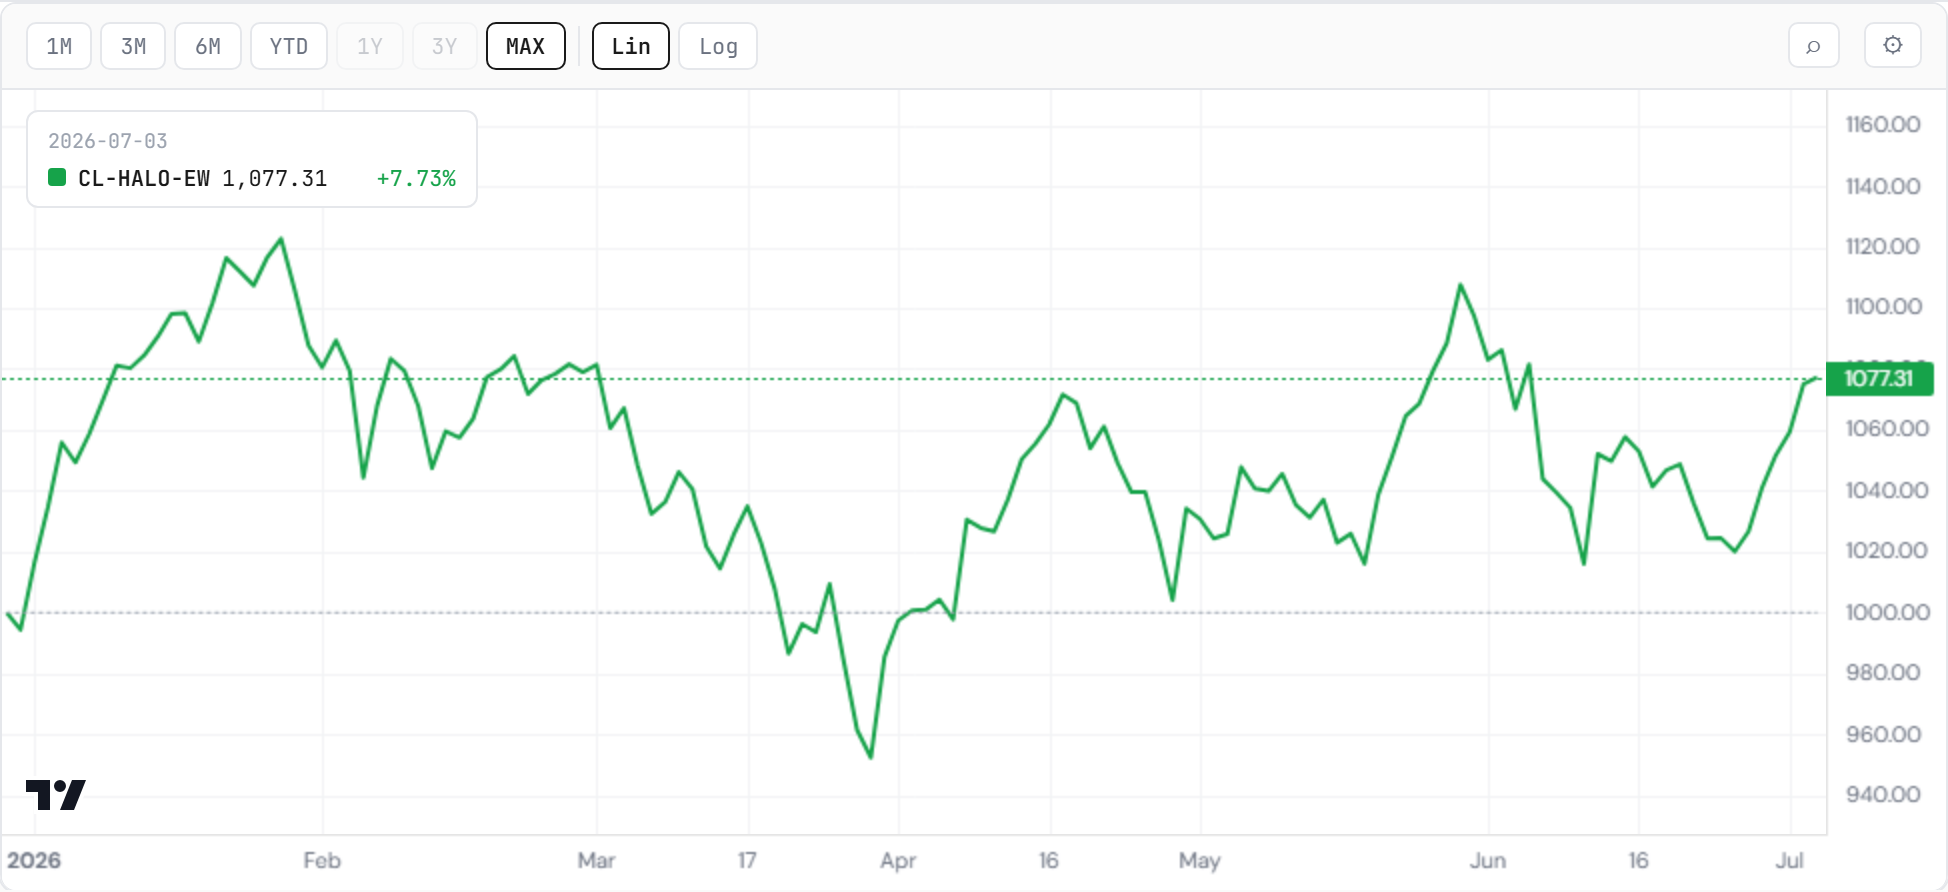
The distinction between the two agentic indices is the point. AW40 is the bet that you know which applications win — a concentrated winners’ list. AEI is the humbler bet: that there will be winners, whoever they turn out to be, and that all of them get taxed by the same toll-booth infrastructure underneath. Which of the two leads over the coming months is genuinely unclear — and we hold it open.
Two scenarios into the seasonally softer late-summer and autumn window:
The bullish one — all three AI indices (build-out, opex and winners) move up together, HALO with them, and the four form a longer-, medium-term bottom. That is the shape we lean to for July.
The less-bullish one — the strength narrows, and only one of the three AI indices carries while the others lag.
Either way we expect positive results into the earnings season. The risk we watch is not price but expectations: earnings-growth estimates may be peaking this summer, and if they are, the downward revisions arrive by autumn — the same conclusion we reach, from the other direction, in this week’s Weekly Signal.
If the equipment and memory complex is reclaimed quickly, this week was positioning ahead of the July prints and the dispersion closes from below — the build-out rejoins the deployment side. If it is not, the market is telling us something about AI-capex expectations before a single number is reported, and the build-out core stays the live read on that conversation.
The macro frame sits underneath all of it — whether the inflation impulse is cresting or entrenching is what decides how much multiple the build-out gets to keep, and firmer yields this week are a small vote for caution on the long-duration names.

The point is not to chase the software leader but to watch the semi laggard: the asymmetry into next quarter lies in whether the build-out turns up to rejoin the deployment side, or whether the split widens into the earnings season and the summer.
🔒 Be Informed — the rest is for subscribers. Free: the LinkedIn newsletter + closelook.net. C+ (paid): real-time push on every portfolio move → closelook.net/subscribe.
