

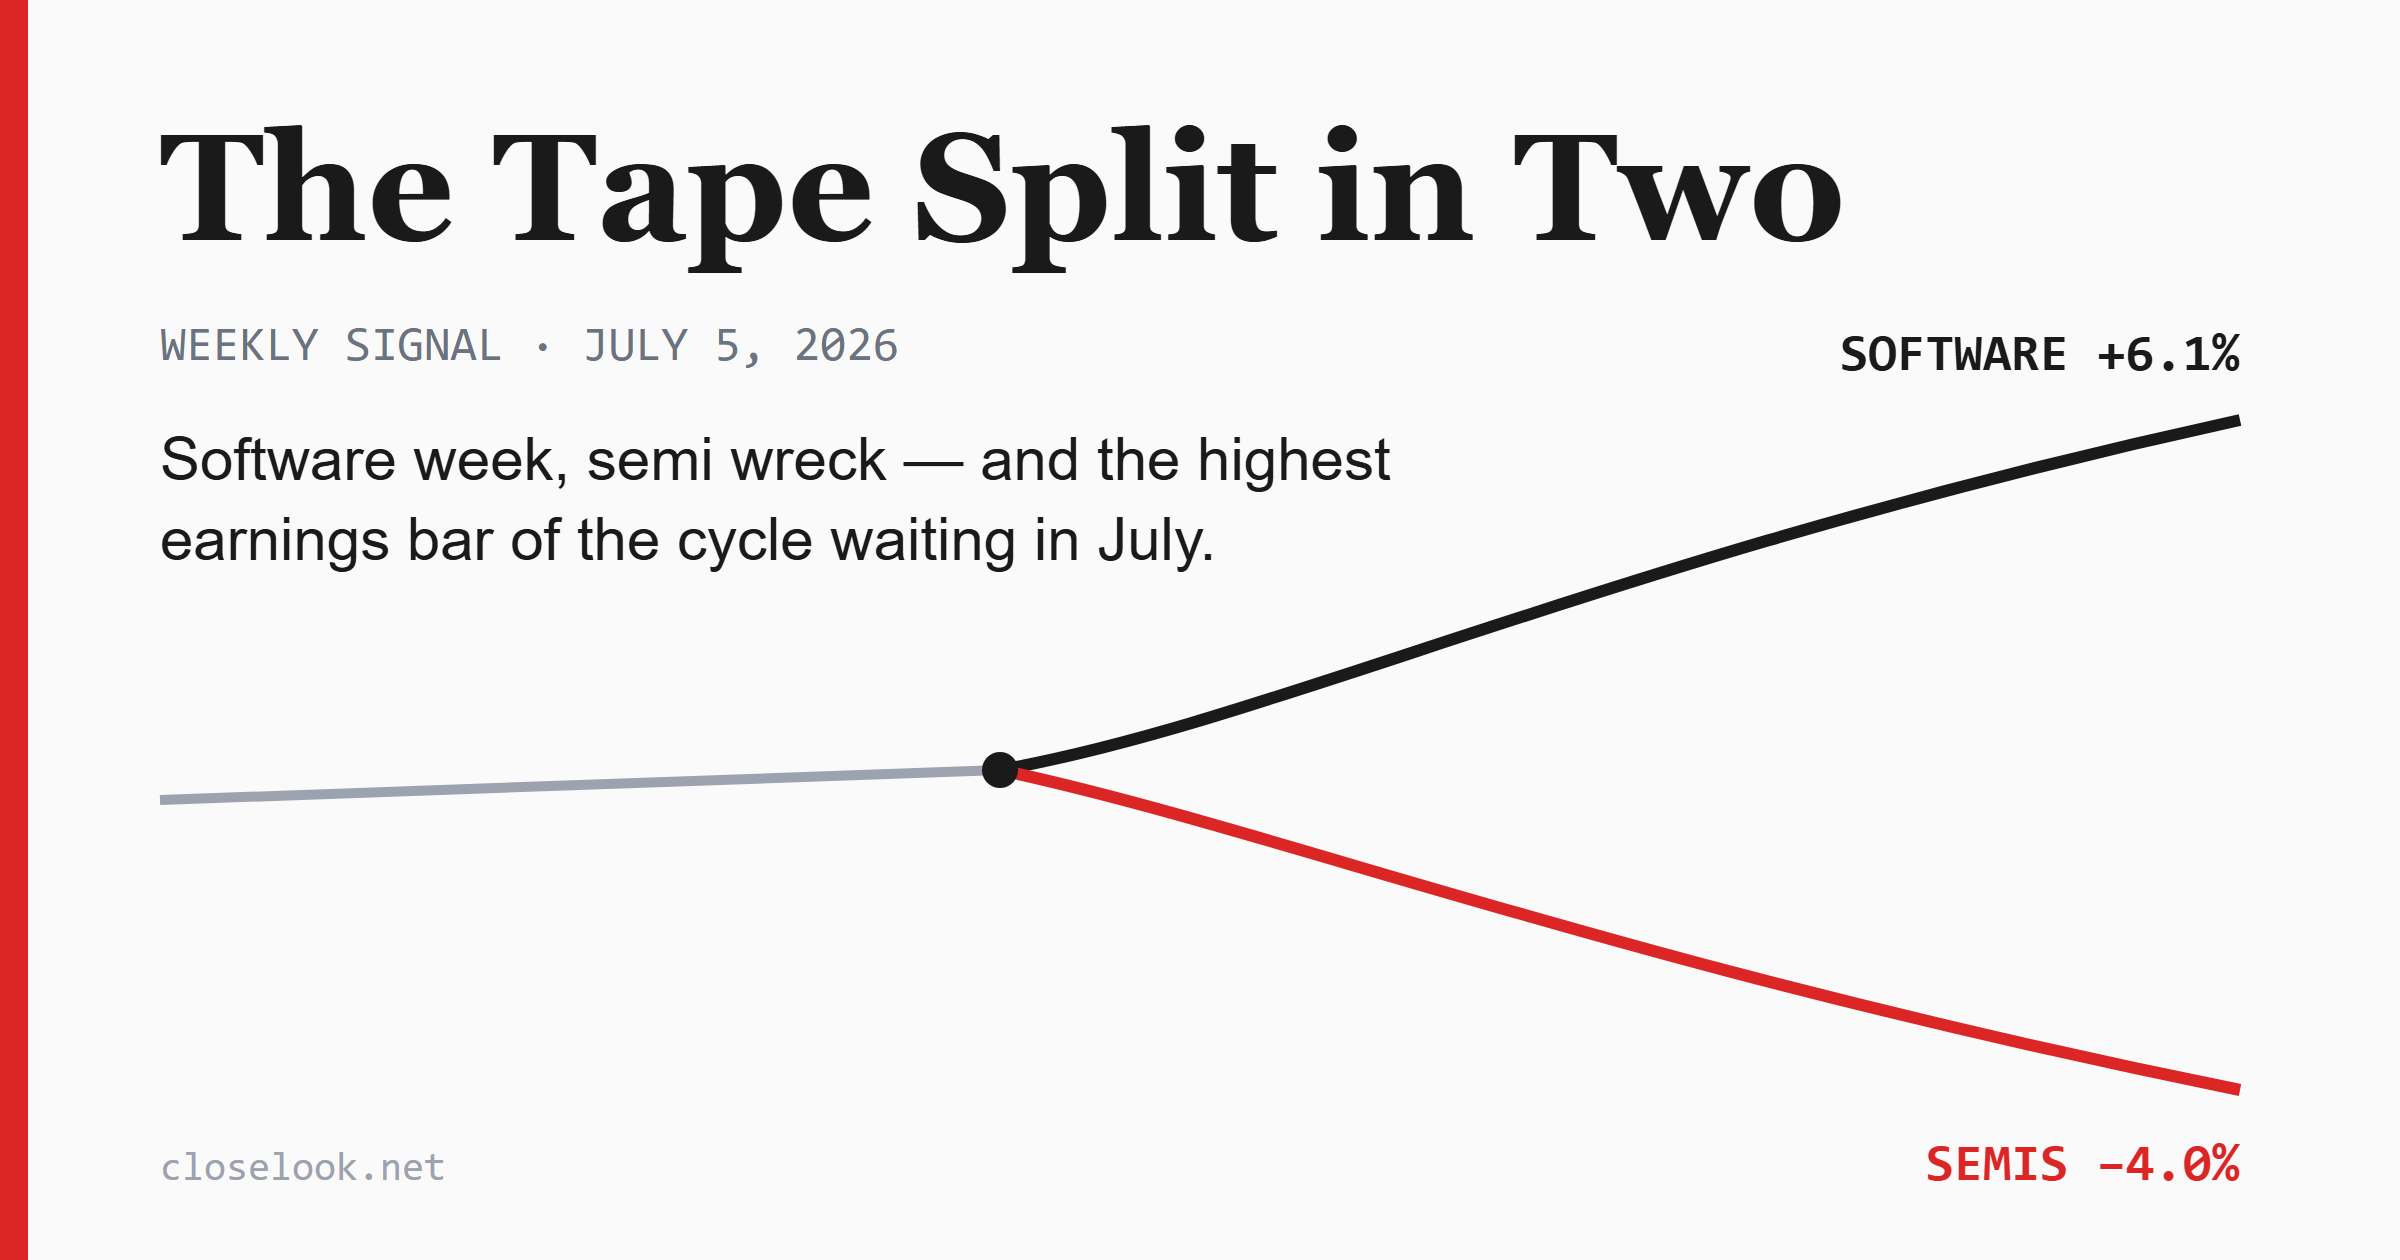
The Tape Split in Two
Software week, semi wreck — the tape split in two, and the calendar behind it raises the stakes.

What the week actually did
The headline indices hid the real story. The S&P 500 added +2.2% and the equal-weight version matched it (RSP +2.2%) — participation was broad. The Dow gained +2.0%, the Nasdaq Composite +2.3%. But the Nasdaq-100 made only +0.9%, and small caps fell (IWM −0.7%). An up week for almost everything — except the two ends of the barbell where this site lives.
Sector (SPDR) Week
Financials (XLF) +3.8%
Communications (XLC) +3.2%
Discretionary (XLY) +2.4%
Health Care (XLV) +2.1%
Industrials (XLI) +1.5%
Materials (XLB) +0.8%
Staples (XLP) +0.3%
Technology (XLK) −0.3%
Utilities (XLU) −1.0%
Energy (XLE) −1.1%
Real Estate (XLRE) −1.2%
Ten weeks out of ten this ordering would read “risk-on rotation”: banks and communications on top, bond proxies at the bottom — consistent with TLT −2.1% (yields up), which also explains utilities and real estate at the tail. The anomaly is technology printing red in a +2% market week.
The Nasdaq cuts we track sharpen it:
Cut Week
Top 20 US (TOPT) +2.6%
N100 ex-Tech (QQXT) +2.2%
N100 equal weight (QQQE) +1.2%
N100 Top 30 (QTOP) +1.0%
N100 Tech (QTEC) −0.4%
Read it bottom-up: inside the Nasdaq-100, everything that is not technology had a strong week; equal weight beat the top-30, so breadth improved within the index; and the mega-cap complex itself was fine — as long as it wasn’t a semiconductor. The drag is not “big tech”. It is specifically chips.
Continue reading at https://closelook.net/weekly/2026-07-05/