


Closelooknet is a reader-supported publication — to receive new posts and support the work, become a free or paid subscriber.

For two letters running, the stress in this book came from Asia: first the Tokyo leverage unwind, then a Chinese model that claims to design chips. This week the direction of travel reversed. The market-implied odds of a September Fed hike went from roughly one-in-five to above eighty percent in a single week, spot crude traded through $100, and the US semiconductor complex closed below the support band it had held since spring — on the same day Intel delivered its fastest revenue growth since 2011 and was sold 8% for it.
And the ex-US map? Taiwan finished the week green, Korea’s decline shrank from double digits to one and a half points, the SK Hynix debut ended the week where it started, and the all-world ex-US benchmark outperformed both the S&P and the Nasdaq. This letter is about what it means when the test moves from the supplier’s side of the AI trade to the buyer’s side.
1 · This Week’s Action
The cross-asset backdrop. Oil again — USO +10.4% on the week, the second consecutive double-digit week, now +97.6% year-to-date. Copper miners joined (COPX +5.6%), silver held its bid (SLV +2.7%), and that real-asset shelf sat on top of a board whose bottom half tells the real story: the mega-cap concentrates led the equity decline again (QQQ −2.6%, QTOP −3.0%, TOPT −1.9%, against SPY −1.1%) — and this time the bond shelf fell with them (IEF −0.8%, TLT −1.3%).
That is the week’s signature. In the Tokyo-unwind week, Treasuries caught the safety bid; this week they were part of the problem. When stocks and bonds fall together, the market is not repricing growth — it is repricing the discount rate. Gold (+1.1%) and the dollar (+0.7%) both firmed, which is what that regime usually looks like.
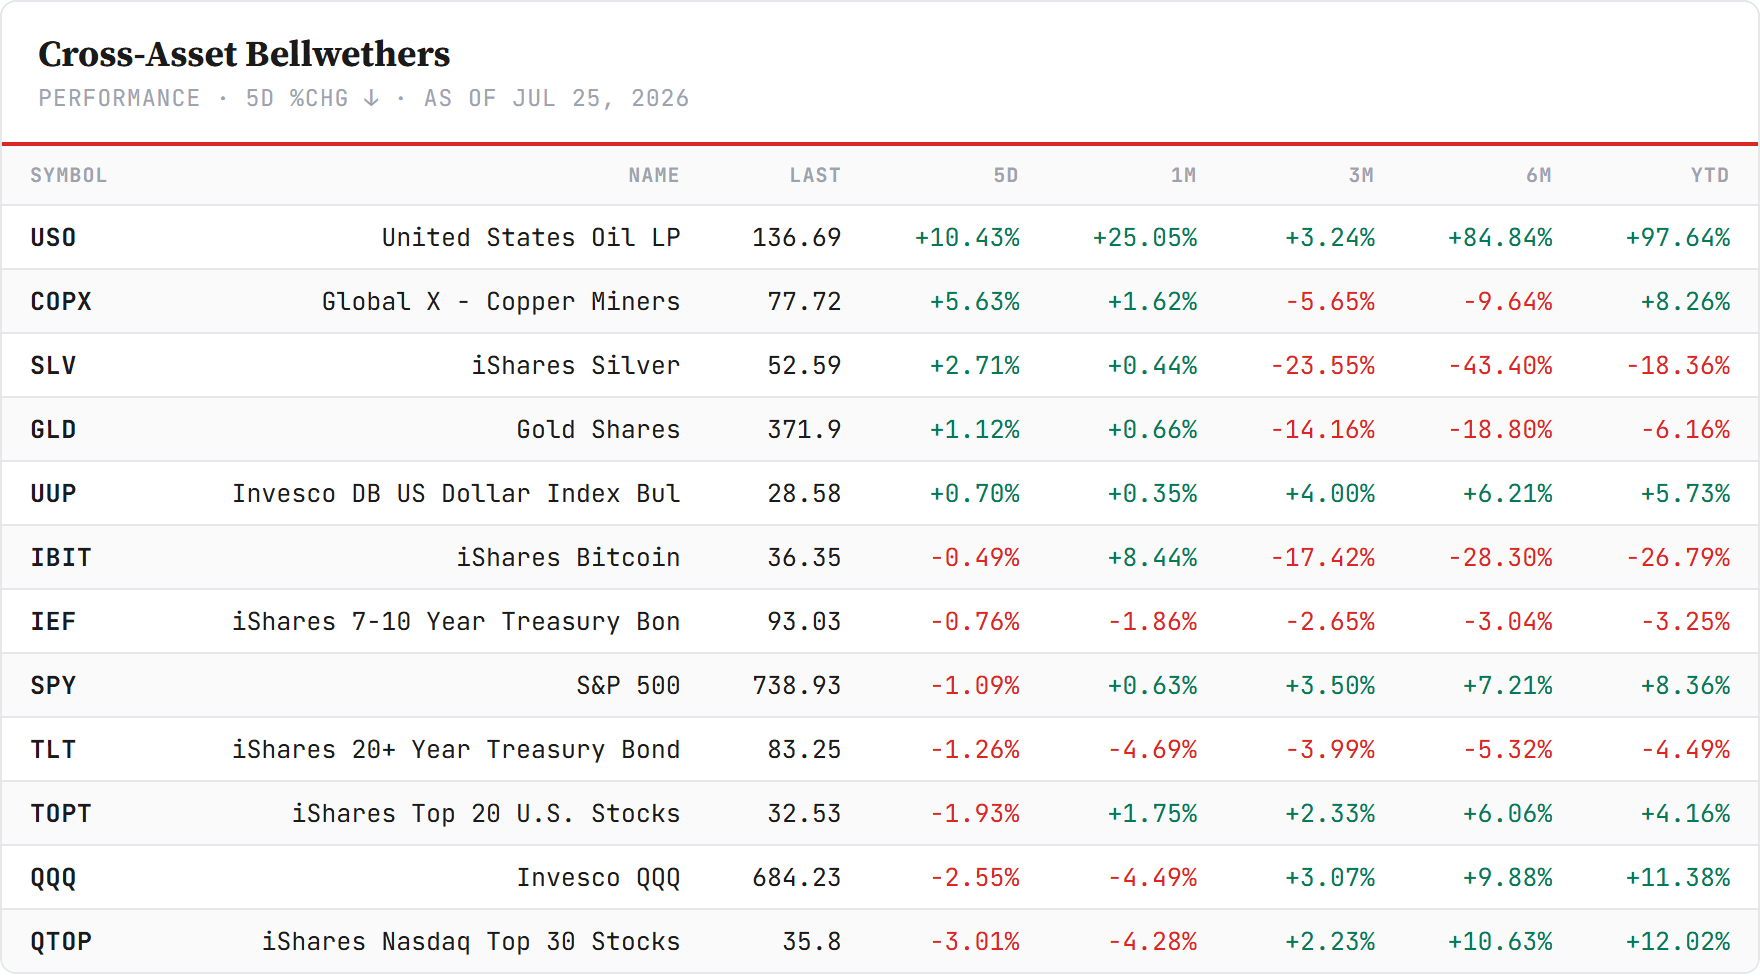
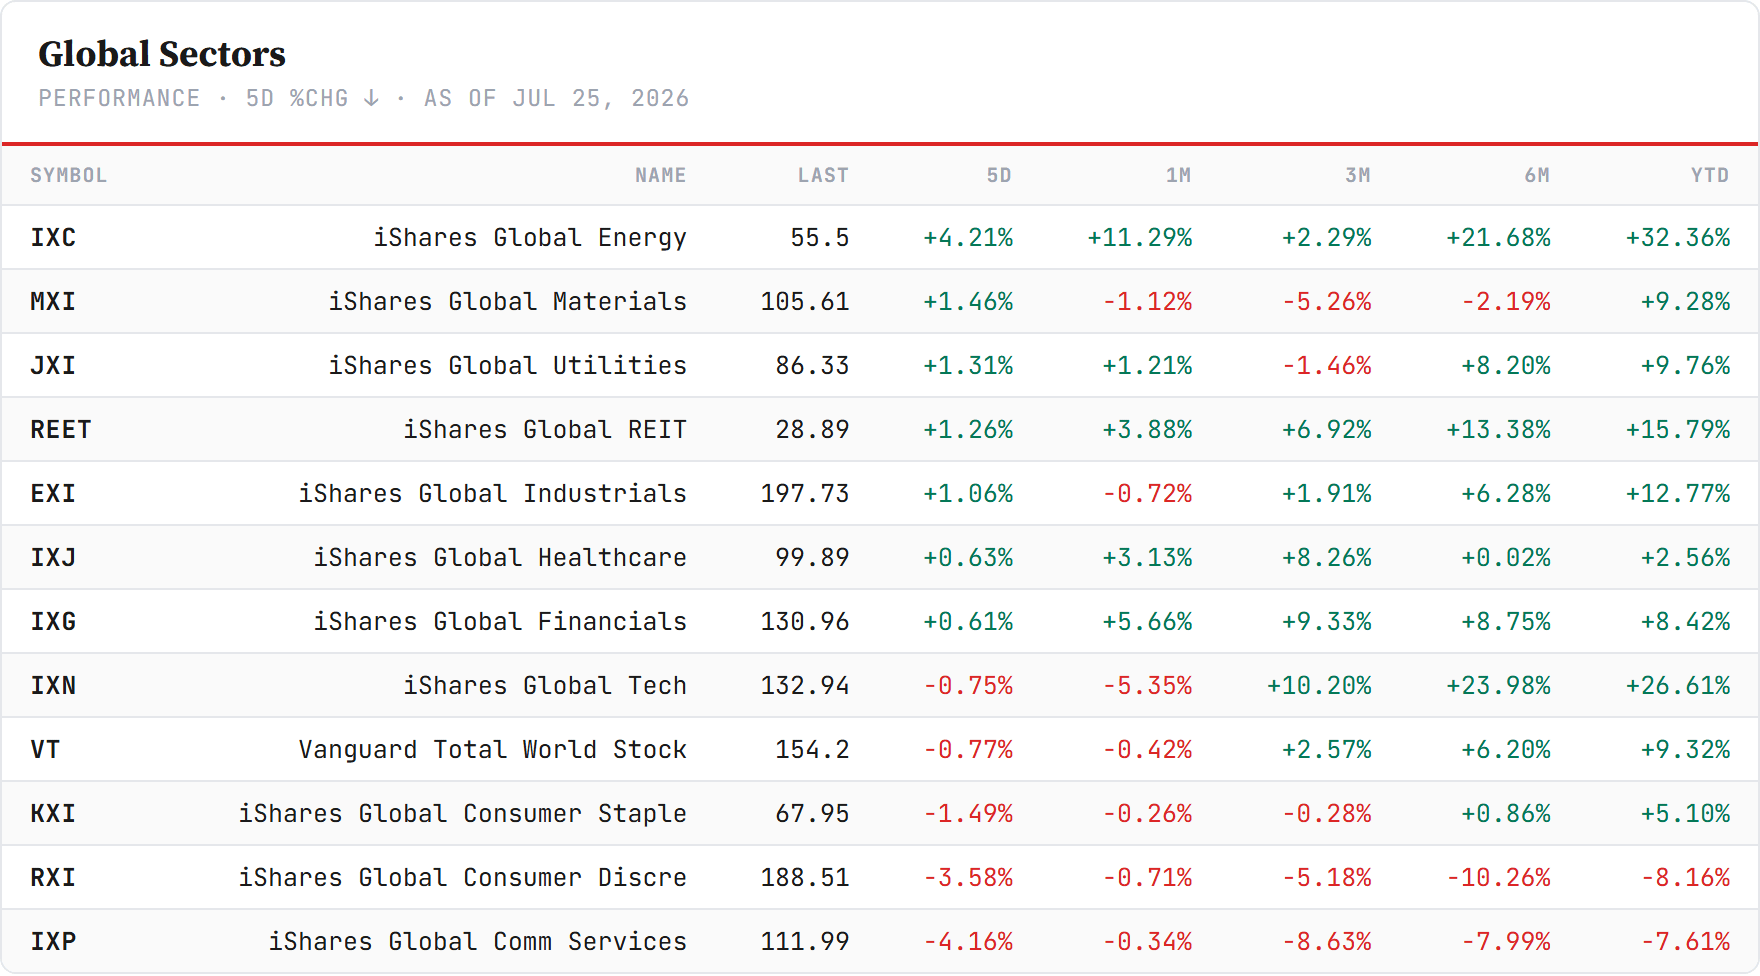
The global sectors. Energy led for the third consecutive week (IXC +4.2%, now +32% YTD) — the oil chart is no longer a footnote to this board, it is the board’s organizing fact. Behind it, the same defensive-and-real shelf as last week: materials +1.5%, utilities +1.3%, REITs +1.3%, industrials +1.1%, healthcare and financials modestly green.
The bottom is new, though: not tech, but communication services (−4.2%) and consumer discretionary (−3.6%) — the sectors where Alphabet’s post-print drift and Tesla’s unrescued miss live. Global tech itself closed only −0.8%, a number that hides everything: inside it, semiconductors were cracked on Friday, software gave back an early-week rally, and the orchestration layer had its best day of the season. The aggregate is calm; the interior is violent.
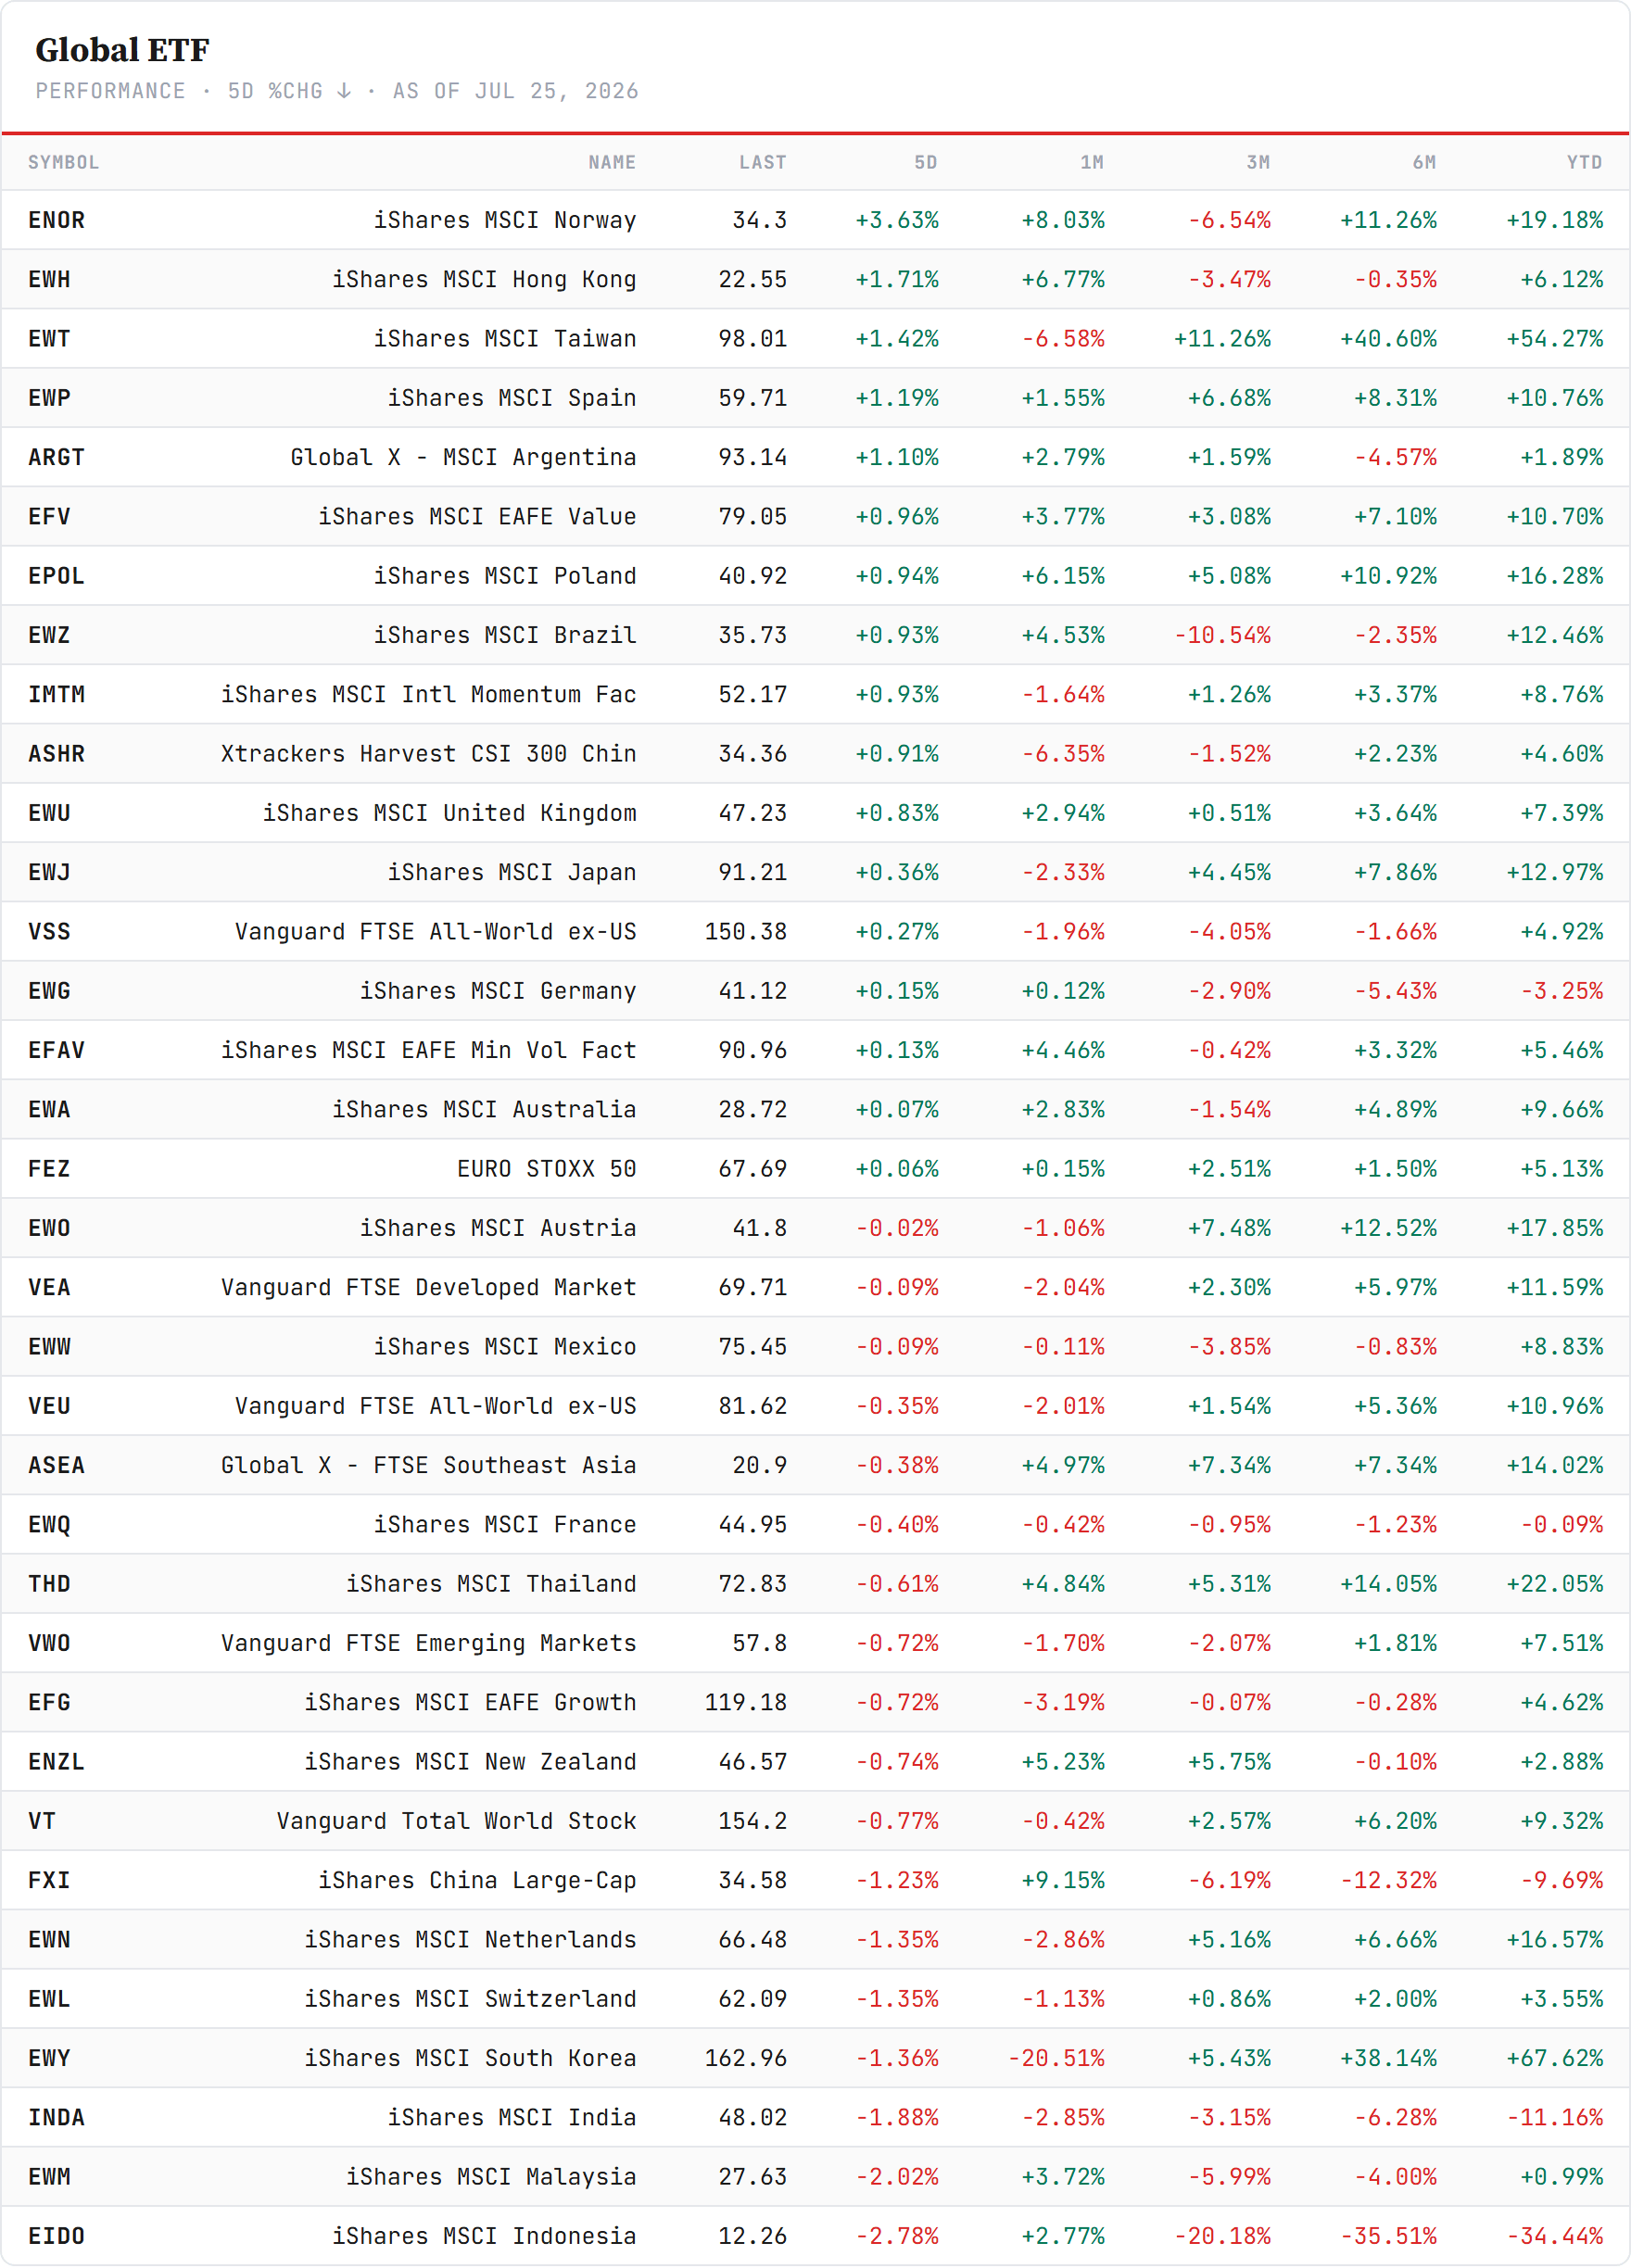
The regions. No washout, no single story — which is itself the story after two weeks of forced selling. Norway led on the oil bid (+3.6%), Hong Kong +1.7%, Taiwan +1.4% — its first green week in three — Spain +1.2%, Argentina +1.1%.
The red column is shallow: Indonesia −2.8%, Malaysia −2.0%, India −1.9%, Korea −1.4% — and Korea’s number deserves a second look, because it was flat through Thursday and took nearly all of its decline in Friday’s US-driven session. The one to frame: VEU closed the week at −0.35%, against −1.1% for the S&P and −2.6% for the Nasdaq. In a stress week manufactured in the US, the ex-US book outperformed the US core across the board.
The Global Compass
New this week, and recurring from here: the Compass — the same four relative-strength questions, answered the same way, every Saturday.
Who leads and lags, at two horizons; and the ratios that decide the biggest allocation questions in this letter: stay home or go global, stay tech or go broad. The Asia-based home-vs-global view — the most heterogeneous one — joins next week.
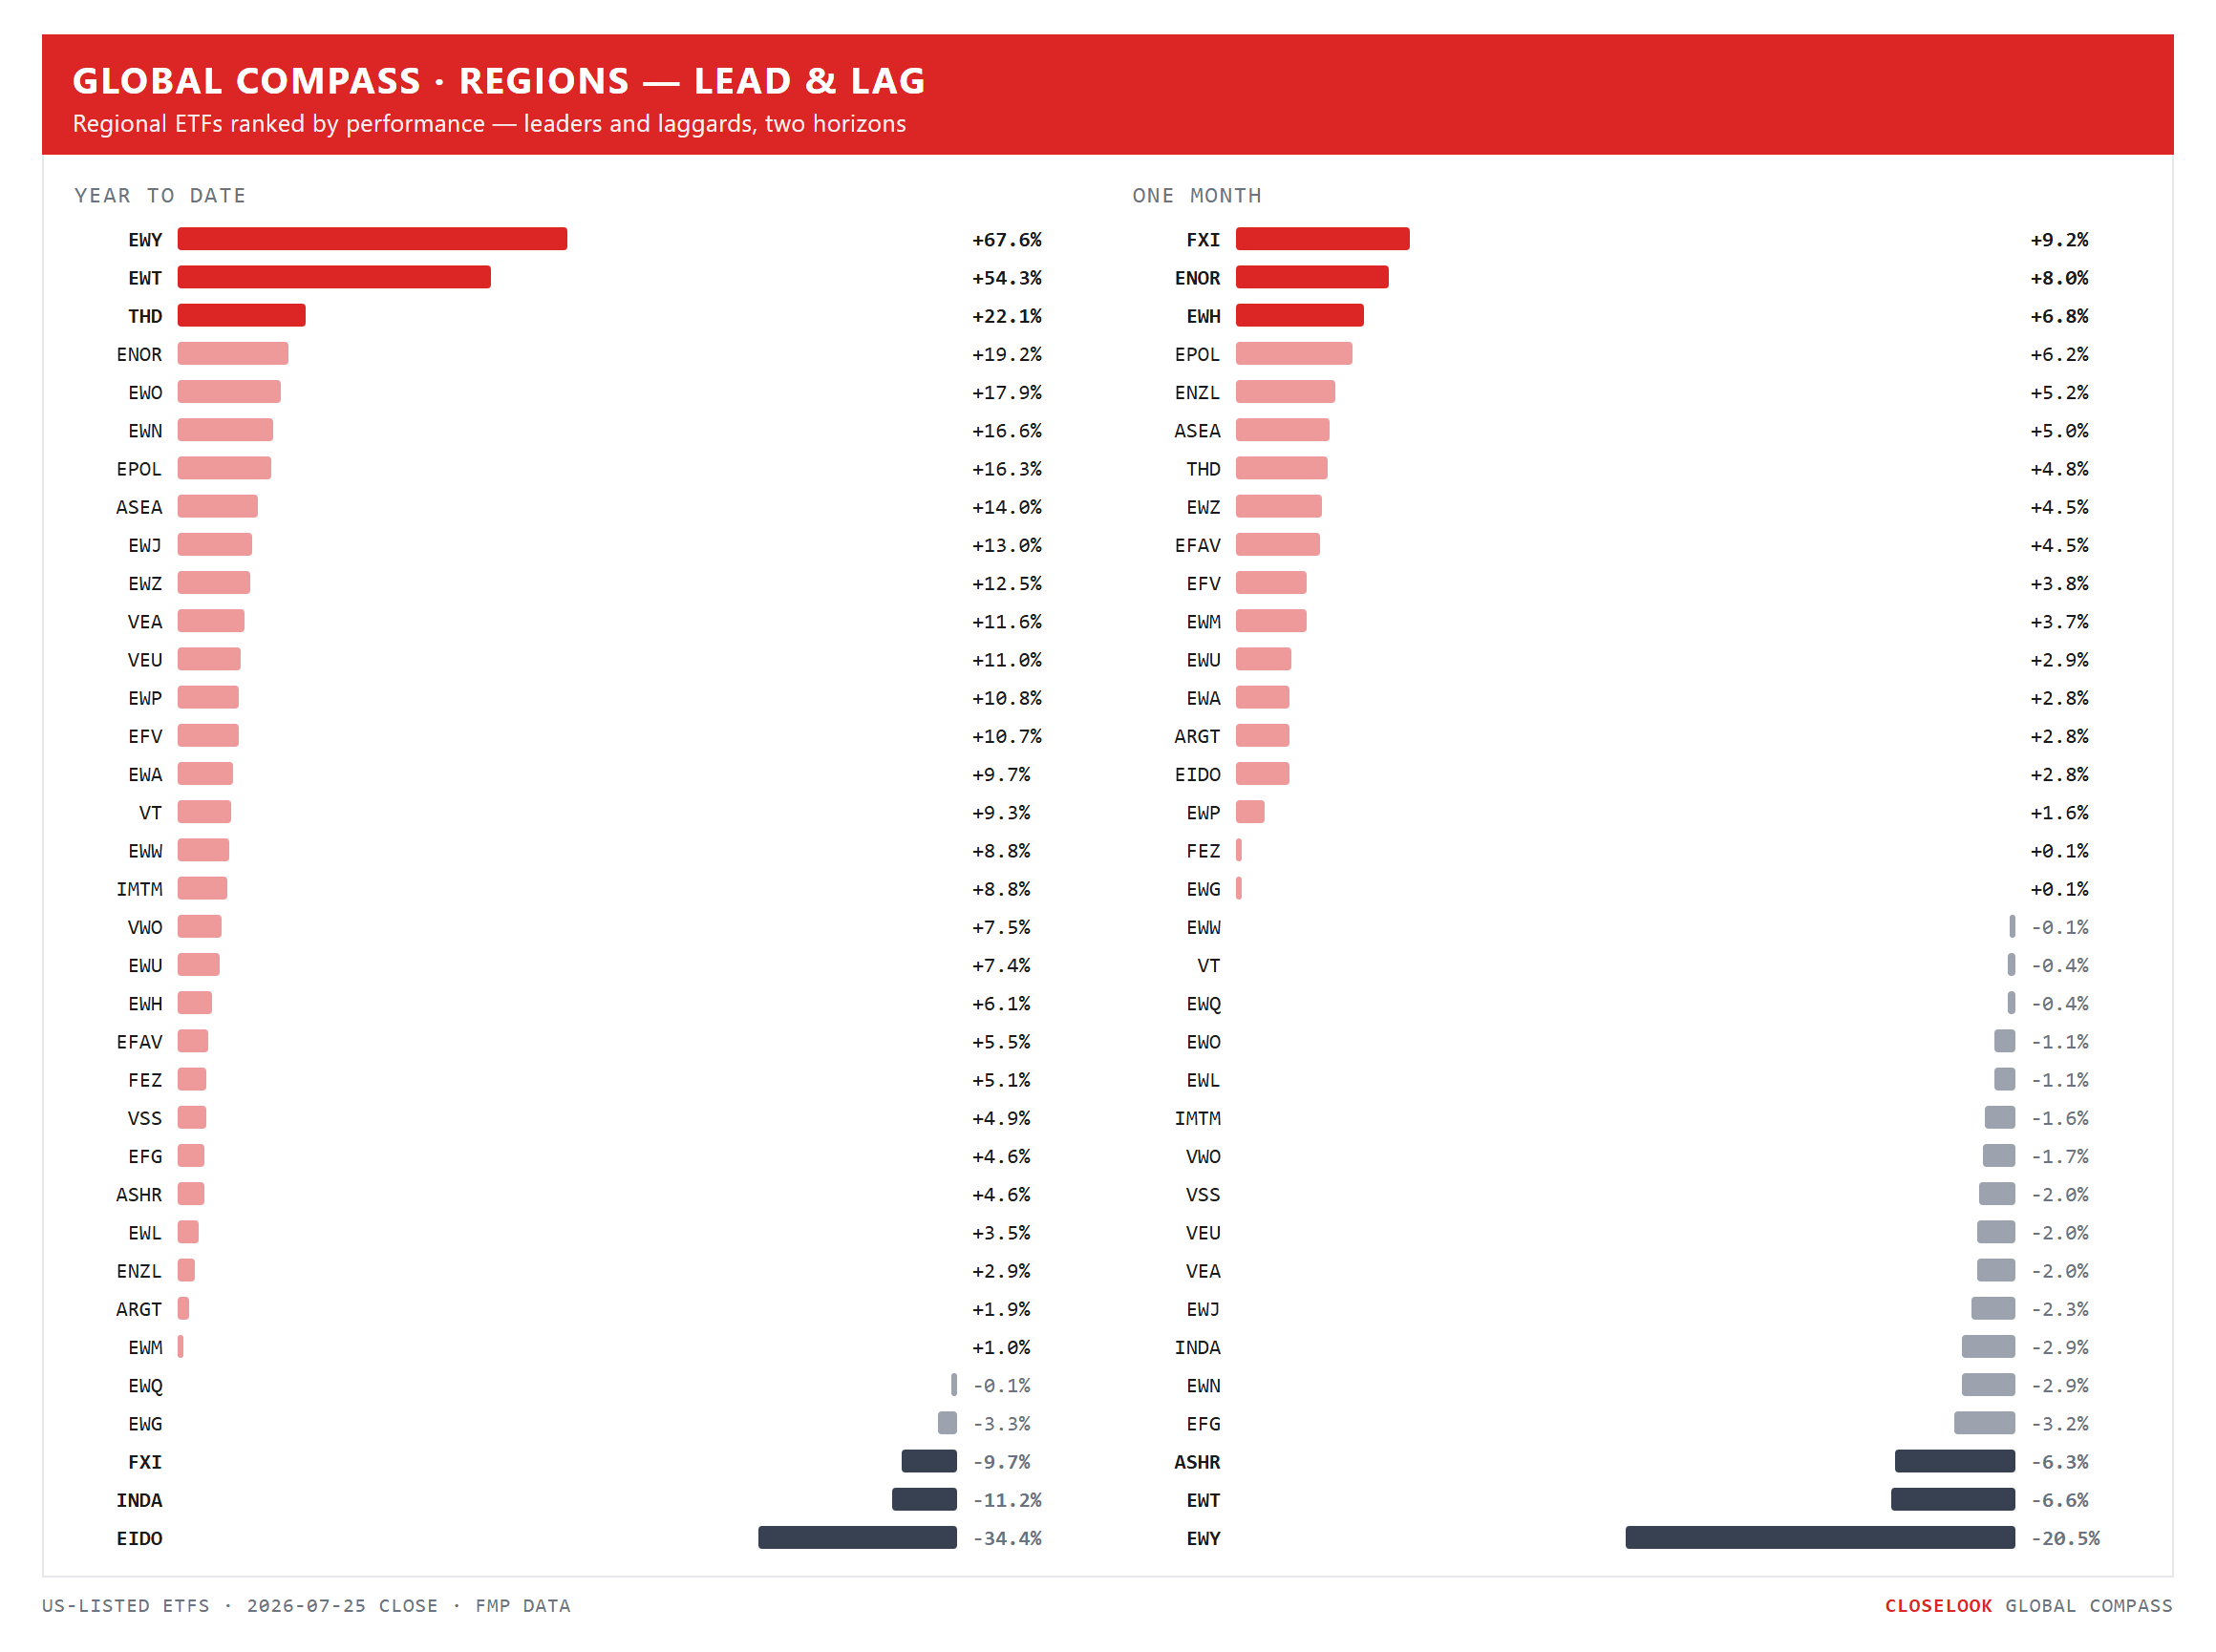
Regions: the year’s leaders are the month’s laggards. The YTD column still belongs to the AI supply chain — Korea +68%, Taiwan +54% — with Thailand, Norway and Austria behind.
Flip to the one-month column and the same two names sit at the bottom (Korea −21%, Taiwan −7%) while the month’s leaders are the year’s forgotten: China’s large-caps +9%, Norway +8%, Hong Kong +7%, Poland +6%. That inversion is the July story in one picture: the crowded winners digesting, the money staying in the region but rotating down the leaderboard.
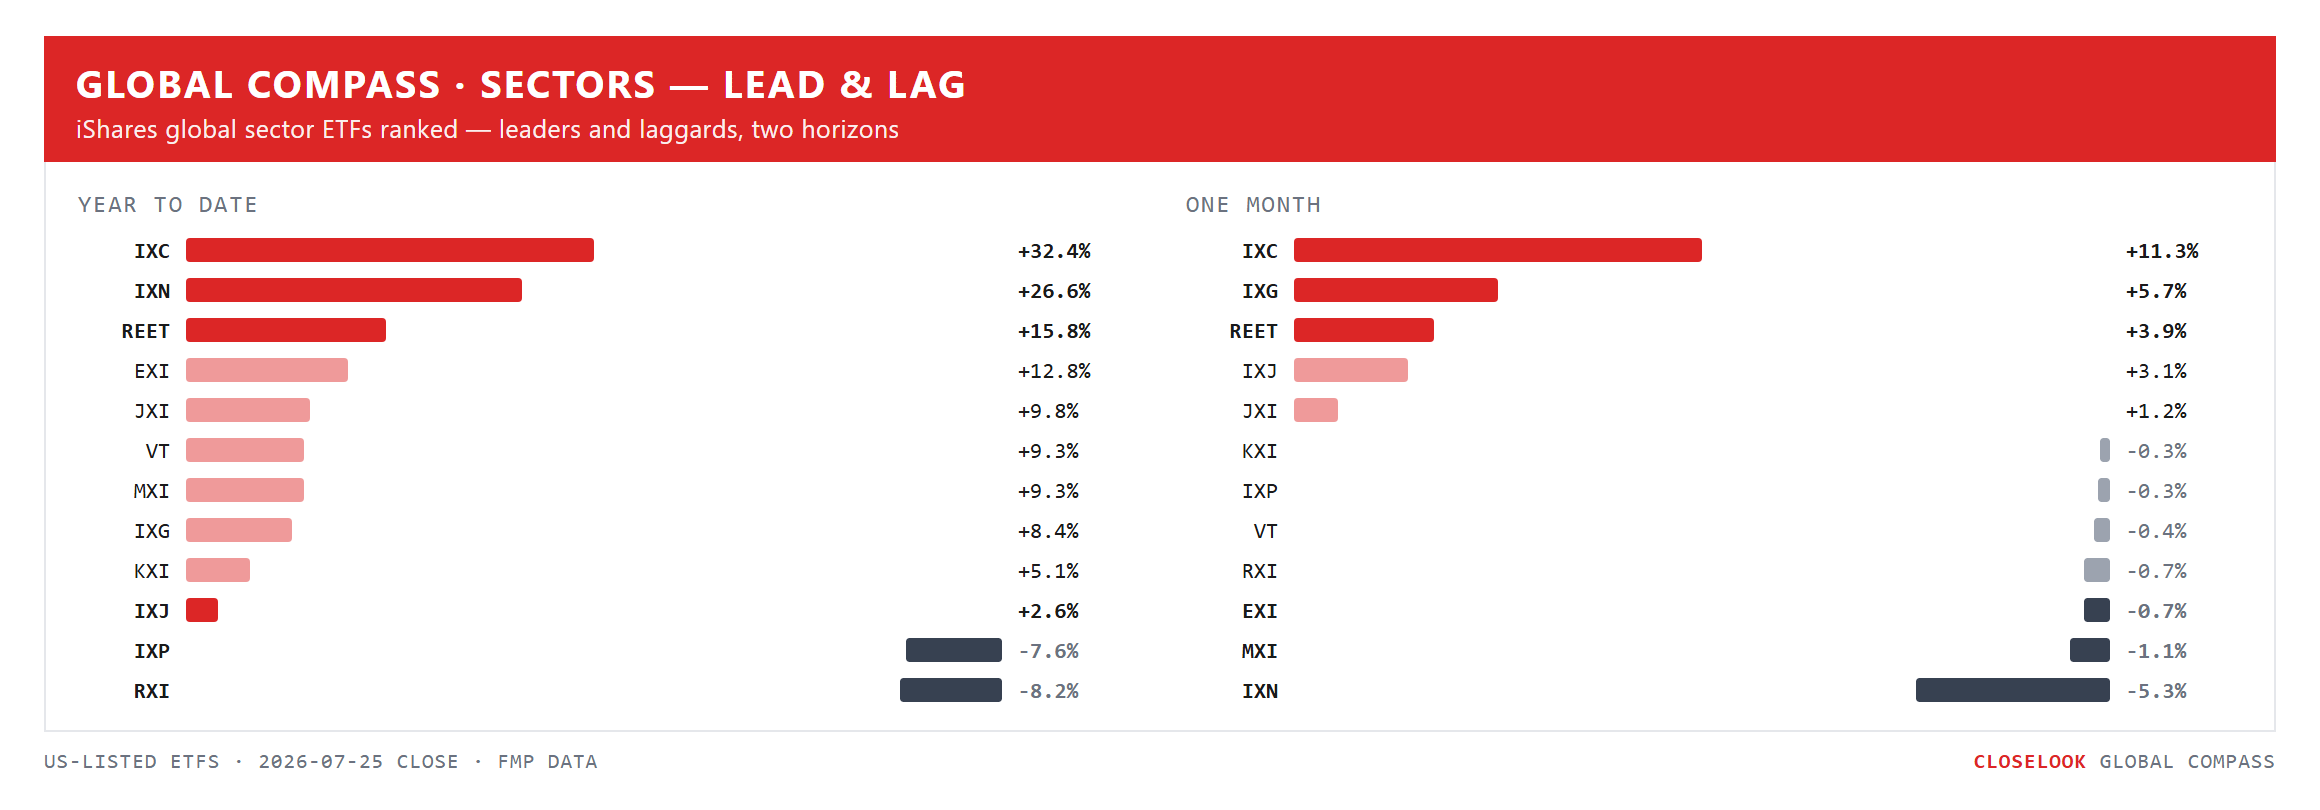
Sectors: one sector leads both clocks. Energy is the only sector on the board leading the year (+32%) and the month (+11%) — the oil chart translated into equity leadership. Tech is the mirror: first on the year (+27%), last on the month (−5%).
The month’s quiet strength — financials +6%, REITs +4%, healthcare +3% — is the defensive-and-yield shelf this letter has flagged for three weeks, now visible at the horizon where trends get set.
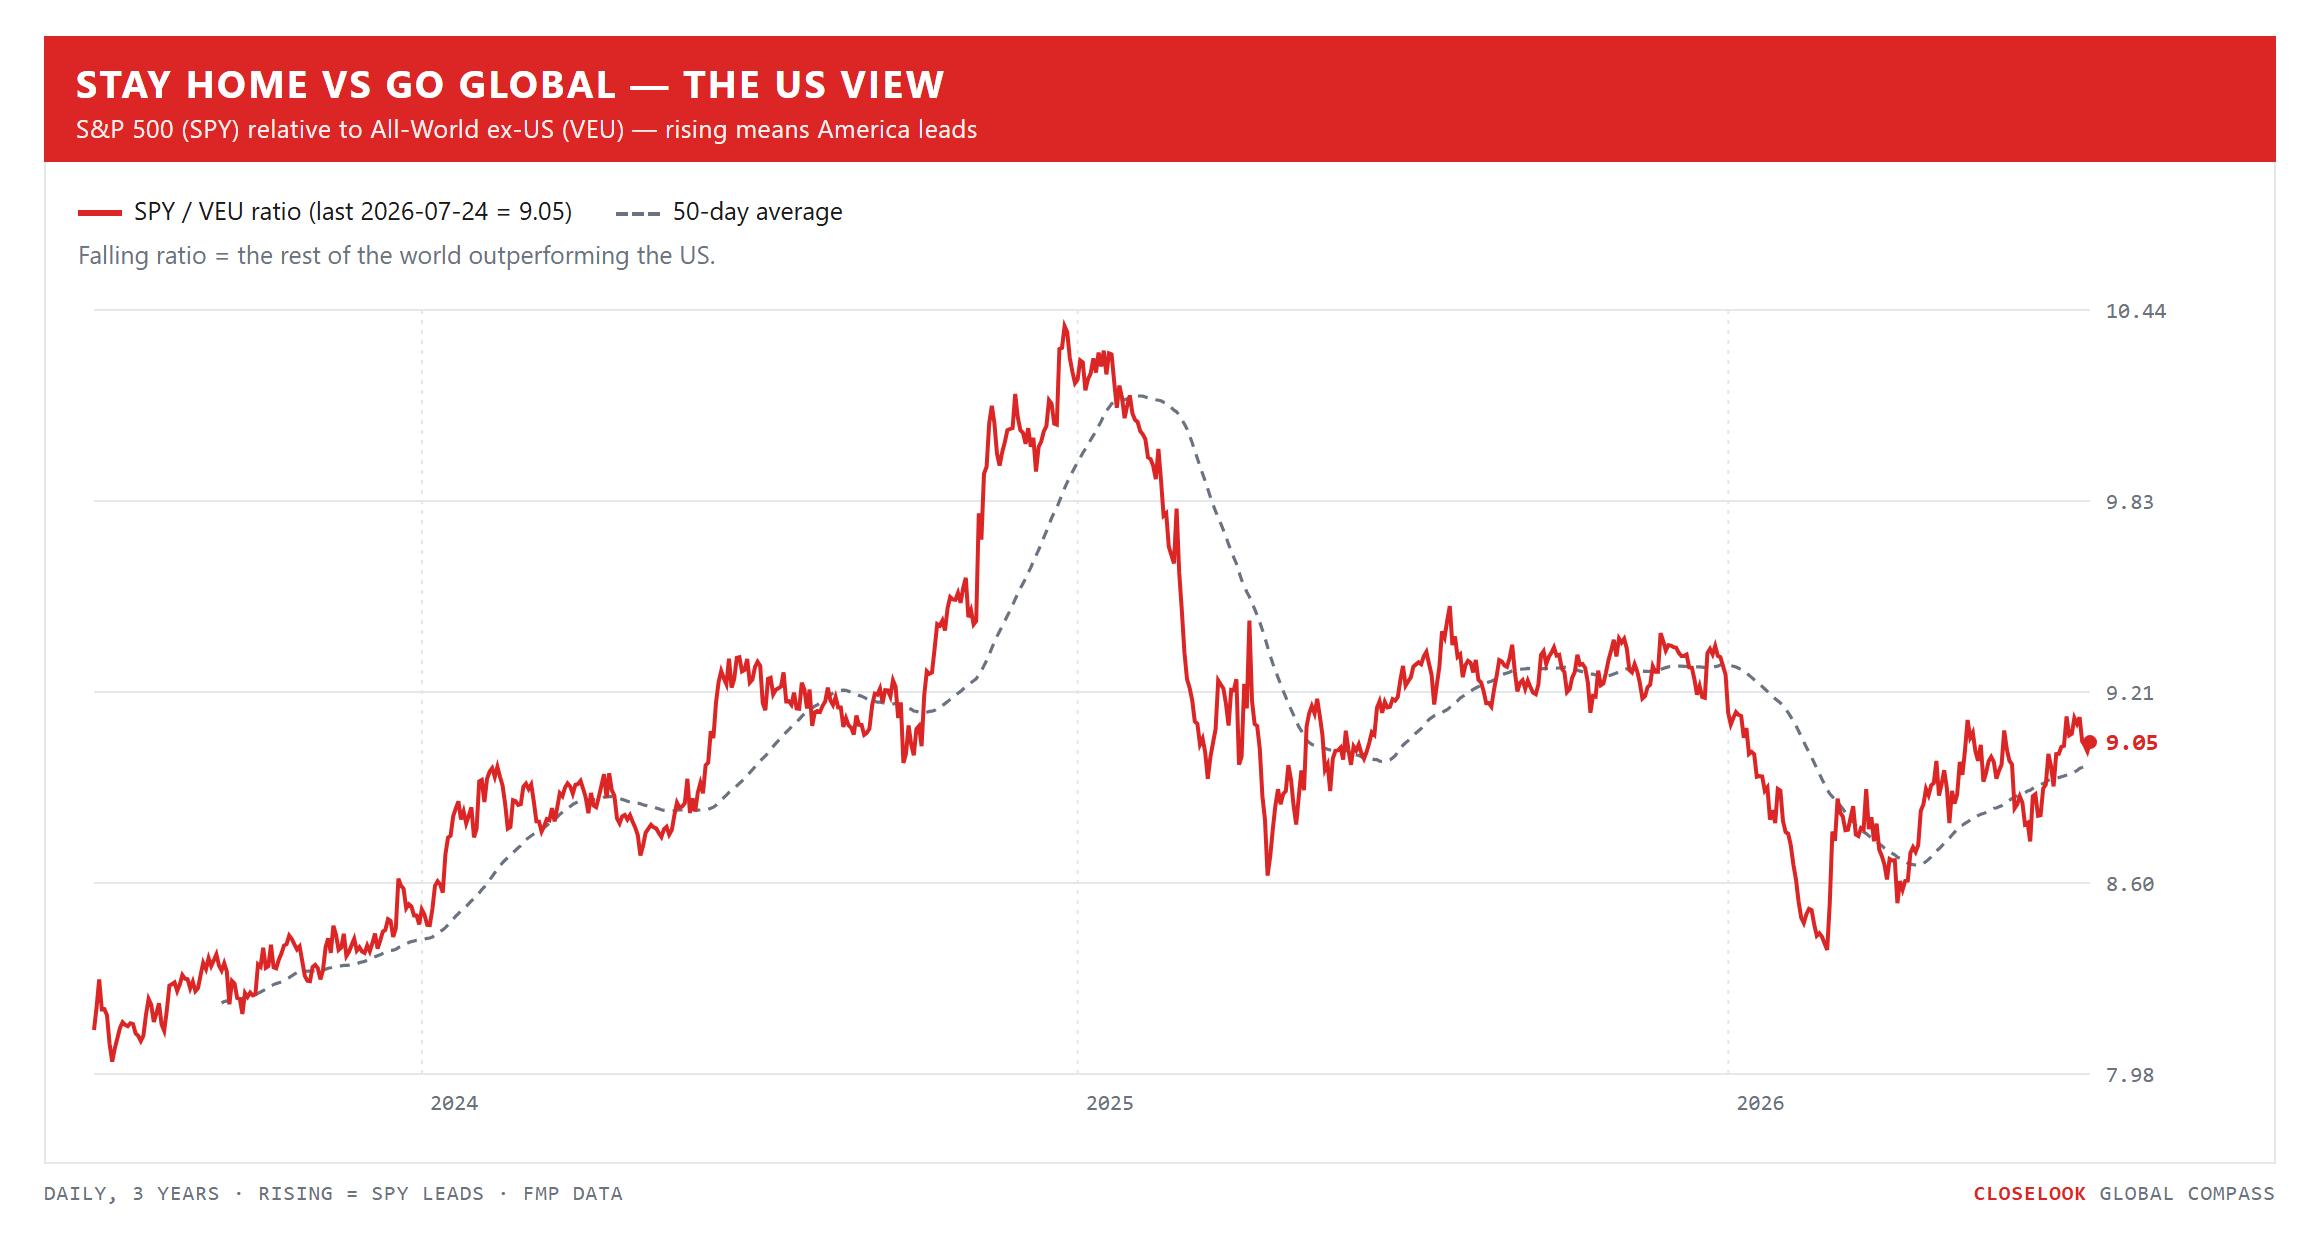
Stay home vs go global — the US view. The ratio tells a story the S&P’s own chart hides: US leadership over the world peaked in early 2025 and has printed lower highs since. The spring-2026 recovery leg stalled this month below the old shelf, and this week the ratio ticked down again — the rest of the world outperformed America in a stress week America itself produced. One line, one question, updated weekly: is the decade-long stay-home trade resuming, or was the spring bounce the counter-trend?
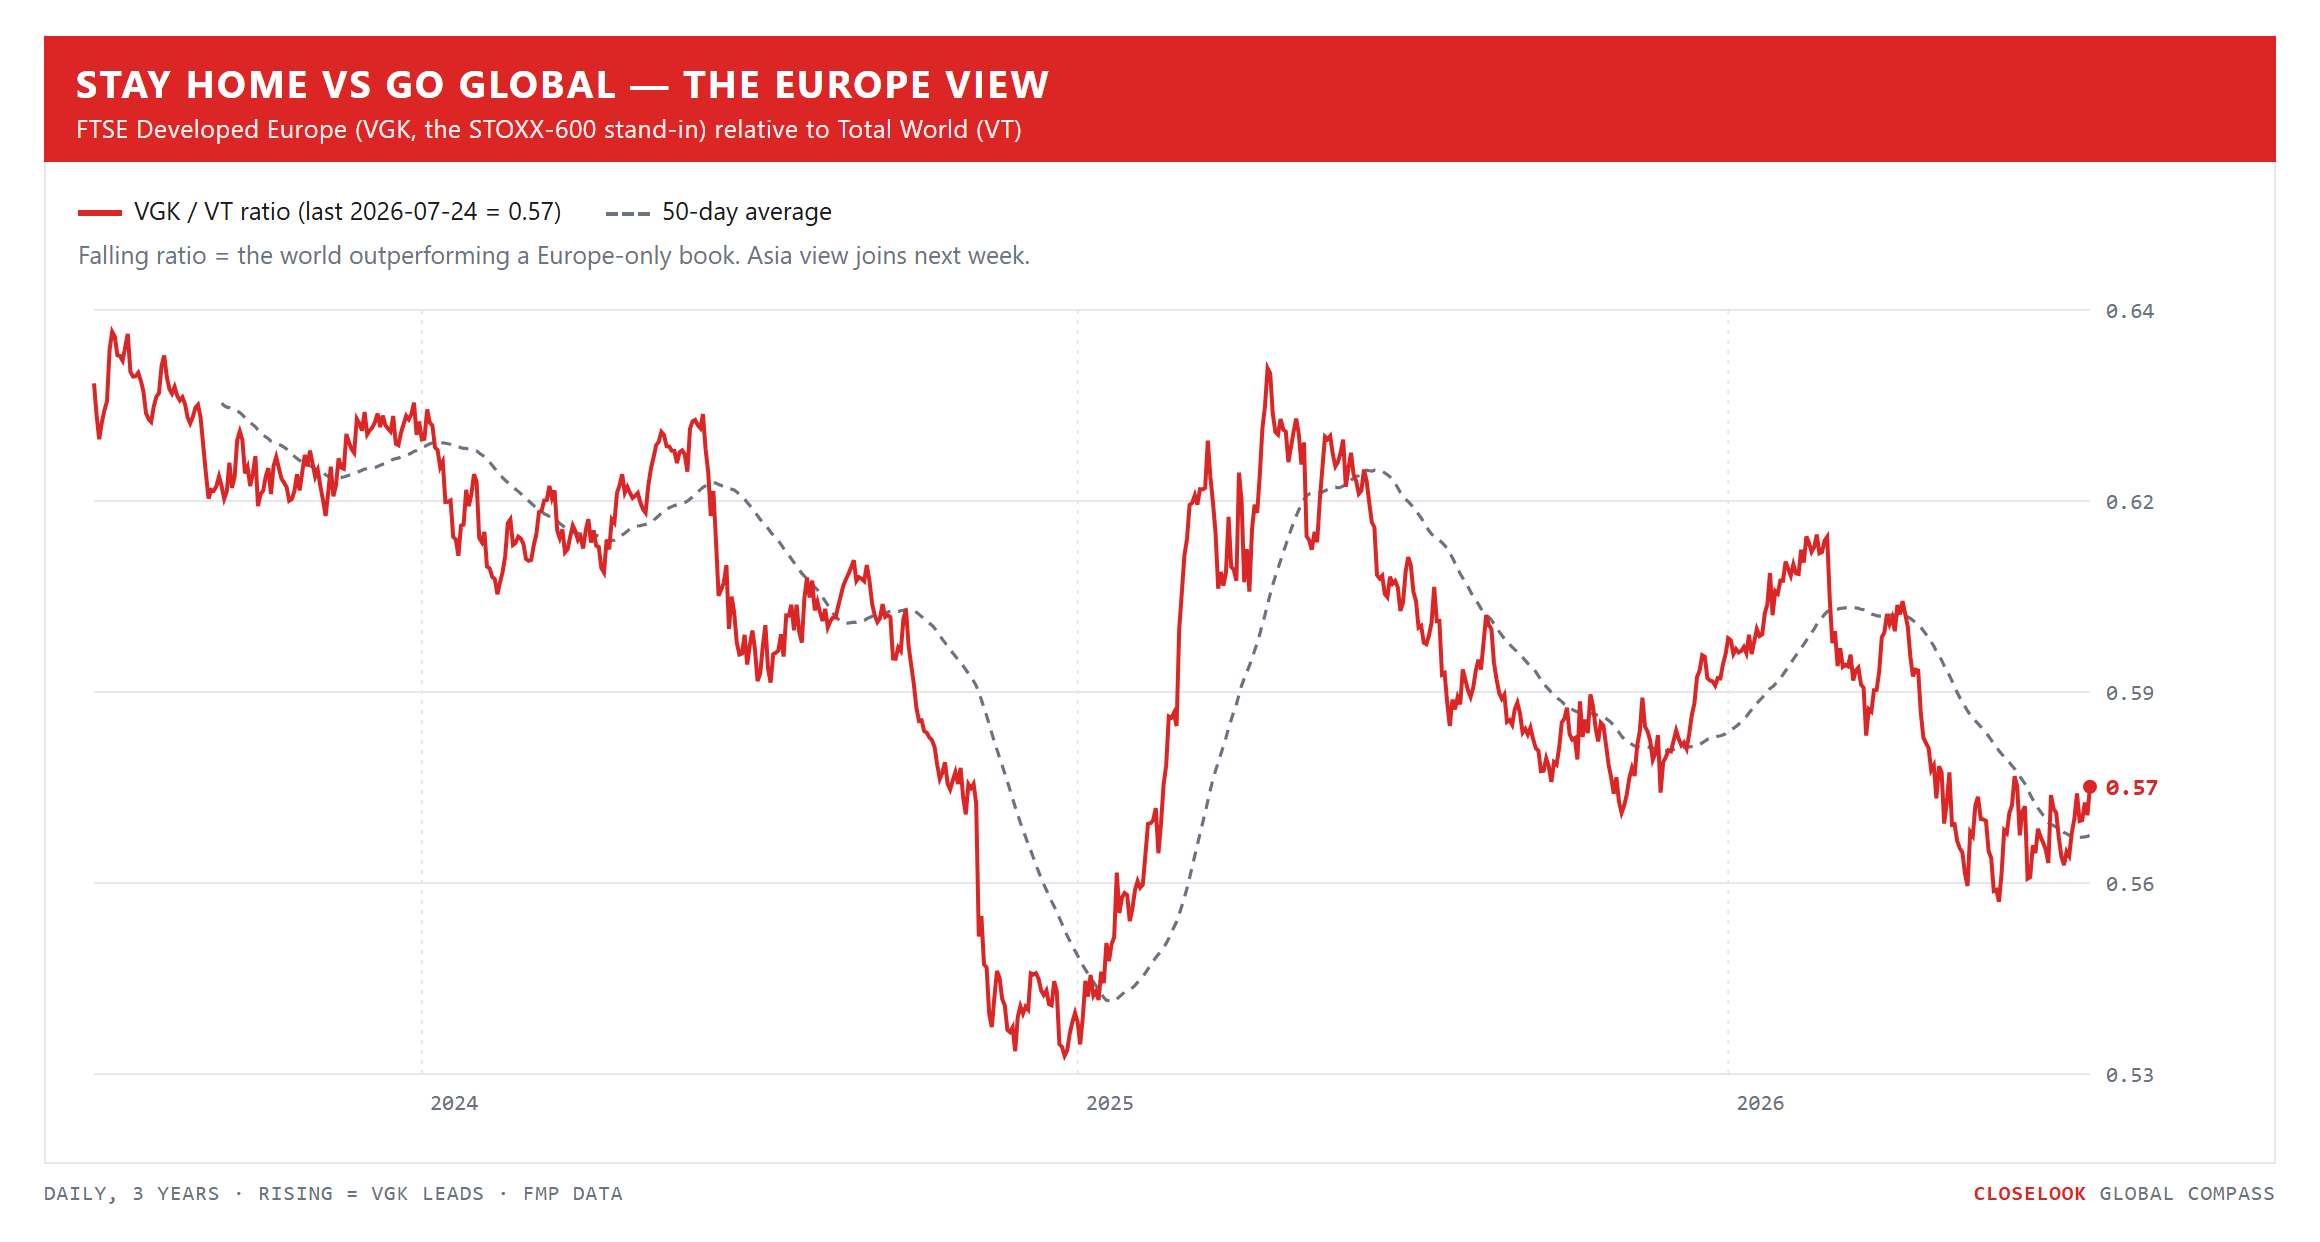
Stay home vs go global — the Europe view. For a Europe-based reader the same question has a harsher answer: the home-vs-world ratio has been in a downtrend for the full three years of the chart, and every counter-rally — including this spring’s — has been sold. A Europe-only book has structurally lost to a global one, SAP’s week notwithstanding. That is precisely why this letter’s map is built on where the flows land, not where the reader lives.
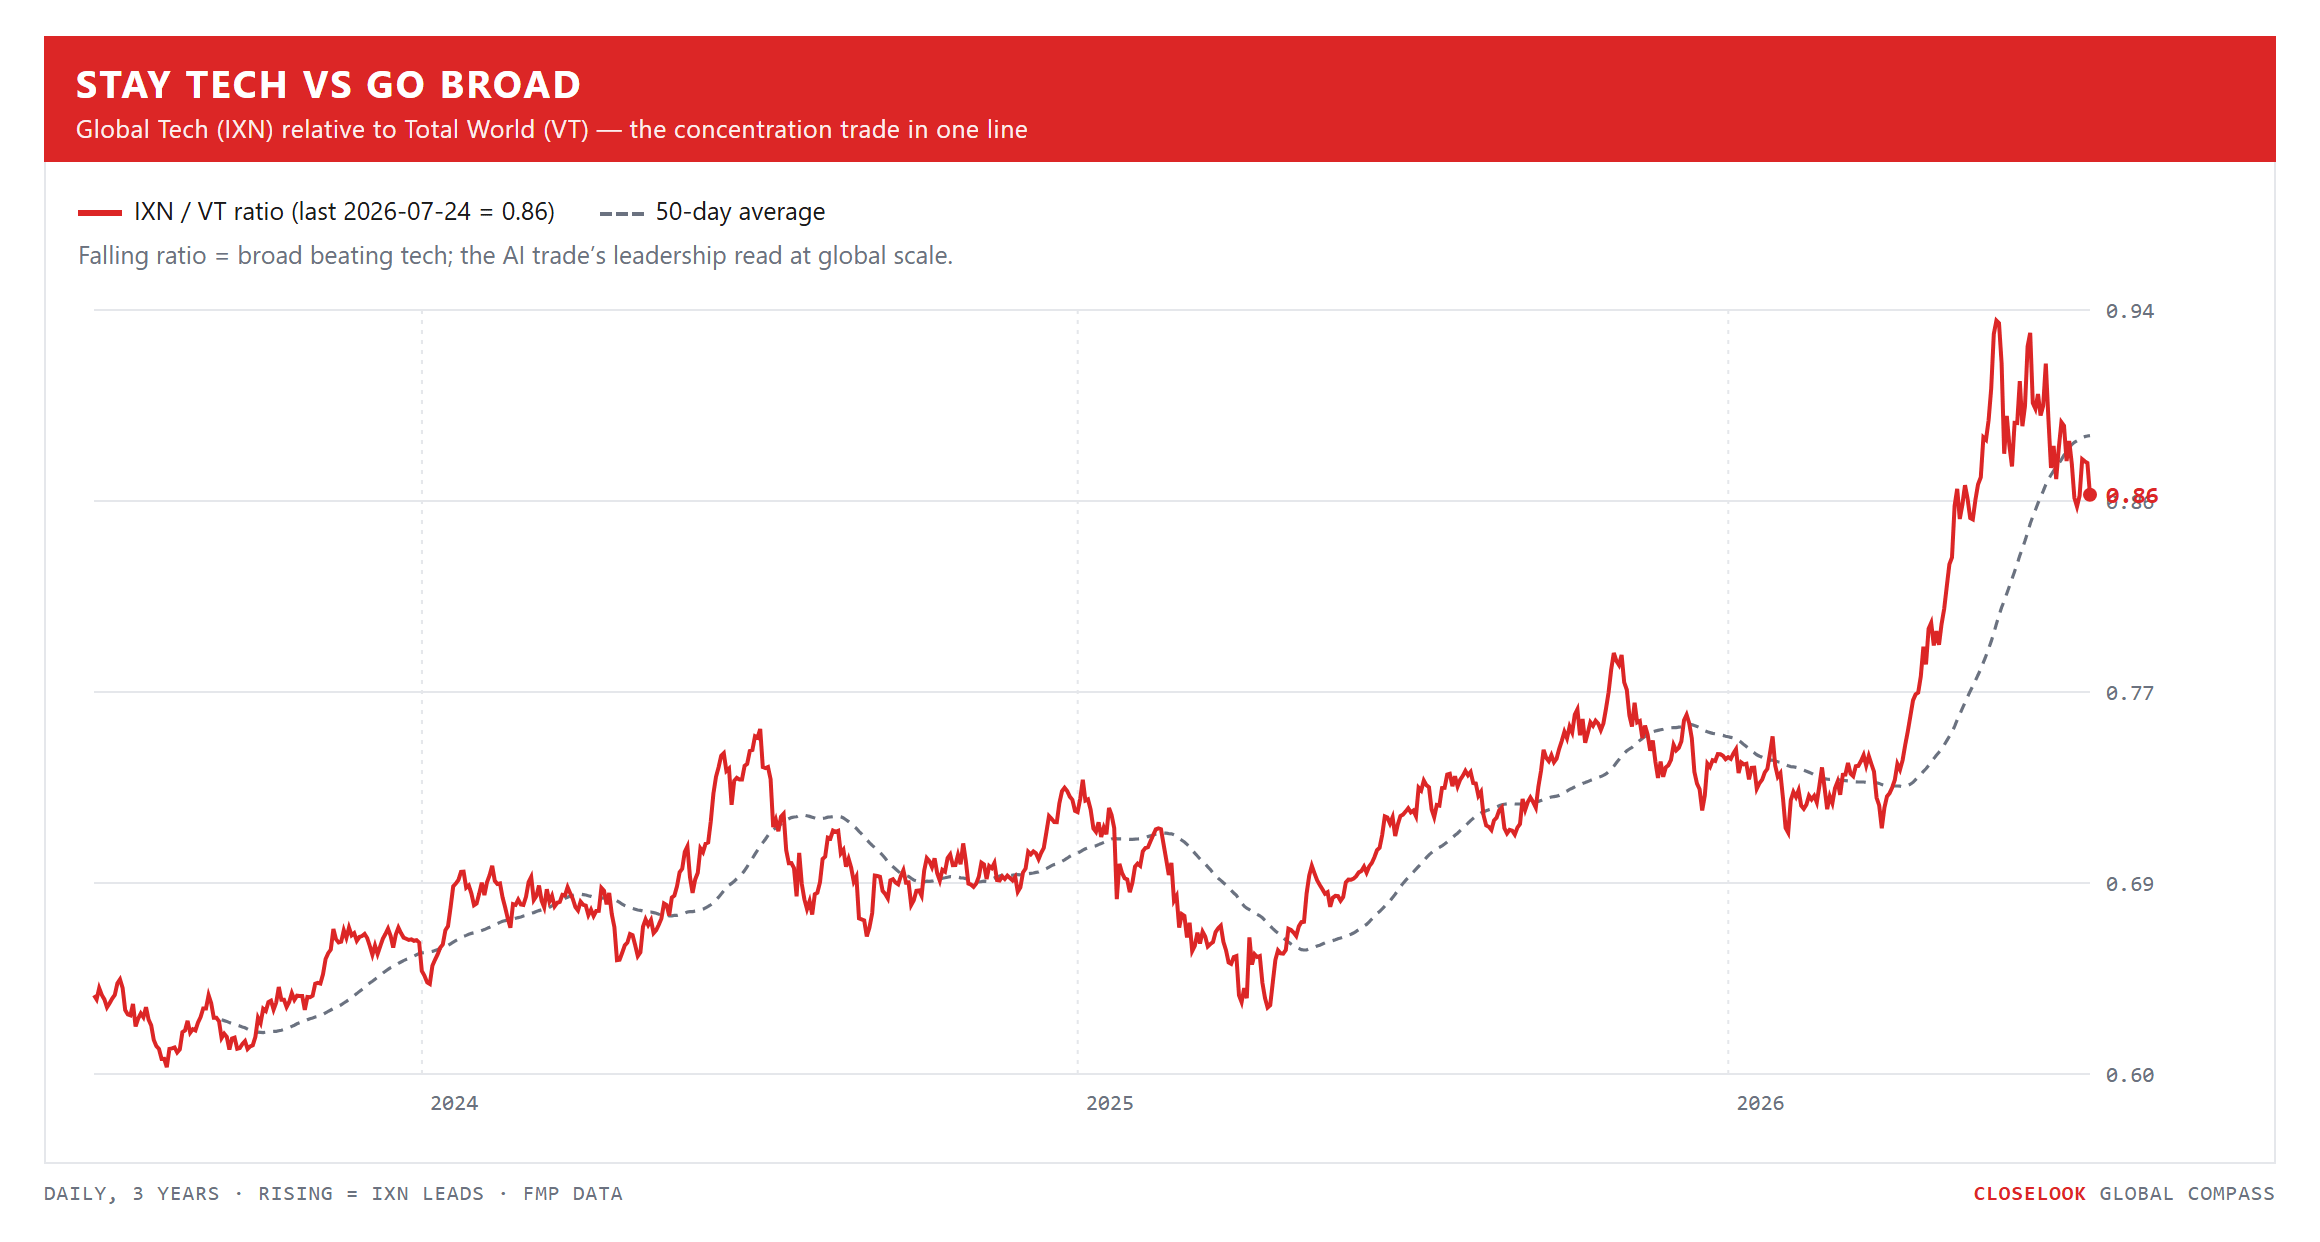
Stay tech vs go broad. The concentration trade in one line: a three-year structural uptrend that went vertical in May–June — the AI re-rating at global scale — peaked in late June, and has been rolling over since, now back at its 50-day average. Not broken, but no longer leading: the month in which SMH lost 12% while the world index barely moved is exactly this rollover, seen from above. A decisive break of the average would be the broadening signal the equal-weight bulls have waited two years for; a bounce from it would say the concentration regime survived another test.
2 · The State
The engine: a rate repricing, not a growth scare. The week’s driver was Thursday’s flush — tariff-driven inflation prints and Fed commentary pushed the market-implied odds of a September hike from roughly 20% to above 80%, real yields pressed toward 3%, and the Mag7 complex took broad losses.
This is a different animal from the two previous corrections in this letter. Tokyo was positioning; K3 was narrative; this is the discount rate — the one variable that touches every asset on every board above at the same time. Hence bonds red, gold up, dollar up, defensives green: the classic fingerprint.
The print week, read from the flow map. The season’s first full week gets its print-by-print scoring in Sunday’s US letter; what belongs here is the geography of it. The American tape sold its own silicon champions on good news — Intel’s strongest revenue growth since 2011 was met with an 8% decline — while the week’s single best print-reaction on the entire developed-market tape belonged to a European name: SAP, up 9.3% on Friday alone, off a 52-week low, on its claim to the orchestration layer of the agentic enterprise (the full thesis: The Agent Is Not the Product. The Orchestrator Is.). For a letter about where value in the AI economy accrues geographically, that pairing matters: the market spent the week repricing which layer of the stack earns the profit pool — and the layers are not all American, and not all in the index everyone watches.
The silicon crack — located, not mapped. The US semiconductor complex closed the week below the support band it had defended since spring — the first structural crack there since this book’s full add; the level-by-level map and what our book’s contract says about it are the US letter’s territory. What this letter takes from it is the location: the crack happened in the buying market, not the producing one. Taiwan and Korea’s ETFs — the supply chain itself — finished green and nearly flat respectively while the US complex broke. And note what the crack is not: it is not the K3 design-shock scenario — the EDA names were quiet. This was a discount-rate shock finding the most extended complex on the most rate-sensitive tape.
The Asian legs held — scored honestly. Last week’s letter ended with one test: Seoul’s Monday reopen, with the US market front-running a gap-up. The gap-up printed — Korea recovered through midweek, and the SK Hynix ADR rallied from its tested $149 line back toward $170 before Friday’s US flush took it down 8.8% to close at $154.57 — almost exactly flat on the week ($154.03 last Friday). A debut that absorbs a Kioxia collapse one week and a US rate shock the next, and holds its offer line on every close, is building a record. Taiwan’s green week and TSMC’s steadiness (below its 50-day, well above its July low) complete the picture: this week’s stress did not come from the supply chain — it came from the customer’s cost of capital. The two-country thesis was a bystander, not a casualty.
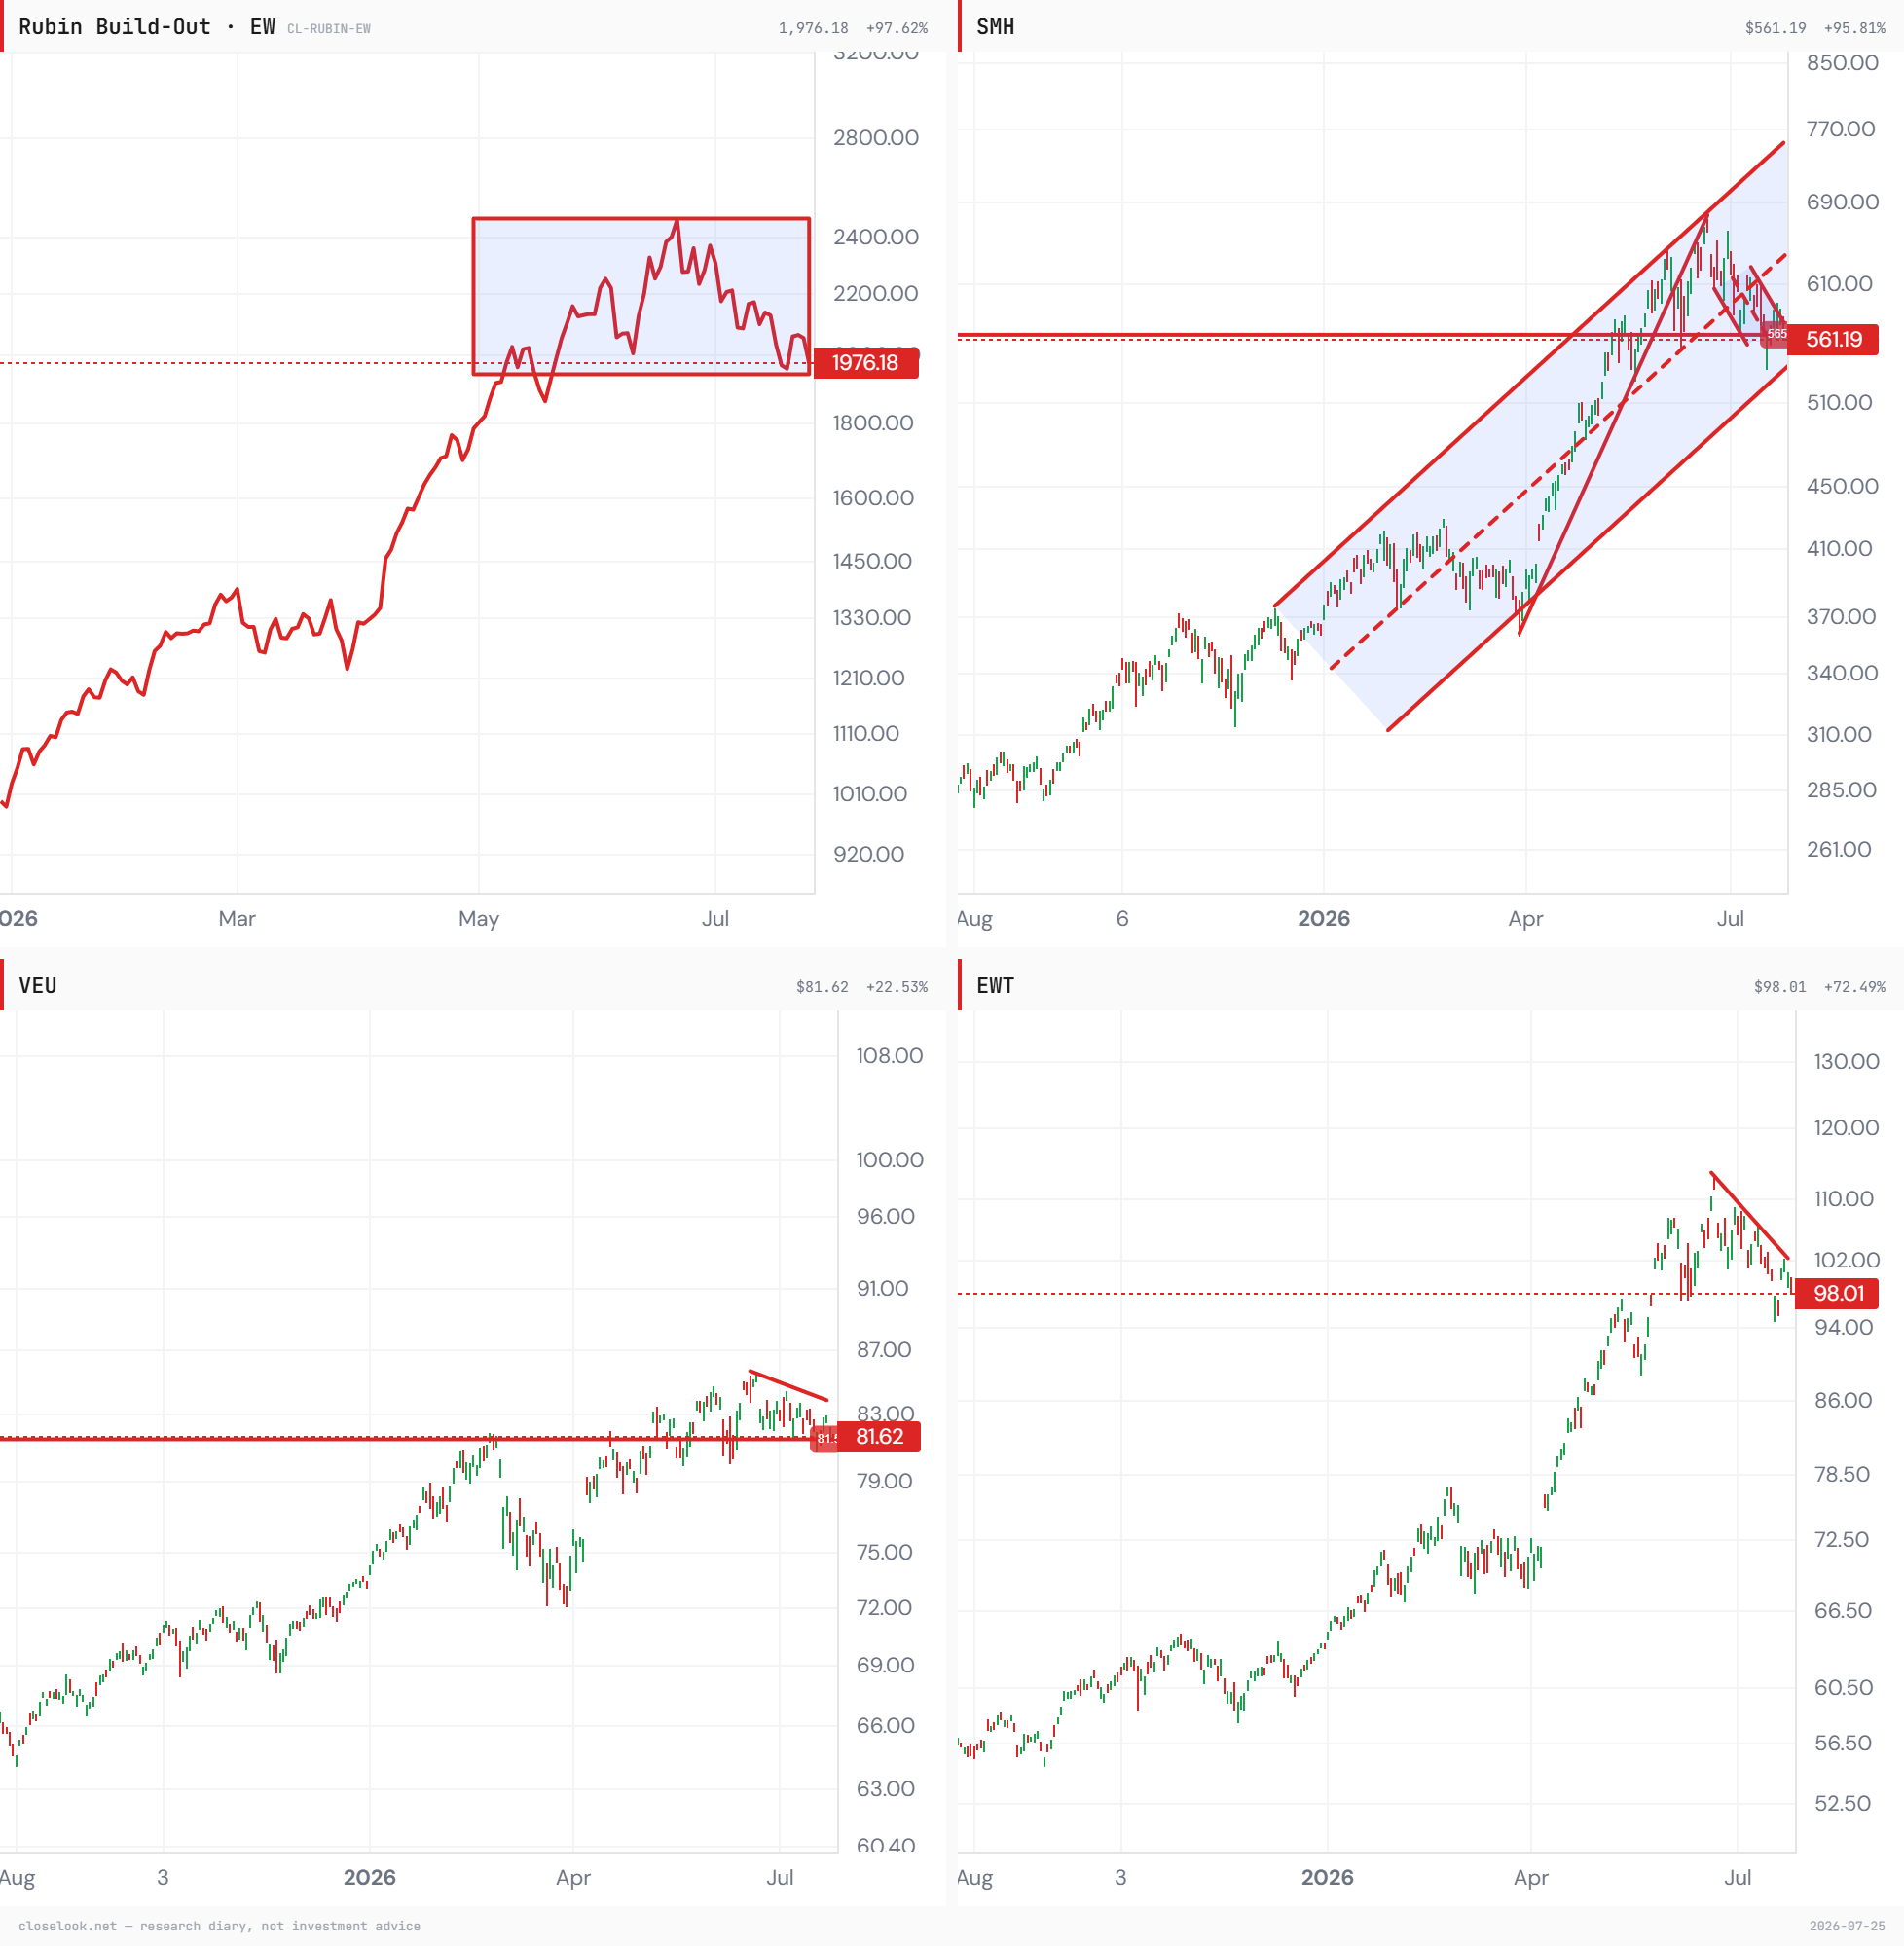
Four structures, one grid. Before the count, the states — because they differ, and the difference is the point. The build-out index is ranging: two months inside a well-defined box, currently at the box floor. The US semiconductor complex is testing: still inside its rising channel from the autumn, but in the channel’s lower half after losing the midline. VEU is resting: flat on its horizontal shelf, capped by nothing more serious than a three-week trendline. Taiwan is correcting: under its June down-line, above its breakout. None of the four is broken; all four are asking their own question. That is a rotation’s chart-book, not a top’s.
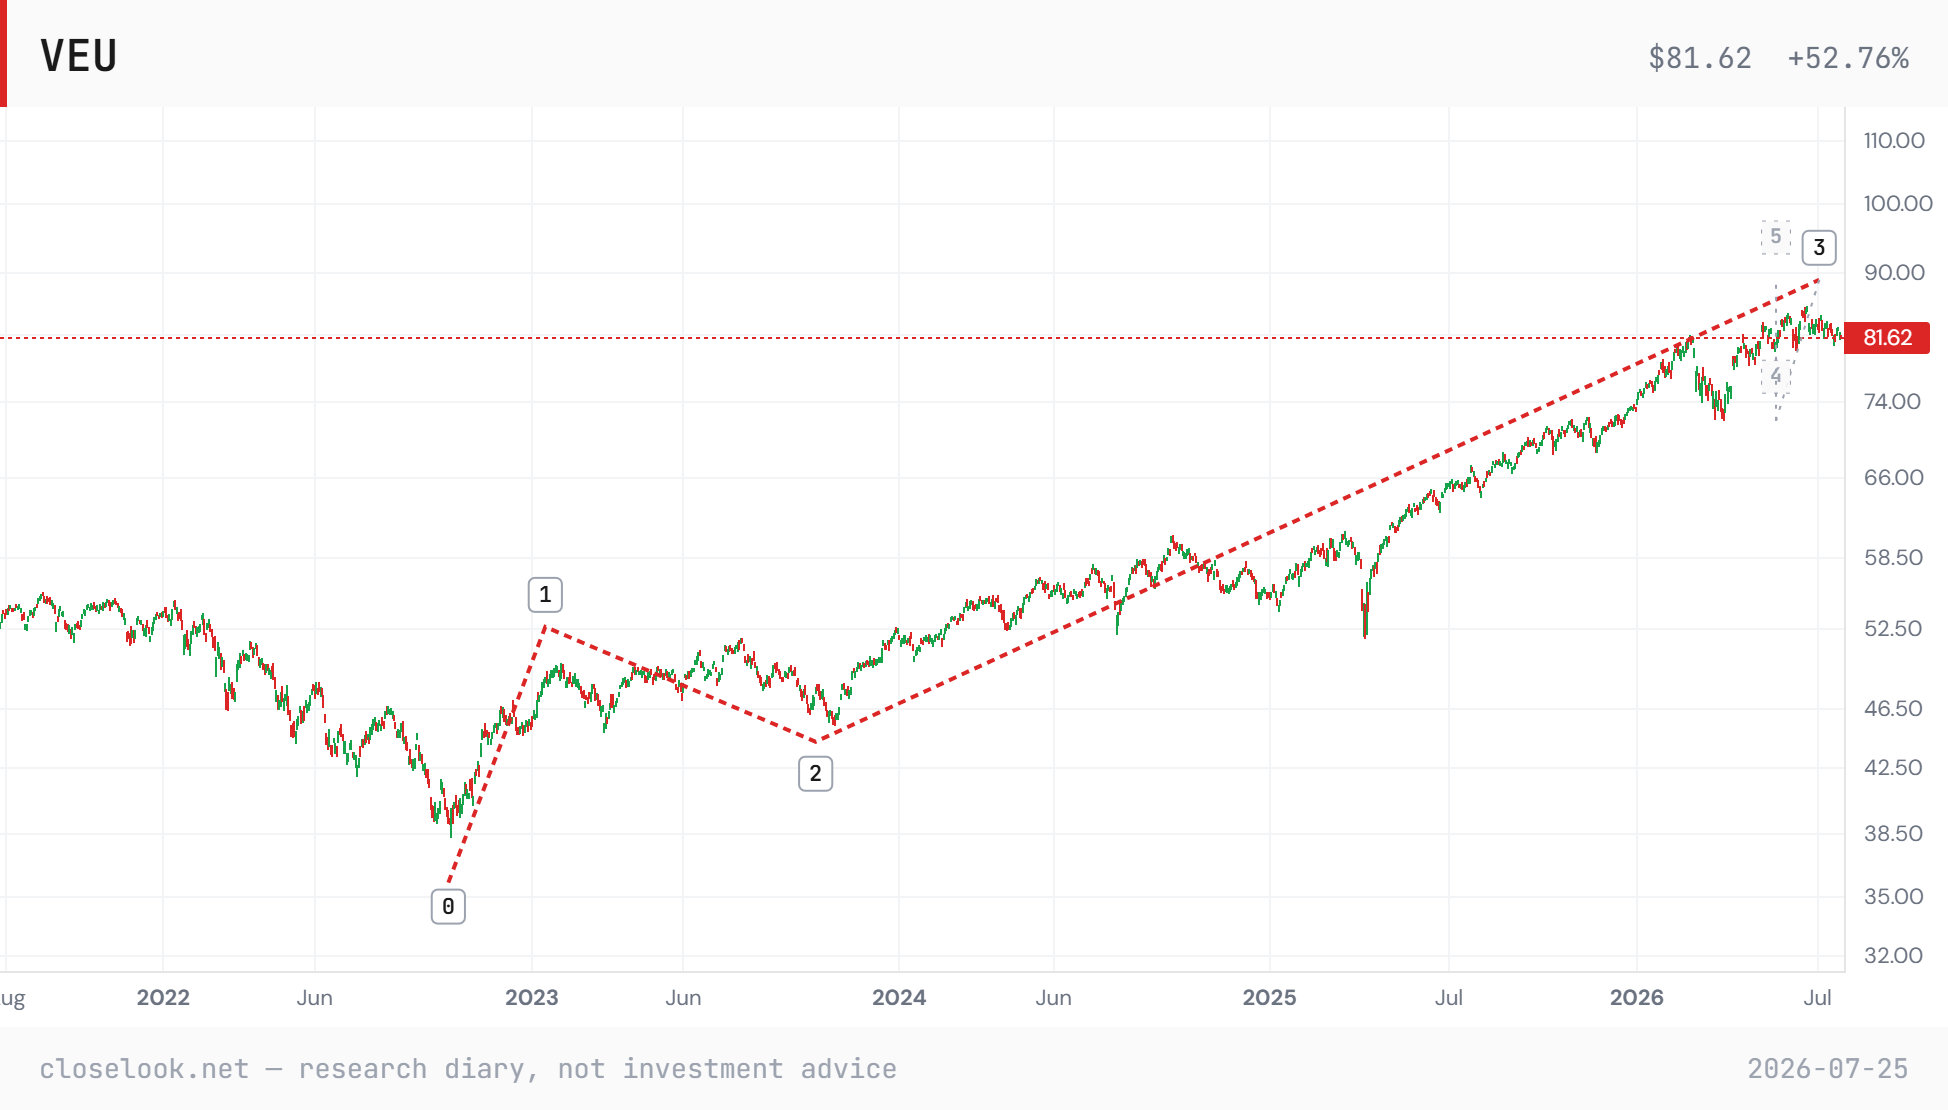
The structural read — the count, updated on the chart. The weekly count from the October 2022 low now reads: wave 1 into the early-2023 peak, wave 2 into the late-2023 low, and the long wave 3 as the advance since — with its terminal zone drawn just overhead in the 88–90 area (the high so far: 85.74). After it, the map shows a wave-4 rest — the kind measured in months, with the mid-70s as its natural landing zone — and a fifth wave projecting toward the high 90s. The live question is only where in that sequence this pullback sits: either wave 3 is finishing (one more push toward 88–90 before the rest), or the rest began at 85.74 slightly early. Both branches carry the same portfolio conclusion, which is why we can hold them at once: the multi-year advance is not complete at trend degree, but a months-long consolidation is on the map — before or after one more high. This week’s contribution was behavioral, not structural: through a US-made stress week, the ex-US structure was the calmer one.
3 · The Outlook
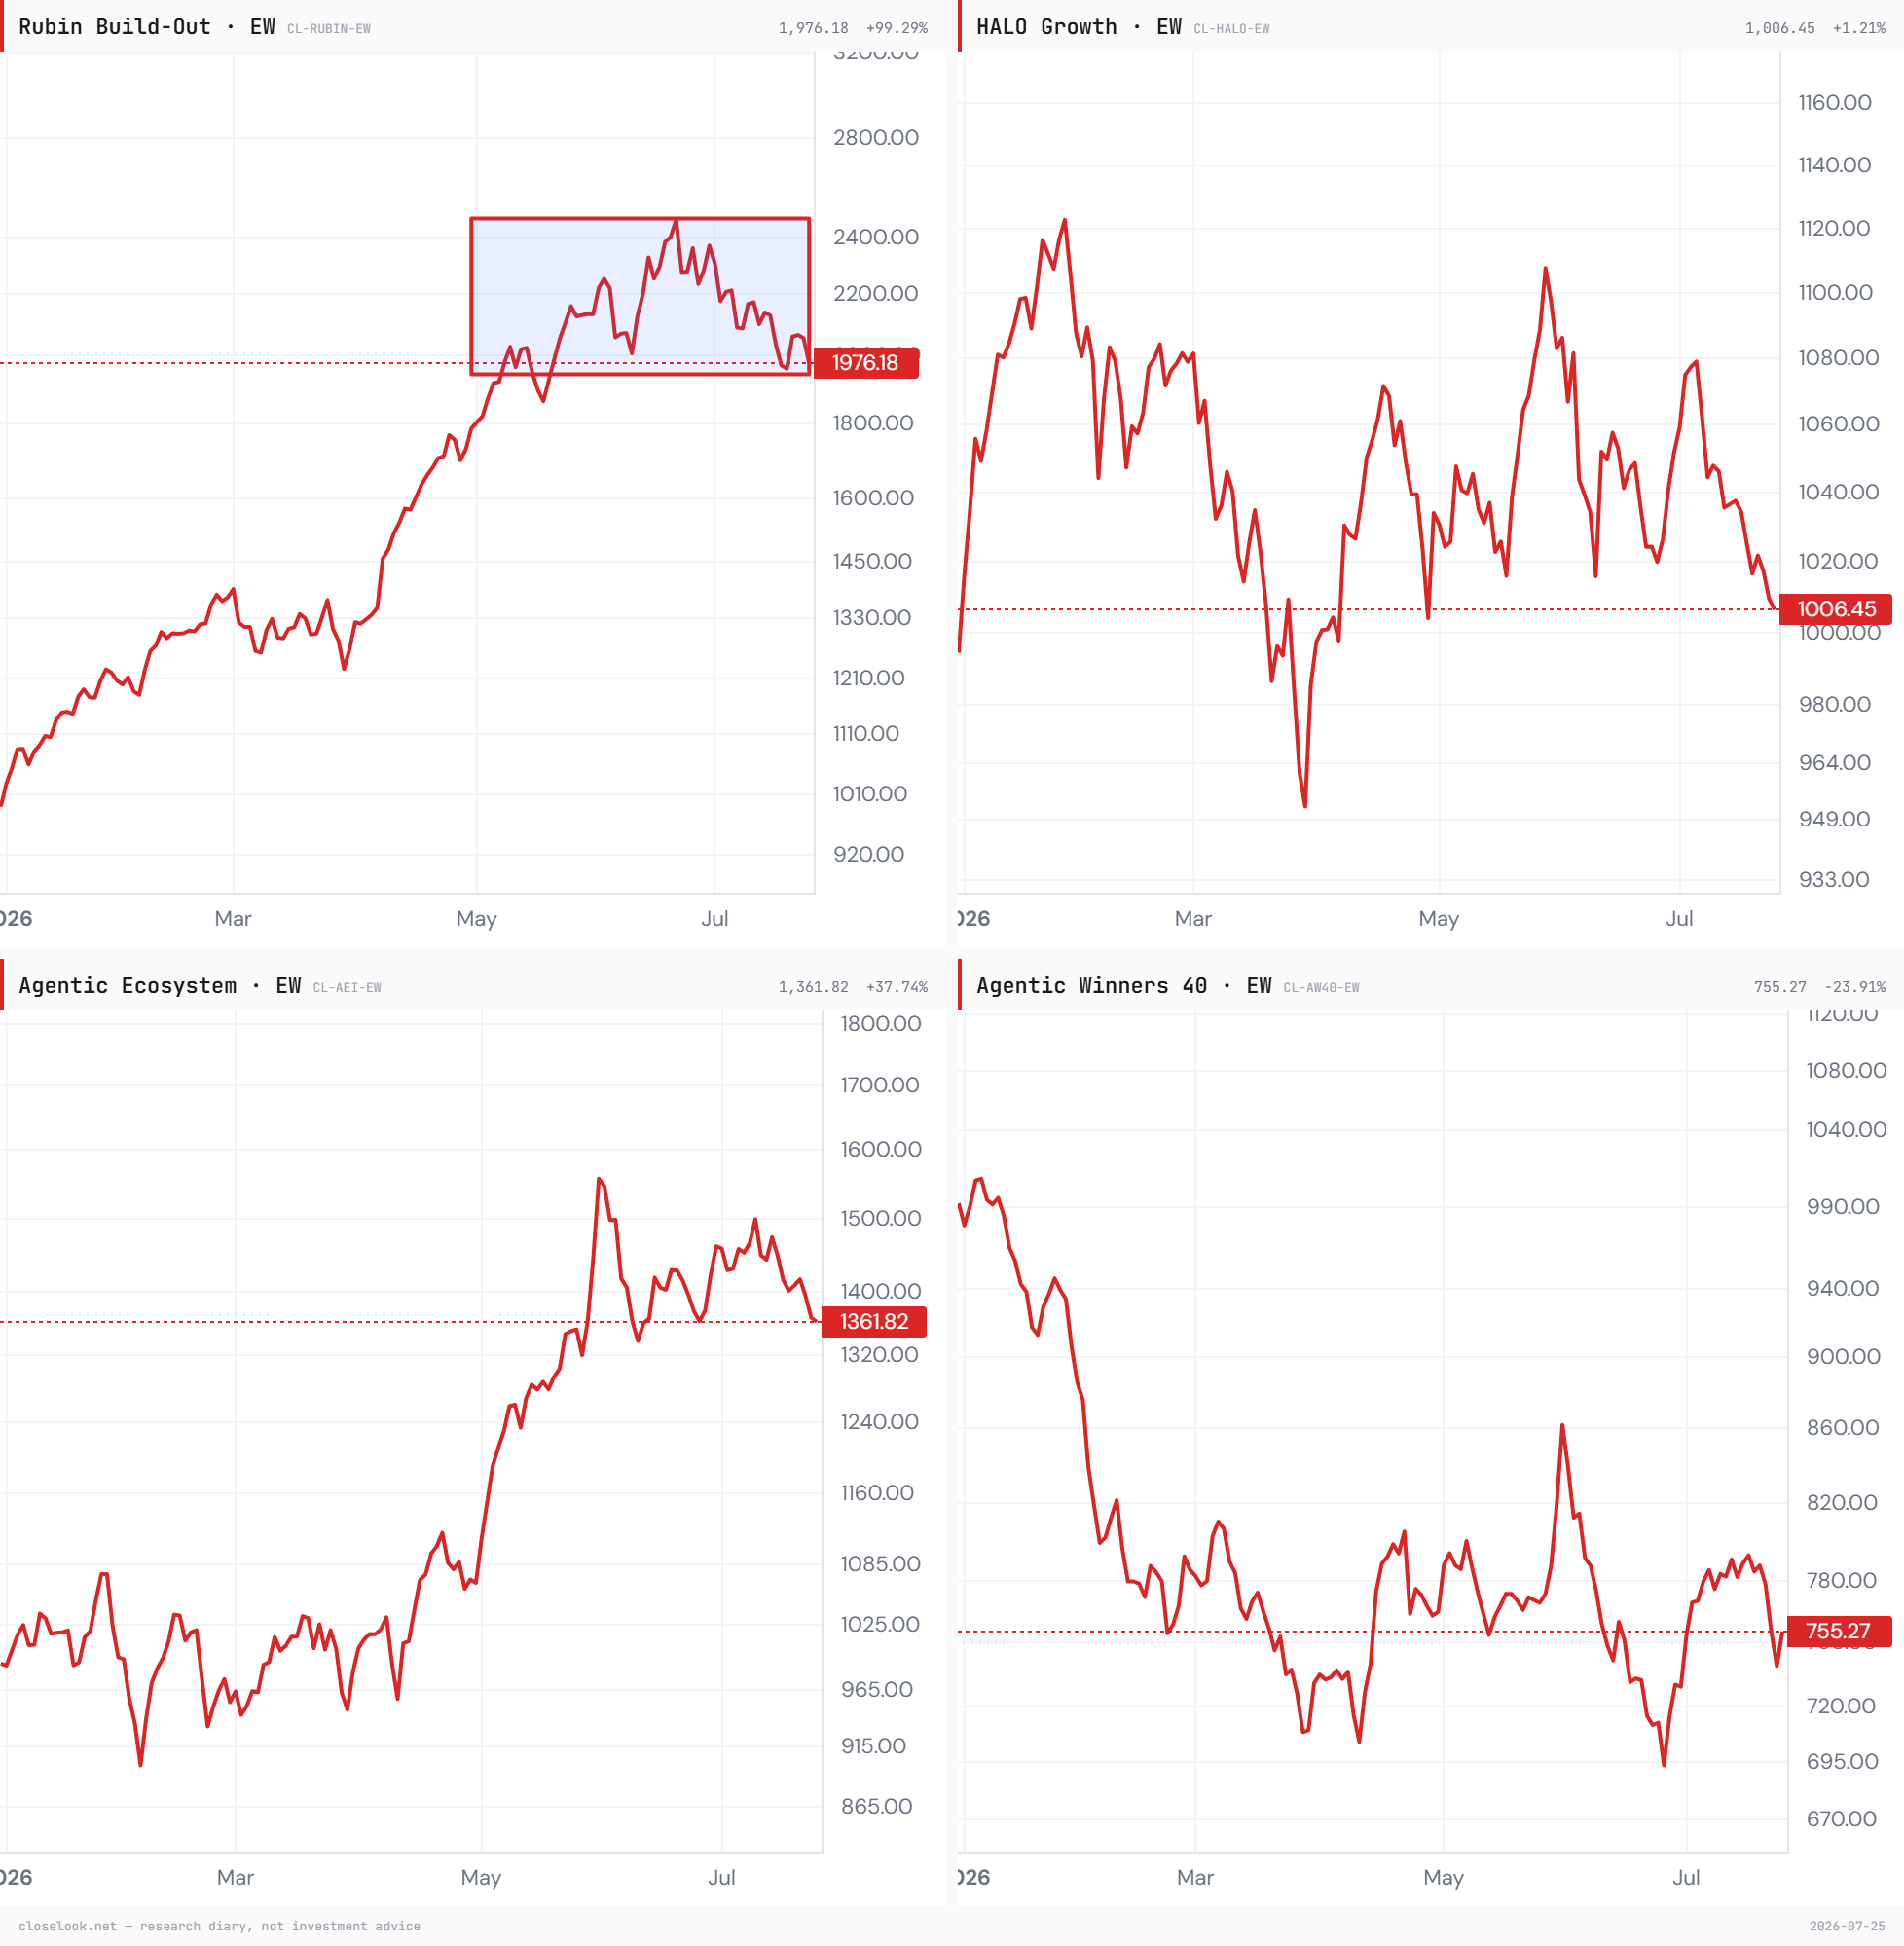
The four indices. Last week the ladder sorted by physical exposure — Rubin took −9.3% while the agentic operators finished green. This week the ladder inverted: Rubin +0.4% (+92% YTD) as the build-out complex stabilized after its washout, while AW40, the agentic operators, gave back −3.7% (−23% YTD), the Agentic Ecosystem −2.9% (+38% YTD) and HALO −1.9% (−1% YTD).
Then Friday inverted it again: AW40 rose +2.2% on the orchestrator day while Rubin fell −3.8% with the SOXX break. Read the two moves together and the picture is not “hardware versus software” — it is a market that no longer treats the AI trade as one trade. The rate shock hit the leveraged and the extended; the orchestration repricing paid the control plane; and the Agentic Winners index — whose Control-Plane cohort is the diary’s expression of the orchestration thesis — is where we keep score.
The regime gauge. Money Temperature composite at 50 — up six points from last week’s 44, back to dead-neutral mid-band. The gauge is saying what the regional board says: the forced-selling phase cooled, and no euphoria replaced it. Rotations get funded at 50; chases do not.
4 · What May Lie Ahead
Levels. VEU: the 50-day at 82.98 remains the overhead test, the 80.73–78.77 confluence band (congestion shelf + the trendline through the April 2025/2026 lows) remains the downside tripwire — both untouched this week, both unchanged in meaning. SOXX: the 530–532 band is now overhead; the next support is the primary channel floor around 520, the mid-July washout low — and the down-channel from the June highs still reads corrective (flag-shaped) unless 520 goes. QQQ broke 694 on its third test (closed 684); that level flips to resistance. SPY sits just below its 50-day (~745) with a green Friday and 10 of 11 sectors up — the index-level tape is not broken, the tech-weighted tape is. SK Hynix: $149 remains the line that defines the debut. Korea’s 50-day sits far overhead at ~189 — July’s scar needs months, not weeks.
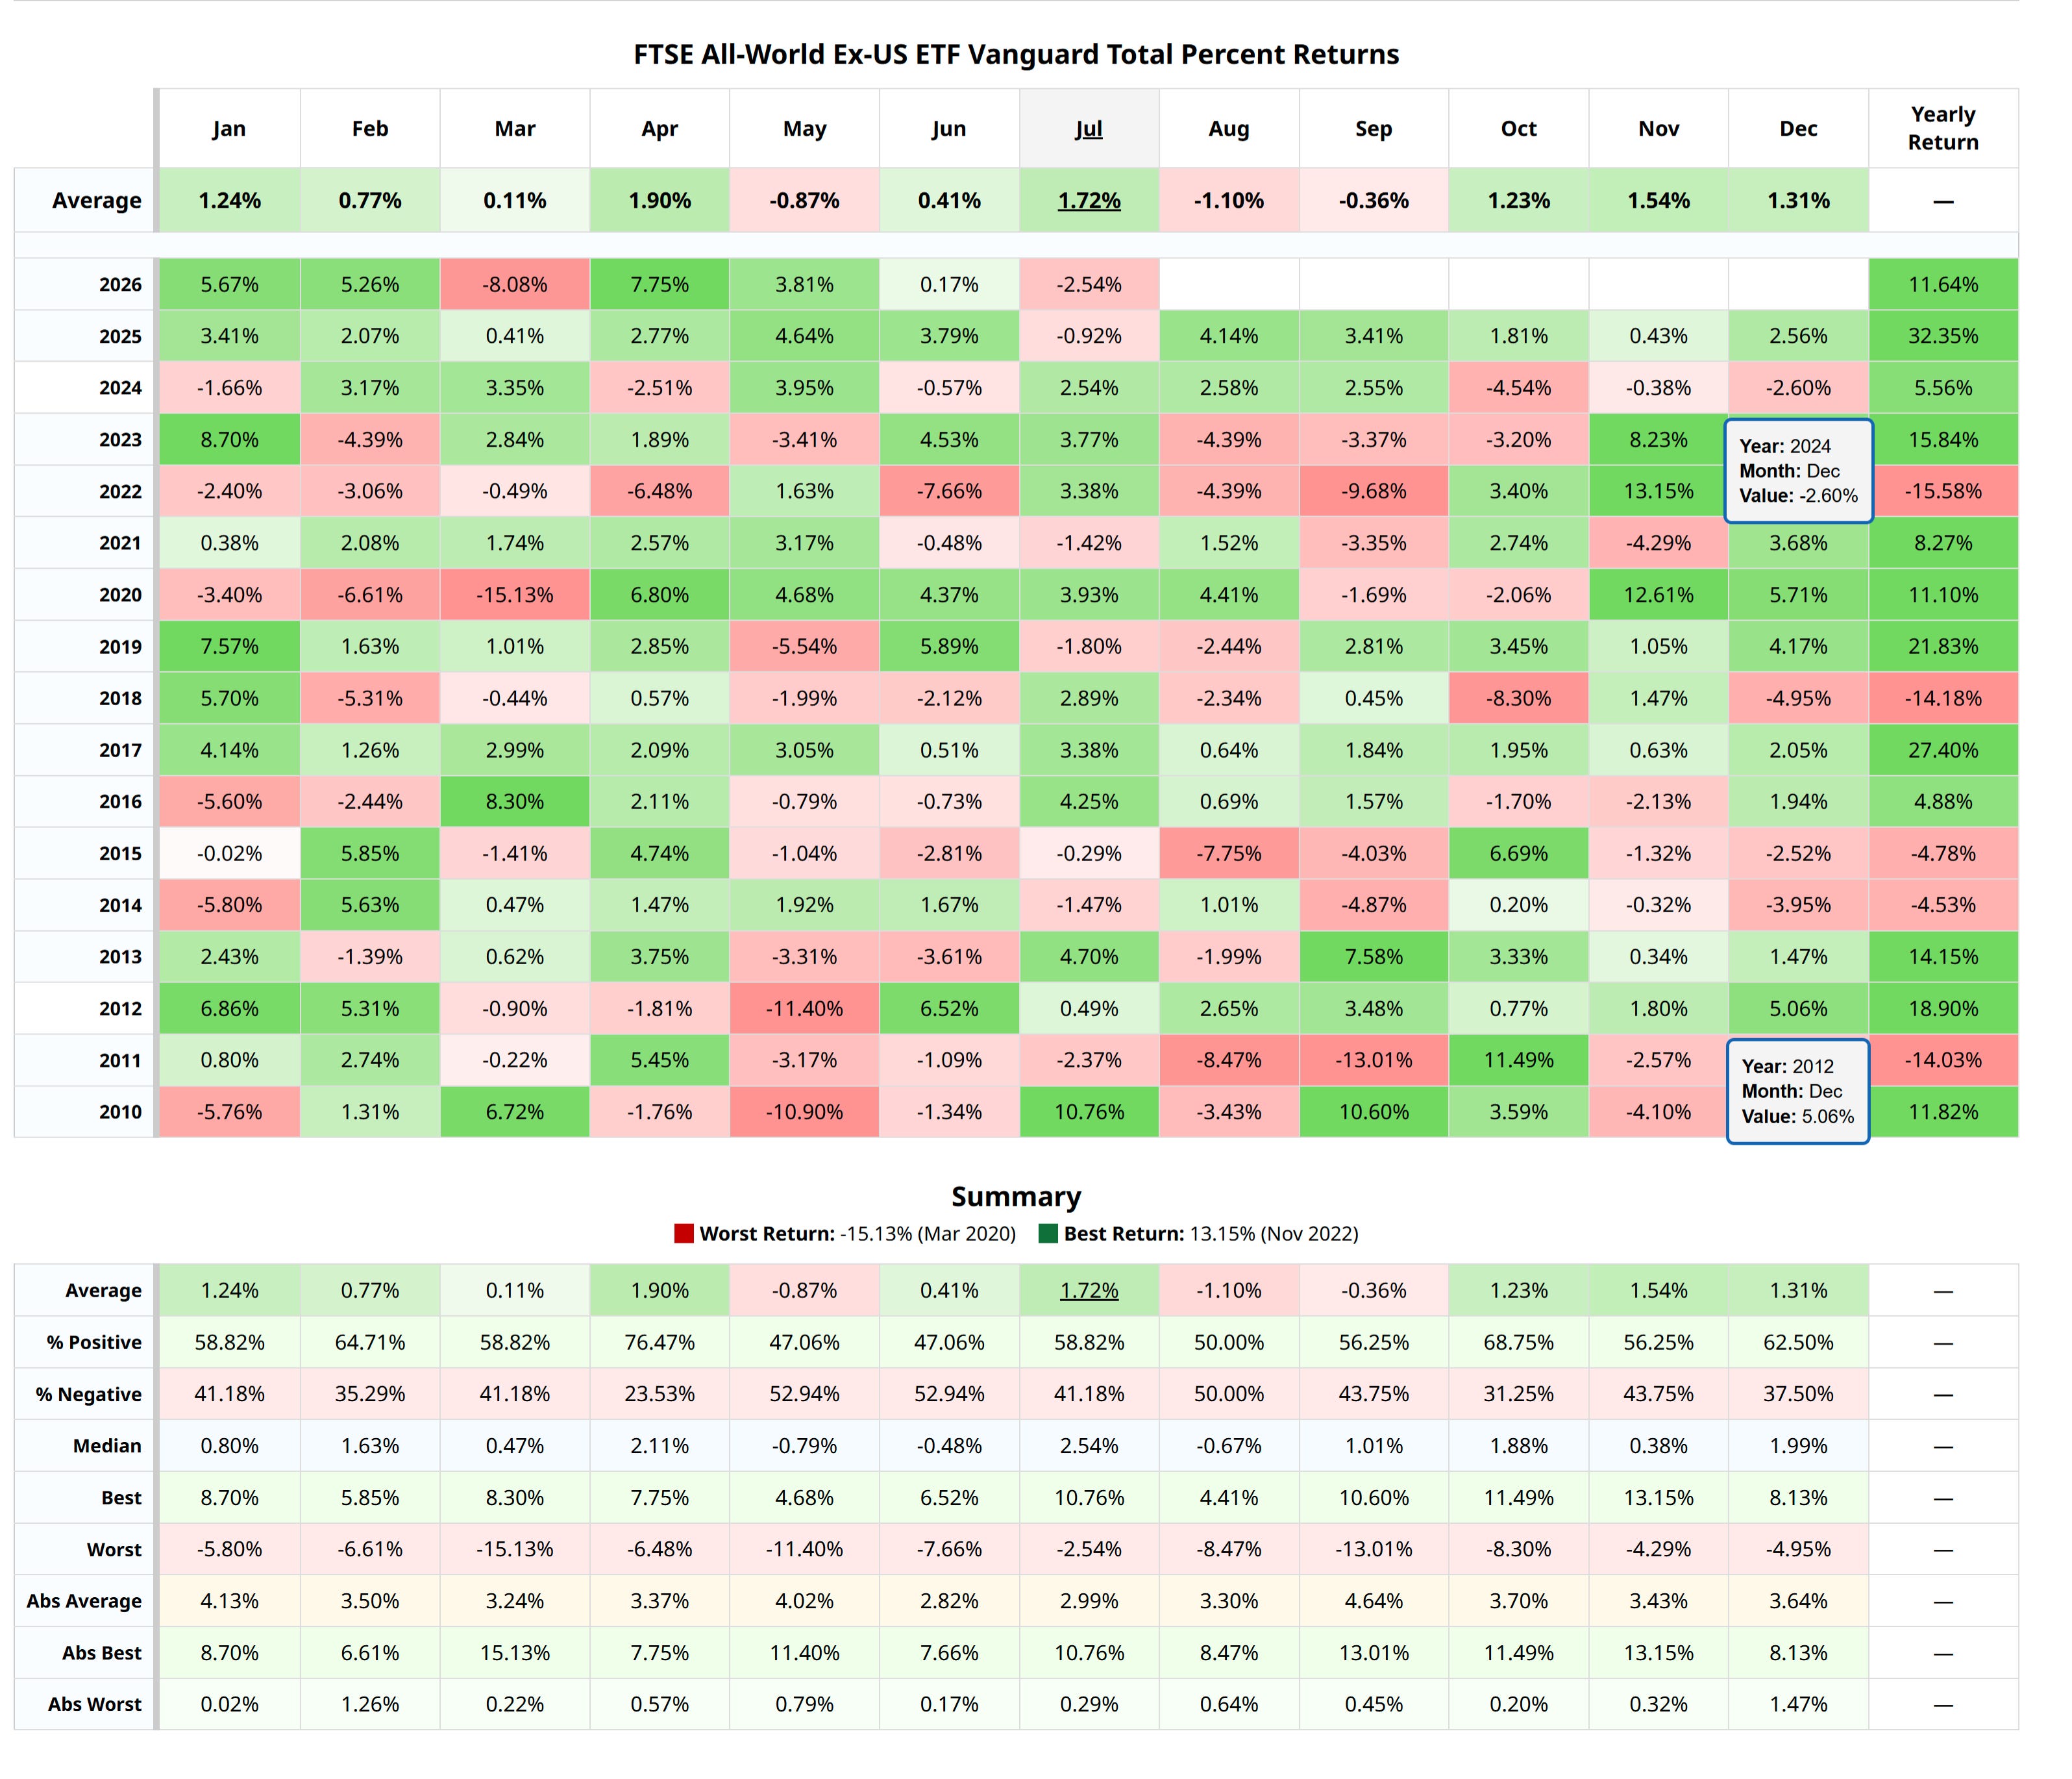
The calendar turns against the book — now. One more input for the two-month map, and it points the same way as the wave count: seasonality. On VEU’s 17-year calendar, August and September are the only two consecutive months with a negative average — August −1.1% (positive only half the time; the worst prints: −8.5% in 2011, −7.8% in 2015), September −0.4%. The rest of the year is green on average; the recovery columns are October through December. Read it against the structural read above: the fourth-wave rest the chart maps and the calendar’s only soft patch occupy the same two months. Neither is a forecast alone; both pointing at August–September at once is how this letter defines an unfavorable window — for adding, not for holding. And a footnote from the month just closed: July was the seasonally mediocre month for the ex-US book (−2.5% this year) and the seasonally best month for the Nasdaq — which printed its worst July on record instead; that anomaly is the US letter’s story, but its geography belongs here: the seasonal script failed in America, not abroad.
Monday is a verification date — for the other shock. Kimi K3’s open weights and technical report are promised for July 27. That is Monday. The design-shock narrative either becomes reproducible fact or stays a demonstration, and the K3 trilogy (Part I · Part II · Part III) is the framework we will score it against. For this book the question stays the same: does abundant design arrive at Asia’s physical layer as more tape-outs and more wafer starts.
Print season, week two — a demand-side referendum on the Asian slice. The names reporting Wednesday and Thursday — Microsoft, Meta, Amazon, Apple — are, for this book, not stocks: they are the four budgets from which the hyperscaler dollar flows to Asia’s fabs, memory lines and packaging floors. Their capex guides are the demand side of the entire flow map this letter is built on. TSMC has already answered once this season (capex raised to $60–64 billion); this week the customers themselves confirm or cut. Every Asia-linked position in the book is, indirectly, long those four guidance sentences. Cadence prints Monday, one session after the K3 weights drop — the US letter carries that print; this book only needs its echo at the physical layer.
Oil: watch the back of the curve, not the front. Spot traded through $100 this week; the December contract sits near $80. That 20-dollar gap is the market saying temporary — a supply-and-risk premium, not a new price regime. The crisis signal would be the back of the curve rising to meet spot. Until then, the oil chart is an inflation-odds input (see the hike repricing above) rather than a growth-shock input. December near $80 is the line this book watches.
