


A sidecar halted Seoul, the ex-US index set a record on Monday and lost its support line on Tuesday, and the money went to bitcoin, copper, gold and materials instead. Underneath it, France now borrows dearer than Italy.

1 · This Week’s Action
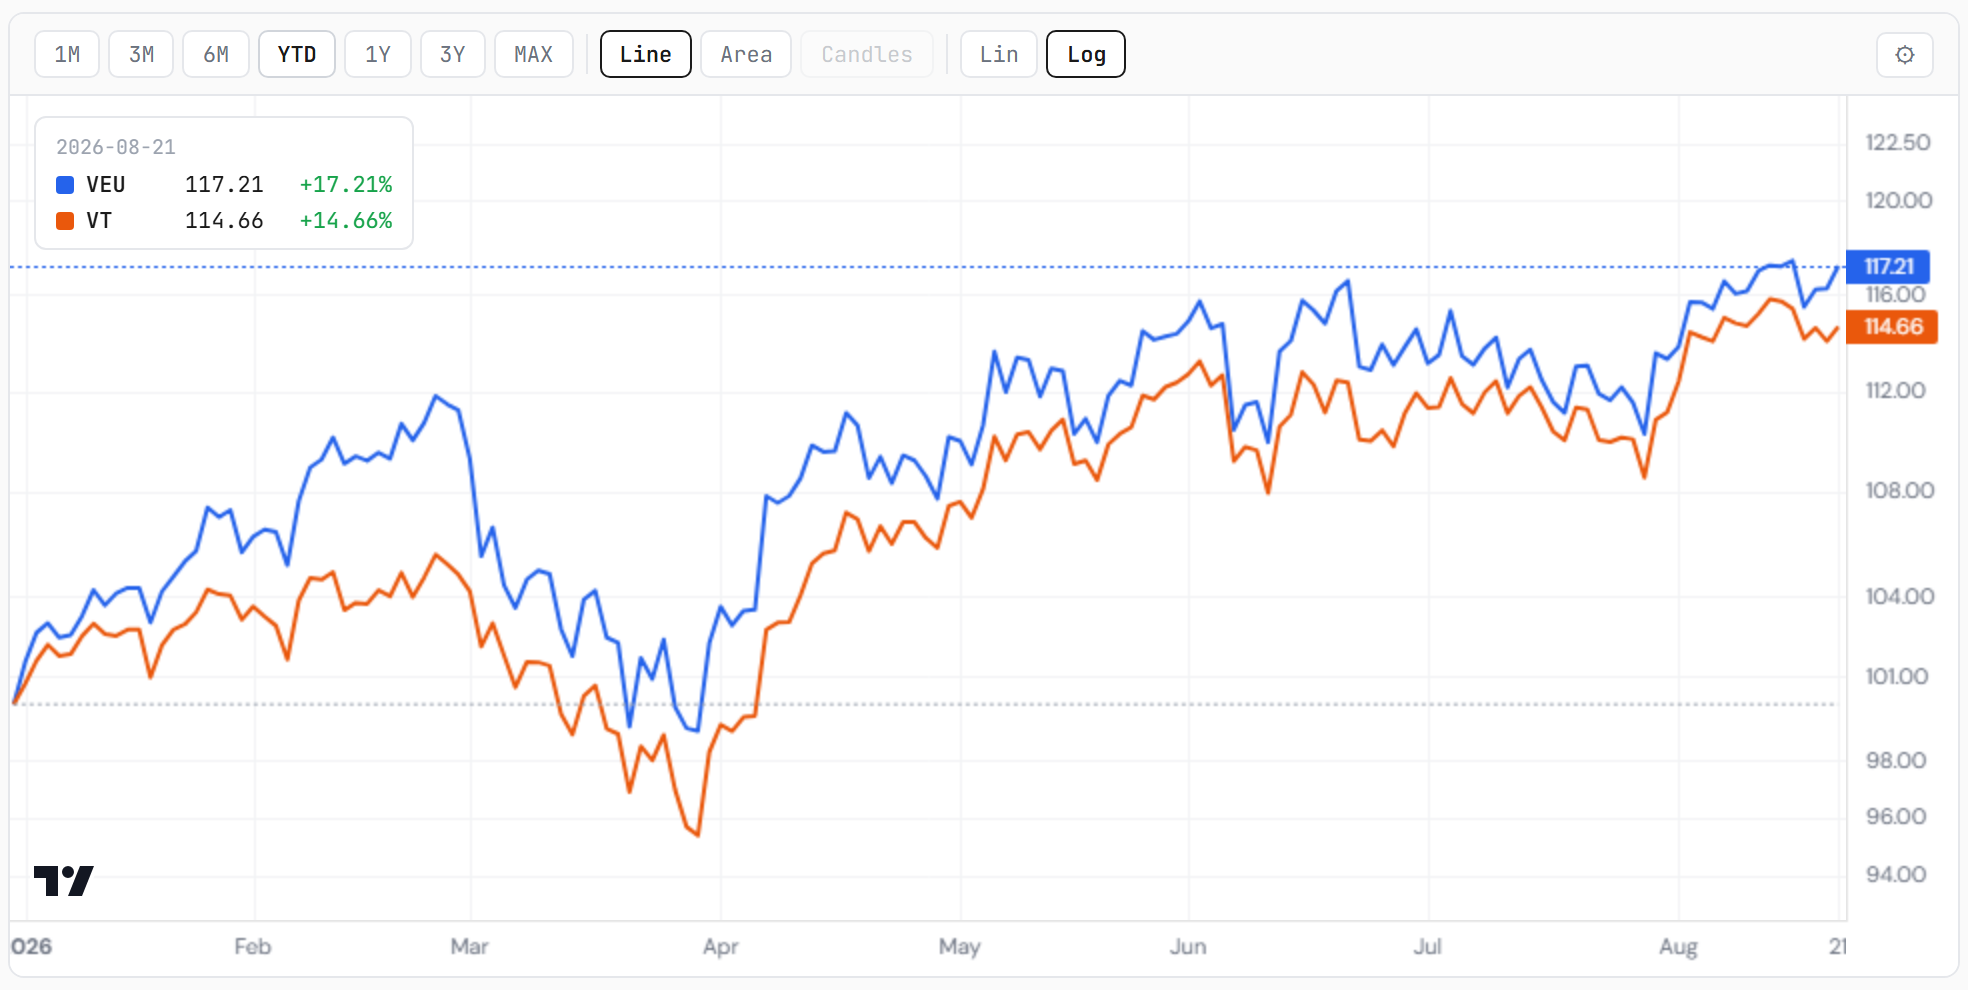
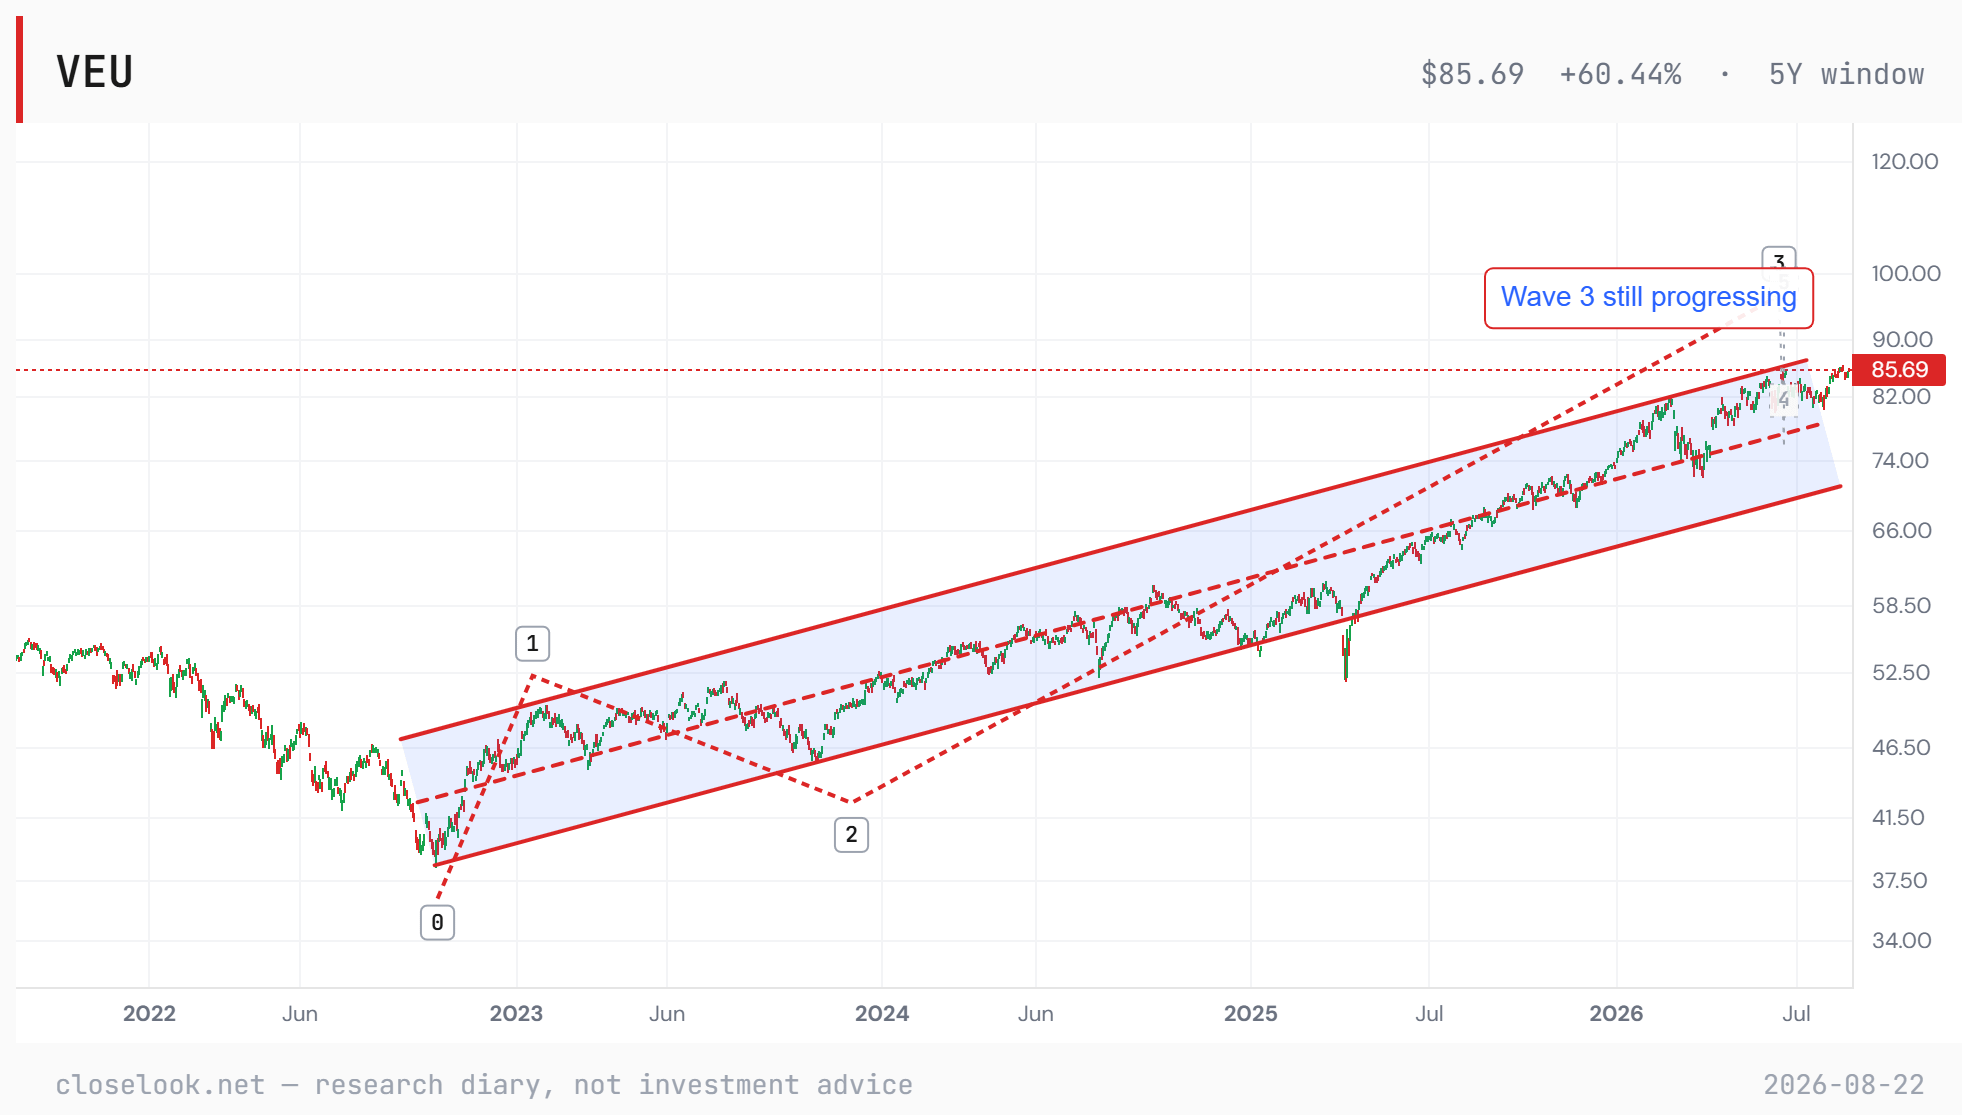
The global view. The ex-US world index closed the week at 85.69, up 0.01% — unchanged to the cent — and the flattest number on this page is hiding the busiest one. On Monday it closed 85.85, a new record close, with an intraday print at 86.22 that took out the record print this letter carried as the last unbroken mark. On Tuesday it closed 84.43, under the 85.23 line the same letter had named as the falsifier. Both levels triggered inside one week; by Friday it was back between them. The all-world index closed 160.77, down 0.91%; the S&P lost 1.37%, the Nasdaq 100 2.41%.
The year has not changed its mind either. VEU +16.5% for 2026, VT +14.0%, the S&P +12.3% — ex-US leads owning America by four points now rather than last week’s two and a half, because the week’s order went back to the one the year has kept: the ex-US cut beat the all-world cut, which beat America. Last Saturday’s “carrying America helped” lasted exactly one week.
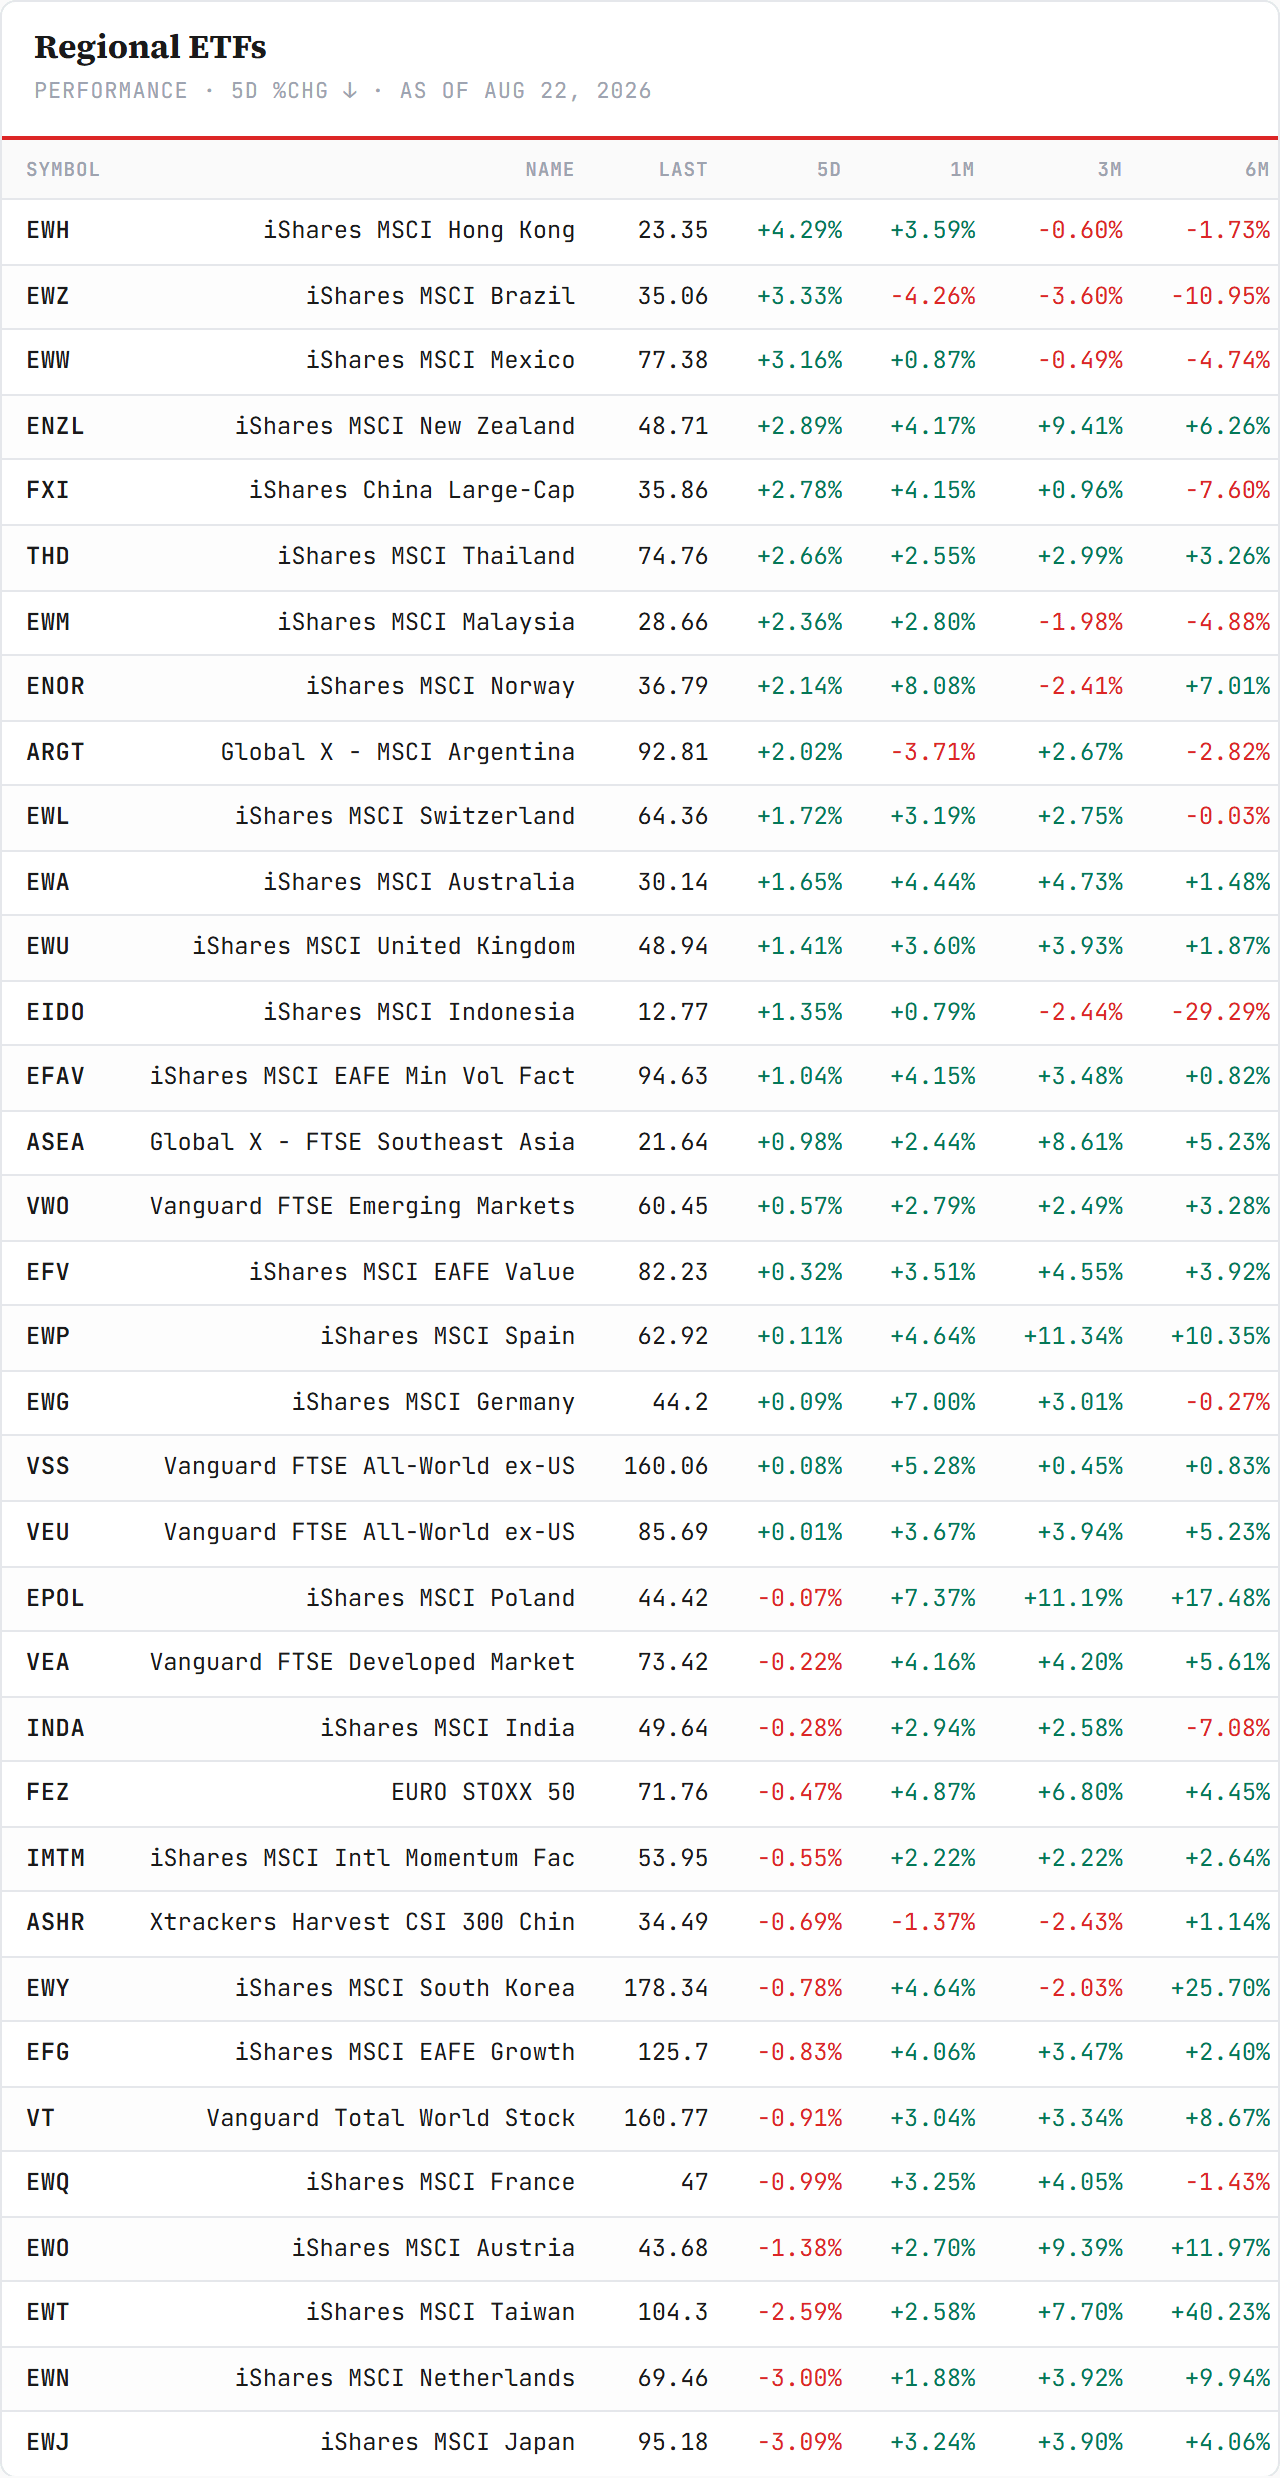
Korea is where the week happened again — in the other direction. On Wednesday in Seoul the KOSPI fell 5.8% on the close and the exchange activated its sidecar, halting program sell orders; Samsung fell 7.8%, SK hynix 9.8%. On Thursday it rose 5.9% — SK hynix +12.7% on a 40-trillion-won buyback-and-cancellation announcement, the largest ever by a Korean listed company, Samsung +9.5%. In dollar terms the Korea fund closed Monday at 185.10 — through the 180 line this letter named as the most consequential on the book, with a high of 190.11 — then Tuesday at 170.05, eight percent lower in one session, then recovered to 178.34 on Friday: −0.78% on the week, back under the line, still +83.4% on the year.
Behind it the whole regional board inverted. Last week’s top four — Korea +8.2%, Taiwan +3.9%, the Netherlands +3.5%, Japan +1.4% — are this week’s bottom four: Japan −3.09%, the Netherlands −3.00%, Taiwan −2.59%, Korea −0.78%. Last week’s two worst lines, China and Brazil, sit in this week’s top five: Hong Kong +4.29%, Brazil +3.33%, Mexico +3.16%, New Zealand +2.89%, China +2.78%. Twenty-one of thirty-five funds closed green — broader than last week’s one-corridor table — and the spread from best to worst compressed to seven points from twelve. Emerging beat developed: VWO +0.57% against VEA −0.22%.
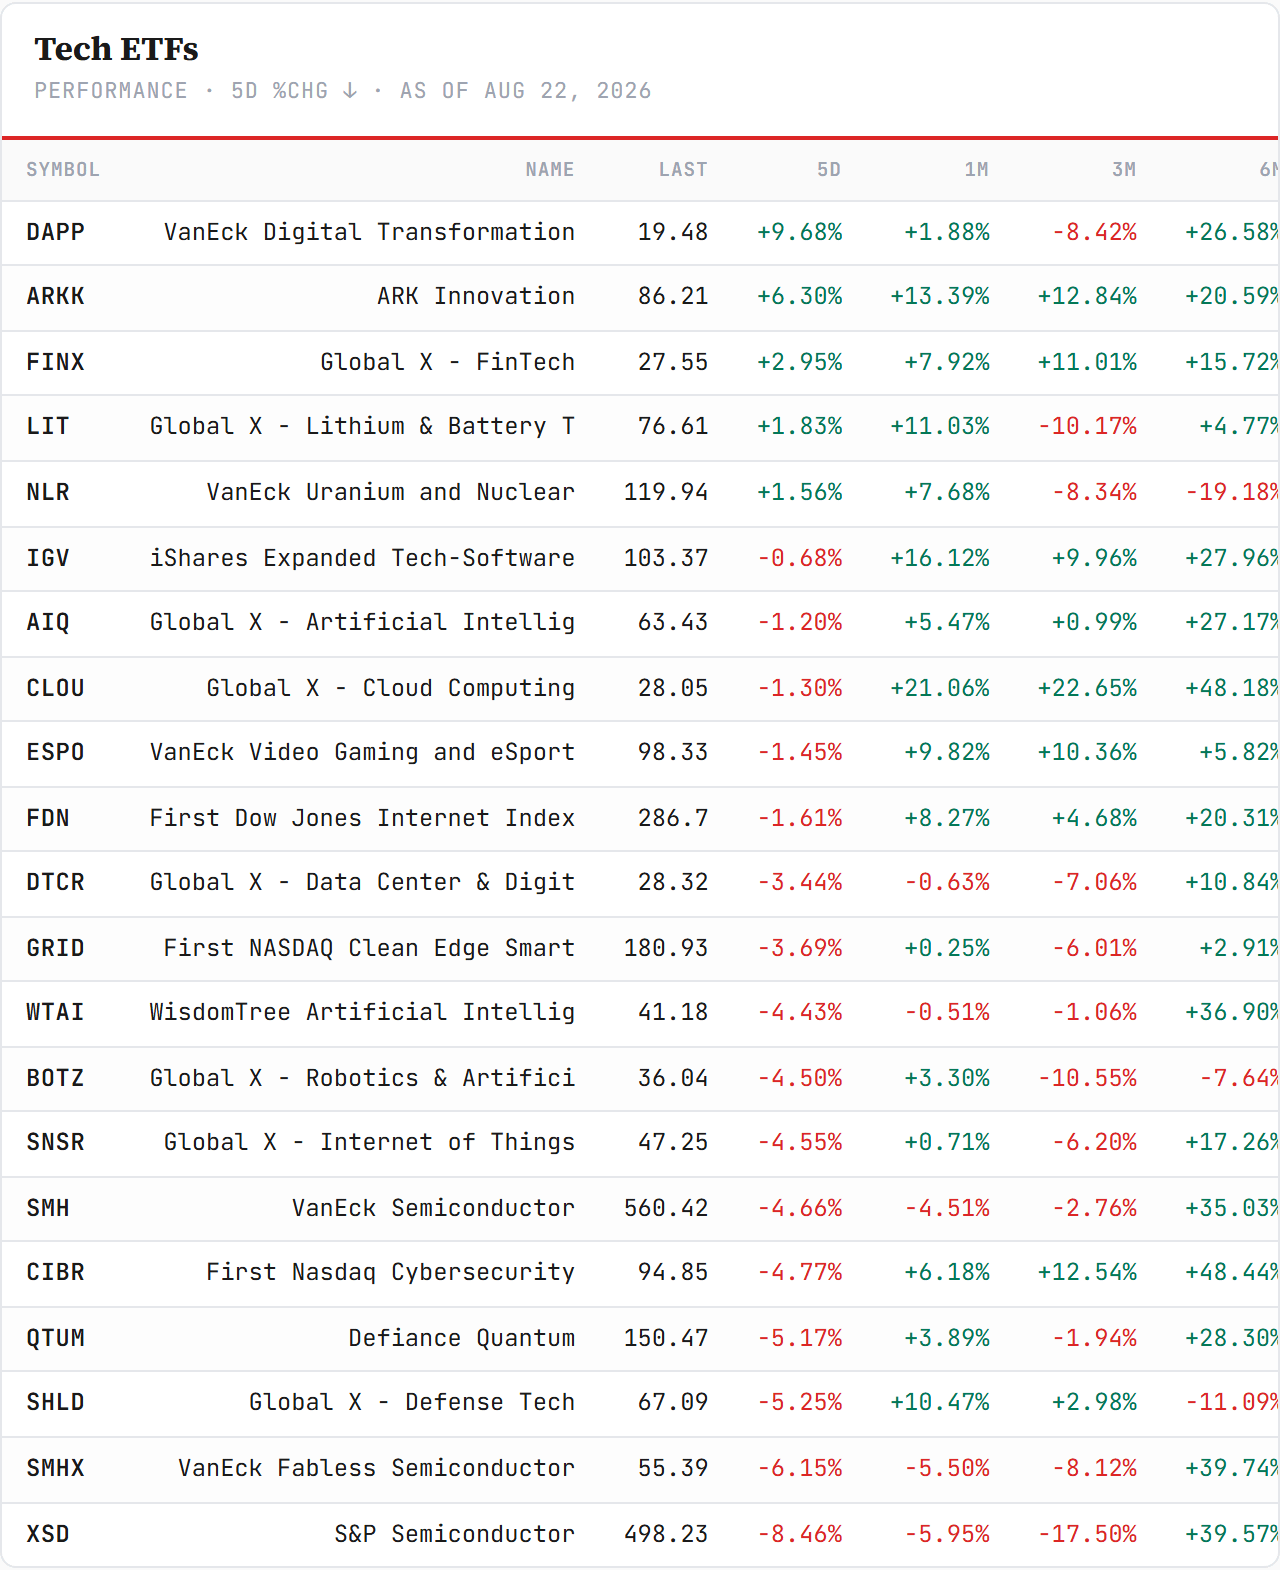
The cross-asset backdrop. The bitcoin fund gained 22.59% — the strongest line on any board this week — and is back to −12.0% on the year from −28.2% seven days ago. Copper miners +10.37%, silver +7.25%, oil +6.35% (now +94.7% for 2026), gold +5.45% to 423.36. Every hard asset on the board was bought and every equity index on it was sold: the Nasdaq top-30 −2.94%, QQQ −2.41%, the top-20 −1.74%, the S&P −1.37%. The dollar lost 0.75%. IEF −0.24% to 92.82; TLT flat at 82.05.
The US sectors. Three of eleven closed green, and the three are the same set the global cut produced: health care +4.33%, energy +2.79%, materials +1.90%. The bottom three are the buildout pair and its neighbour — technology −3.53%, utilities −3.48%, industrials −3.36%. Chips and the power to run them fell together. Sunday’s letter owns the tape and its levels; the geography of it is that the three sectors that rose are the three that own physical things.
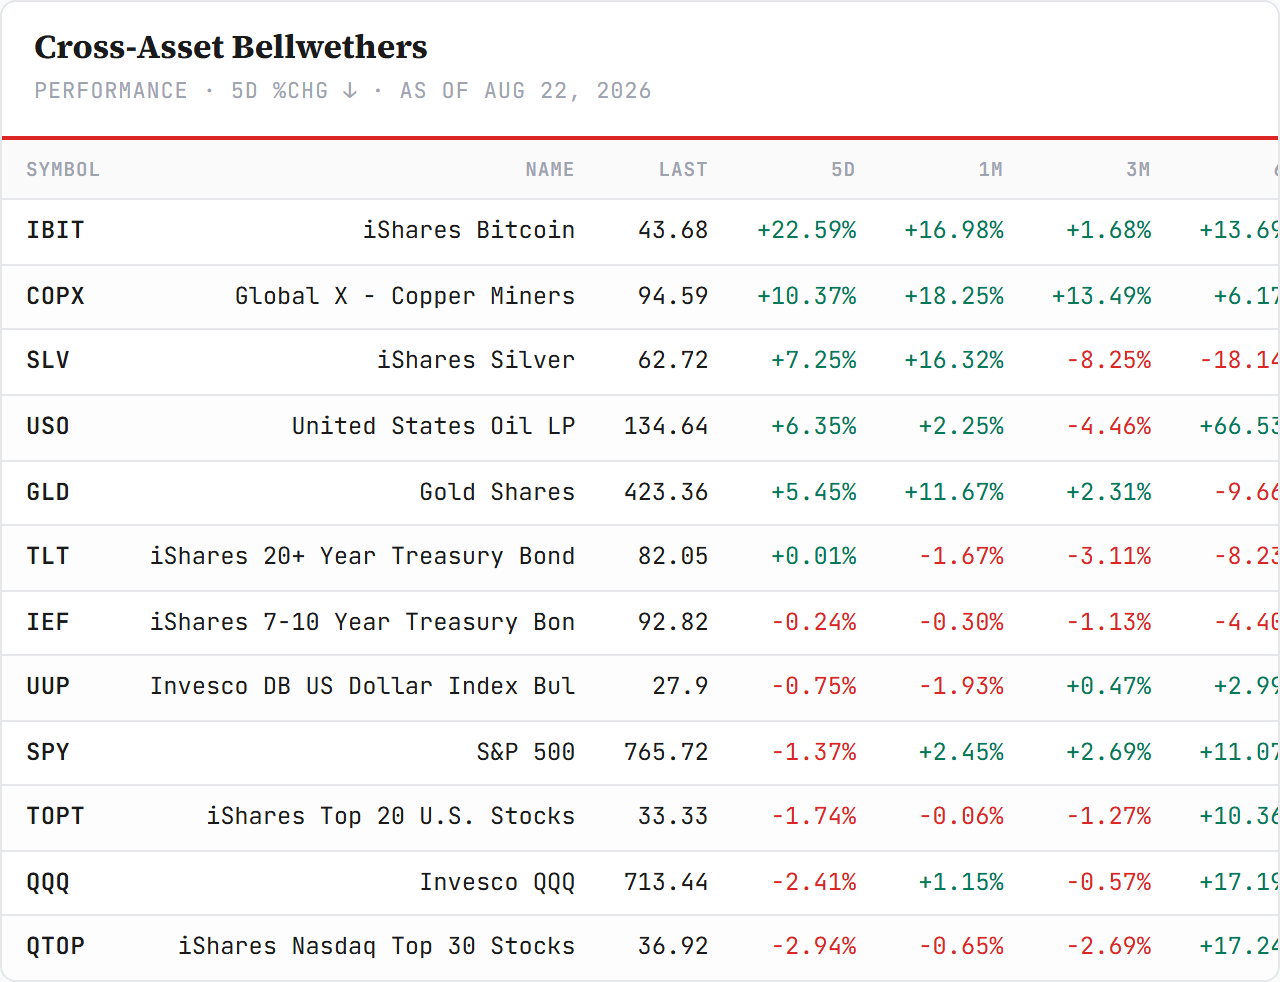
The tech ETFs. Last week’s table, inverted. The four lines that led seven days ago all reversed: WTAI +4.69% became −4.43%, cloud +4.18% became −1.30%, data-centre REITs +3.60% became −3.44%, quantum +3.40% became −5.17%. Semis were the worst of the board — XSD −8.46%, fabless −6.15%, SMH −4.66% — and every one of them still sits between +45% and +55% on the year. The five green lines are a list of what was not tech last week: crypto equities +9.68% (with the coin), ARKK +6.30%, fintech +2.95%, lithium +1.83%, uranium +1.56%. Software, −0.68%, held — the semis-down, software-up split the desk named on Friday’s tape.
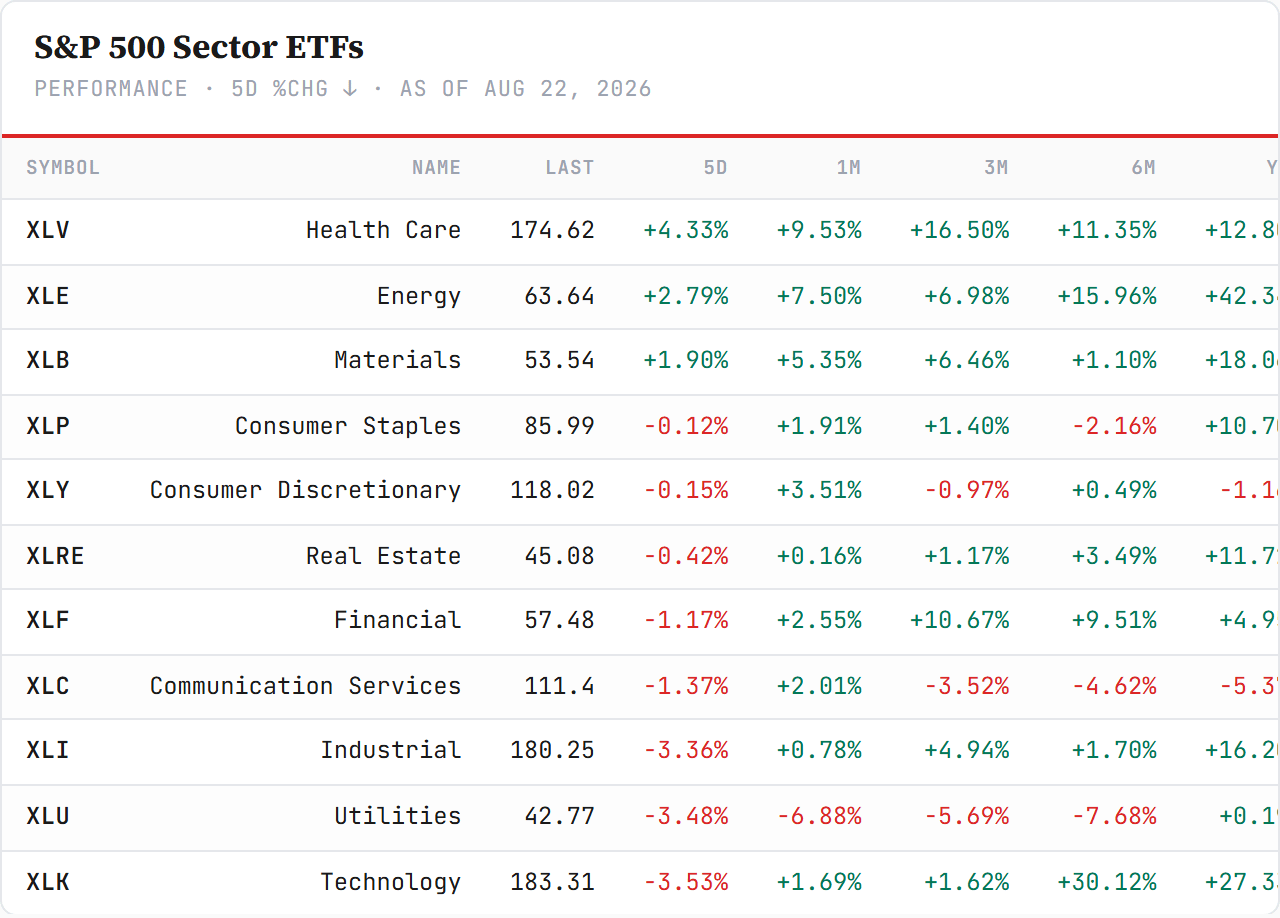
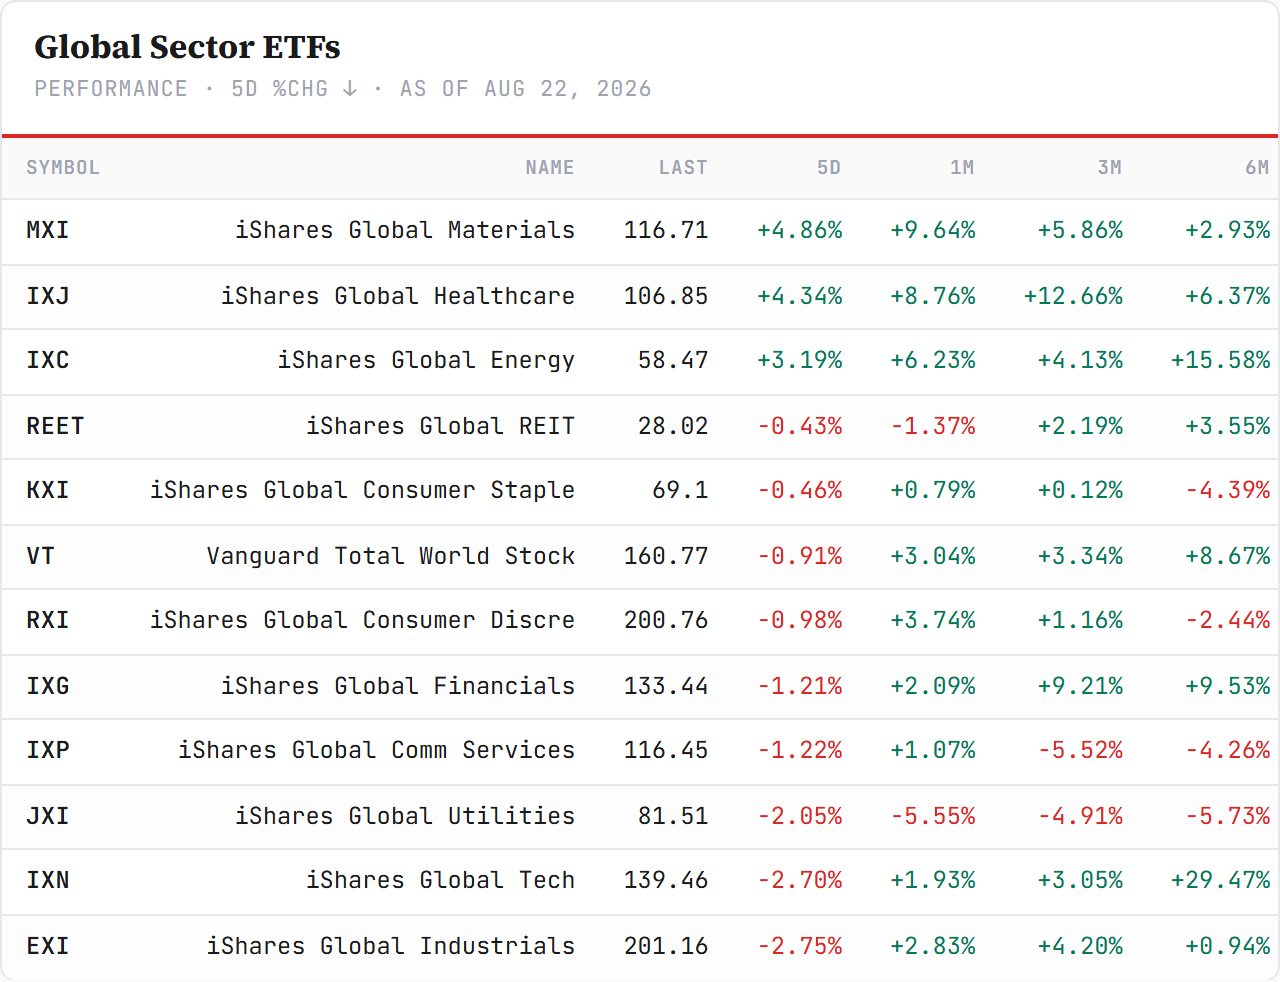
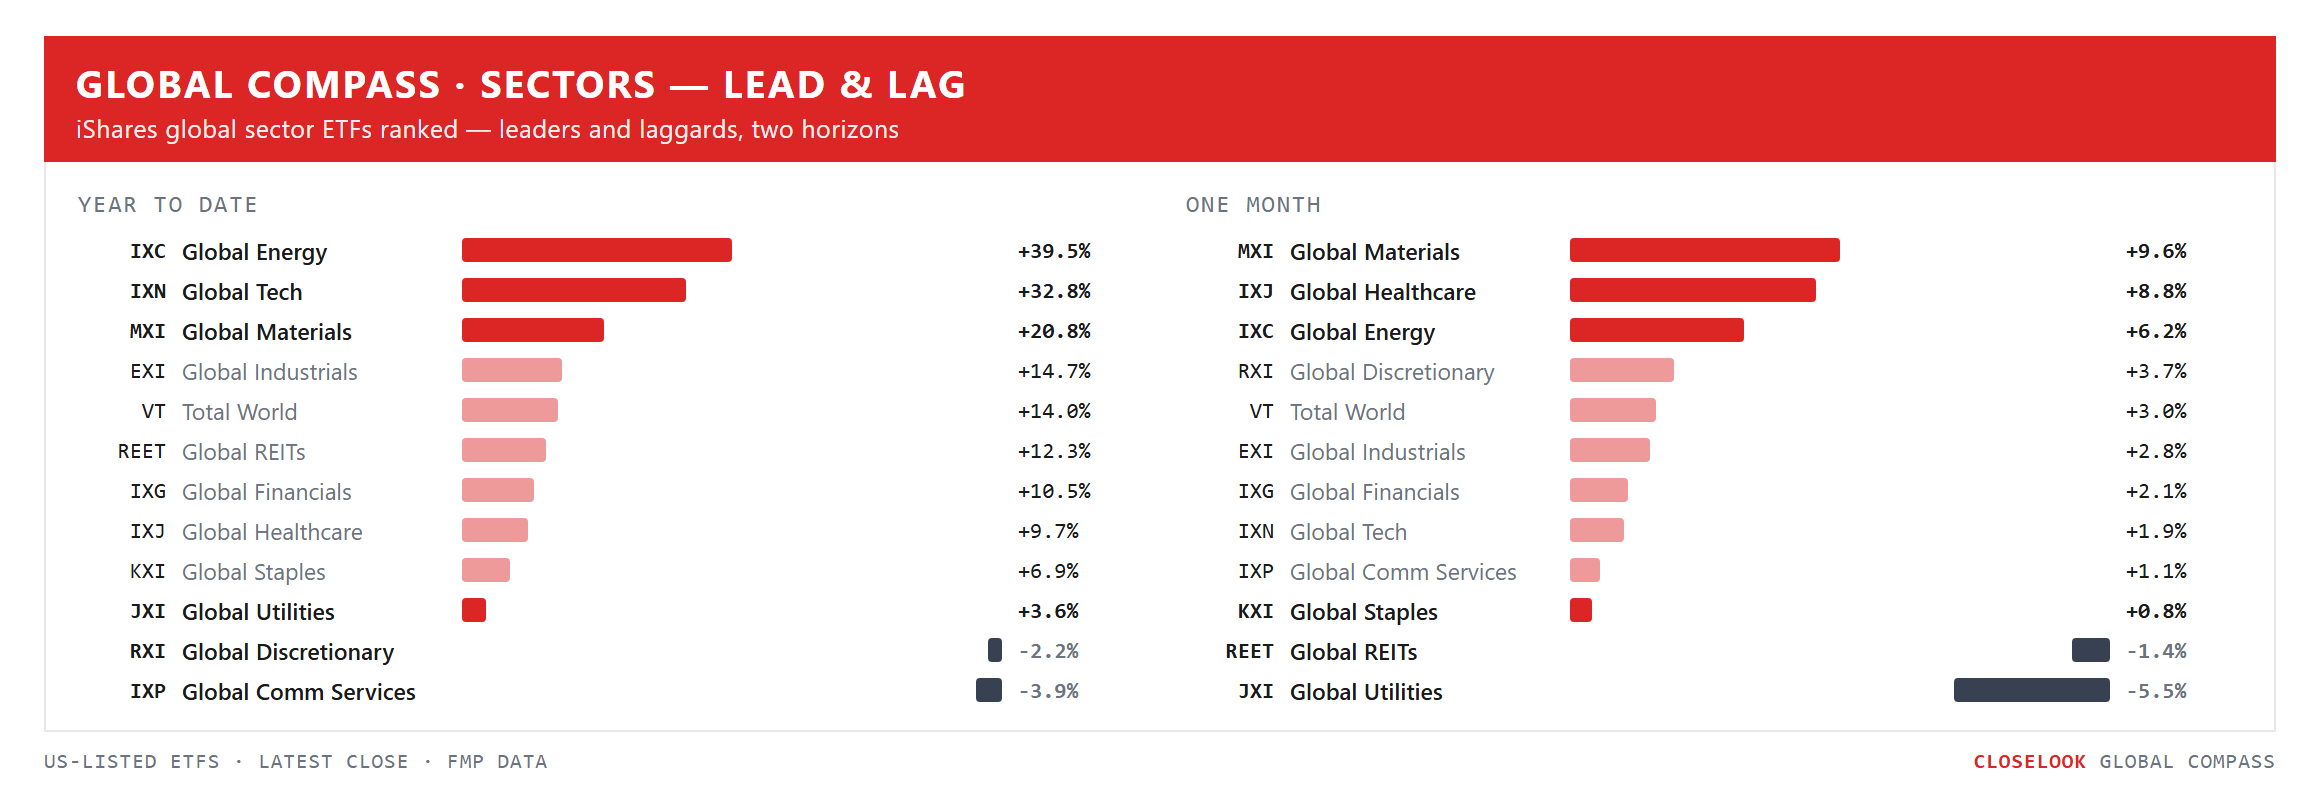
The global sectors. Materials +4.86% led — and closed at 116.71, through the February high this letter flagged last week as the one laggard still to clear. Health care +4.34%, energy +3.19%. At the other end global tech −2.70% (139.46, 6.9% below its June peak), industrials −2.75% and financials −1.21% — both of last week’s new-high sectors gave it back the sessions after they set them, 206.84 to 201.16 and 135.07 to 133.44. Utilities −2.05%, consumer discretionary −0.98% (still the year’s laggard at −2.19%).
The Global Compass
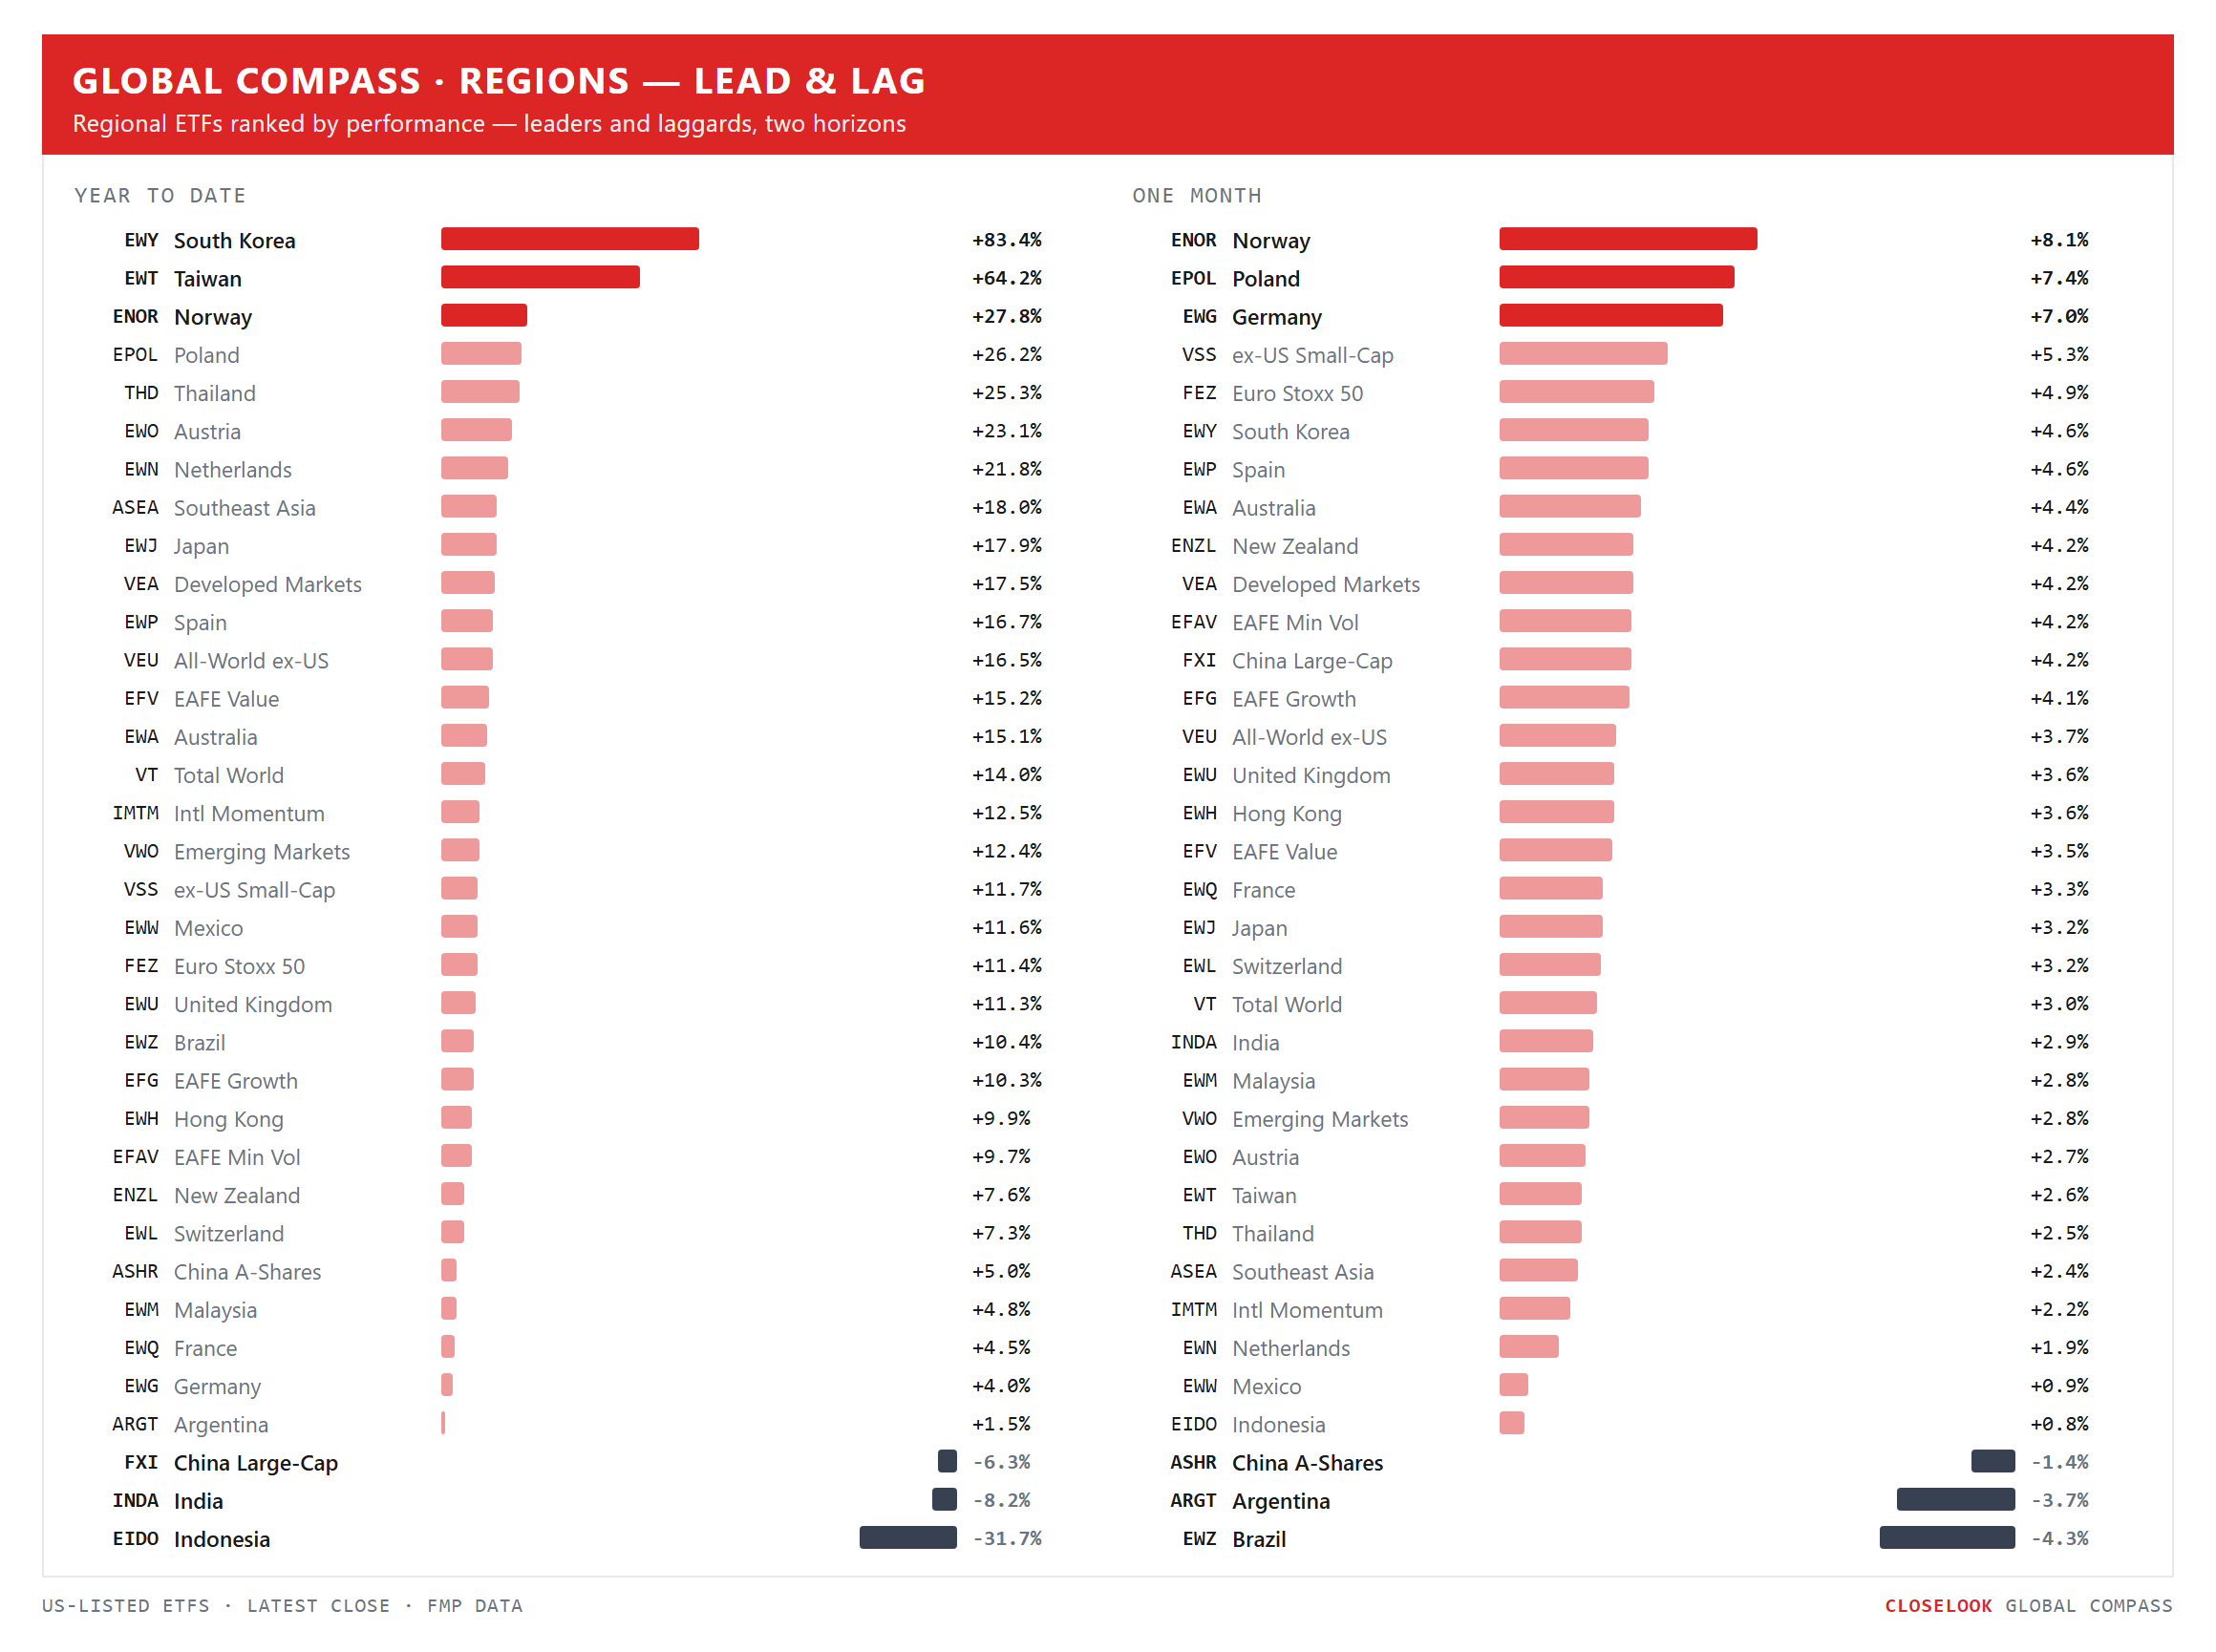
Regions: the corridor gave way, the periphery came back. Last week this board recorded breadth collapsing into one supply-chain corridor while the periphery went quiet and the two big non-AI emerging markets went backwards. This week is the exact inverse: the corridor is the bottom of the table, twenty-one of thirty-five lines are green, and China and Brazil lead. Broadening in July, narrowing last week, broadening again now. The read is the one this letter has been circling: the AI-supply-chain bid is cyclical inside a broadening market — and when it rests, the rest of the world does not fall with it. It rises.
Sectors: materials answered, energy held, tech handed back. Seven days ago: energy answered at +5.67%, materials was the second-worst line at −1.50%, and this letter wrote that a metals bid that leads one week and lags the next “was a move, not a regime”. Three weeks on the sequence reads led, lagged, led to a new high — materials +4.86% and through February, with copper miners +10.37% underneath it. A move with a new high behind it is more than a move. Energy +3.19% held; tech −2.70% handed back.
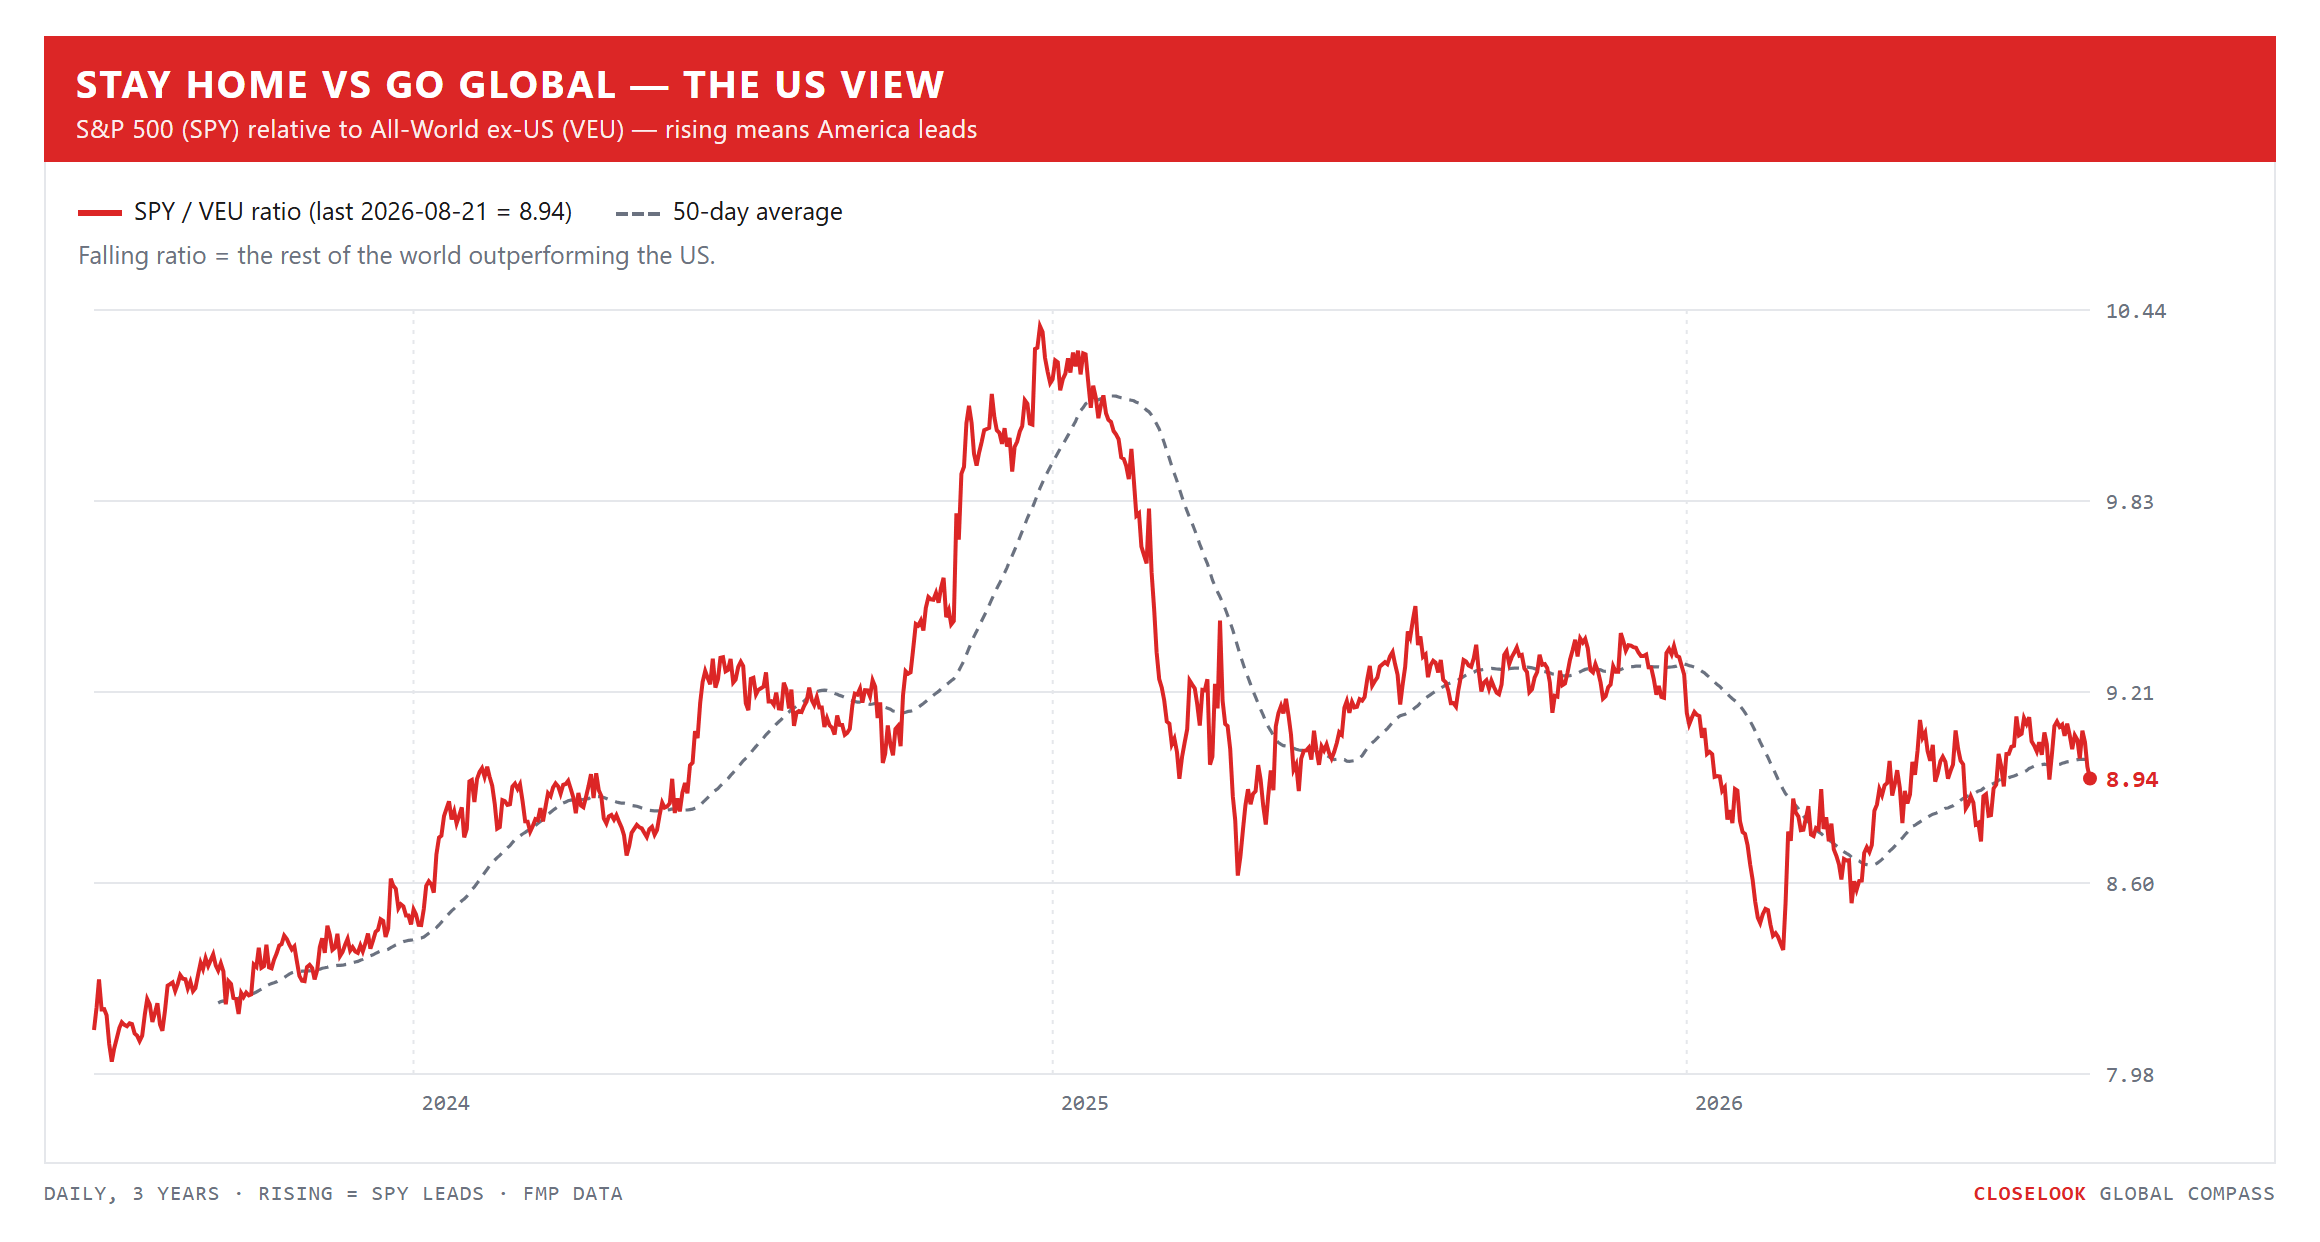
Stay home vs go global — the US view. One reading this week, not two. On the week: VEU +0.01%, VT −0.91%, SPY −1.37% — the ex-US cut beat America by 1.4 points in a down week. On the year: +16.5%, +14.0%, +12.3%. Last week the ex-US trade “lost the argument about this particular week”; this week it won it back, and the year’s lead widened. That is what a trend does when the counter-week passes.
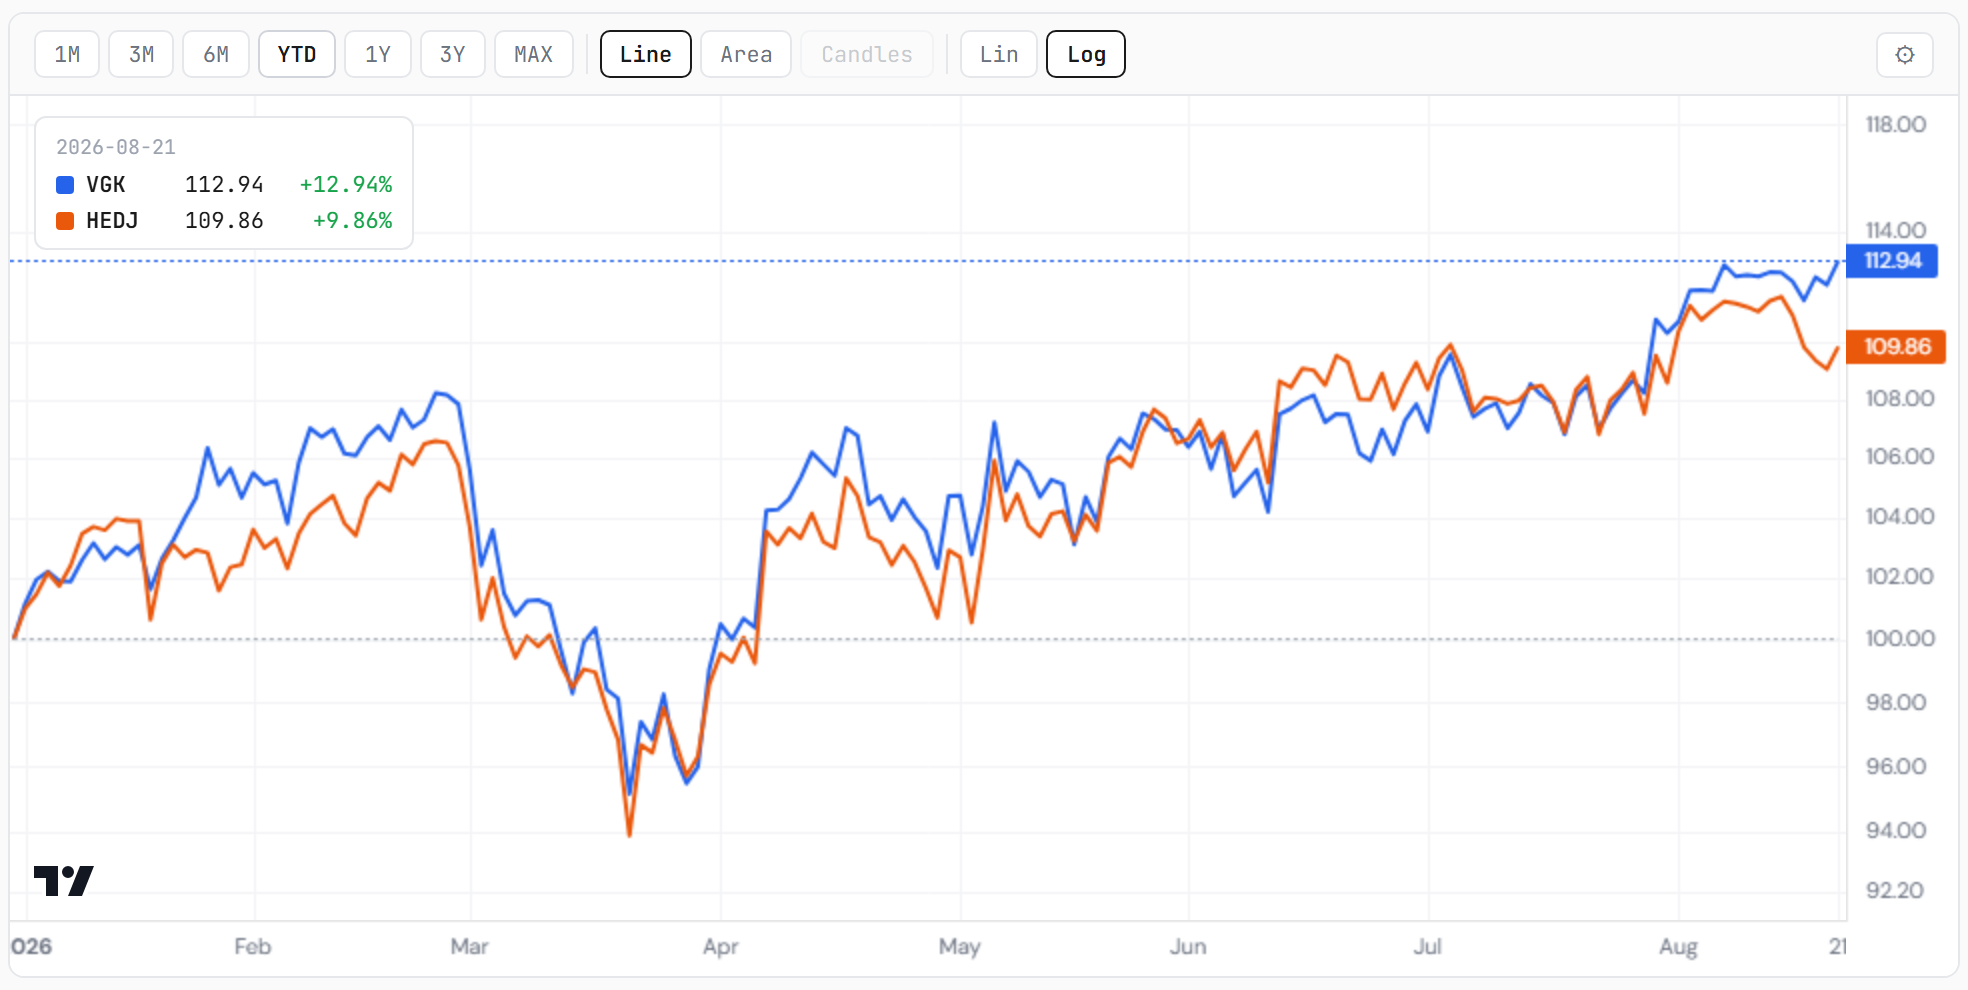
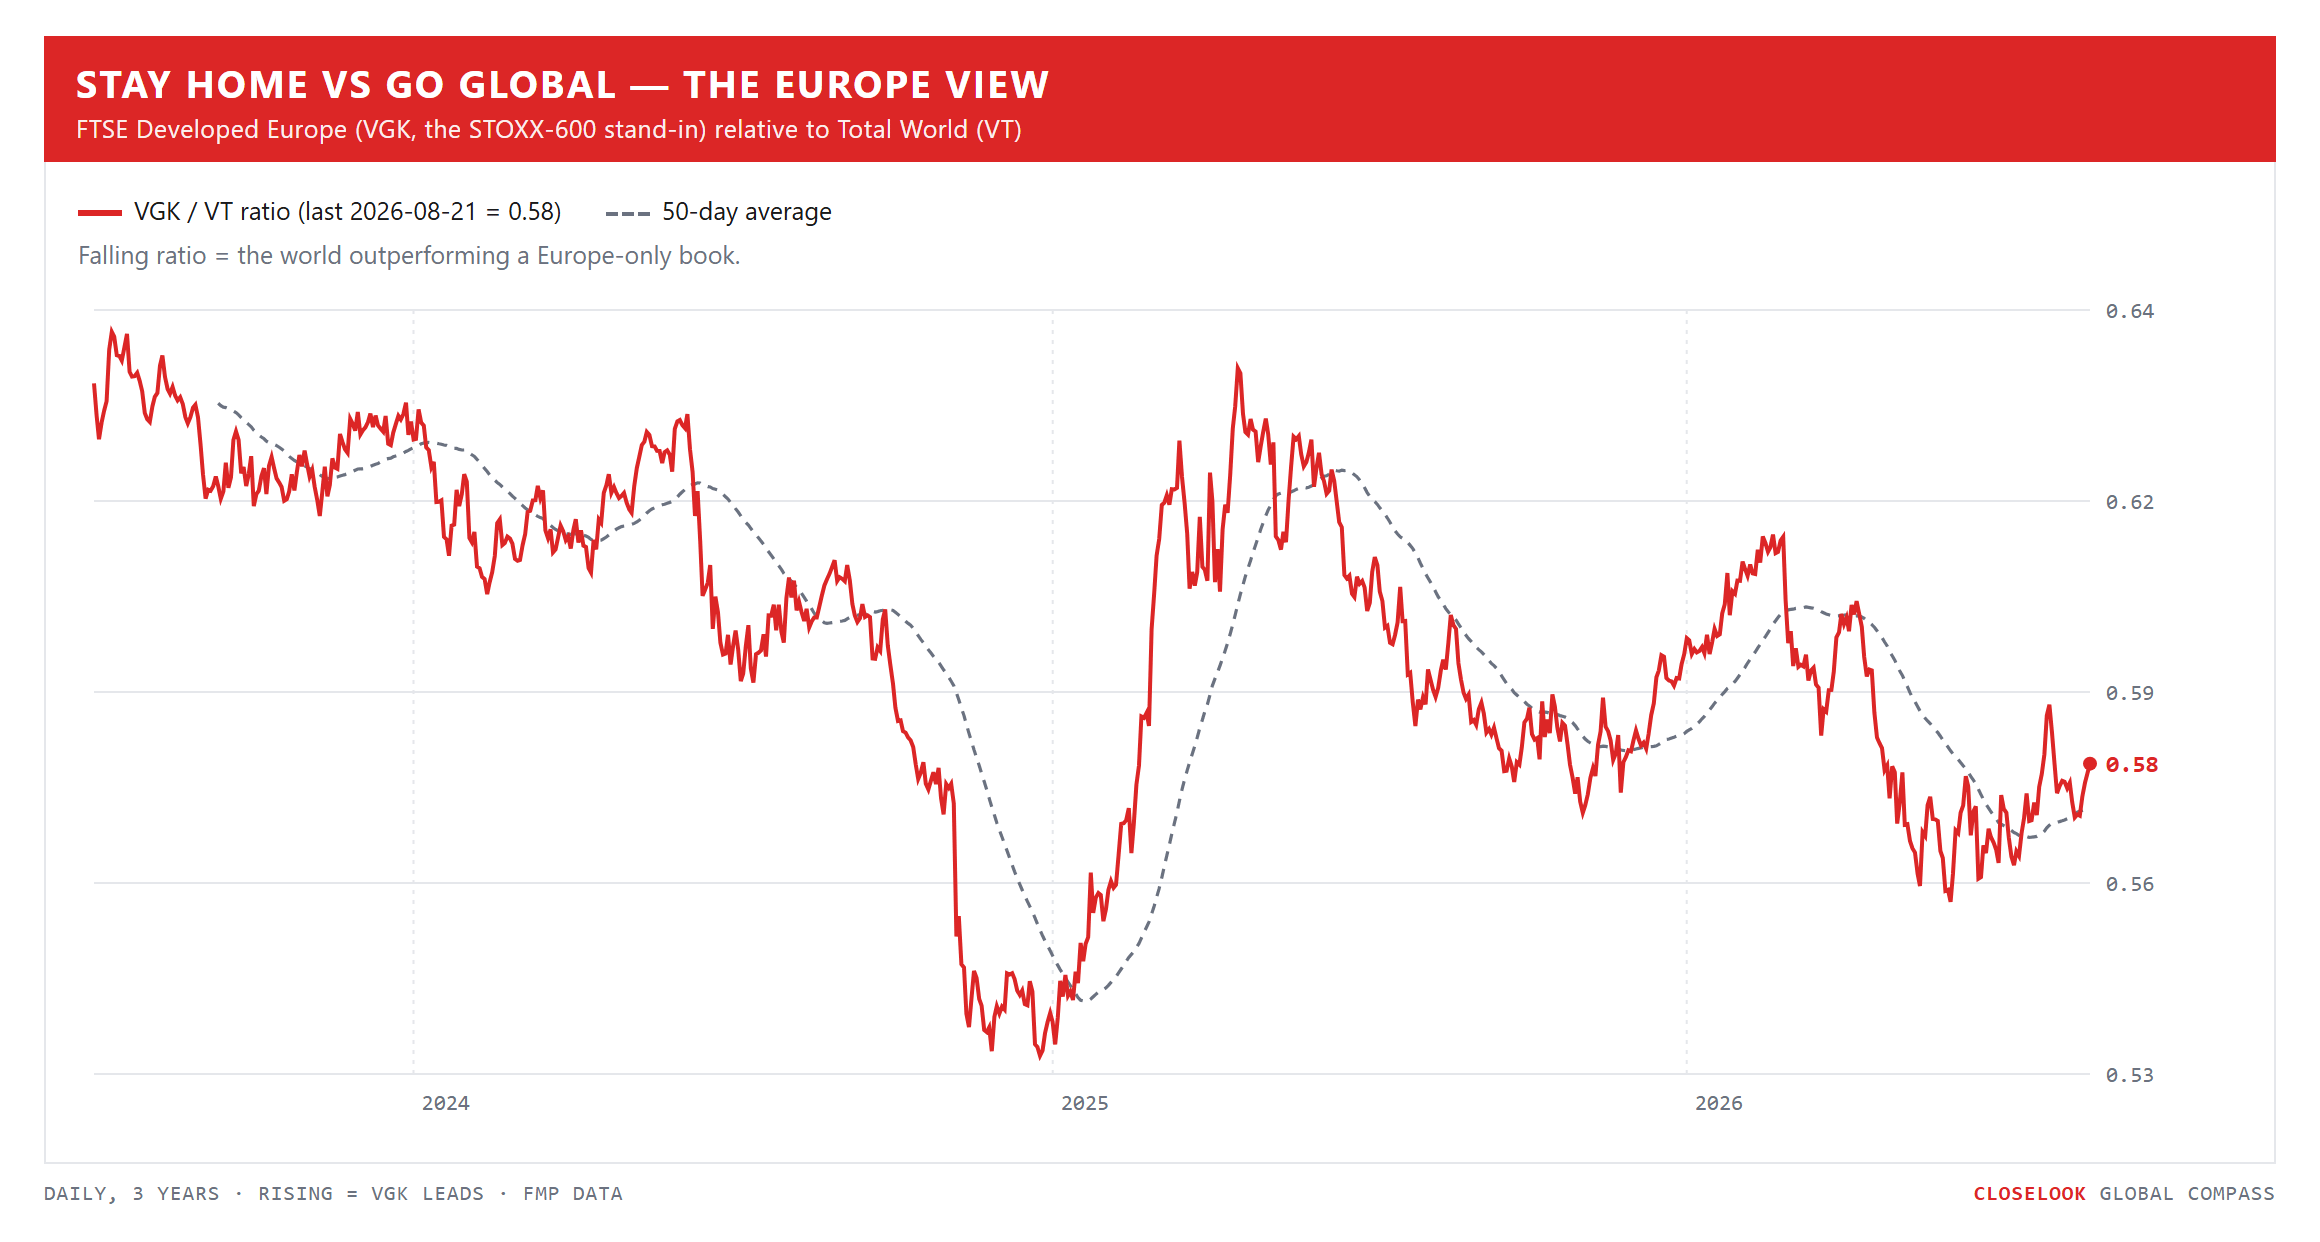
Stay home vs go global — the Europe view: the currency mask. The European fund closed 92.72, up 0.38%, a new 52-week closing high — in a week Paris fell 1.76%, Frankfurt 1.15%, Madrid 0.97% and the Euro Stoxx 50 1.18%, and Paris ran seven straight red sessions before Friday’s +0.37% reset. The currency-hedged wrapper — the same equities with the euro stripped out — lost 1.60%. The UK fund +1.41% to its own new high. A dollar-based holder of Europe never saw the week Europeans had; the euro absorbed it. Last week this letter’s standing view was that the bid is a position in a chain, not a continent. This week’s version: Europe’s dollar wrapper is bid because the euro is bid, not because the equities are. Read the hedged line next to the unhedged one before calling Europe strong.
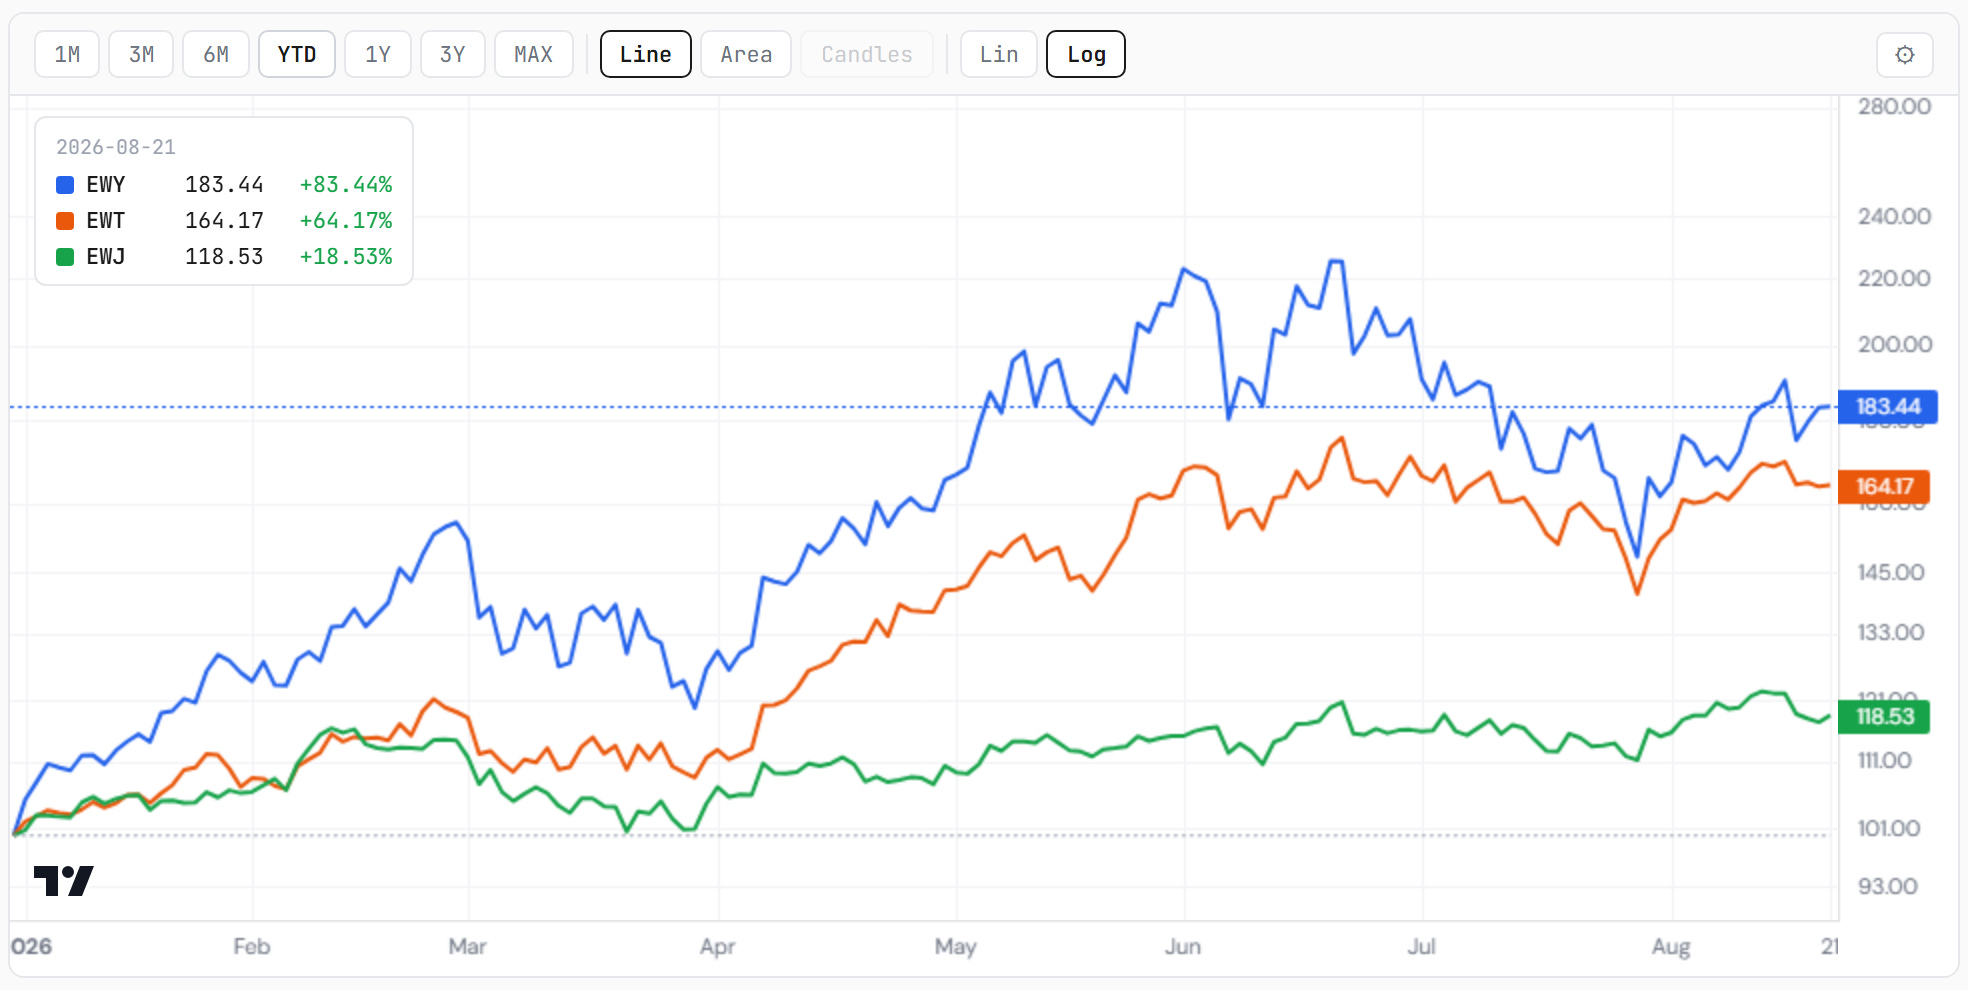
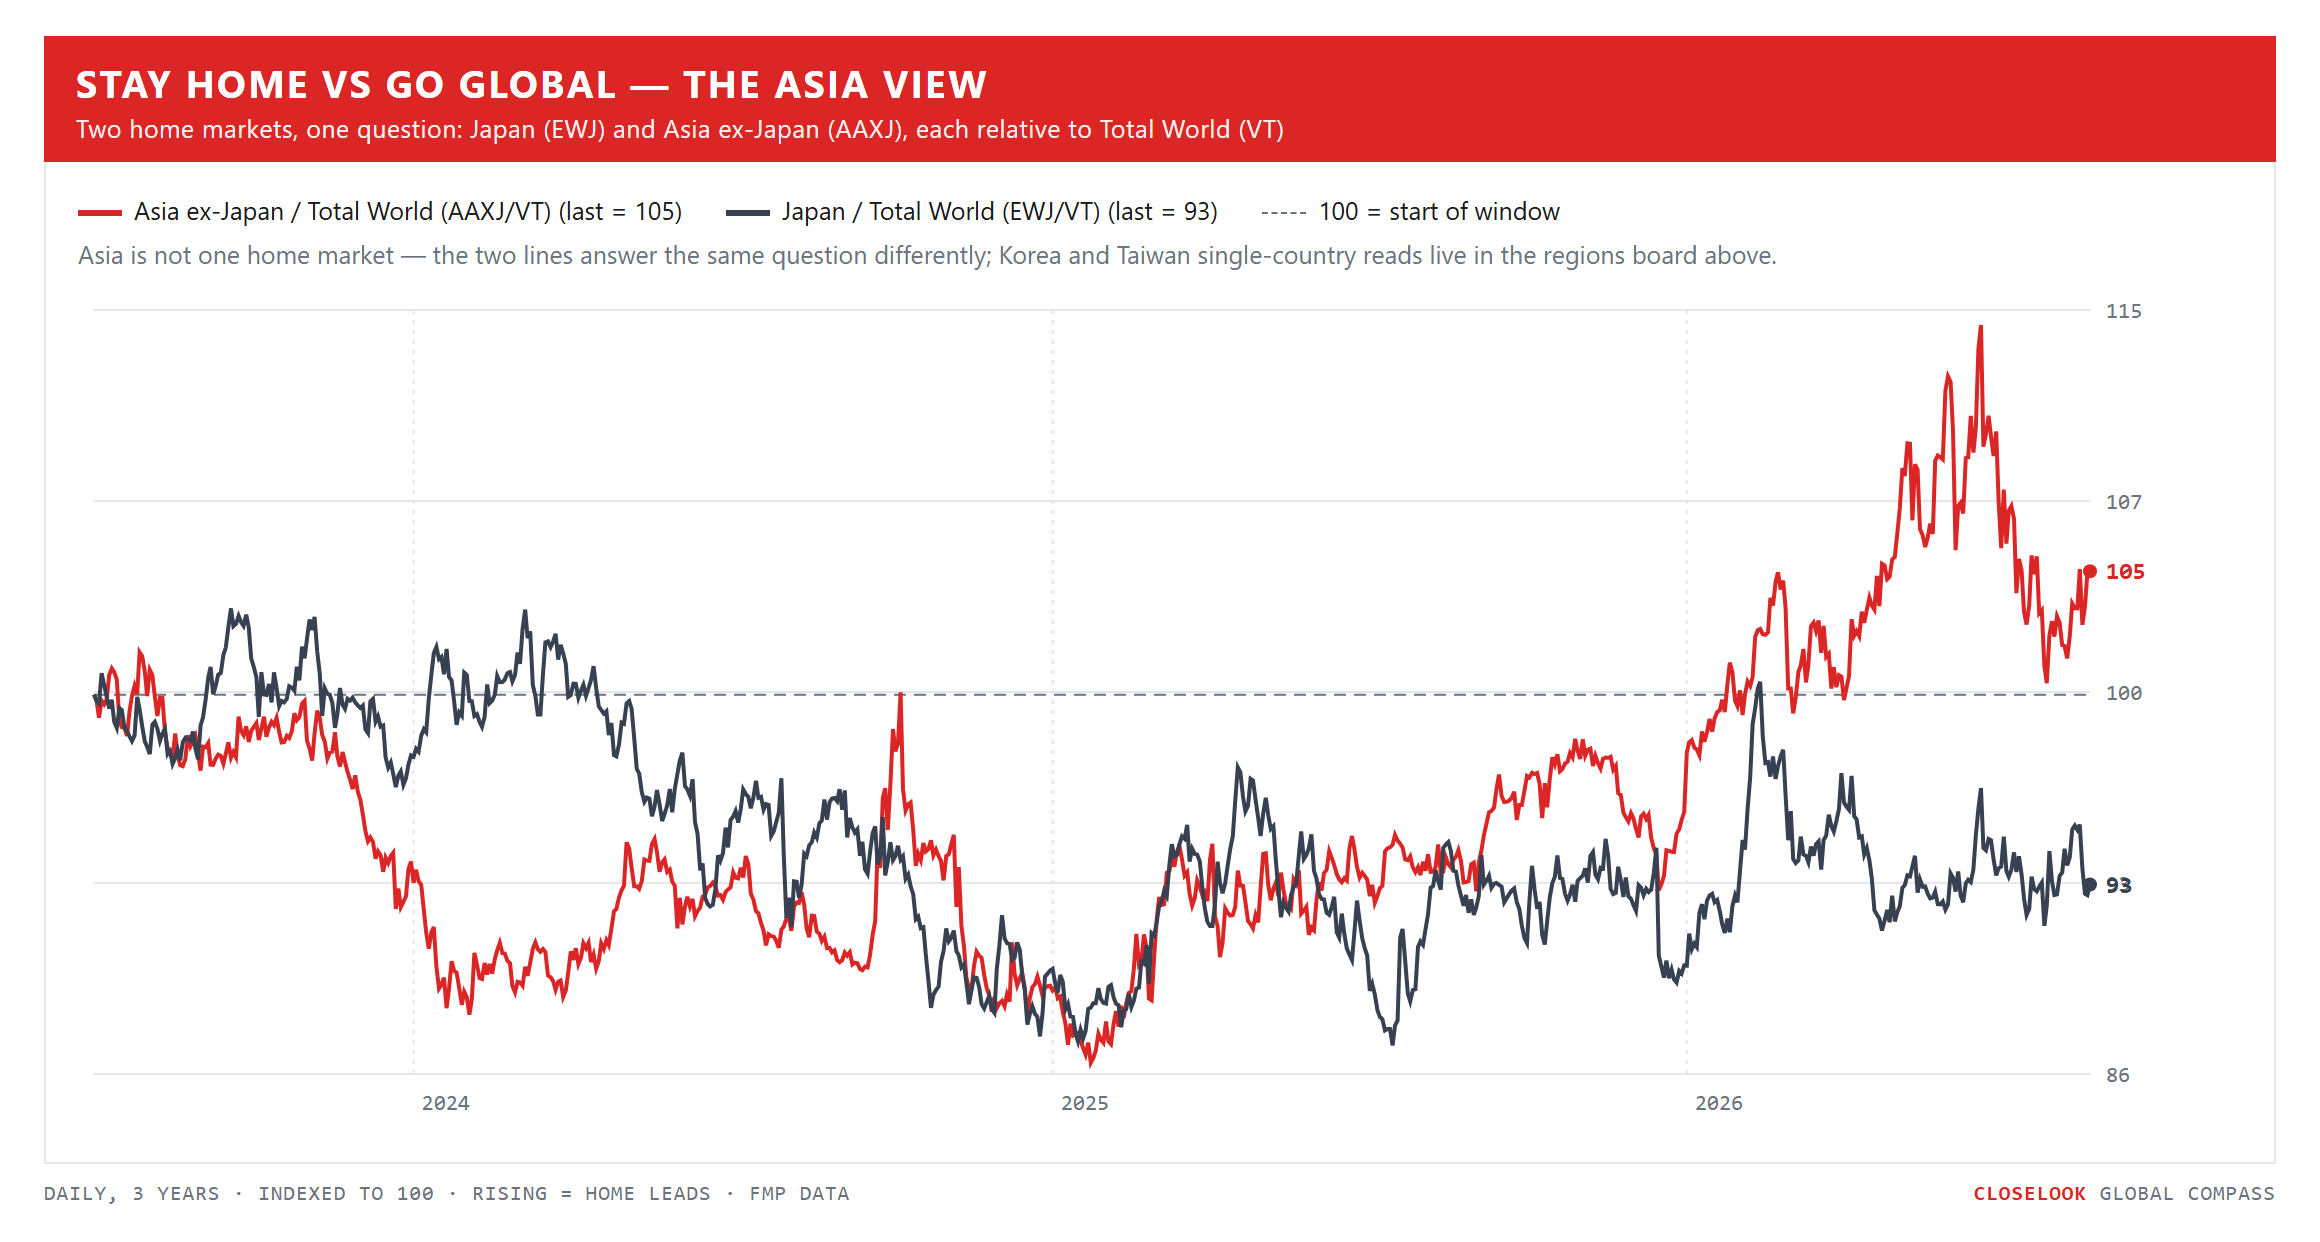
Stay home vs go global — the Asia view: the corridor rested, violently. Japan −3.09% (−3.93% in yen), Taiwan −2.59%, Korea −0.78% with an eight-percent down session inside it; China +2.78%, Hong Kong +4.29%. Last week’s question was whether July ended the re-rating or merely rested it, and this letter wrote that the week “voted rest — emphatically, and narrowly”. This week the rest arrived as a sidecar. The Korea fund sits 19% below its June high and the KOSPI 24% below its own; the July lows sit well below Tuesday’s 170. The question is unchanged. The air pocket inside it is new.
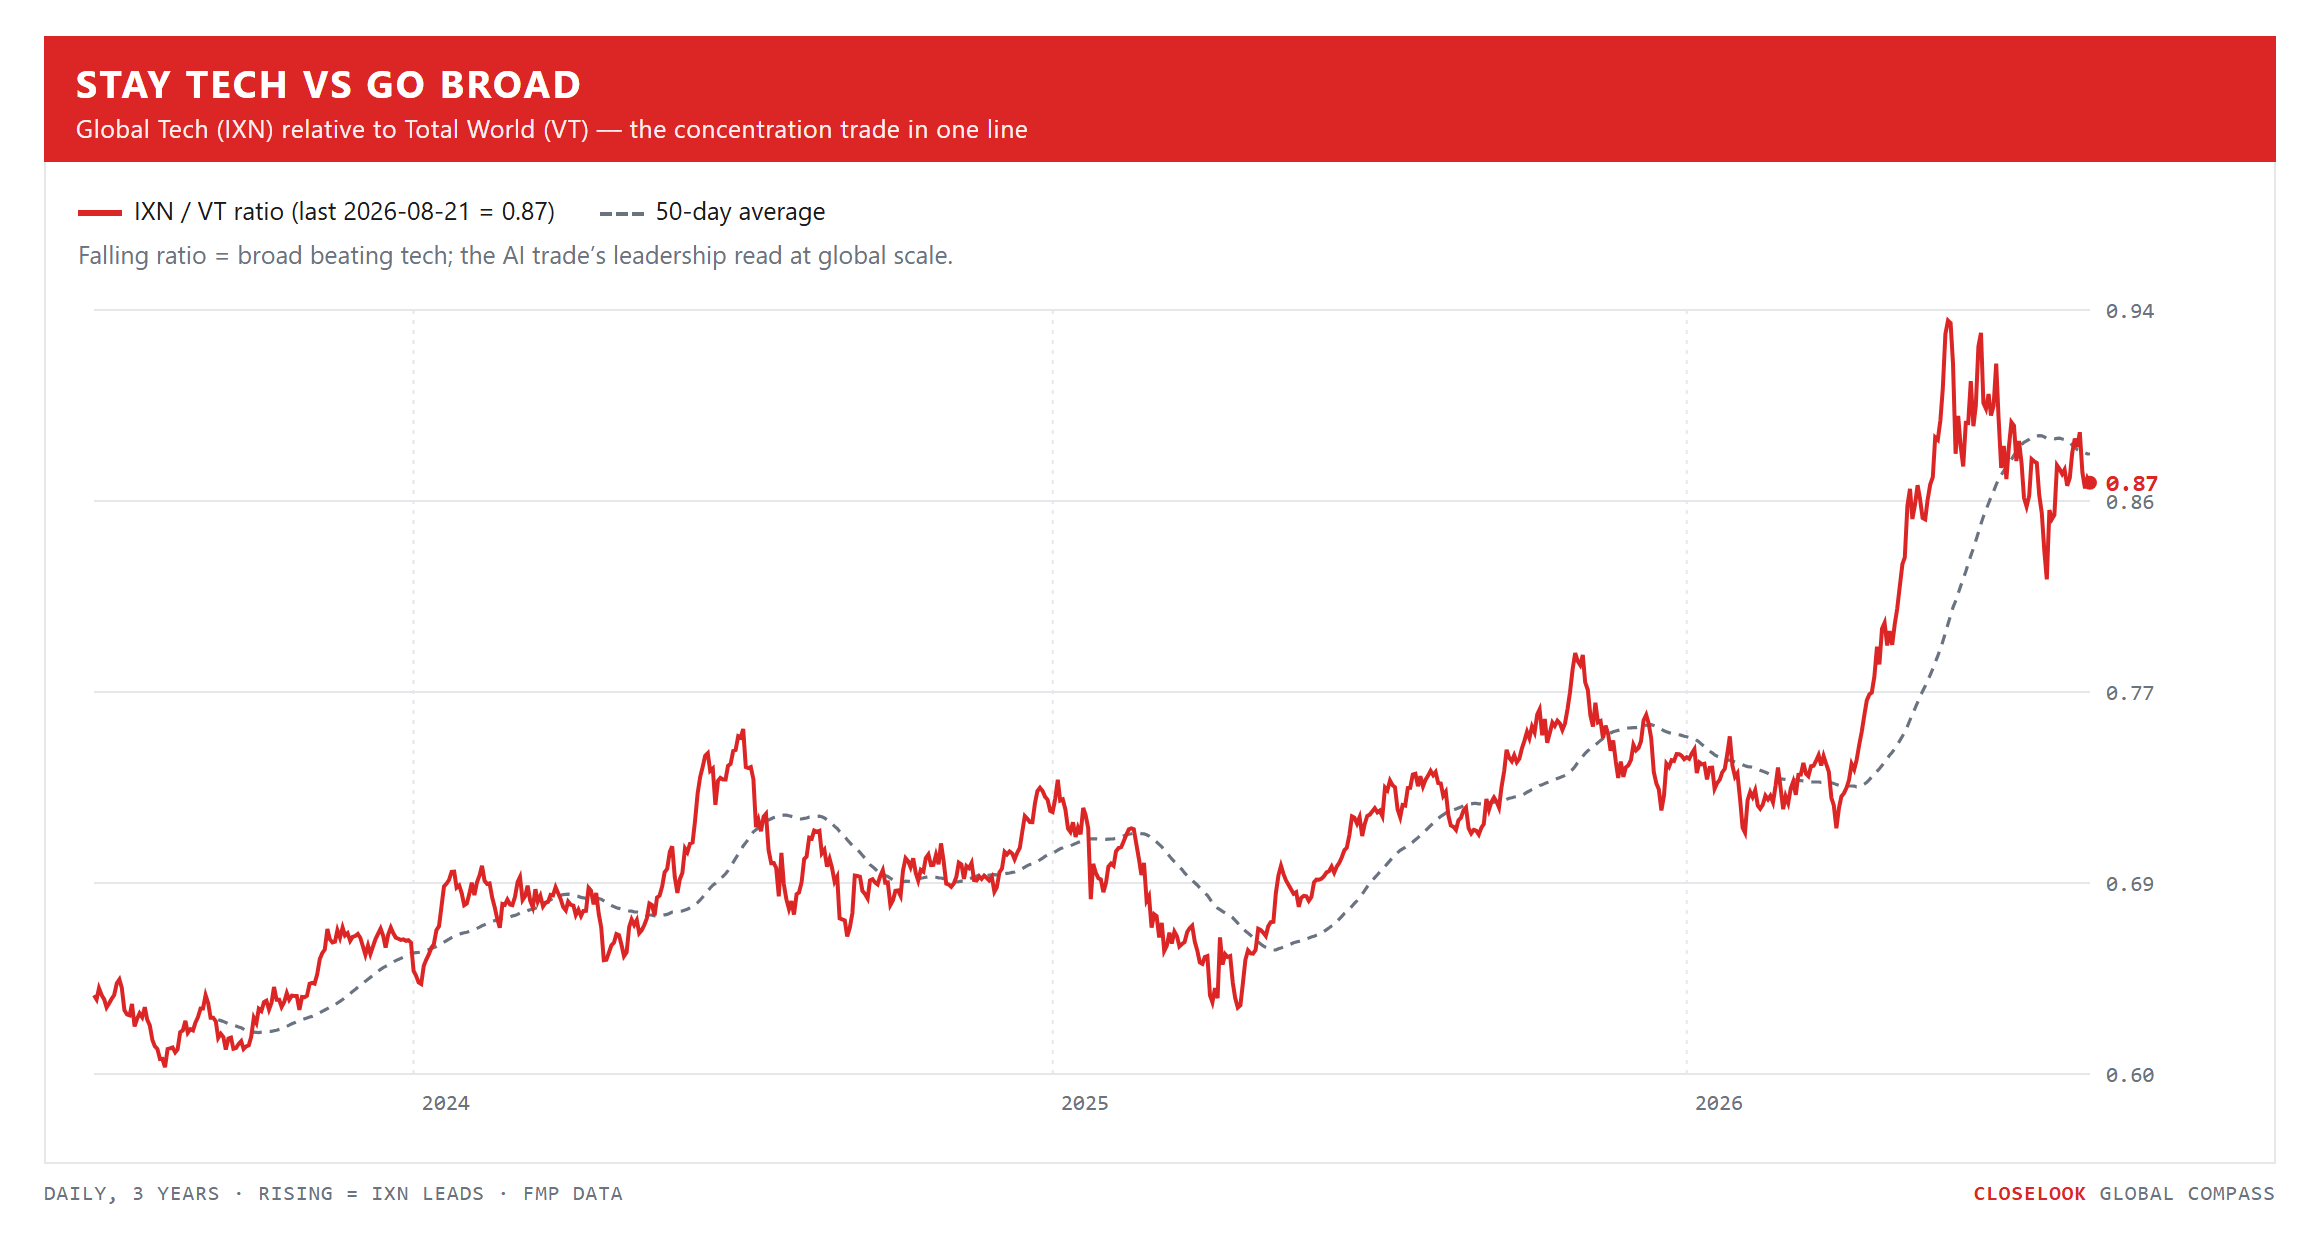
Stay tech vs go broad. Broad beat tech in both cuts this week: the Nasdaq 100 −2.41% against the S&P’s −1.37%, global tech −2.70% against the world’s −0.91%, technology the worst US sector, five green lines in twenty-one on the tech board. Last week was “broadening and leadership at once, with a hole where the largest names sit”. This week the hole widened and the leadership left.
Momentum vs defensive — the global cut, and the answer to last week’s test. Last Saturday international momentum sat a fifth of one percent under its June high and this letter wrote that it needed a close through to confirm. On Monday it closed 54.64 — through 54.35. By Friday it closed 53.95, −0.55% on the week, back below the old high. A breakout tested, taken, and failed inside five sessions. At the other end international min-vol +1.04% to 94.63 — a quarter of one percent under its February peak — and global min-vol closed at a new high, 127.21. So the defensive end made a high and the aggressive end failed one: the reverse of last week’s “both ends rising” barbell, and the same shape the US pair printed (Sunday’s letter owns that one). On the year momentum still leads min-vol, +12.5% against +9.7% — the regime is not over. The week went against it.
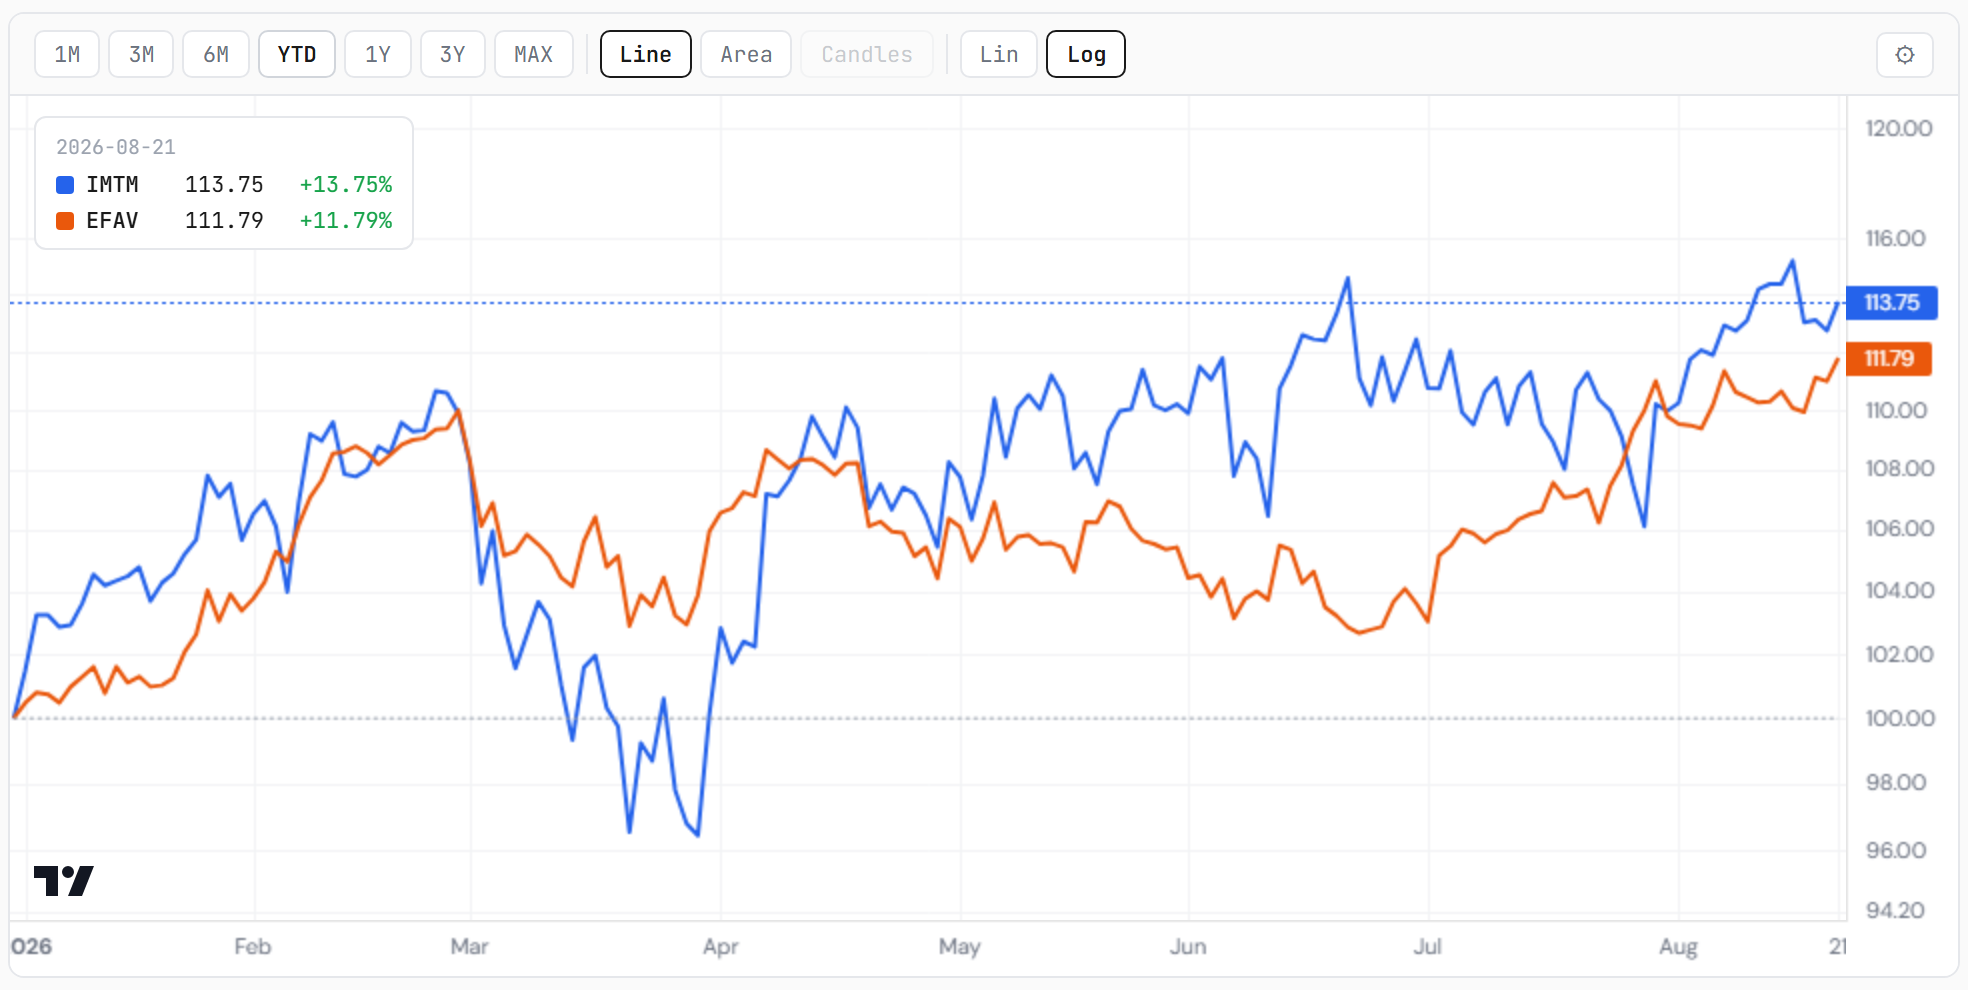
One more pair, still pointing the other way. EAFE value +0.32% against EAFE growth −0.83% on the week, and on the year value leads +15.2% against +10.3%. Last week outside America belonged to value and momentum at once; this week it belonged to value and min-vol. Value with momentum is a bull broadening; value with min-vol is a rotation toward what is cheap and quiet. One week does not make the second a regime. It does say which way the first one bends under pressure.
The Closelook letters — where this one sits. The house thesis, compressed: the stock market is a growing system at the aggregate level in which most constituents slowly fade while a small group massively outperforms — and that group changes dynamically; it never stays static. Own the aggregate, know the current winner group, watch for the rotation. Right now the winner group is the AI stack, and the live question is which of its layers — building, operating, using — earns the next leg. Three letters read that question at three altitudes: Closelook@Global Stock Markets (Saturdays) follows the geography of the money — regions, cross-asset, the core thesis owned through ETFs. Closelook@US Stock Markets (Sundays) reads the tape — the four-layer AI thesis at sector and index degree, the levels, the print records. Closelook@Hypergrowth (Sundays) reads the names — four growth buckets, the flow ledger, the tactical sleeve. Same market, top down. This is the map altitude.
2 · The State
The mechanism, named: a record that lasted a day. Last Saturday this letter called Thursday’s 85.71 “a level taken on paper and an open question in practice”, and set two marks to settle it: a weekly close above 85.74 to confirm, a close back under 85.23 to falsify. Monday answered the first — 85.85 at the close, 86.22 at the high, both records. Tuesday answered the second — 84.43, below the support. The week then spent three sessions inside a 1.8-point range and closed at 85.69: above the old record close, below the new one. A market that triggers both its confirmation and its falsifier in forty-eight hours and then declines to choose has not broken out and has not failed. It has postponed.
The hard-asset bid is the engine this week, and it has a mechanism. On Wednesday the Treasury doubled its long-end buybacks — from $2 billion to $4 billion per operation across the 10-to-30-year sectors, September 9 through November 4 — funded with bills. Yields fell on the announcement and reversed back up through it within a session: the 30-year was back at 5.23% by Thursday midday and 5.25% by Friday morning, the 10-year at 4.70%, and by Friday the Treasury Secretary was talking about larger buybacks and a fiscal plan. Gold went through 4,400 the same day and kept going — GLD +5.45% on the week, futures above 4,600 by Friday morning; the bitcoin fund +22.59%; copper miners +10.37%, silver +7.25%, oil +6.35%. Two assets that share nothing as instruments moved together on one reading: the entity that issues duration is retiring it, and will keep reaching for the tool. The Fed’s own minutes, released the same afternoon, leaned the other way — “many participants” saw scope for higher rates, and the July hold drew three dissents for a hike. A hard-asset bid priced the way an easing cycle is usually priced, against a central bank leaning hawkish, is the week’s central tension.
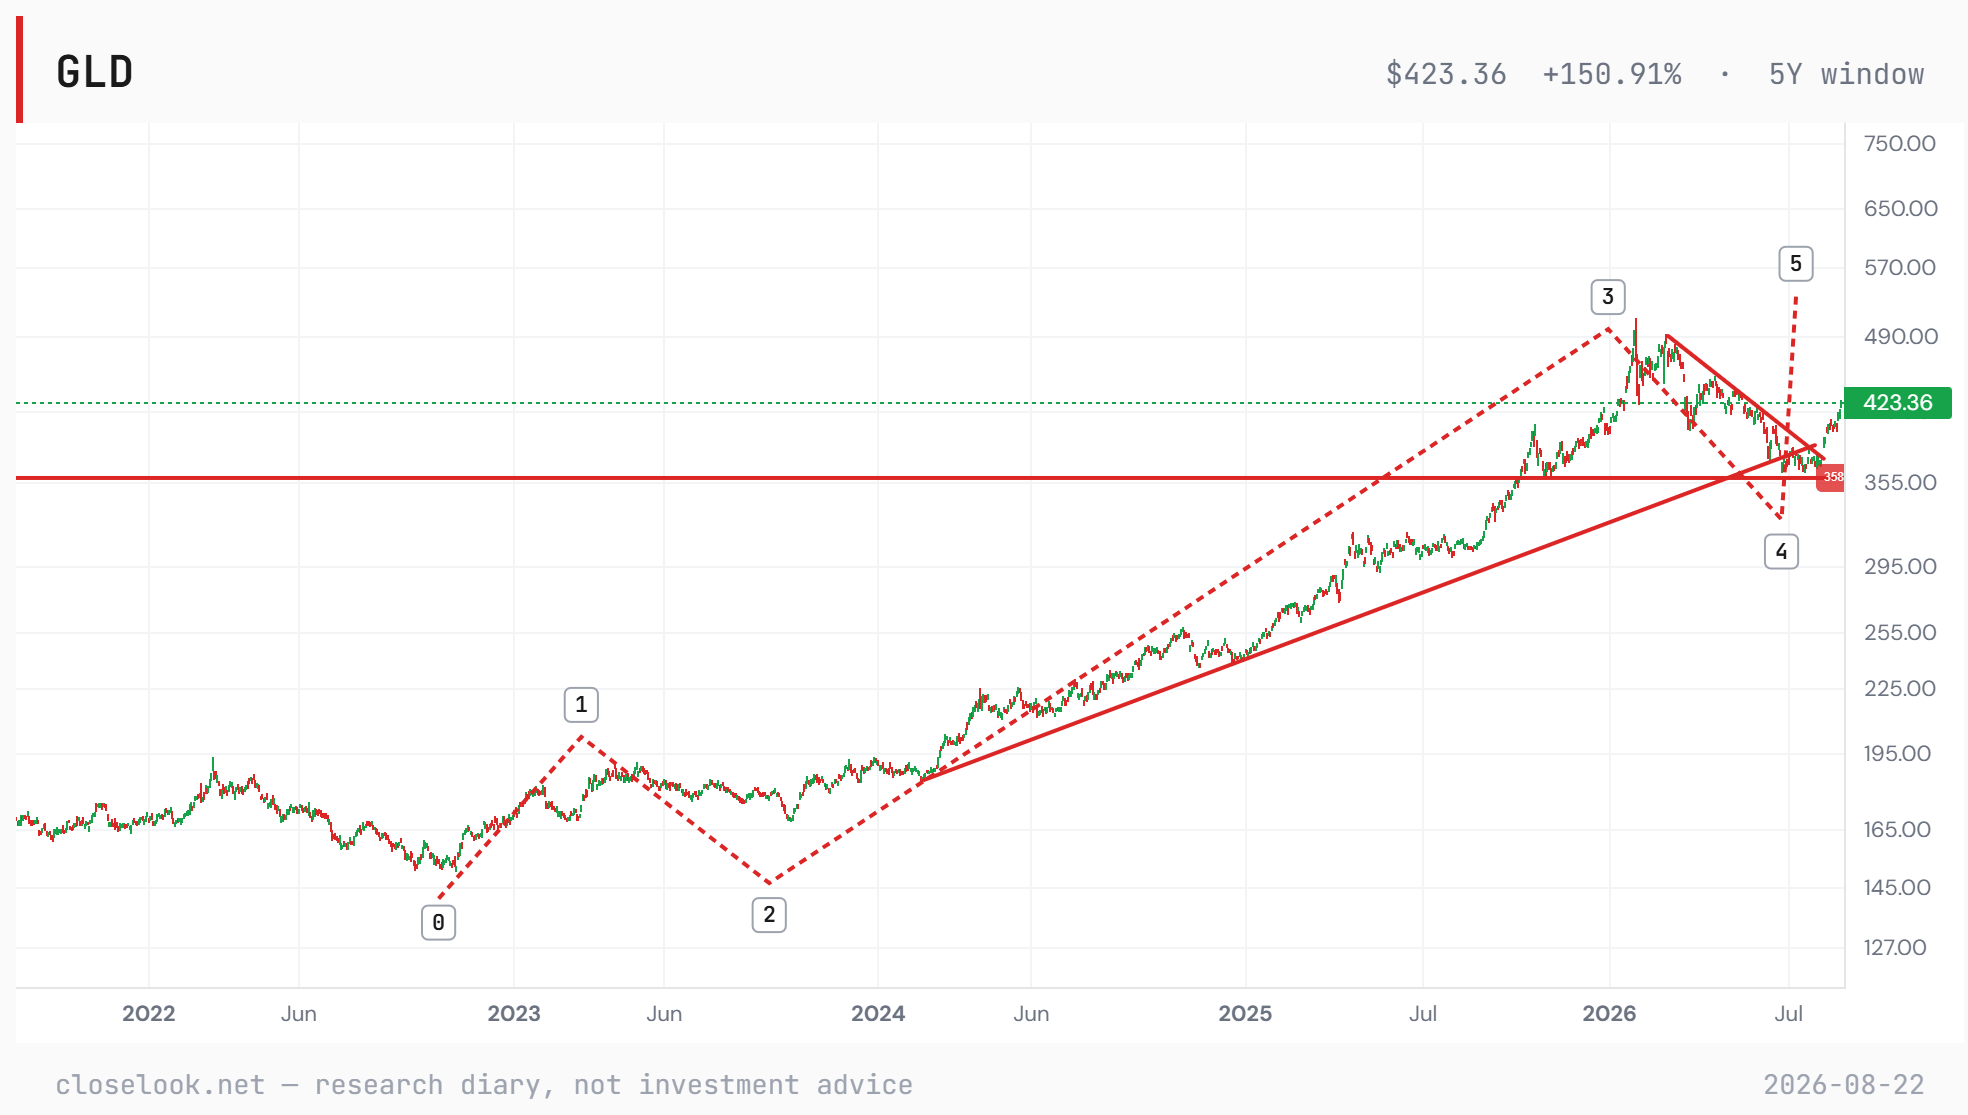
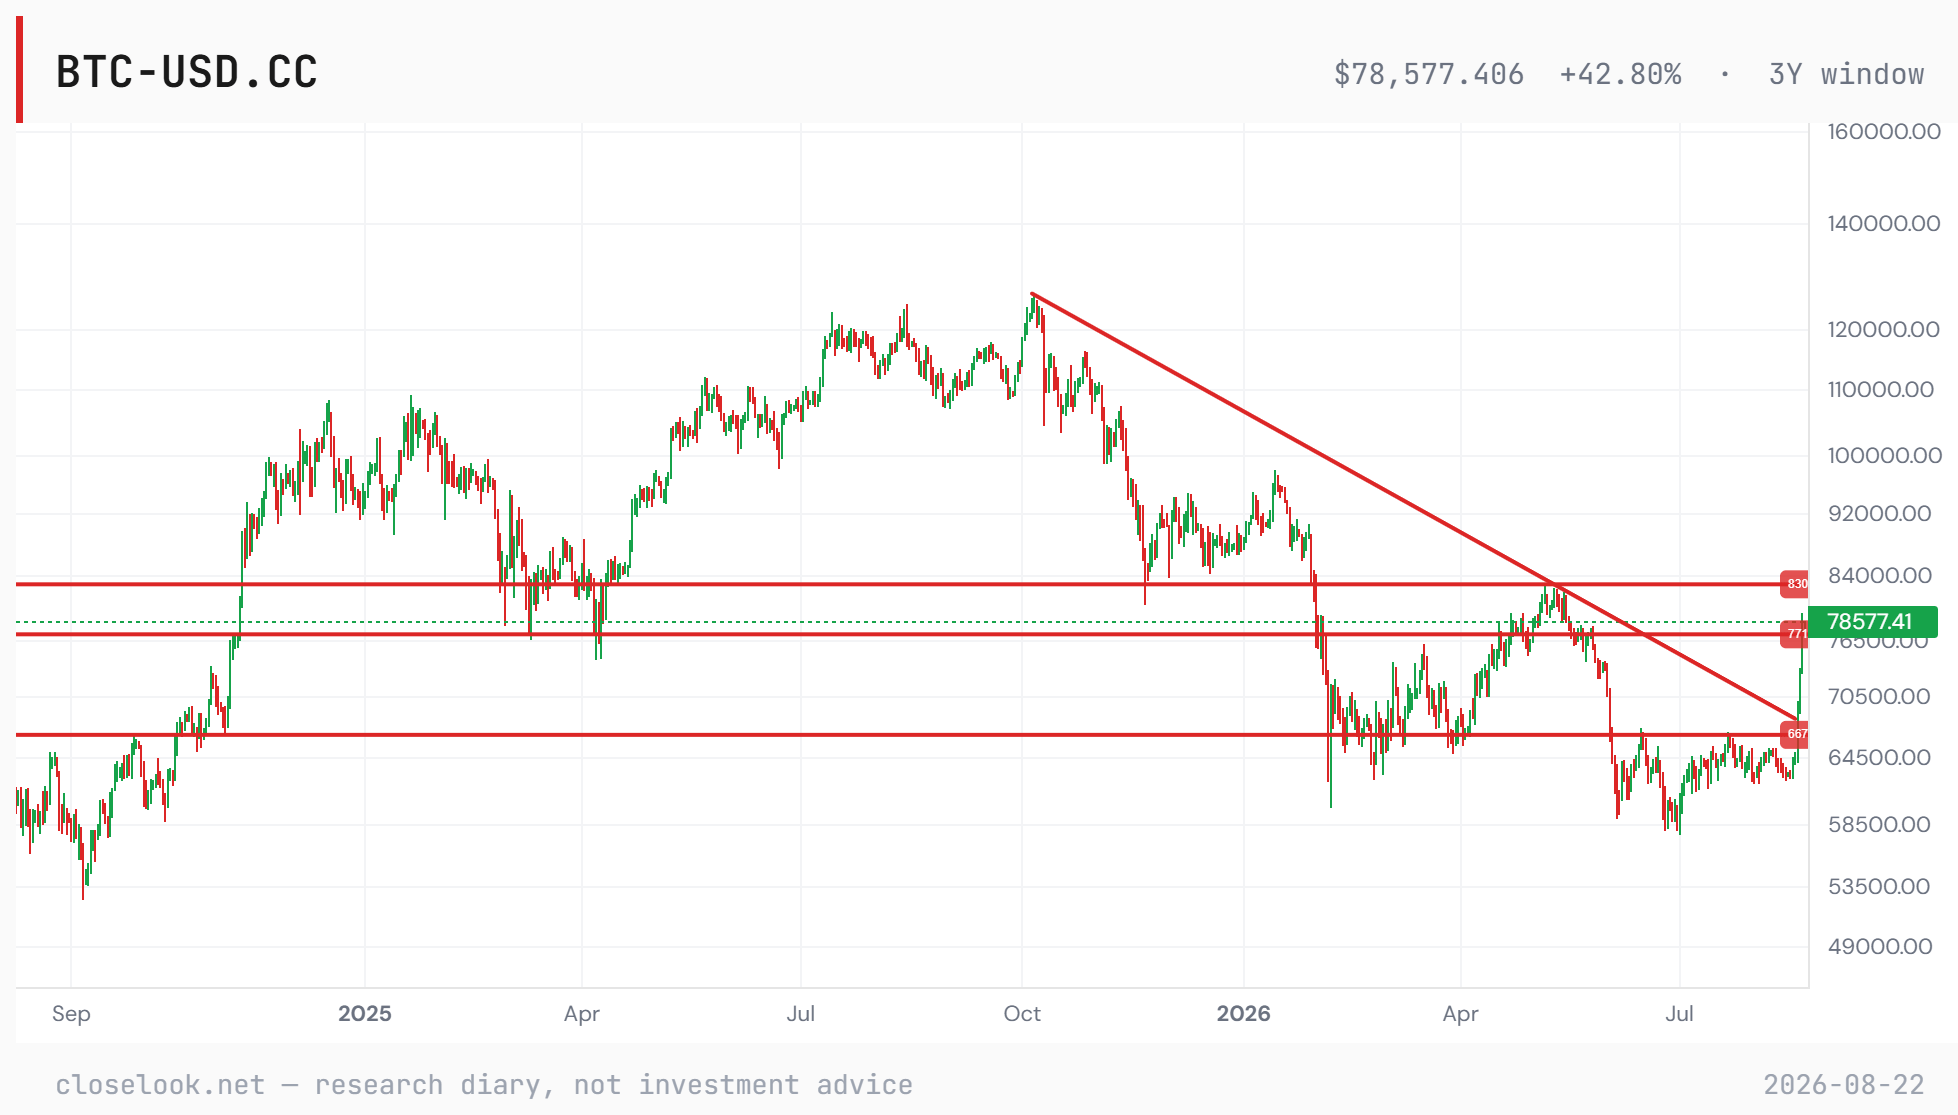
The two hard-asset charts, read the house way. Gold: the next wave up may be unfolding — the move through 4,400 on the buyback day and the follow-through to 4,600 is the shape an impulse takes out of a consolidation, and the falsifier the diary has held, a break below 4,400, is now below the market rather than above it. Bitcoin: the year-long down channel is broken, and the coin sits at the resistance zone between 77,000 and 83,000 that the diary has carried for weeks — Friday’s high of 79,464 is inside it, not through it. One hedge has cleared its line; the other is standing at it. Probability, not prophecy.
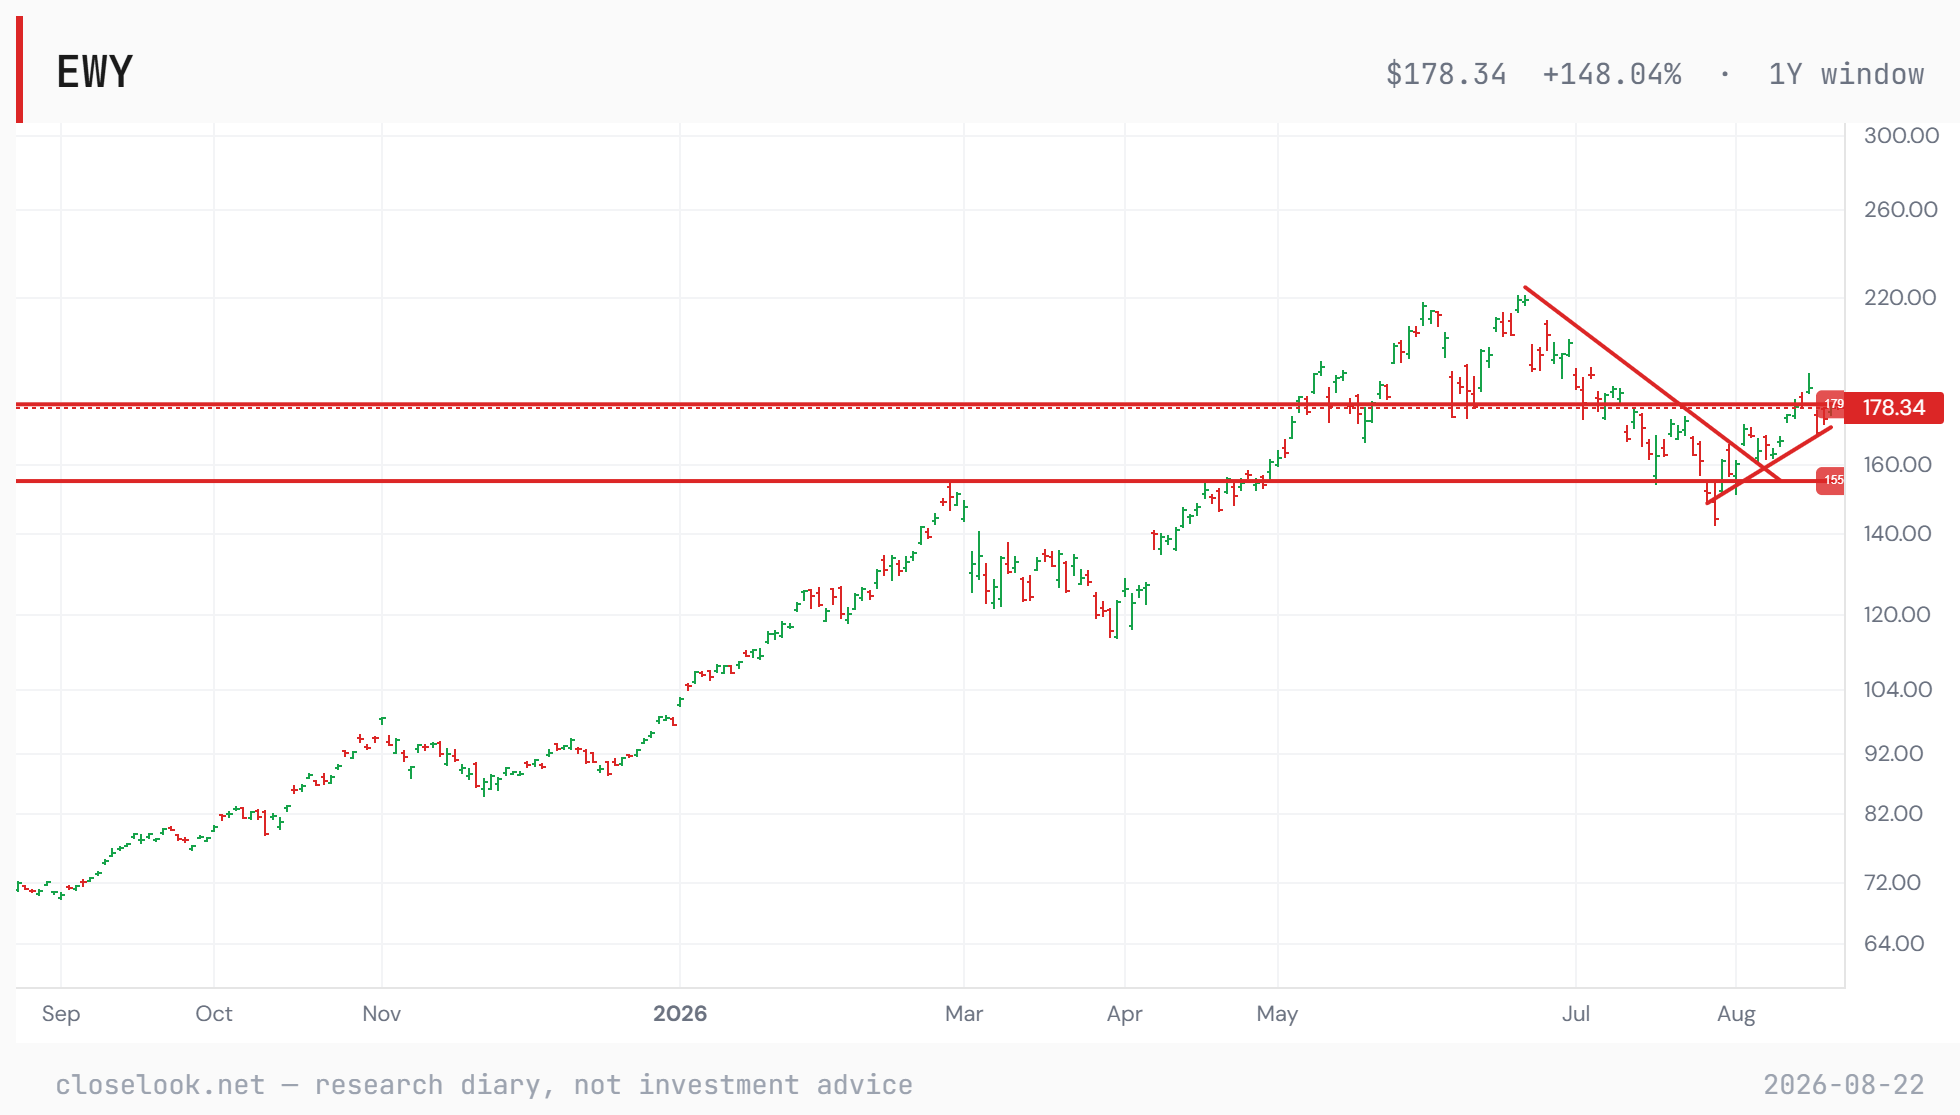
Seoul: the sidecar and the buyback. The Korea fund went through 180 on Monday, to 185.10 with a 190.11 high. On Wednesday in Seoul the KOSPI fell 5.8%, the exchange halted program selling, Samsung lost 7.8% and SK hynix 9.8%; the fund closed that US session at 170.05, eight percent lower. On Thursday the index rose 5.9% and SK hynix 12.7% on a 40-trillion-won buyback and cancellation — the same instrument the Treasury reached for the same night, at a different scale. Friday: 178.34, −0.78% on the week. Last week’s single most consequential level on the book was taken on Monday and lost by Tuesday, and the weekly close that confirms it did not arrive. “Whether a five-day vertical run takes a first rest” was last week’s question. It took one, in a session, at eight percent.
Europe, two machines. Thursday’s Pulse put it as the voting machine and the weighing machine, and the week’s finals kept the frame. The voting machine: Paris seven straight red sessions, Madrid seven, the Euro Stoxx 50 five, Frankfurt four; on the week the CAC −1.76%, the DAX −1.15%, the IBEX −0.97%, the Euro Stoxx −1.18%, the hedged wrapper −1.60%. The dollar wrapper +0.38% to a new high, because the euro was bid. The weighing machine: the long end. On the house’s new G7 sovereign board, France’s 10-year at 4.13% trades above Italy’s at 4.09% — the risk ranking that held for the whole post-crisis era, inverted without an announcement. The UK 30-year 5.81%, the US 30-year 5.275%, and Japan’s 30-year at 4.065% — the highest of the era, and the line that moved most on Friday. The board’s equal-weight 30-year sits at 4.659%, the 10s30s curve at 67 basis points; the pressure composite reads +0.42, long-end-led — term premium and fiscal supply, not rate expectations.
The ledger behind the ranking. Count the gold and the ranking stops looking strange. Italy carries about 135% of GDP gross and roughly 122% after deducting the Banca d’Italia’s 2,452 tonnes — recently worth near €285 billion; France about 113% gross and 104.7% on its own published net measure, which does not consolidate the central bank’s nearly identical 2,437 tonnes; Japan 233% gross and about 133% net on the IMF’s ledger, with roughly 88% of it held at home and the foreign share of long JGBs nearer 6%. Every leg higher in gold mechanically strengthens the net position of the gold-holding sovereigns — which is one reason the gold bull and the France-over-Italy print are on the same page this week, and why France occupies the board more than Italy does.
Both quiet tells, again — and one of them broke. IEF reclaimed 93.17 on Wednesday on the buyback, closed 93.38, and gave it back: 92.82 on Friday, a second consecutive failed weekly reclaim. Dollar-yen, which had refused 159.5 for four straight weeks, broke it on Tuesday — 159.63 at the close, 159.77 at the high — and reversed: 158.18 on Wednesday, 158.91 on Friday, eight pips above the 158.83 line the house set mid-week as the first falsifier. A break that cannot hold a day is a different kind of tell from a refusal: the level is no longer a ceiling, but the far side of it was not a floor either.
The macro print. Walmart beat on revenue and earnings on Thursday, raised its sales and operating-income outlook, guided full-year earnings under the street, printed US comparable sales of 2.6% against the 3.5% expected — and fell 9.15%. Sunday’s letter owns that print and what it says about the consumer. Its geography belongs here: the same barrel that has the energy sector +42% on the year is the force draining the shopper Walmart just reported on. Oil +6.35% on the week, Brent up five straight sessions into Wednesday, the Middle East wires doing the work.
Hold both halves. The world index postponed its decision; the hard assets made theirs. The bond market dissented a second week; the yen broke and came back. Europe rose in one currency and fell in another.
The structural read — Korea’s chart, one week on. Last week: a clean breakout, consolidation above the broken channel line, a completed double bottom, a sharp run to major resistance at 180. This week the chart added a candle that matters: through 180 on Monday to 185, a 190 high, then an eight-percent session back to 170, then a recovery to 178. The structure is not broken — Tuesday’s low sits well above the 30 July low, and the fund ended the week a quarter of a point under the line rather than far beneath it. But “the chart has earned the benefit of the doubt; it has not yet been given the confirmation” is now true with an air pocket inside it. A weekly close above 180 is still the confirmation. A close under 170.05 would say the sidecar was the top of the run, not the rest in it.
3 · The Outlook
The three-index read — the lightest layer rose, the heavy layers bled. We read the three together because they are three stages of one spend: capex (Rubin Build-Out, what gets built), opex (Agentic Ecosystem, what it costs to run), applications (Agentic Winners, what gets sold on top).
Applications +2.66% on the week, −4.6% on the year. Opex −6.46% and +58.4%. Capex −7.27% and +90.5%. Last week the middle stage led at +7.5%; this week it lost 6.5%, the buildout lost 7.3%, and the only index that rose is the one that sells on top of both. Money came out of building and running this week and stayed in selling — which is the direction the whole thesis says the money eventually travels, arriving in the least flattering way.
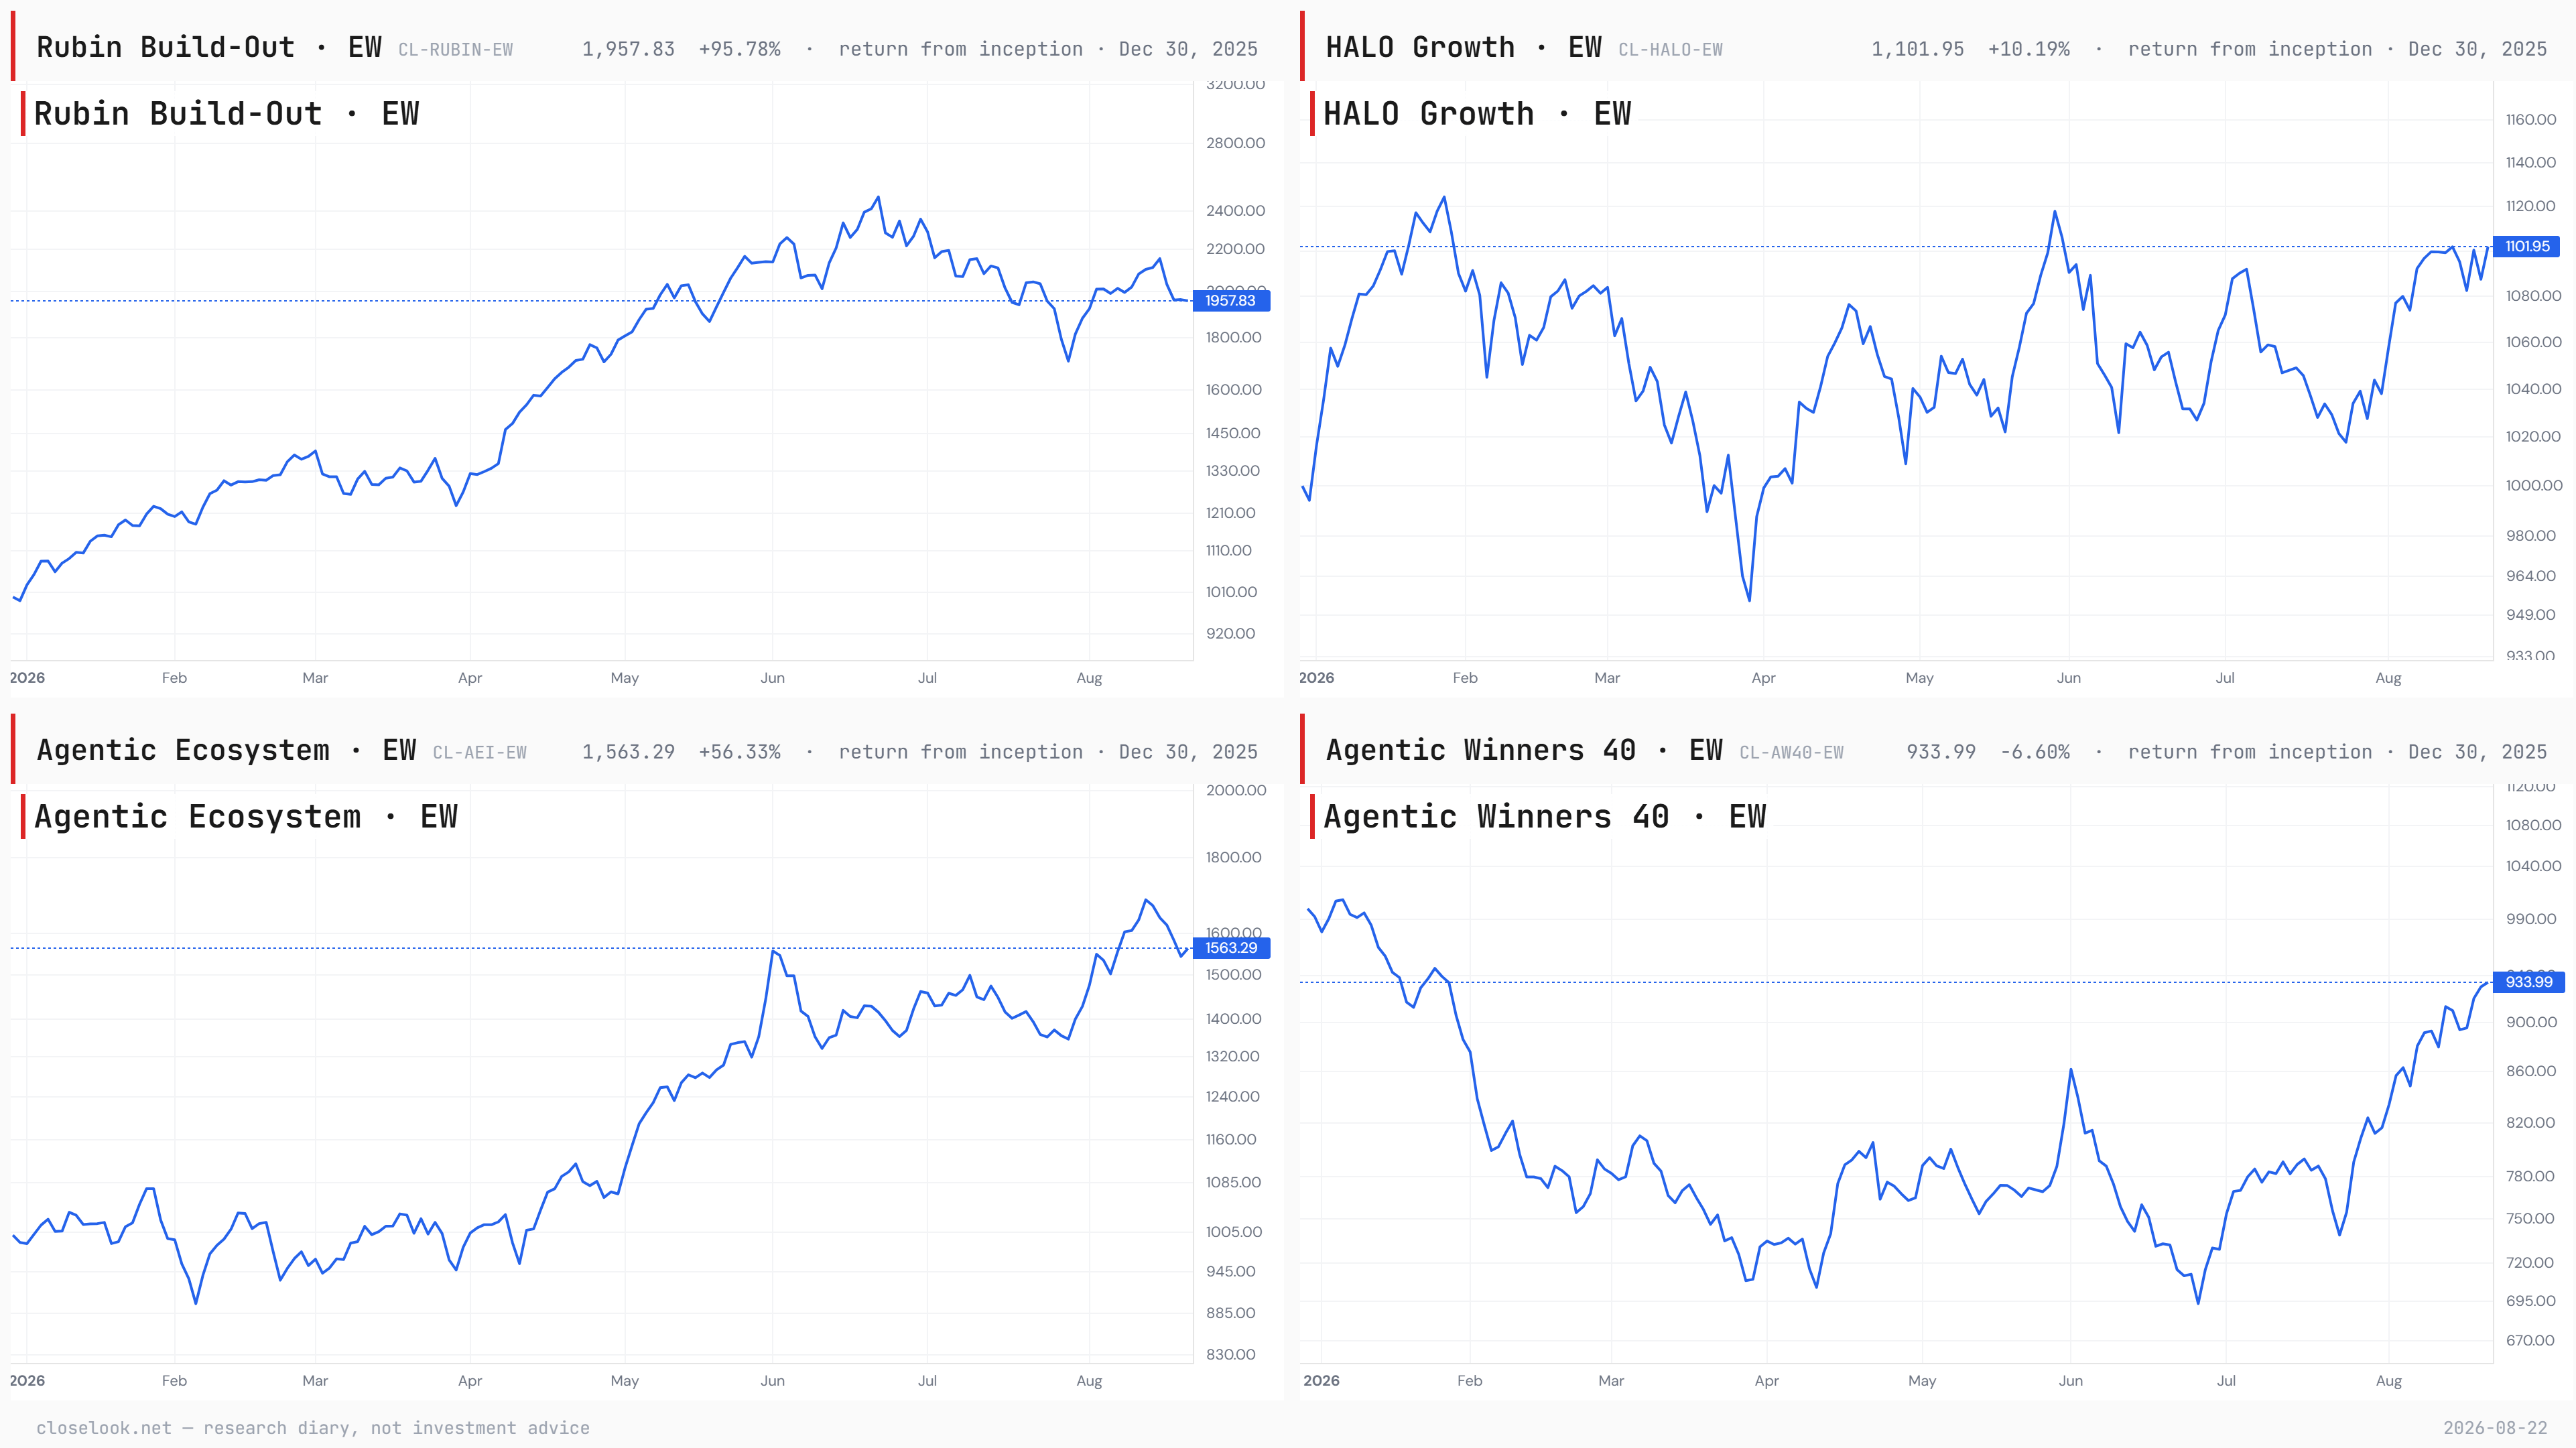
Read the three windows together, because the disagreement is the signal. On the year capex leads and it is not close: +90.5% against opex’s +58.4% and applications’ −4.6%. On the month the order inverts further than last week — applications +26.4%, opex +14.3%, capex −3.8% — the buildout is now negative over a month. On the week the order is the month’s order. Steady relative strength in the application layer across every short window; a dominant year and a fading quarter in the buildout; the operating layer in between, and this week closer to the buildout than to the applications.
The correction lows, re-measured. Capex and opex both bottomed on 29 July and are now +14.7% and +15.2% off those lows — a week ago they were +23.6% and +23.1%; more than a third of the recovery came out in five sessions. Applications bottomed on 23 July and is +26.4% off its low, from +31.2% — the smallest give-back of the three, in the index that refused the others’ later low. The pattern from the spring — the index that bottoms first goes on to lead — keeps its candidate. Probability, not prophecy.
The structural line moved against the tilt — half of it. Last week: opex and applications had both cleared their summer highs, capex sat 13.7% below its June peak. This week capex is 21.0% below that peak; opex is 7.3% below a high it set last Thursday, the 13th; applications is 7.4% below its January high and still above the summer one. The tilt this letter announced toward the two lighter layers got the applications half right this week and the opex half wrong: the layer it tilted away from fell 7.3%, the layer it tilted toward fell 6.5%, the lightest rose. The tape has not overturned the argument. It has taken back a third of the advance that confirmed it.
Inside capex: memory held, the fab floor did not. One sub-index green of twenty-four: HBM Memory +3.78%, +178% on the year — what Korea exports, at the top of the table again in the week Korea crashed, with SK hynix’s buyback underneath it. Storage −4.16% after last week’s +21%. The bottom is the fab floor: wafer processing −11.25%, testing and metrology −10.66%, foundry −10.35%, fab subsystems −9.88%. US constituents −8.61%, Japan −6.05%, Europe −7.14% — no region hid.
Inside opex: the names that made 2026 led the way down. Foundation Models −11.02% against +753% on the year — last week they “did nothing in the week their infrastructure was bought”; this week they were the worst line. Substrate −9.29%, edge −9.22%, compute operators −9.19%, runtime −8.25%. The best was operations and observability at −3.70%, then data and memory −3.88%. Europe’s constituents −11.09%.
Inside applications: buying what it sold, selling what it owned — again. Application Leaders +6.05%, Enterprise +4.11%, Control Plane +2.81% — the three that are most negative on the year led the week. Megacap Gateway −2.47%, the only sub-index positive for 2026 at +6.9%, red for a second week. The applications layer spent a second week rotating out of its one winner into its four losers.
The control group. HALO — our growth index carrying no AI thesis — closed the week flat, +0.01%. Against capex −7.3% and opex −6.5%, that settles what kind of week this was: an AI unwind, not a growth unwind — the mirror image of last week’s “an AI bid, not a growth bid”. Inside it longevity and healthspan +5.53%, circular economy +3.61%, better food +3.02%, nuclear +2.80%; space and satellite −8.02%, autonomous defense and drones −7.01% after being last week’s best, energy transition −6.41%. The regime gauge. The Money Temperature instrument board sits at 53, two points warmer than a week ago, still the middle of its range and still labelled transition. Equities fell and the gauge warmed; the hard-asset bid is risk appetite by another name, and the board read it as such.
