


Salve, cari subscripti!
Thank you for reading this week's edition of Closelook@US Stock Markets, dated November 17, 2024 👋. The next edition will be published on November 24, 2024.
A Closelook At This Edition
This Week's Action: The Fading Trump Rally
US Economy: Another Fed Pivot
US Stock Market Seasonality: Riding the Bull in November, December, and January
Long-Term Analysis: Bitcoin, Ethereum and Solana
This Week's Spotlight: My Favorite Crypto Stocks
Knowledge Corner: The Coin50 Index
The Derivatives Portfolios: More Transactions
Final Words: Asset Watch Update
(1) This Week's Action: The Fading Trump Rally
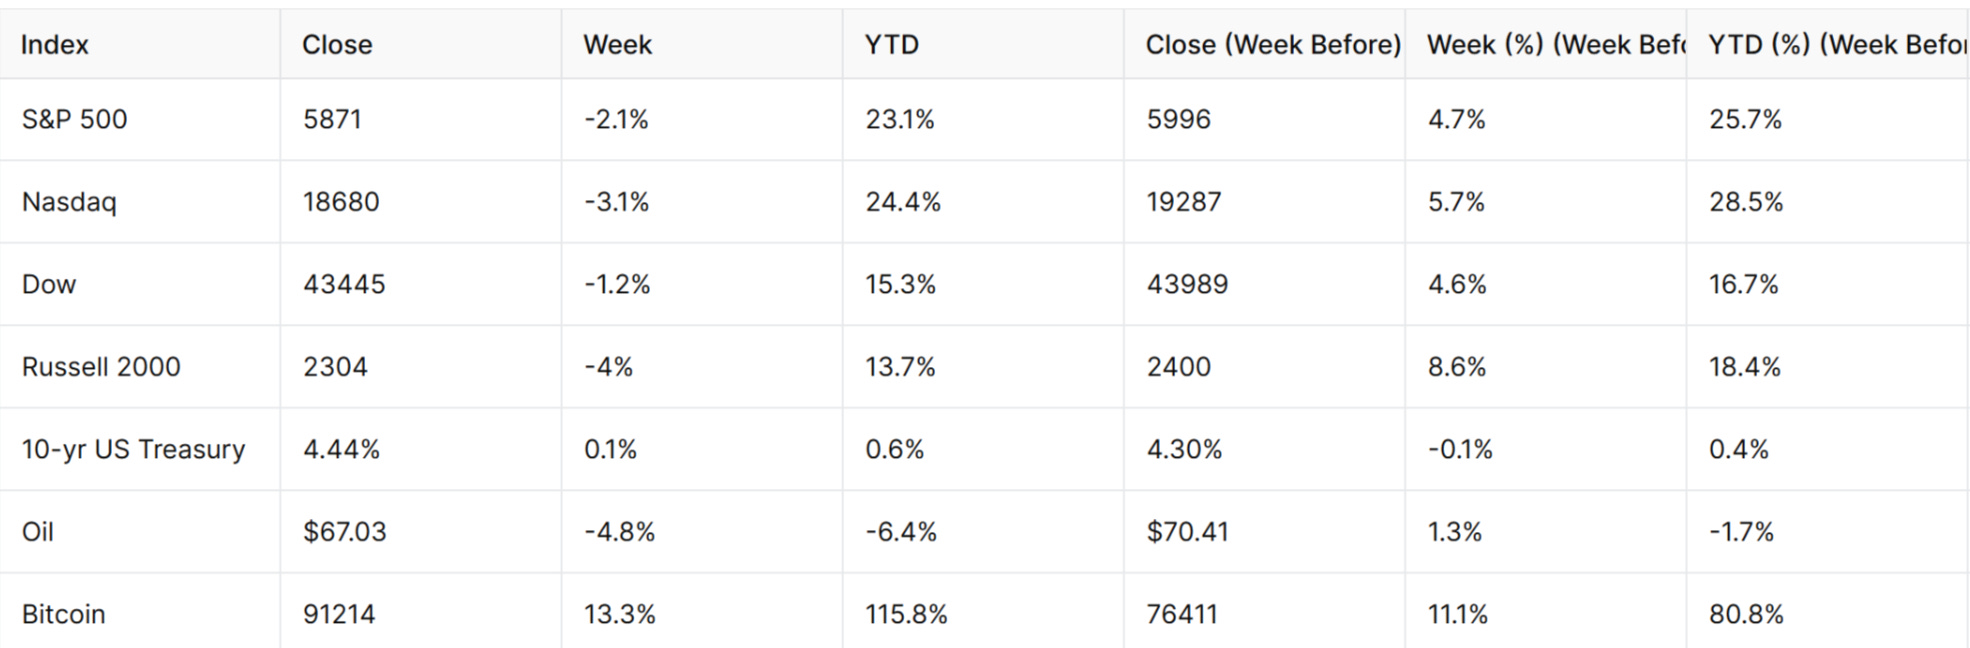
Last week was the opposite of the week before. The weekly performance of all US stock markets was miserable.
Weekly Performance Summary
S&P 500
Close: 5,871
Weekly Change: -2.1%
Year-to-Date (YTD) Change: 23.1%
Nasdaq
Close: 18,680
Weekly Change: -3.1%
YTD Change: 24.4%
Dow
Close: 43,445
Weekly Change: -1.2%
YTD Change: 15.3%
Russell 2000
Close: 2,304
Weekly Change: -4%
YTD Change: 13.7%
10-yr US Treasury
Close: 4.44%
Weekly Change: 0.1%
YTD Change: 0.6%
Oil
Close: $67.03
Weekly Change: -4.8%
YTD Change: -6.4%
Bitcoin
Close: 91,214
Weekly Change: 13.3%
YTD Change: 115.8%
The R2K index was the worst-performing index, losing four percent. The Nasdaq lost about three percent. Losses for the SP 500 and the DJIA were more modest.
Selling pressure increased when Chair Powell indicated that the Fed was in no hurry to lower rates. Options expiration on Friday added to the increased volatility.

The bullish channel of the SP 500 is still intact. The same is true for the Nasdaq 100 index.

While the Nasdaq 100 did make a new high during the Trump election week, the Nasdaq 100 Tech index did not.
The same applies to the various semiconductor indices. These non-confirmations are bearish signs.

The R2K touched the ATHs seen in 2021 and gave back part of the gains. It may try again during the seasonally strongest 3-month calendar year period - November, December, and January.

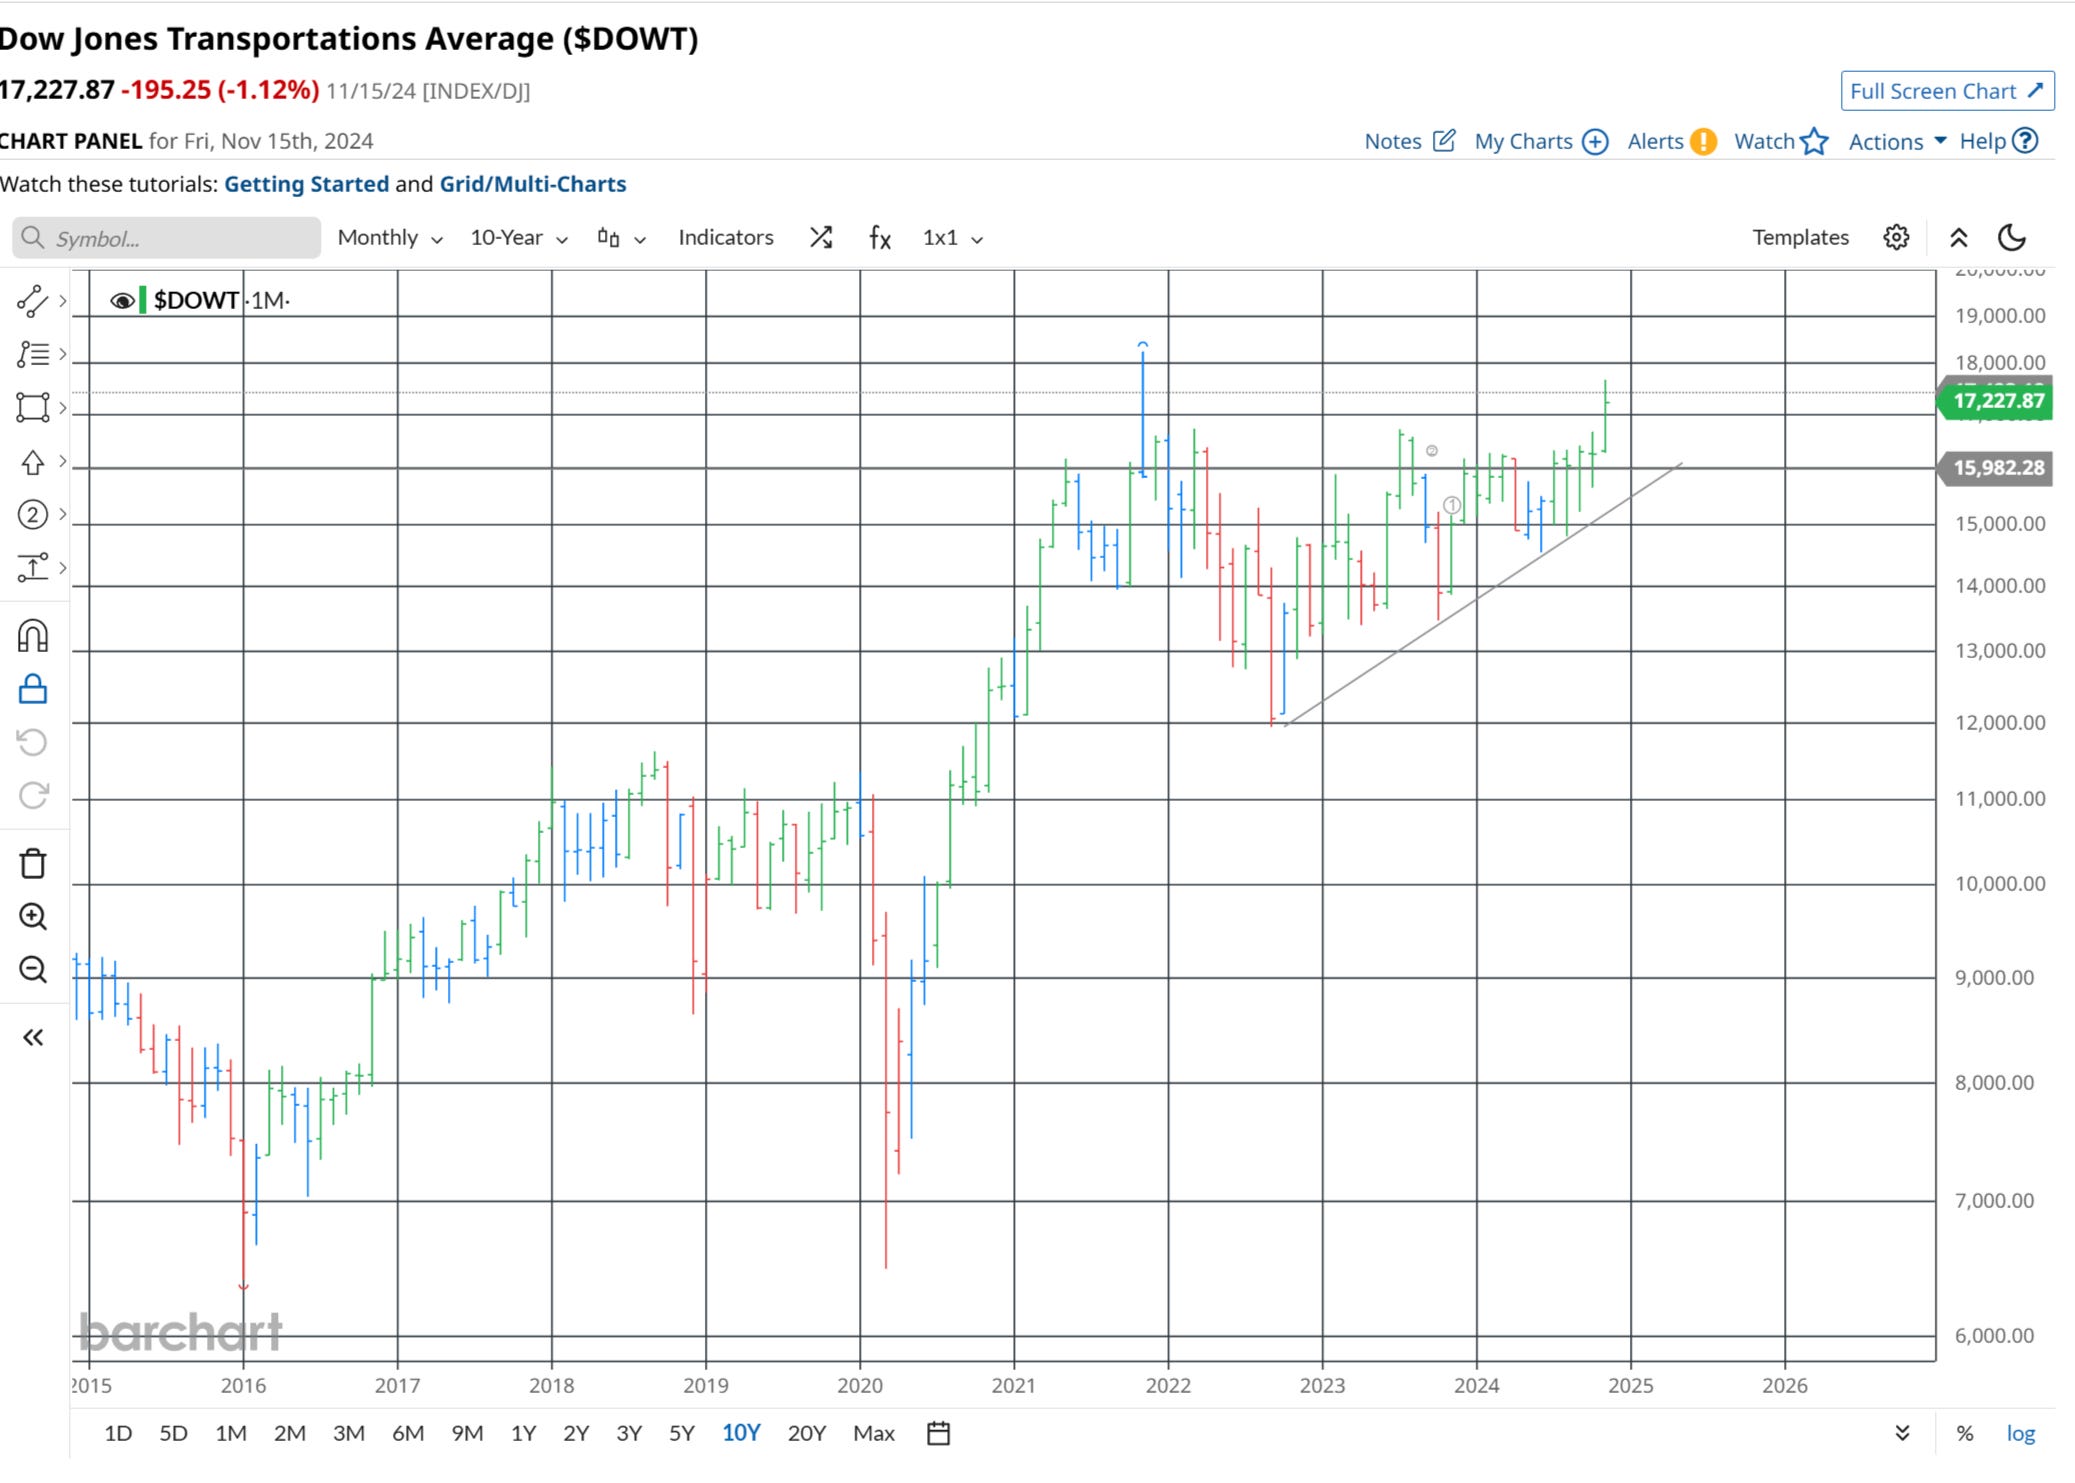
The Dow Jones Industrial Average also made a new high, which the Dow Jones Transportation Index did not confirm.

If not confirmed quickly, this would be quite a bearish divergence, which may signal a more than short-term top.
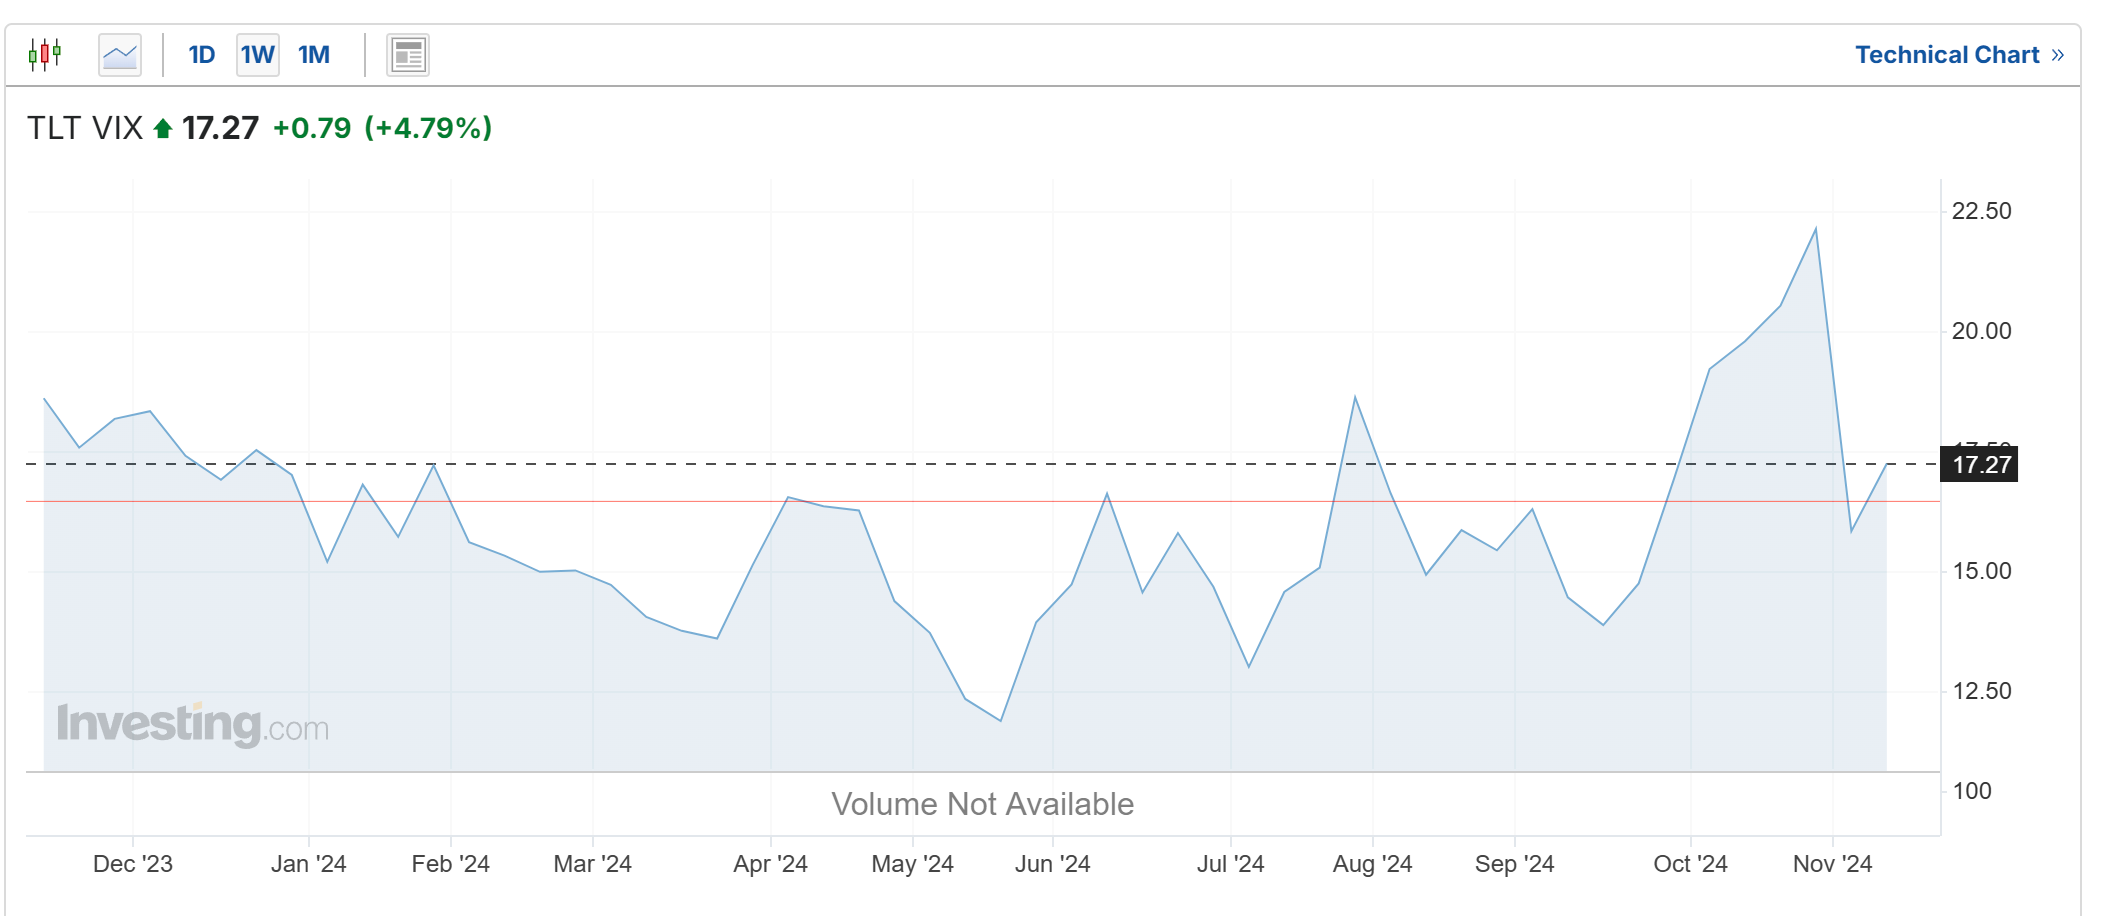
Equity volatility stayed at normal levels. I expect the VIX to mostly trade between 10 and 20 until the end of the year.

Bond yields increased in the week but stayed inside the 4.25 - 4.50 % yield range. The TLT ETF closed around 90 USD.

Bond volatility moved up. I expect bond volatility to stay elevated for the time being.
I also expect bond vigilantes to stage another attempt to move the bond yield firmly above 4.50 % in the weeks ahead. Last week’s statement stays valid.
US presidents come and go, but this election may matter more than other ones. Why? Because there will be structural credit and deficit troubles ahead in the US, and how they are addressed will significantly impact whether we will have mediocre stock market returns in the next 10 years (the Goldman Sachs view) or (close to) double-digit annual returns (Ed Yardeni’s roaring 20s concept).
I anticipated a top in the TLT based on better-than-expected economic indicators rather than the beginning of another debt crisis like the one that occurred from August to October 2023.
I firmly believe that when the bond markets start to worry deeply about the federal deficit and debt and bond vigilantes push them south, moving prices of the TLT ETF to the bottom or even below its multi-month trading range, the stock market bull will end abruptly.

Like in 2016, gold fell on the Trump victory news. The uptrend in pace since early 2024 was broken.

Silver exhibited similar price action and also moved lower. The trend in place since early 2024 has not yet been violated.
(2) US Economy: Another Fed Pivot
Federal Reserve Chair Jerome Powell is not known for his dancing skills, but he has once again demonstrated his ability to adjust monetary policy with precision.
In his prepared remarks for a speech to business leaders in Dallas on Friday, Powell stated that "the economy is not sending any signals that we need to be in a hurry to lower rates."
This stance aligns with the Fed's recent actions, which began on September 18 when they reduced the federal funds rate (FFR) by 50 basis points, a move that some considered too aggressive at the time.
The Fed continued this trend on November 7, cutting the FFR by another 25 basis points. However, Powell is now cautioning against expectations of immediate further rate cuts.
Last Thursday, during his press conference, he indicated that the FFR was still somewhat restrictive and needed to be adjusted to the neutral rate. While many Fed officials may agree with this assessment, they seem less urgent about making these adjustments.
This could mean that there might not be another rate cut at the upcoming Federal Open Market Committee (FOMC) meeting on December 17-18.
The latest analysis from Ed Yardeni's "Nirvana Model" suggests that the unemployment and inflation rates indicate the current FFR is already at or near the neutral rate.
In the meantime, there are expectations of a potential "Santa Claus rally" in the S&P 500, which could push the index to 6100 by the end of the year.
Ed Yardeni's "Nirvana Scenario"
Ed Yardeni's "Nirvana Scenario" or "Nirvana Model" is a conceptual framework that describes an ideal economic state where several favorable conditions converge. Here are the key elements of this scenario:
Low Inflation
The model predicts a slowdown in inflation, a critical component for economic stability. This slowdown is expected to occur without the economy entering a recession, a scenario often seen as a trade-off in economic policy.
Economic Growth
The Nirvana Scenario involves continued economic growth. This growth is sustained without high inflation pressures, creating a balanced economic environment.
Moderate Interest Rates
The model implies that interest rates, particularly risk-free rates like those on 10-year Treasury notes, remain at levels that support economic growth without fueling inflation. This balance is crucial for maintaining investor confidence and stable financial markets.
Low Unemployment
A vital feature of the Nirvana Scenario is low unemployment rates. This condition is bullish for the stock market, as it indicates a strong labor market and overall economic health, provided it is not accompanied by rising inflation.
Investor Optimism
Yardeni's Nirvana Scenario suggests a period of investor optimism, where the combination of low inflation, economic growth, and stable interest rates creates a favorable environment for investments, particularly in the stock market.
In summary, the Nirvana Model represents an ideal economic state where inflation is under control, the economy is growing, unemployment is low, and interest rates are moderate, all contributing to a stable and favorable investment climate.
Fed Model
The Fed Model, also known as the Fed's Stock Valuation Model, is a valuation tool that compares the forward earnings yield of the stock market (typically the S&P 500 Index) to the yield on 10-year U.S. Treasury bonds. Here are its key points:
It posits that the earnings yield on stocks should equal the yield on 10-year Treasury bonds or at least be highly correlated
Based on this comparison, the model is used to determine if the stock market is fairly valued, overvalued, or undervalued.
It has been criticized for its theoretical flaws, lack of predictive power, and failure to account for differences between nominal and real returns.
Key Differences
Purpose: The Fed Model is a specific tool for evaluating stock market valuations by comparing earnings yields to bond yields. In contrast, the Nirvana Model is a broader conceptual framework describing optimal economic conditions.
Scope: The Fed Model focuses narrowly on the relationship between stock and bond yields, while the Nirvana Model encompasses a range of macroeconomic indicators.
Application: The Fed Model is used for market timing and valuation, whereas the Nirvana Model is more of a descriptive model highlighting ideal economic conditions rather than a predictive or valuation tool.
While both concepts are associated with Dr. Ed Yardeni, they serve different purposes and operate within various contexts.
(3) US Stock Market Seasonality: Riding the Bull in November, December, and January
The final quarter of the calendar year has historically been the best quarter of the SP 500. December, April, and November have been the three best months of a calendar year.
On average, the 2-monthly period from November until December is also the best bi-monthly period of a calendar year.
Except for 2016, when Donald Trump won the presidential elections for the first time, price action has been positive since 2013.

Over the past ten years, the average performance of the S&P 500 during November and December was approximately 4.41%.
Data shows that during election years, the S&P 500 has historically underperformed in the September-to-early-November period compared to non-election years.

The best day of a calendar year has historically been October 28. The final ten days of November have been the best ten-day streak of the calendary year historically.
Nvidia is scheduled to report earnings on 20 November 2024 after market close. The report will be for the fiscal quarter ending Oct 2024.
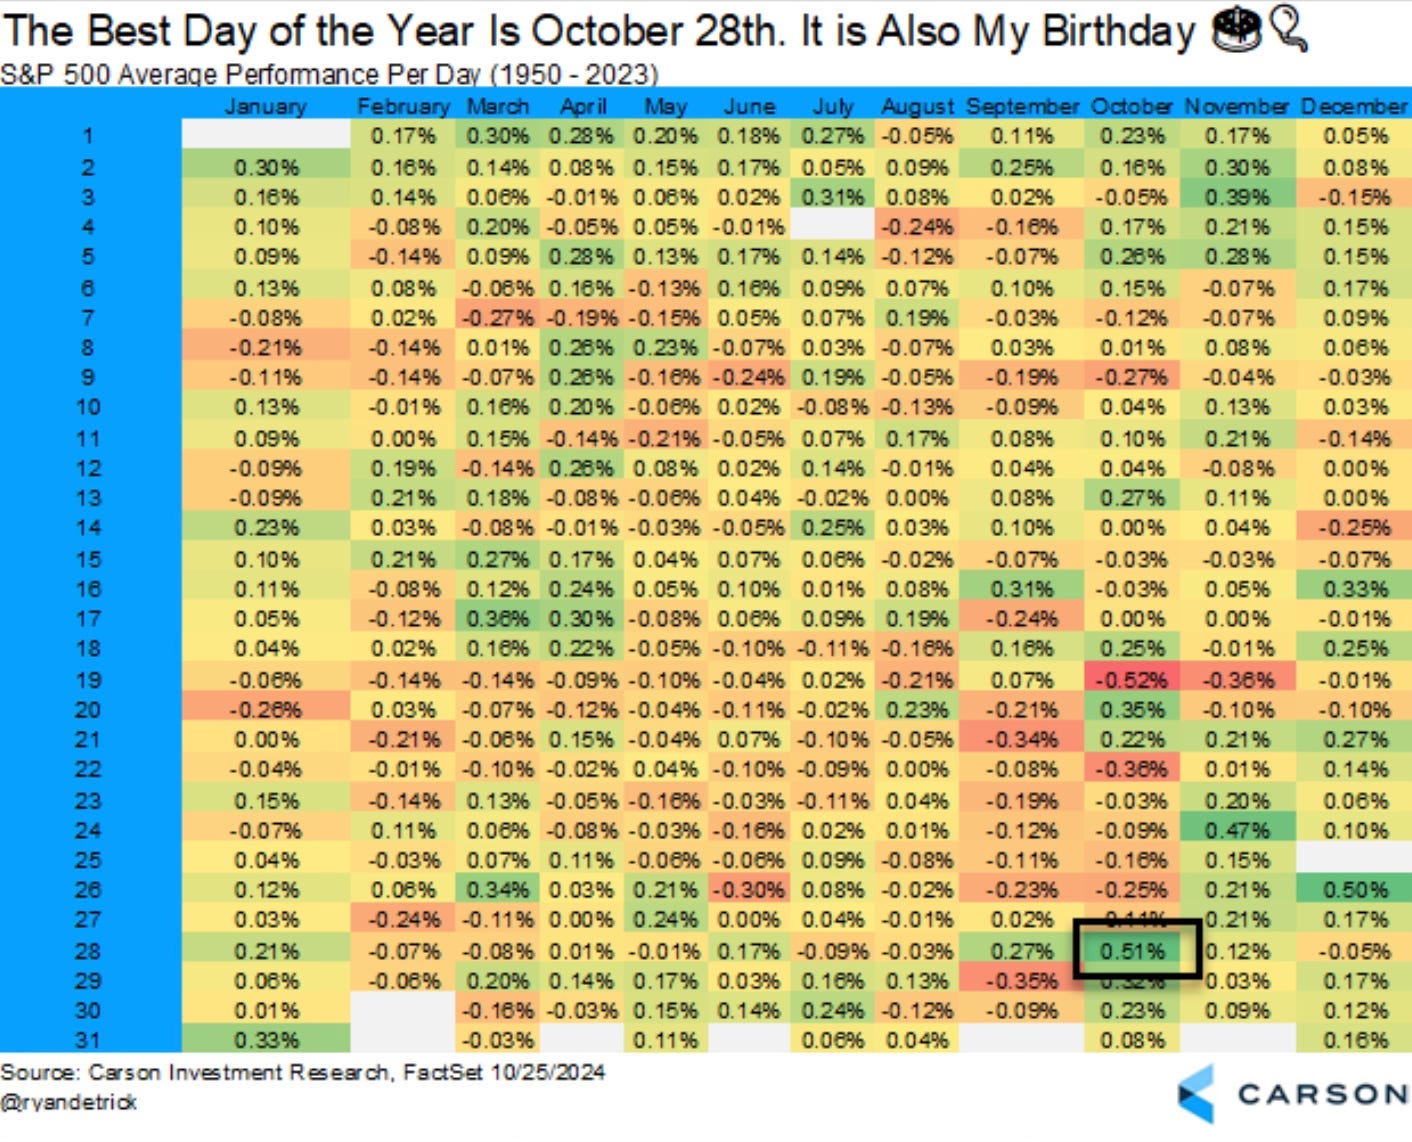
The table above is from Carson Investment Research.
(4) Long-Term Analysis: Bitcoin, Ethereum and Solana
The Trump crypto narrative is more than one story; it is at least four. Trump’s election does change the prospects of (1) the Bitcoin narrative, (2) the Gensler and Defi narratives, (3) the manosphere narrative, and some Meme Coin narratives, such as AI, RWAs, and Murad meme coins and (4) the end of QT.
Trump wants the US to begin forming a strategic reserve of BTC. This is positive as it removes a BTC selling overhang, namely that the US might sell extensive holdings confiscated from various nefarious agents. It adds buying pressure on BTC and cements its status within the global financial system. The gain from removing a selling-pressure overhang is real. The strategic reserve of BTC is a long way off.
Gary Gensler, the current chair of the SEC, is the crypto industry’s most hated person. Elizabeth Warren is a distant second.
Trump’s repeatedly said he would “fire” Gensler “on day one.” It is customary for SEC chairs to step down when a new president takes office. Trump has to do nothing to keep his promise.
Given this, it is unlikely that the various SEC suits will go forward at all until a clear regulatory framework is in place. UNI and AAVE may be fine. POL did a bump (it’s also being sued), and even Cardano (ADA) jumped. Synthetix (SNX) cannot go back to posting oil and stock derivative coins.
DeFi won’t be back where it once was. The most obvious winner is likely ETH (and Solanda) since DeFi is ETH’s killer app. It has a long way to go in catching up to BTC this cycle, and now its future looks more promising.
The manosphere is a loose association of public personalities, vloggers, and podcasters ranging from Joe Rogan and Jordan Peterson to Andrew Tate and Nick Fuentes, who have been Trump’s ardent supporters.
Meme coins represent various features of this cultural space. Based on the model Ernst Khalimov, the Giga Chad coin is a masculine ideal. SIGMA is a Gen Z phrase that crosses into the manosphere realm to indicate “the best man.”
The post-Trump manosphere narrative will boost these well-known coins and continue supporting them or similar coins. The ending of QT - likely in December 2024 - may boost the whole coin sphere.
Solana
Solana is firmly in bull territory, exhibiting impulse wave properties. It crossed the spring 2024 highs and reached close to 240 USD. It may soon get the ATH. It may be in the final wave before completing five waves.

It may well go into extension mode, reaching much higher. The chart below shows Solana vs. Bitcoin. I expect Solana to reach the 2021 ratio during an extended bull move.

Ethereum
Ether has lagged behind Bitcoin and Solana. It has not reached the spring 2024 highs.

The market cap dominance of Ether has declined considerably since 2020. It is only about 12 % of all cryptos.

Bitcoin
Bitcoin is about to reach 100,000 USD. This may be a more substantial top.

I expect the other coins to start catch-up trades after the big three reach topping zones. The total market cap of all coins ex, Bitcoin and Ether, is well below the peak seen during the last crypto bull market.

This may change in 2025 depending on whether the Trump administration will implement its crypto-friendly policy measures 2025.
