


Salve, cari subscripti!
Thank you for reading this week's edition of Closelook@US Stock Markets, dated October 27, 2024 👋. The next edition will be published on November 03, 2024, at 2:00 p.m. ET.
A Closelook At This Edition
This Week's Action: The End Of Tax Selling Season Is Near
US Economy: Bond Vigilantes Have Voted Earlier
US Stock Markets: A Positive October Bodes Well For The Rest Of The Year
US Stock Markets: A New ATH For The Nasdaq, But Not For The Nasdaq 100
Long-Term Analysis: Elliott Waves - Nasdaq 100
This Week's Spotlight: ServiceNow - The AI Leader in the Enterprise Software Sector
Knowledge Corner: Agentic AI
The Derivatives Portfolio: A Good Start and More Transactions
Final Words: Mag-7 Earnings Ante Portas
(1) This Week's Action: The End Of Tax Selling Season Is Near
The headline from early October was "US Stock Market: An Illusion of Perfection or a Rare Moment of Near-Perfect Conditions? It seems 2024 will be another lost year for the stock market bears.
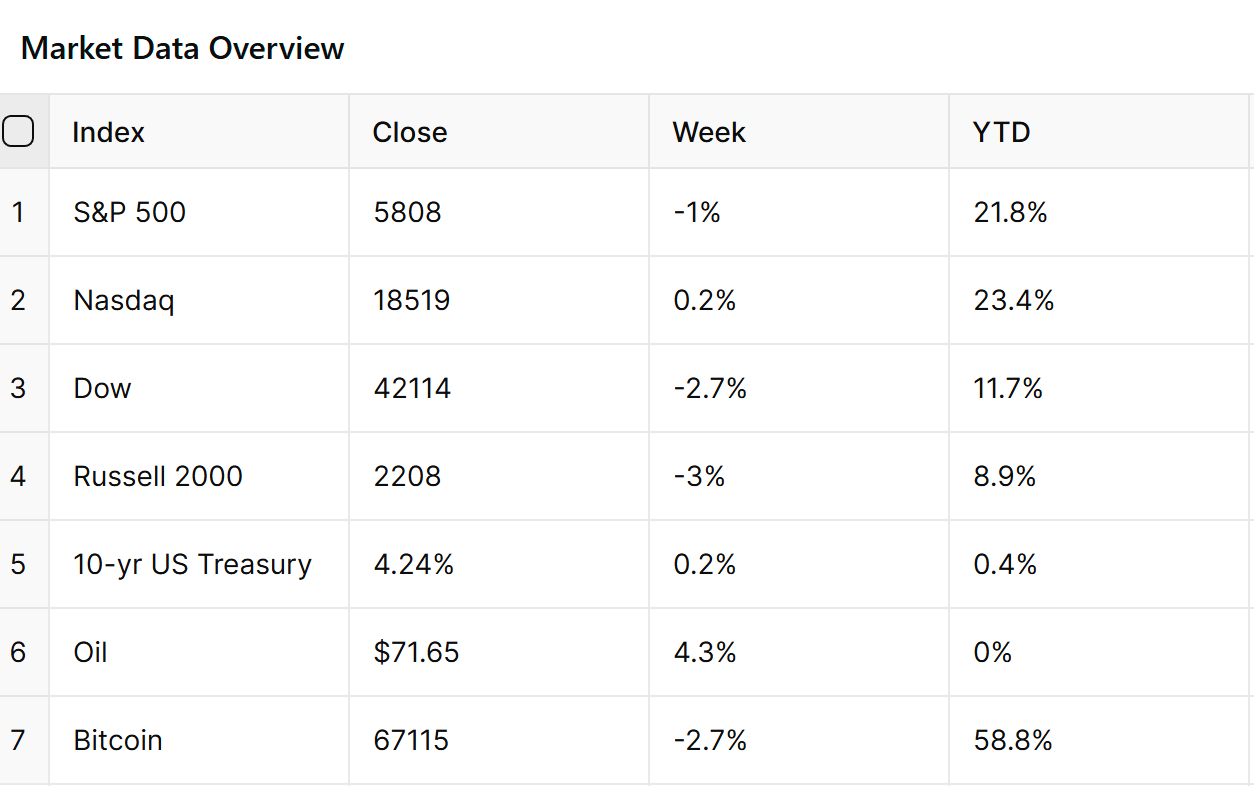
Last week saw the Dow Jones Industrial Average and S&P 500 winning streaks of six straight weekly gains end. The Nasdaq did hold positive, however, and extended its winning streak to seven straight positive weeks.

Nasdaq and Nasdaq 100 showed renewed relative strength compared with the DJIA, the SP 500, and the R2K. The breakout of the R2K index failed.

As the election approaches, some elevated market volatility can be anticipated. The election may cause investor unease, but I believe these concerns will dissipate quickly if the results show a winner.

However, prolonged uncertainty due to the need for lengthy recountings of election results in different states could negatively impact the stock and bond markets.

The Vix traded higher in October but has been far from panic readings. The Vix of Vix has been stable to date in October, indicating no elevated levels of uncertainty.
Knowledge Corner
The VIX and the VIX of VIX are two related but distinct volatility measures that provide insights into market sentiment and expected volatility.
VIX (CBOE Volatility Index)
The VIX, often called the "fear index," measures the market's expectation of 30-day forward-looking volatility for the S&P 500 Index
What VIX Measures:
Expected volatility of the S&P 500 over the next 30 days
Market sentiment and investor fear levels
Interpretation:
VIX values below 20 generally indicate periods of market stability and low volatility
VIX values between 20-30 indicate increasing market uncertainty
VIX values above 30 suggest high volatility and significant market fear or stress
Key Points:
The VIX is calculated using S&P 500 option prices
It has an inverse relationship with the S&P 500 - typically rising when the market falls and vice versa
VIX values are expressed as percentages, representing the expected annualized change in the S&P 500 at a 68% confidence interval
VIX of VIX (VVIX)
The VVIX, sometimes called the "VIX of VIX," measures the volatility of the VIX itself.
What VVIX Measures:
Expected volatility of the VIX index over the next 30 days
Market's expectation of volatility in volatility expectations
Interpretation:
Higher VVIX values indicate greater uncertainty about future volatility levels
Lower VVIX values suggest more stability in volatility expectations
Key Points:
VVIX provides a "second-order" view of market sentiment
It can offer insights into how stable or unstable the market's volatility expectations are
Comparing VIX and VVIX
VIX focuses on expected market volatility
VVIX focuses on the expected volatility of volatility itself
Both indices provide valuable information for traders and investors:
The VIX helps gauge overall market sentiment and expected near-term volatility.
The VVIX offers insights into how uncertain the market is about future volatility levels.

The TLT ETF made a double top and cratered on the back of economic data, signaling a much more robust US economy.
It is now below the middle of its year-long trading range and on the verge of breaking its bull trend to the downside.
In contrast to the stock market, the bond market's volatility has been elevated recently.
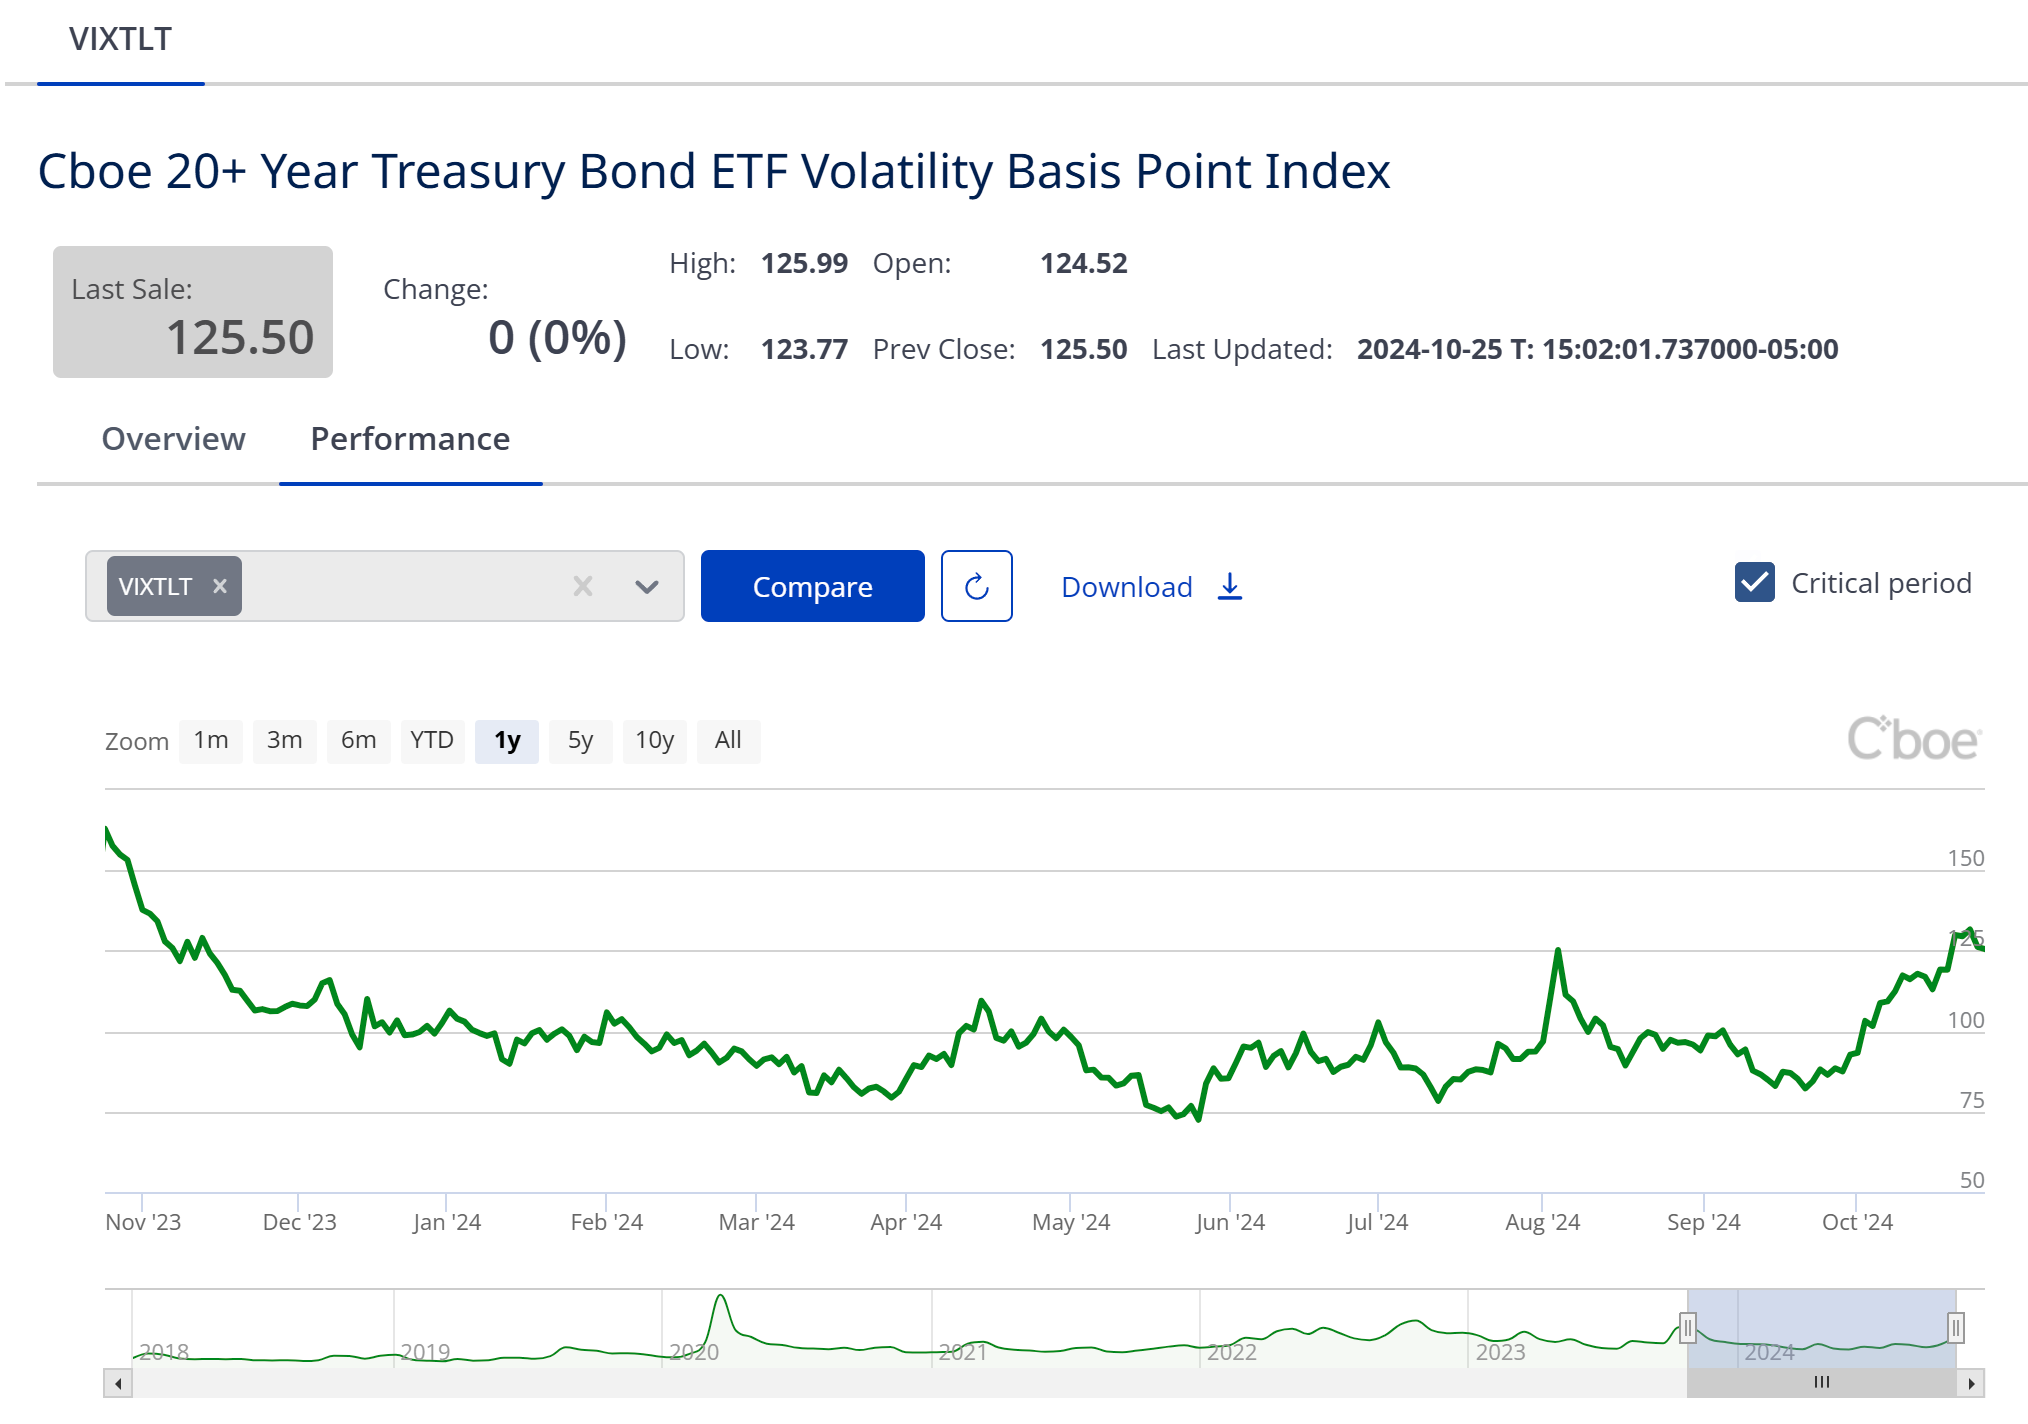
VIXTLT Index
Cboe Global Markets recently introduced the VIXTLT Index. It's designed to be a real-time gauge for the U.S. Treasury market's next 30 days of expected volatility. The VIXTLT focuses on U.S. Treasuries with maturities exceeding 20 years, using the highly liquid iShares 20+ Year Treasury Bond ETF (TLT).
Unlike the VIX, which deals with percentage changes, the VIXTLT measures volatility in basis points - a crucial distinction in the bond market. It uses a methodology similar to the VIX, leveraging listed options on the TLT ETF.

The second-best-performing asset class (Bitcoin has been the best performer) year-to-date has been Gold. It is up by more than 35% ytd. It trended sideways last week.
Silver has completed a break-out from its summer trading range and seems to be heading further north. It has now been up more than 50 % since the spring lows.

The chart above shows the price action of the iShares Silver Trust. The iShares Silver Trust ETF (SLV) is an exchange-traded fund that seeks to reflect the performance of the price of silver minus expenses.
It provides investors with a cost-effective and convenient way to invest in silver without taking physical delivery of the metal.
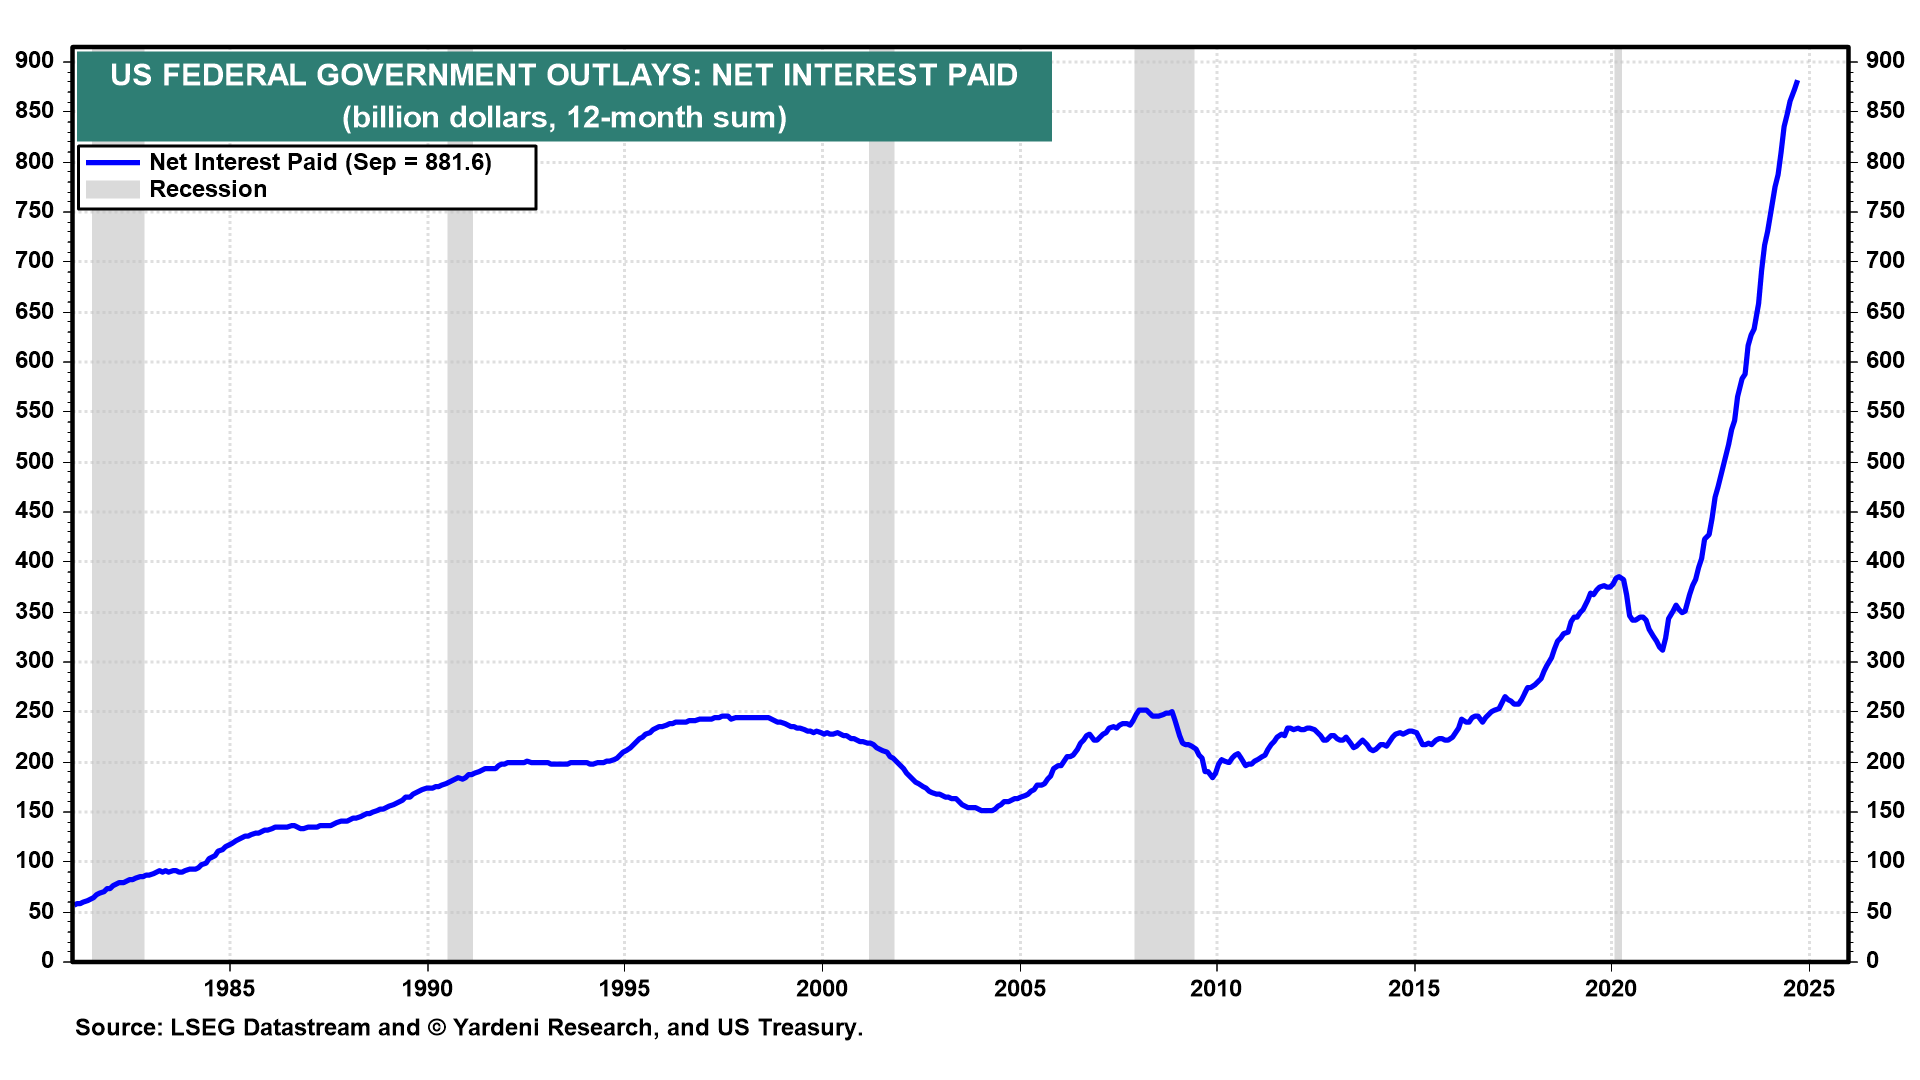
(2) US Economy: Bond Vigilantes Have Voted Earlier
The bond market has started to vote early, sending a clear message ahead of the November 5 US presidential and congressional elections.
Since the Federal Reserve's September 17-18 meeting, the 10-year US Treasury bond yield has surged by 64 basis points to 4.26% before settling down slightly and closing at 4.24 %.
This significant increase reflects the Bond Vigilantes' concerns about Fed Chair Jerome Powell's dovish monetary policy and the potential for economic overheating.
Market Reaction and Analysis
The Bond Vigilantes appear to be voting against the Fed's recent actions, particularly the 50 basis point rate cut on September 18. Their concern stems from the perception that the economy is already running hot and further easing could lead to overheating.
This market reaction was not entirely unexpected. On September 2, Ed Yardeni predicted that positive economic indicators might unsettle the bond market.
In his September 22 commentary, he further highlighted the possibility of diverging yields, with the 2-year yield potentially decreasing due to Fed easing while the 10-year yield might rise on concerns about economic overheating.
Fiscal Policy Concerns and Challenges
The Bond Vigilantes' reaction may also reflect apprehension about future fiscal policies, regardless of which party wins the upcoming elections. Some are concerned that continued expansionary budgetary policies could further inflate the substantial federal budget deficit and fuel inflation.
The next administration will face significant fiscal challenges, particularly regarding debt servicing:
The next administration will face net interest outlays of over $1 trillion on the ballooning federal debt.
This underscores the growing burden of interest payments on the federal debt, likely influencing future fiscal and monetary policy decisions.
The U.S. has reached a historic milestone, with annual interest payments on the national debt surpassing $1 trillion, driven by rising interest rates and a debt load now exceeding $35 trillion.
The Congressional Budget Office highlights this cost as outpacing major budget items like defense spending. This significant increase in debt servicing pressures will influence fiscal policy decisions and budget allocations for years.
Japan, China, and the United Kingdom are the largest foreign holders of U.S. debt. As of 2024, Japan is the top foreign holder, with approximately $1.15 trillion in U.S. Treasury securities. China holds around $750 billion, while the U.K. follows closely with about $690 billion. Other countries with significant U.S. debt holdings include Luxembourg and the Cayman Islands, each owning a few hundred billion dollars in Treasuries.
In recent U.S. Treasury auctions throughout 2024, primary dealers, direct bidders, and indirect bidders have continued to play significant roles in purchasing government debt. Primary dealers, financial institutions authorized to trade directly with the Federal Reserve, have been the primary buyers in many auctions. There has also been notable participation from indirect bidders, a category that includes foreign central banks and other international investors.
In several 2024 auctions for securities such as the 20-year bonds and 28-day bills, indirect bidders accounted for substantial portions of the accepted bids, indicating robust foreign demand for U.S. Treasuries.
Recent data shows that indirect bidders—often acting through the Federal Reserve Bank of New York on behalf of foreign monetary authorities—continue to secure a large share of the bids, especially for longer-term securities. This ongoing foreign interest is consistent with historical patterns where foreign central banks use Treasuries to maintain reserves and stabilize currencies.
The bid-to-cover ratios in these auctions, frequently above 2.5, also highlight strong demand for domestic and international buyers, reinforcing Treasuries' appeal as safe-haven assets.
Currently, I see no real threat of bond vigilantes stopping to buy US bonds. But this may change anytime soon.
Allianz CEO Oliver Baete recently expressed concern over high public debt levels, describing the situation as “really scary.” He emphasized that investments in sovereign debt, commonly perceived as risk-free, are far from it and highlighted the U.S. as an example. Baete’s remarks reflect Allianz's cautious stance on sovereign bonds, especially amid ongoing market volatility. He criticized the assumption that domestic sovereign debt lacks risk, suggesting that such a view could have significant financial repercussions.
The IMF expressed concerns in October 2024 about elevated global sovereign debt levels, projecting that total public debt will exceed $100 trillion in 2024, equivalent to around 93% of global GDP. This debt trajectory is expected to approach 100% of global GDP by 2030, partly driven by factors such as pandemic-related spending, inflation, and rising interest rates, which have increased the cost of borrowing.
The IMF’s October 2024 Fiscal Monitor emphasizes the need for countries to address these high debt levels through careful fiscal policies, aiming to balance economic growth and debt reduction.
The IMF warns that global public debt could spike to 115% of GDP by 2026 in a particularly adverse scenario. This is due to potential risks such as slower growth, continued high financing costs, and fiscal pressures from social needs and climate initiatives.
The IMF suggests a substantial fiscal adjustment (around 3-4.5% of GDP over six years) may be required to stabilize debt effectively, particularly for high-debt countries like the U.S., China, and several European nations. However, the IMF notes that delaying such adjustments could increase the risk of market instability, impacting financial resilience and economic growth globally.
In a scenario like this, I prefer megacap stocks and related ETFs, as well as Bitcoin over government bonds.

(3) US Stock Markets: A Positive October Bodes Well For The Rest Of The Year
An October ending with monthly SP 500 gains usually bodes well for the rest of the year. The table below shows the SP 500 action after ending October with a 6-month trailing return above ten percent.
This has happened 12 times since 1950, and in each instance, the $SPX went on to finish November and December in the green with an average gain of 7.4%!
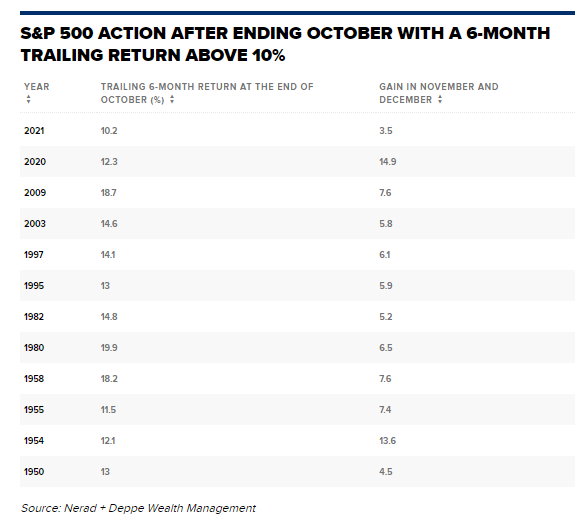
The final quarter of the calendar year has historically been the best quarter of the SP 500. December, April, and November have been the three best months of a calendar year.
On average, the 2-monthly period from November until December is also the best bi-monthly period of a calendar year.
Except for 2016, when Donald Trump won the presidential elections for the first time, price action has been positive since 2013.

Over the past ten years, the average performance of the S&P 500 during November and December was approximately 4.41%.
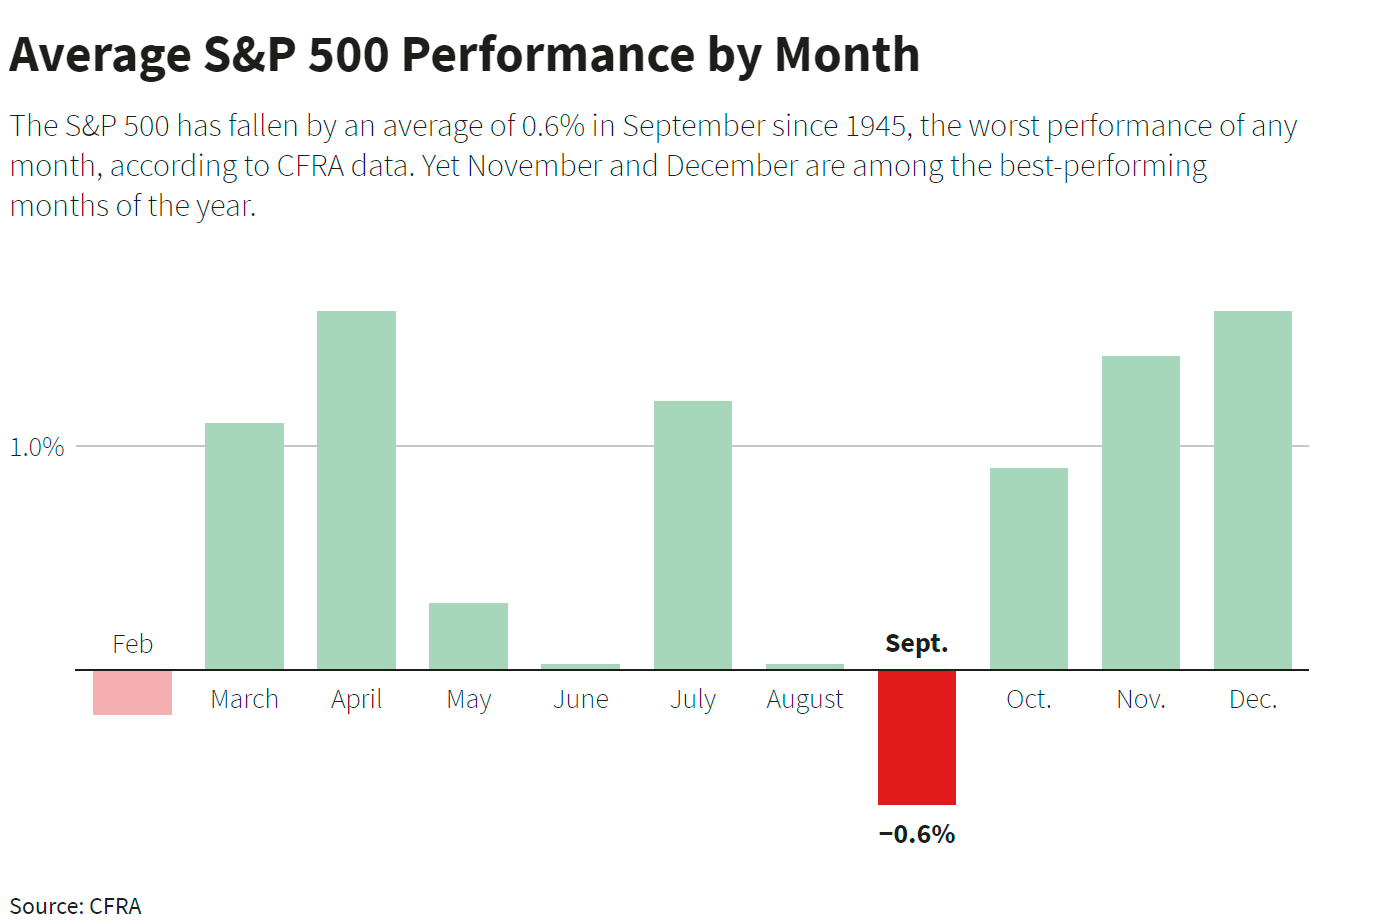
Data shows that during election years, the S&P 500 has historically underperformed in the September-to-early-November period compared to non-election years.

The best day of a calendar year has historically been October 28. A day when tax selling often finishes as many mutual funds have a fiscal year-end of October 31.
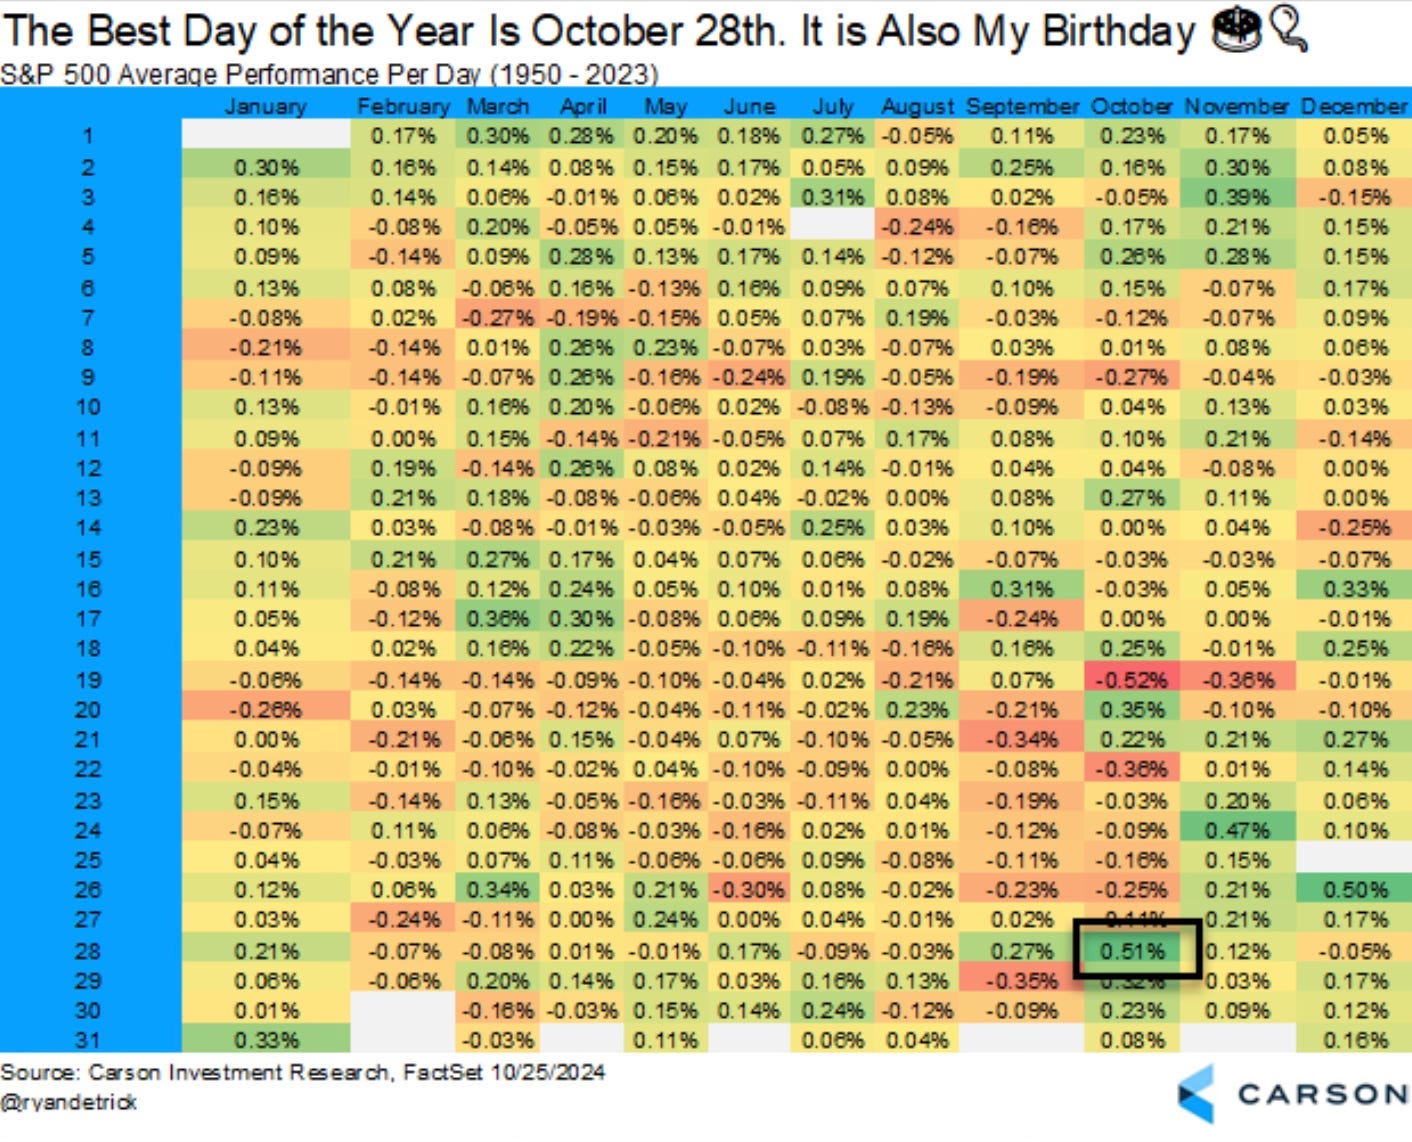
The table above is from Carson Investment Research.
(4) US Stock Markets: A New ATH For The Nasdaq, But Not For The Nasdaq 100Subsectors
While the Nasdaq hit an ATH this week, the Nasdaq 100 traded below the summer peaks last week.

The Nasdaq 100 long-term bullish trend is intact. The index has just closed the last of the three gaps (bearish break-away, continuation gap, and exhaustion gap) since the summer of 2024.

The Nasdaq 100 Equal Weight Index ran into heavy resistance last week and underperformed the Nasdaq Top 30 index.

62 % of Nasdaq 100 stock traded above their 50-day moving averages, down from over 80 % a week ago.

The Nasdaq 100 Tech Index failed to move close to its ATH recorded in the summer of 2024.

The Nasdaq 100 Ex Tech Index reached a new ATH last week before moving down rather sharply. Rising yields put pressure on smaller growth stocks.

The Nasdaq 100 Top 30 Index reached above the prior September highs. Megacap tech stocks staged a comeback.

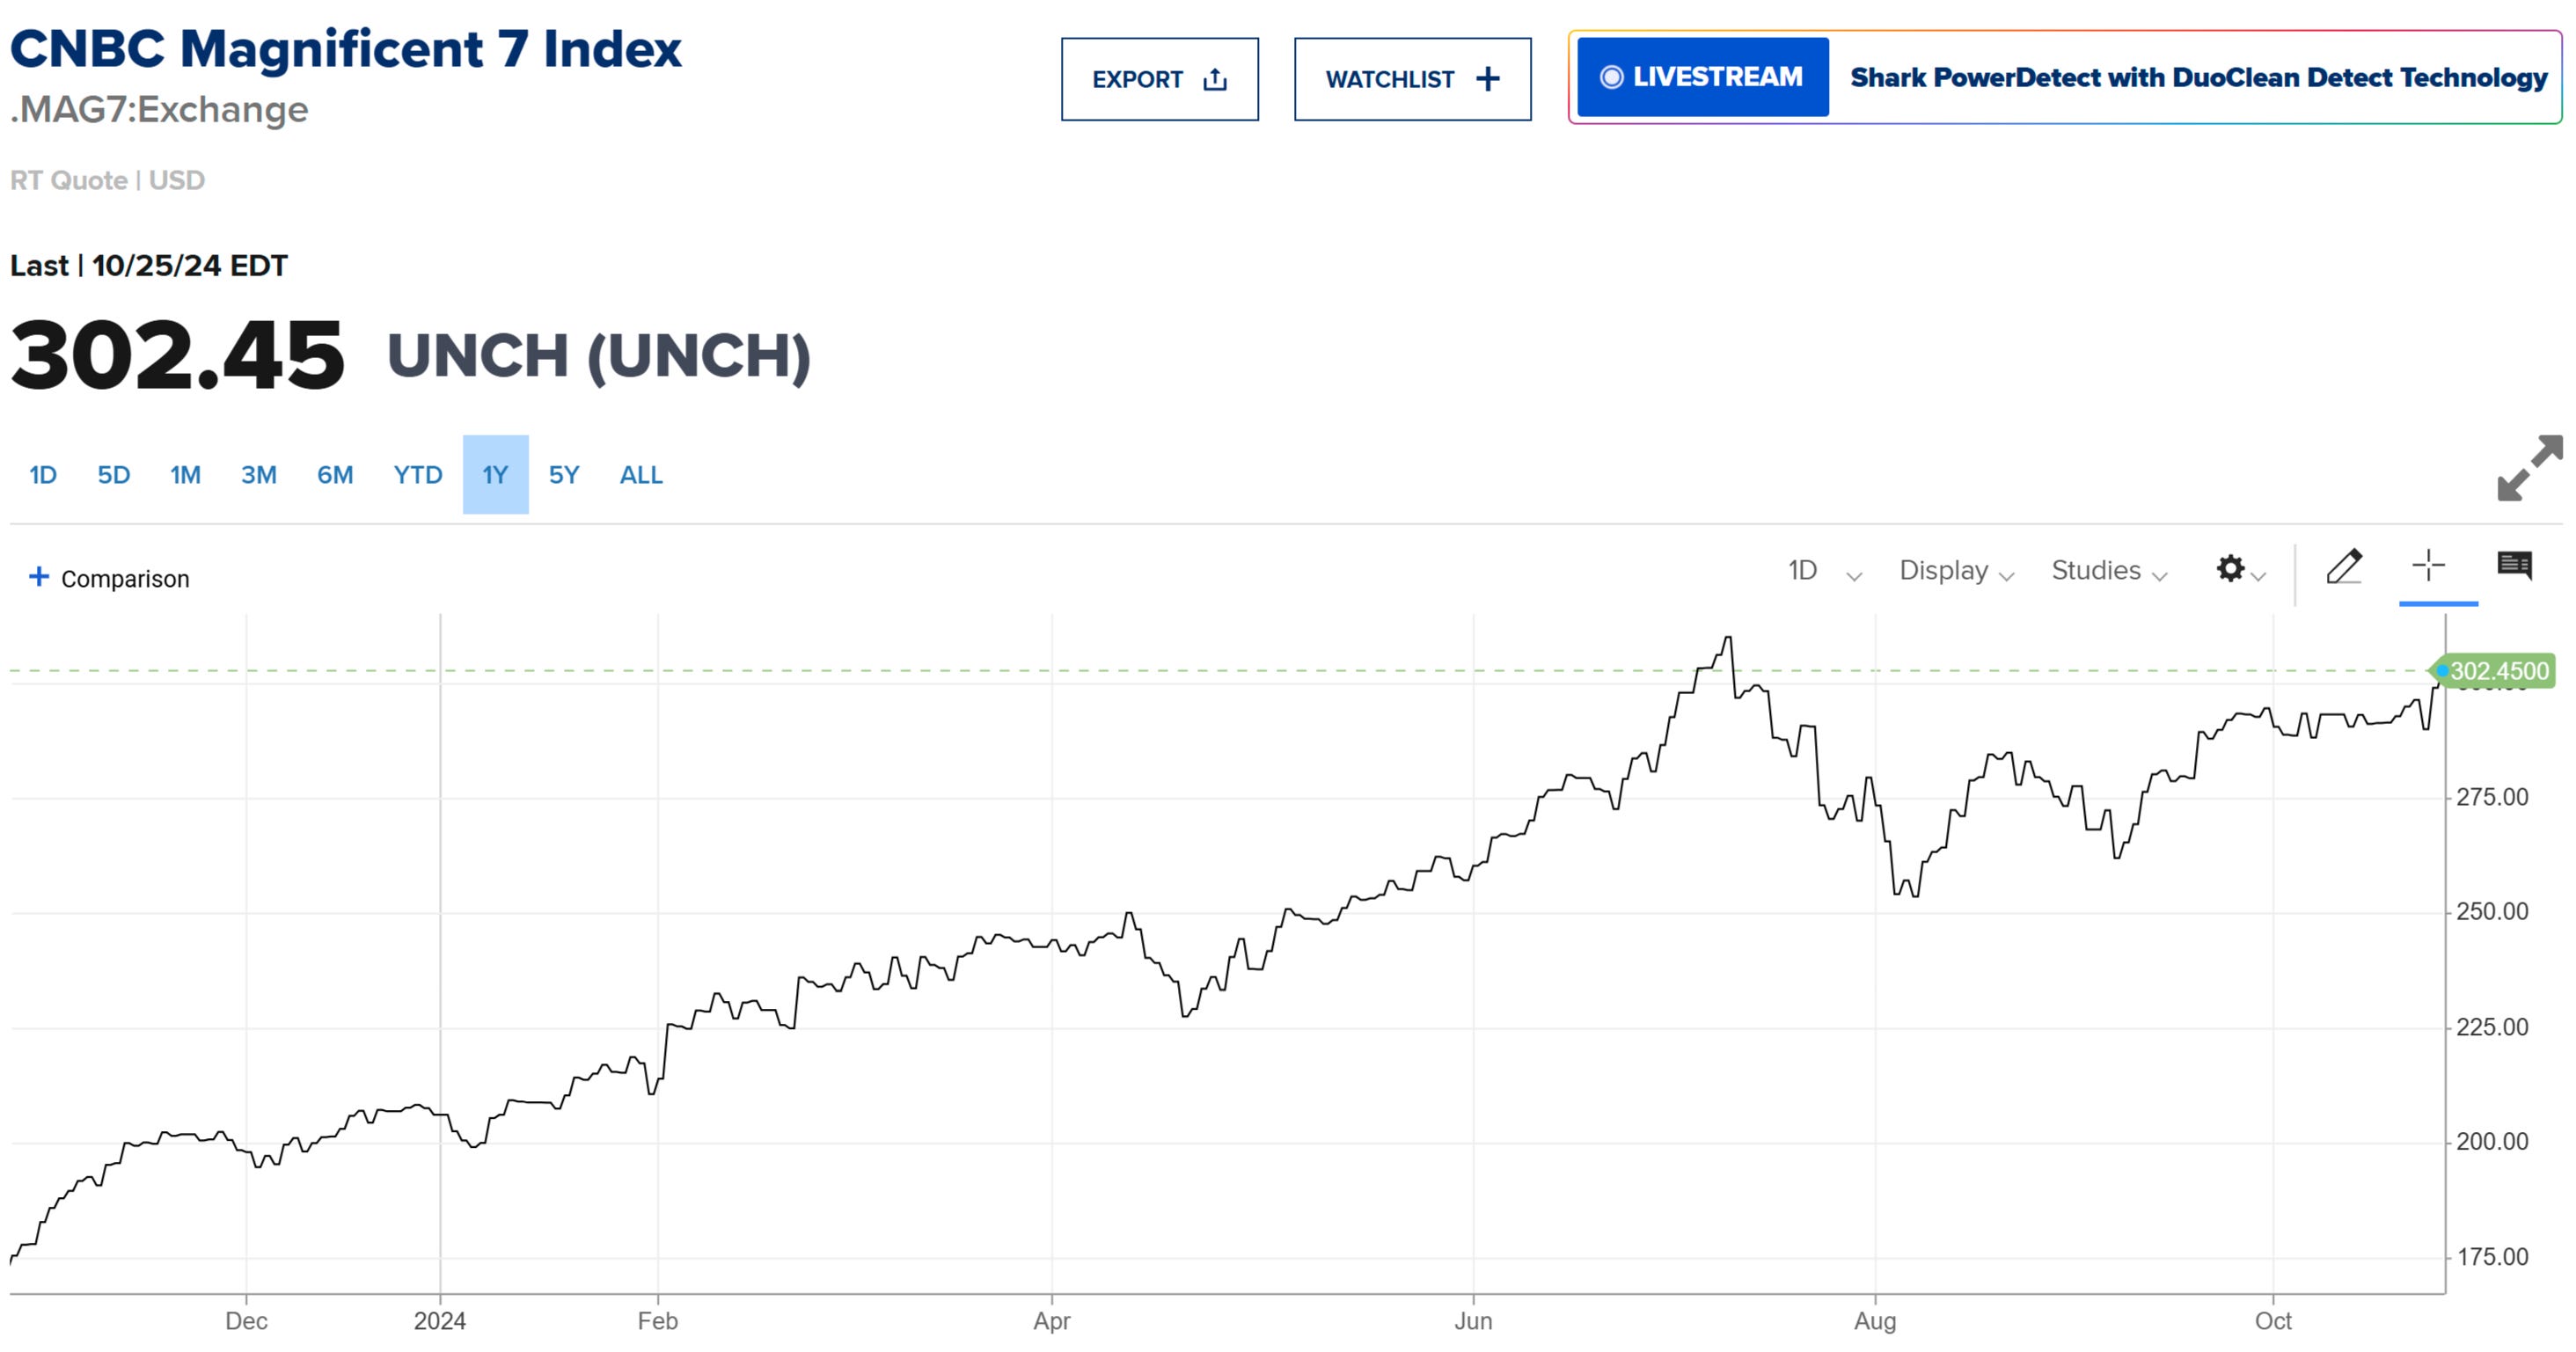
The Mag-7 stock index showed considerable relative strength, moving close to its ATH.
I expect the outperformance of the Mag-7 stocks to resume in a higher yield environment.
(5) Long-Term Analysis: Elliott Waves - Nasdaq 100
Nasdaq 100 has been in a bull market since autumn 2022. I see two possible Elliott Wave counts.
Scenario 1: The current move up is a wave b. Then, contrary to popular belief, we will see no year-end rally after the election but rather a wave c and a test of the August lows.
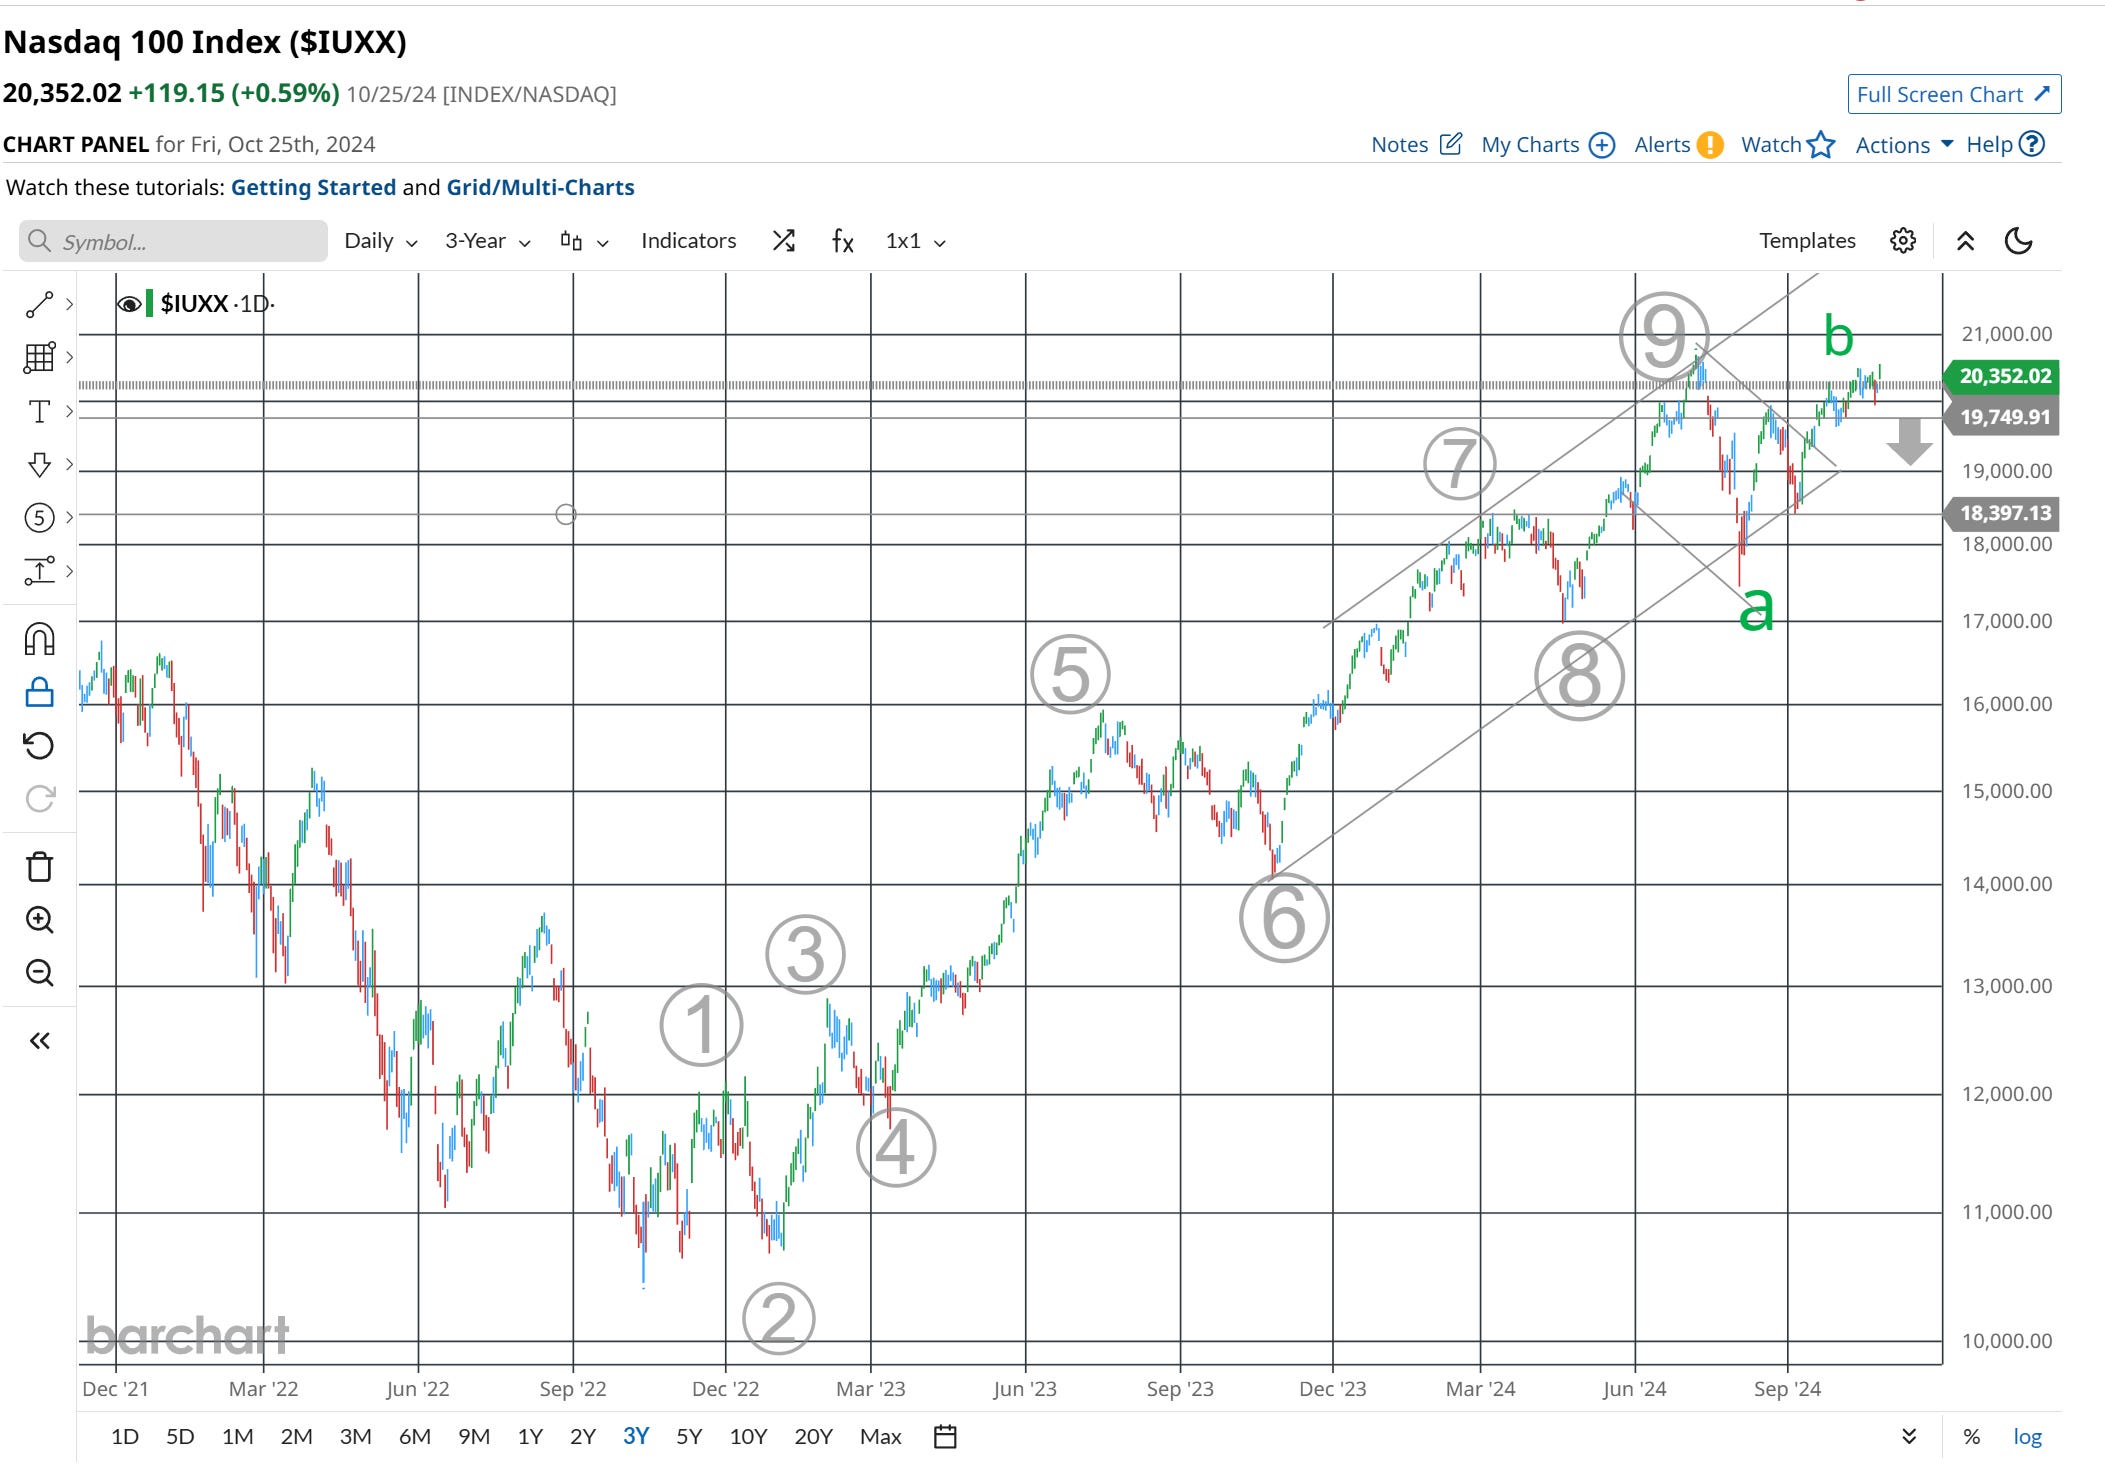
Or the autumn consolidation stopped before the end of the tax-selling season, and we are already in the middle of a new bull market leg.
The chart below shows some Fibonacci levels that match peaks and lows since the bull market started.

The chart below shows Fibonacci fans and their alignment with different trend channels.

The chart below shows my preferred Elliott wave count for the Nasdaq 100.

In this scenario, a final leg up now would lead to a larger consolidation pattern in early 2025.
