

US Stocks: The Trend Is Your Friend, Until It Bends
Mixed Earnings and Bond Market Turmoil Mark a Potential Pause in the Bull Run

Salve, cari subscripti!
Thank you for reading this week's edition of Closelook@US Stock Markets, dated October 03, 2024 👋. The next edition will be published on November 10, 2024, at 2:00 p.m. ET.
A Closelook At This Edition
This Week's Action: The End Of Tax Selling
US Economy: A New Bond Market Massacre?
US Stock Markets: Mixed Earnings From the Mag-5
US Stock Markets: The Trend Is Your Friend Until It is No More
Long-Term Analysis: Elliott Waves - Nasdaq 100
This Week's Spotlight: Google, Amazon, Apple, Microsoft And Meta In A Nutshell
Knowledge Corner: The Disconnect Decoded: Why Economic Models Fall Short in Financial Markets
The Derivatives Portfolio: A Good October And More Transactions
Final Words: Mag-7 Time To Watch
(1) This Week's Action: The End Of Tax Selling Season Is Near
The headline from early October was "US Stock Market: An Illusion of Perfection or a Rare Moment of Near-Perfect Conditions? The Bears seem to be staging a comeback and trying to make 2024 their year.
The weekly performance summary from Monday, October 28, to Friday, November 1, 2024, shows the major markets heading south.
Weekly Performance Summary
S&P 500 Index (SPX)
October 28: 5,823.52
November 1: 5,728.80
Weekly Change: -94.72 points (-1.63%)
Dow Jones Industrial Average (DJIA)
October 28: 42,387.57
November 1: 42,052.19
Weekly Change: -335.38 points (-0.79%)
Nasdaq Composite Index
October 28: 18,567.19
November 1: 18,239.92
Weekly Change: -327.27 points (-1.76%)
Russell 2000 Index
October 28: 2,244.07
November 1: 2,210.13
Weekly Change: -33.94 points (-1.51%)
10-Year U.S. Treasury Yield
October 28: 4.274%
November 1: 4.386%
Weekly Change: +0.112 percentage points
Bitcoin (BTC/USD)
October 28: Approximately $68,428.00
November 1: Approximately $67,249.00
Weekly Change: -$1,179.00 (-1.72%)
Gold (Spot in USD)
October 28: Approximately $2,800.80 per ounce
November 1: Approximately $2,749.30 per ounce
Weekly Change: -$51.50 (-1.84%)
Oil (WTI Crude)
October 28: Approximately $72.35 per barrel
November 1: Approximately $70.55 per barrel
Weekly Change: -$1.80 (-2.49%)
Last week saw the Dow Jones Industrial Average and S&P 500 second losing week in a row. The SP 500 violated its uptrend in place since the August lows on a weekly closing basis.

The Nasdaq broke its winning streak of seven straight positive weeks. It violated the uptrend in place since August 2024 on a weekly closing basis. The chart looks like a double-top formation.

The R2K finished about 1.5 % lower. The index failed to break above the multi-year resistance zone, where it could not move higher in the summer of 2024 and 2021.

As the election approaches, further elevated market volatility can be anticipated before and immediately after the election.

The VIX moved above 20 again but is far away from former peaks around 30 seen during the bear market in 2022.

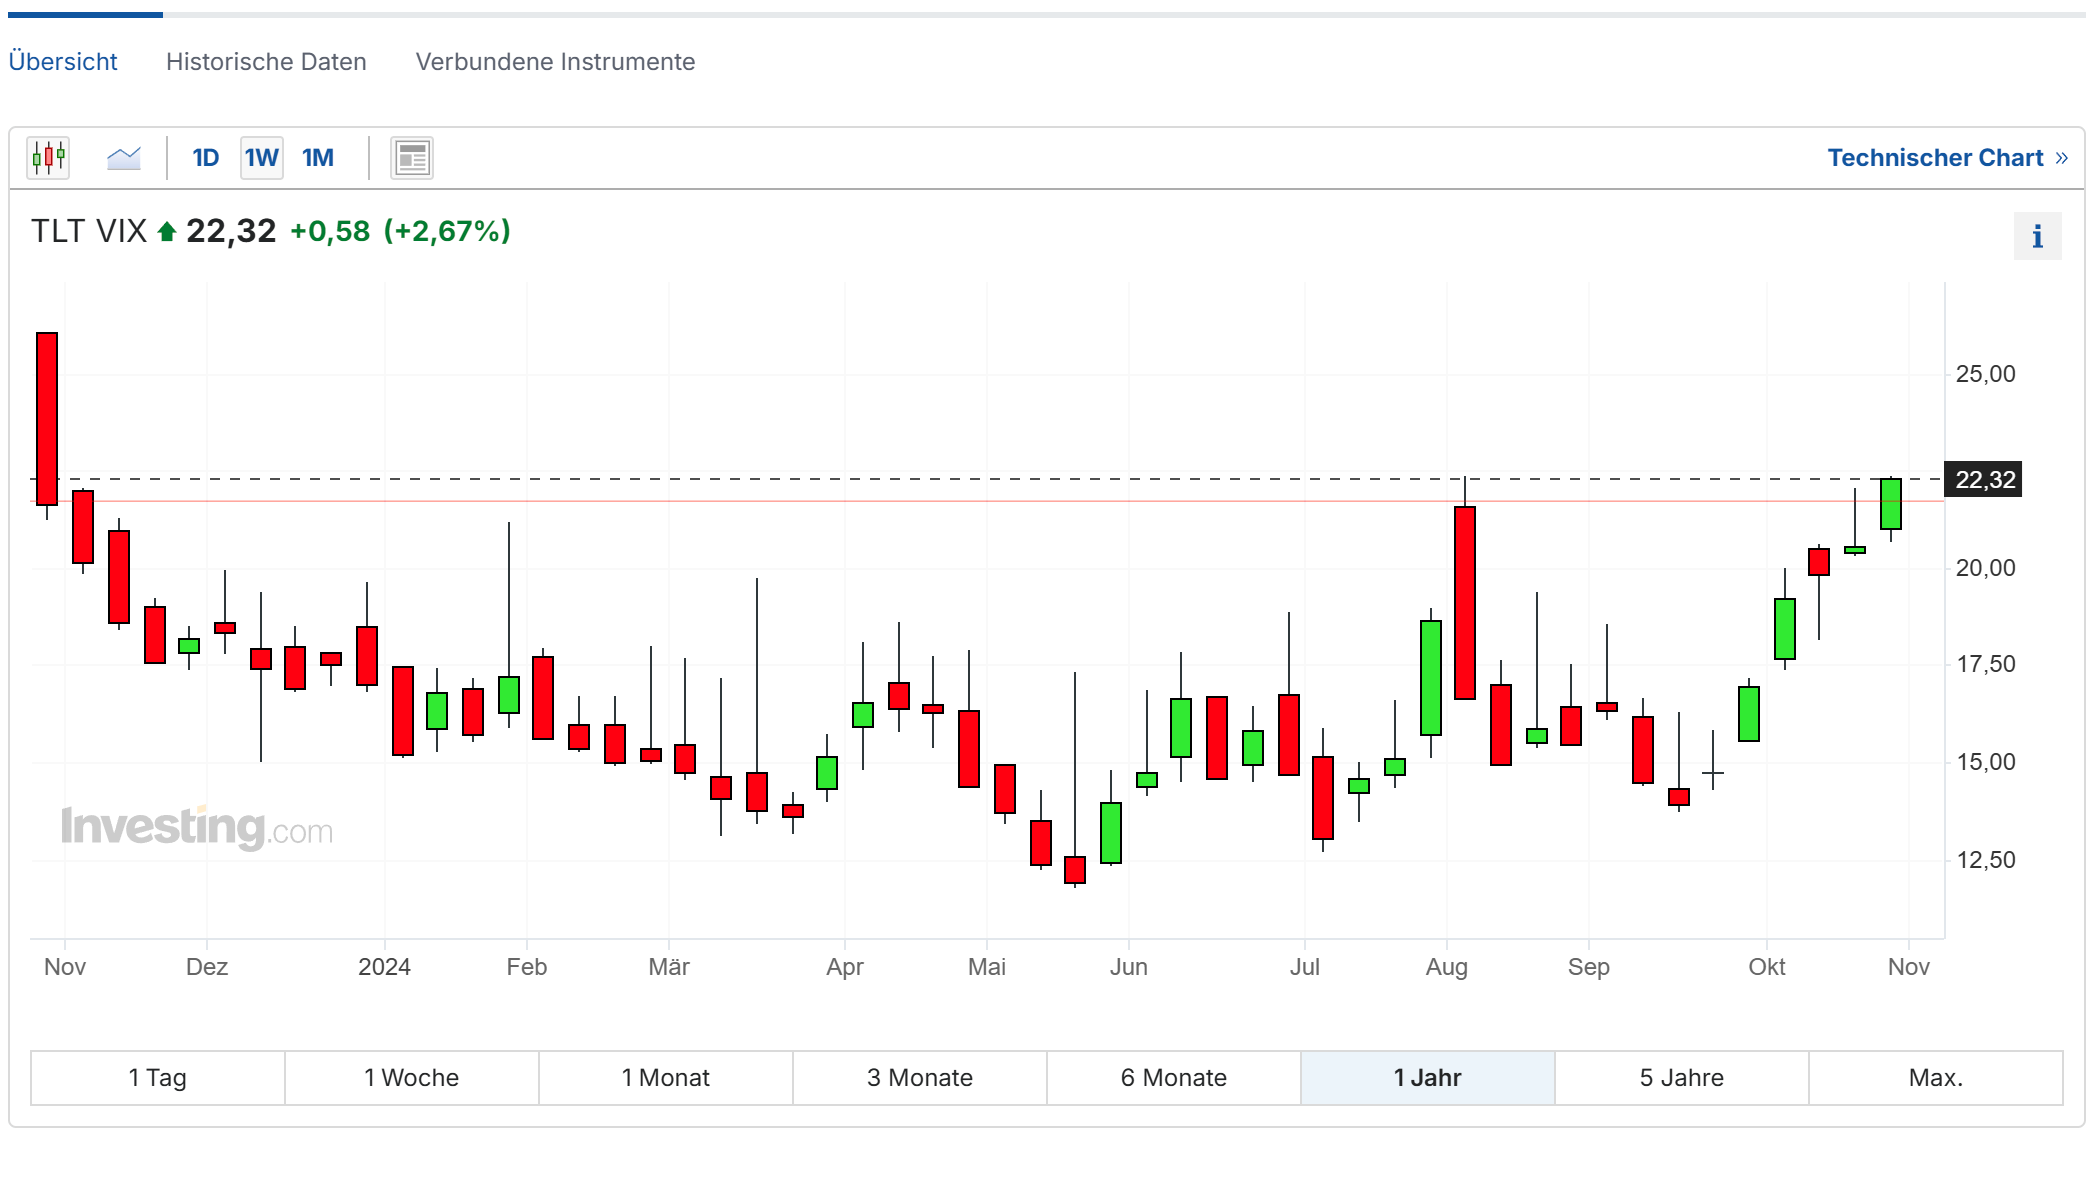
As measured by the TLT Vix, the Bond Vix traded at a 52-week high last week. Bond volatility has been much higher recently than equity volatility.
Knowledge Corner
The two leading volatility indices for bonds that are similar to the VIX (which measures equity market volatility) are:
VIXTLT Index
This index is calculated using listed options on the iShares 20+ Year Treasury Bond ETF (TLT). It provides a real-time gauge of the next 30 days of expected volatility in the U.S. Treasury market, particularly for bonds with maturities exceeding 20 years.
It is expressed in basis points, which is more relevant for the bond market, where small changes can have significant implications.
The VIXTLT Index is a real-time gauge of the expected volatility in the U.S. Treasury market over the next 30 days. It is calculated using listed options on the iShares 20+ Year Treasury Bond ETF (TLT), a highly liquid ETF composed of U.S. Treasury bonds with maturities exceeding 20 years and relatively high duration.
This index leverages Cboe’s proprietary VIX Index methodology, adapted for the bond market. It provides a measure of volatility in basis points, which is more relevant for fixed-income markets where risk is often perceived as absolute rather than percentage changes.
The VIXTLT Index offers insights into how the bond market reacts to different volatility regimes and can be compared with the VIX Index to understand the relationship between equity and bond market volatility.
ICE BofAML MOVE Index
This index gauges U.S. bond market volatility across different maturities. It is designed to measure the expected volatility of U.S. Treasury yields. It is often used as a broader indicator of bond market volatility compared to the VIXTLT, which focuses on longer-term Treasuries.
The ICE BofAML MOVE Index measures the expected volatility of U.S. Treasury yields across various maturities. Unlike the VIXTLT, which focuses on longer-term Treasuries (20+ years), the MOVE Index provides a broader view of bond market volatility by covering a range of maturities.
This index is used to gauge the overall volatility in the U.S. Treasury market, making it a valuable tool for understanding market sentiment and risk across different bond market segments.
The MOVE Index is particularly valuable for investors seeking a comprehensive view of bond market volatility, as it captures the expected volatility across multiple maturities, providing a more holistic picture compared to the VIXTLT, which is more focused on long-term Treasuries.
The bond market volatility indices are standalone tools used to gauge market sentiment and predict potential price swings in the bond market. Still, they do not have a secondary layer of volatility measurement as the VIX of VIX does for the VIX.
US presidents come and go, but this election may matter more than other ones. Why? Because there will be structural credit and deficit troubles ahead in the US, and how they are addressed will significantly impact whether we will have mediocre stock market returns in the next 10 years (the Goldman Sachs view) or (close to) double-digit annual returns (Ed Yardeni’s roaring 20s concept).
I anticipated a top in the TLT based on better-than-expected economic indicators rather than the beginning of another debt crisis like the one that occurred from August to October 2023.
I firmly believe that when the bond markets start to worry deeply about the federal deficit and debt and bond vigilantes push them south, moving prices of the TLT ETF to the bottom or even below its multi-month trading range, the stock market bull will end abruptly.

The TLT ETF cratered from highs above 100 USD before the Fed lowered rates in mid-September to the middle of the trading range of around 92 USD.
It initially found support at the lower trend line of the upward-sloping trend channel in place since late 2023.
This trendline was broken to the downside in the last trading days of the previous week and confirmed by a weekly close on Friday, 1 November 2024!

This may indicate elevated volatility ahead, as even an employment report indicating weaker job growth did not help the bond market move north on Friday.

The second-best-performing asset class (Bitcoin has been the best performer) year-to-date has been Gold. It is up by more than 30% ytd. It fell close to two percent last week.
Silver has completed a break-out from its summer trading range and seems to be heading further north in the longer term. It has now been up more than 50 % since the spring lows. Silver also moved lower last week.

Bitcoin made another attempt to close above 70000 USD but failed again. It lost close to two percent on the week. The chart looks bullish to me. It looks like a wave 4 formation.

While the minimum a-b-c-d-e requirements have been fulfilled, a wave 4 quite often takes a more complex form than an a-b-c-d-e formation.

The current break-out would fail in such a case, and the lows of around 50,000 would be tested again (see chart below).

The formation may even become more complex, encompassing two three-wave corrective moves (see chart below), unless there are not many Bitcoin bulls left to initiate the pain trade and move the coin to new ATHs.

I have no idea why Microstrategy has performed so much better than Bitcoin. When the coins peaked in the spring of 2024 at around 70000 USD, MSTR traded a bit below 200 USD. Last week, it peaked at over 265 USD before moving to around 225 USD.

Meme-type speculation, insider knowledge, a reason to go short? I hold shares of Microstrategy as a leveraged Bitcoin proxy but do not trade them.
(2) US Economy: A New Bond Market Massacre?
Since the Federal Reserve's September 17-18 meeting, the 10-year US Treasury bond yield has surged by 77 basis points to 4.39%.
This significant increase reflects the Bond Vigilantes' concerns about Fed Chair Jerome Powell's dovish monetary policy and the potential for economic overheating.
Market Reaction and Analysis
On Monday, October 28, 2024, the Treasury announced its marketable borrowing estimates. The projected financing is $546 billion in Q4-2024 and $823 billion during Q1-2025.
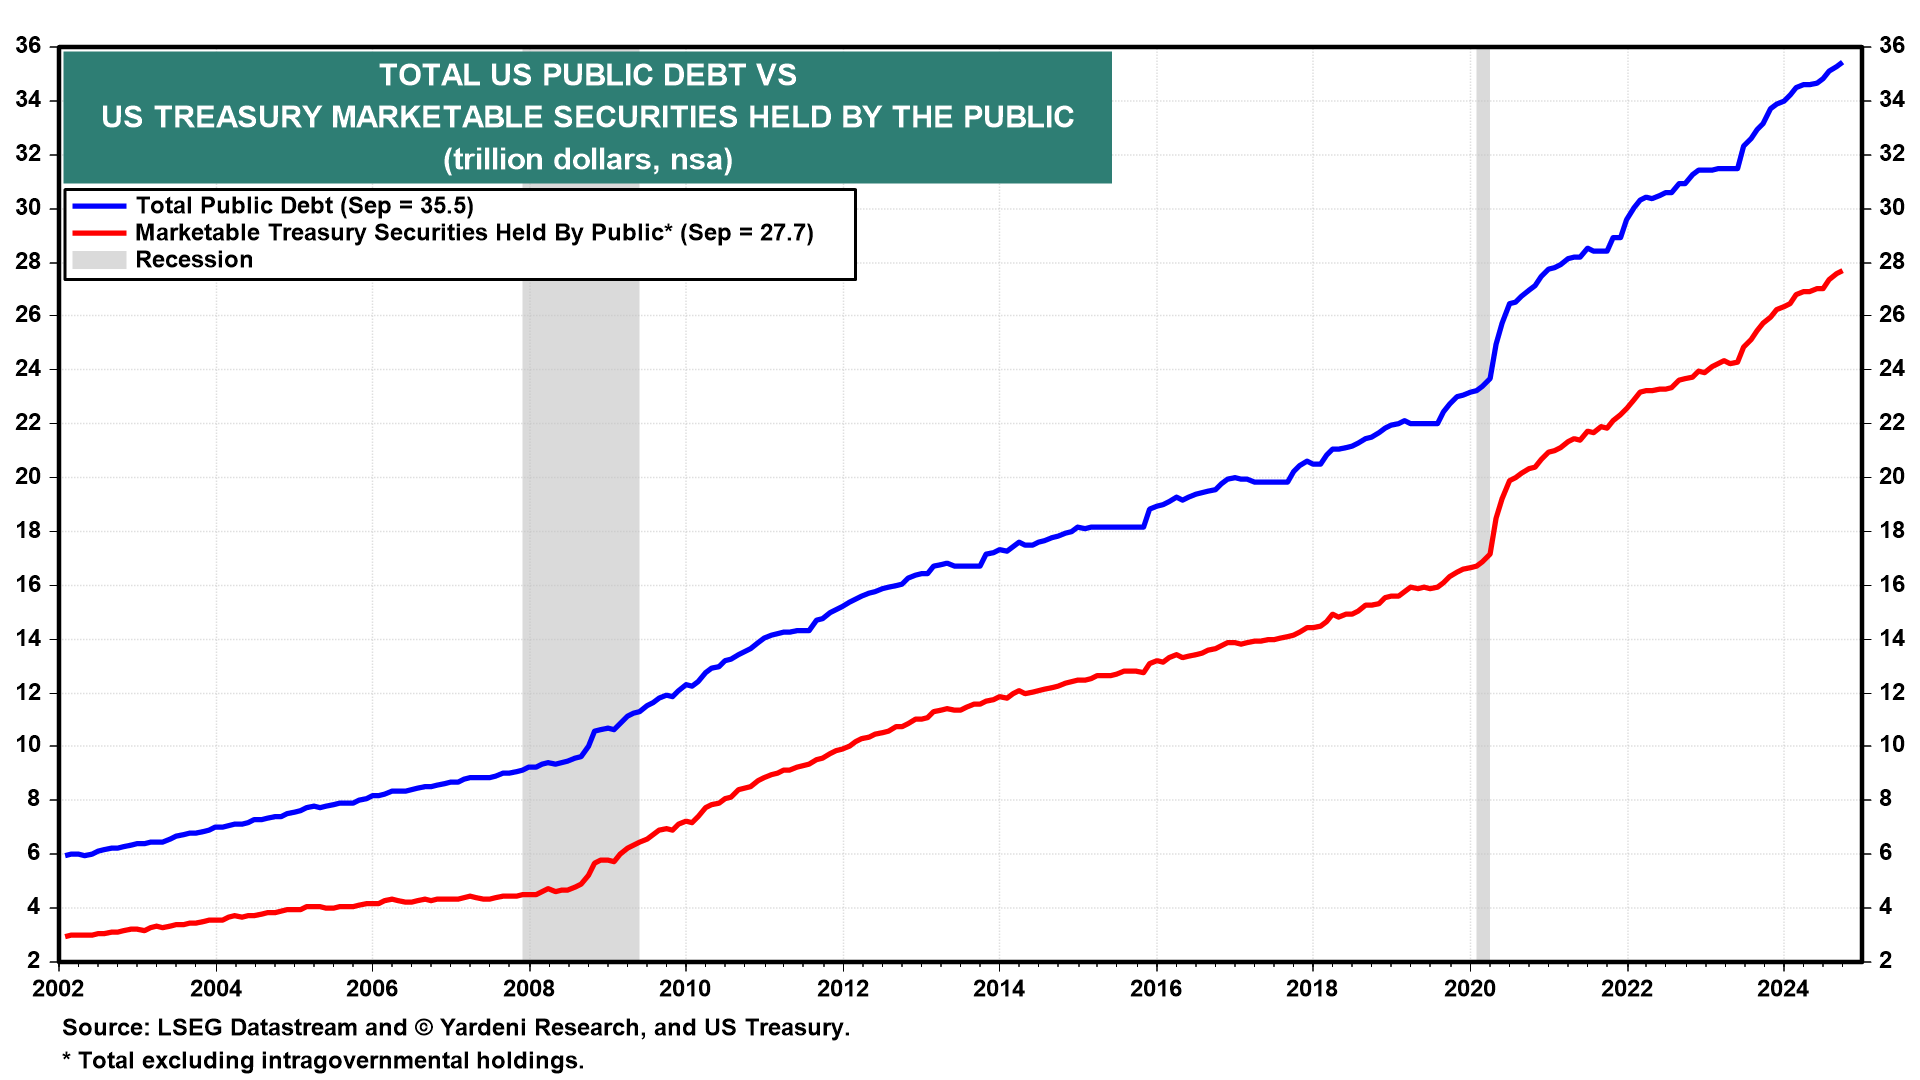
This announcement comes against a staggering national debt, currently at $35.5 trillion. This includes $27.7 trillion of US Treasury marketable debt and $7.2 trillion of intragovernmental holdings.
The latter represents the government's IOUs to itself, primarily resulting from borrowing from public trust funds like Social Security and Medicare.
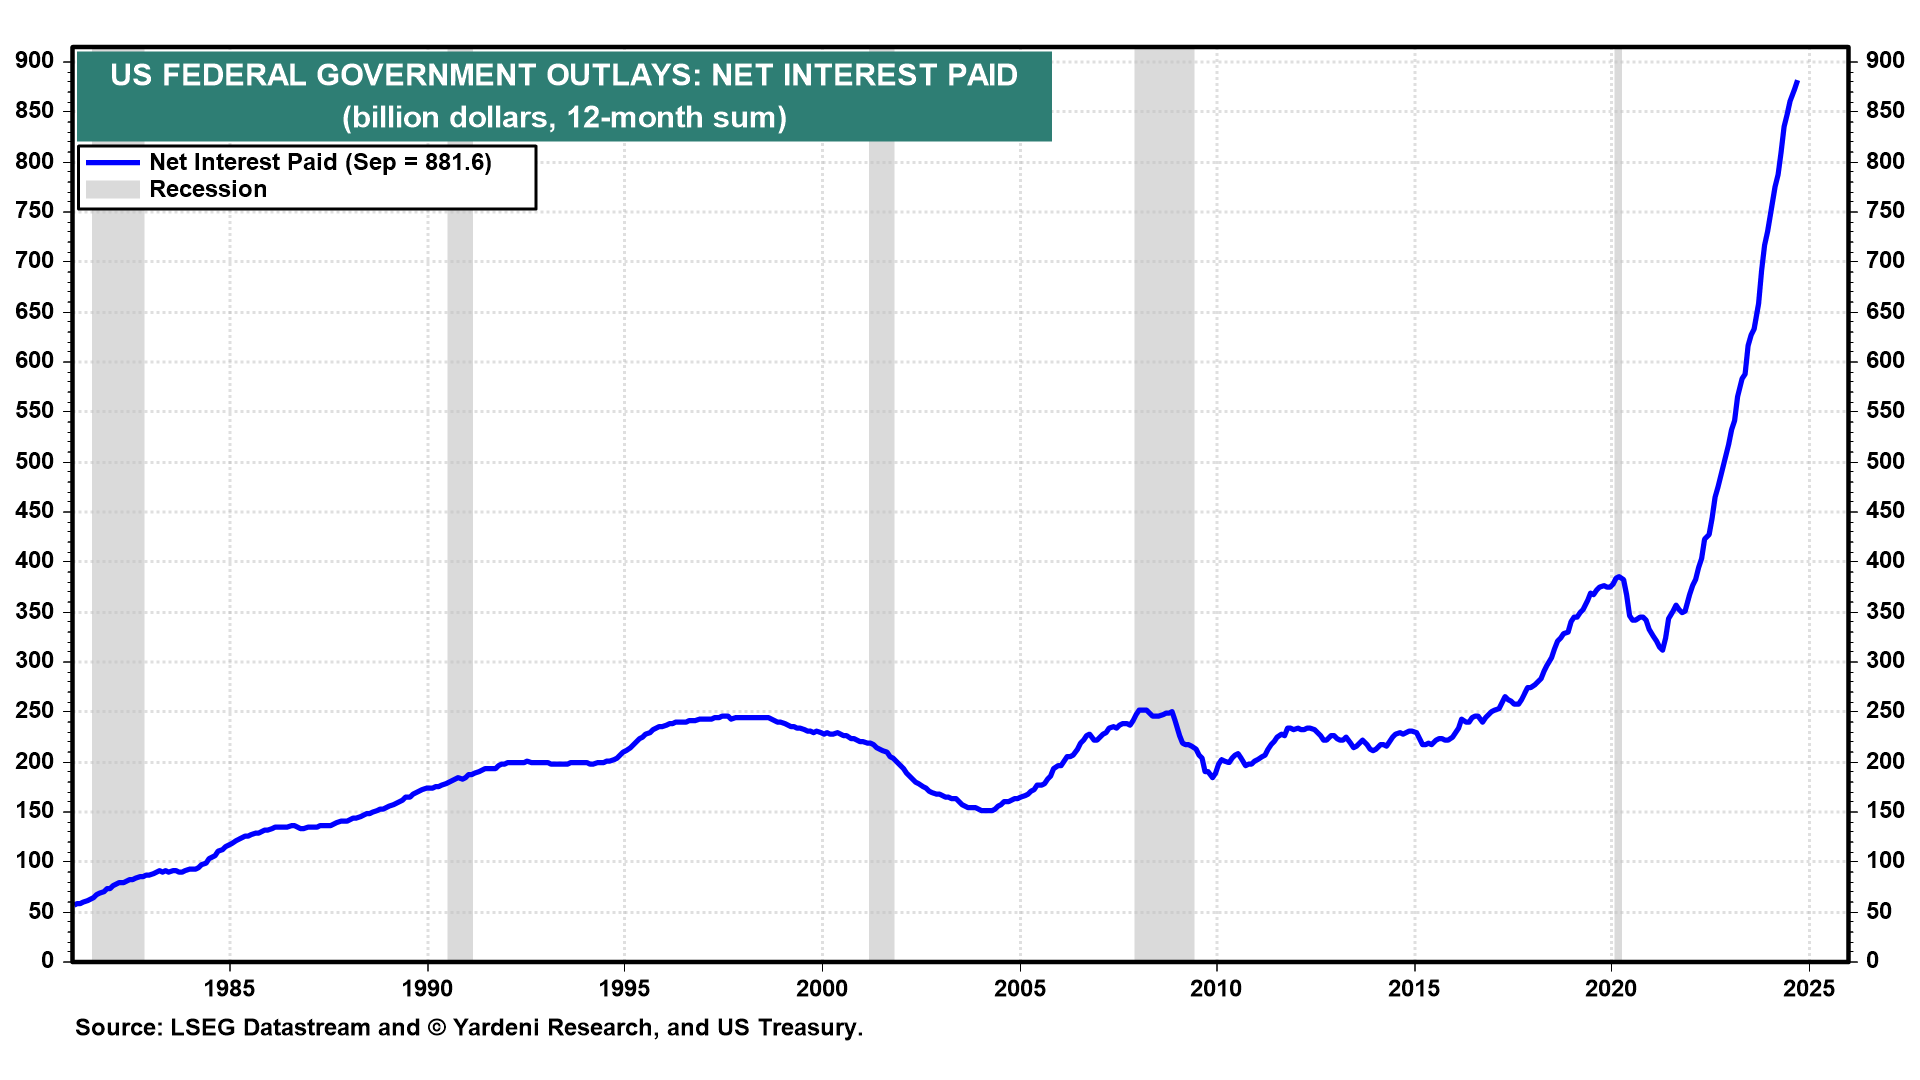
Alarmingly, this debt is projected to expand at an annual rate of over $1.0 trillion solely to cover the net interest outlays of the Treasury.
The Bond Vigilantes appear to be voting against the Fed's recent actions, particularly the 50 basis point rate cut on September 18. Their concern stems from the perception that the economy is already running hot and further easing could lead to overheating.
Fiscal Policy Concerns and Challenges
The Bond Vigilantes' reaction may also reflect apprehension about future fiscal policies, regardless of which party wins the upcoming elections. Some are concerned that continued expansionary budgetary policies could further inflate the substantial federal budget deficit and fuel inflation.
The next administration will face significant fiscal challenges, particularly regarding debt servicing:
The next administration will face net interest outlays of over $1 trillion on the ballooning federal debt.
This underscores the growing burden of interest payments on the federal debt, likely influencing future fiscal and monetary policy decisions.
Disinflation on Track
US September PCE core inflation came in at +0.3% vs +0.3% expected.
Prior m/m +0.1%
Unrounded core PCE was +0.254%
Core PCE +2.7% y/y vs +2.6% expected
Headline inflation PCE +2.1% y/y vs +2.1% expected (Prior +2.2, revised to +2.3%)
Deflator +0.2% m/m vs +0.2% expected
Unrounded +0.175% m/m vs +0.0907% prior
Consumer spending and income for August:
Personal income +0.3% vs +0.3% expected. Prior month +0.2%
Personal spending +0.5% vs +0.4% expected. Prior month +0.2% (revised to +0.3%)
Real personal spending +0.4% vs +0.1% prior (revised to +0.2%)
The unrounded numbers reveal softer inflation than the headlines, particularly on core m/m, which was very close to being reported as +0.2%. Meanwhile, the consumption numbers were solid.
The Fed should be on track to continue to lower interest rates in each of the following three meetings.
In a scenario like this, I prefer megacap stocks and related ETFs, as well as Bitcoin over government bonds.

(3) US Stock Markets: Solid Earnings From the Mag-5 Failed to Drive The Market Up
Meta: Revenue in line, earnings above consensus, guidance consistent.
Microsoft: Revenue slightly above, earnings in line, guidance below consensus.
Alphabet: Revenue and earnings in line or slightly above consensus, guidance on capital spending but not detailed on revenue.
Amazon: Revenue slightly below consensus, earnings in line or slightly below, guidance generally in line.
Apple: Revenue and earnings in line or slightly below consensus, cautious guidance on iPhone sales.
Meta (META)
Revenue: Reported $41 billion, approximately in line with expectations of $40.25 billion.
Earnings: Statutory earnings per share (EPS) of $6.03, beating analyst predictions by 14%.
Guidance: Meta raised its capital expenditure guidance 2024 to between $38 billion and $40 billion and expects significant acceleration in 2025. Revenue guidance for the fourth quarter is between $45 billion and $48 billion, consistent with analyst expectations
Microsoft (MSFT)
Revenue: Reported $65.685 billion, slightly above consensus estimates.
Earnings: Net income of $24.667 billion, with EPS beating some estimates but overall in line with expectations.
Guidance: Microsoft's forecast for the next quarter fell short of analyst estimates, with anticipated revenue between $68.1 billion and $69.1 billion, compared to the expected $69.83 billion
Alphabet (GOOG, GOOGL)
Revenue: Expected to rise over 12% year-over-year to $86.41 billion, generally in line with consensus estimates.
Earnings: Net income expected to increase to $23.03 billion, or $1.85 per share, up from $1.55 per share in Q3 2023, meeting or slightly exceeding expectations.
Guidance: Alphabet expects higher capital spending in 2025 compared to the current year, but specific revenue and earnings guidance for the next quarter is not detailed in the sources
Amazon (AMZN)
Revenue: Reported revenue between $154 billion and $158 billion for Q3, aiming for approximately 9.5% growth, slightly below the double-digit growth many analysts had hoped for.
Earnings: EPS of $1.14, which aligns with or is slightly below some analyst expectations.
Guidance: Amazon expects to spend about $75 billion in capital expenditures for 2024 and has already spent $51.9 billion. The company's revenue guidance for the next quarter generally aligns with expectations but is slightly below some analysts’ hopes for double-digit growth.
Apple (AAPL)
Revenue: Apple reported earnings and revenue that were generally in line with or slightly below expectations. The company gave a cautious iPhone forecast.
Earnings: Net income declined due to a European tax-related payment, and services revenue missed estimates.
Guidance: The company's cautious iPhone forecast suggests some caution in future growth expectations
The final quarter of the calendar year has historically been the best quarter of the SP 500. December, April, and November have been the three best months of a calendar year.
On average, the 2-monthly period from November until December is also the best bi-monthly period of a calendar year.
Except for 2016, when Donald Trump won the presidential elections for the first time, price action has been positive since 2013.

Over the past ten years, the average performance of the S&P 500 during November and December was approximately 4.41%.
Data shows that during election years, the S&P 500 has historically underperformed in the September-to-early-November period compared to non-election years.

The best day of a calendar year has historically been October 28. The final ten days of November have been the best ten-day streak of the calendary year historically.
Nvidia is scheduled to report earnings on 20 November 2024 after market close. The report will be for the fiscal quarter ending Oct 2024.
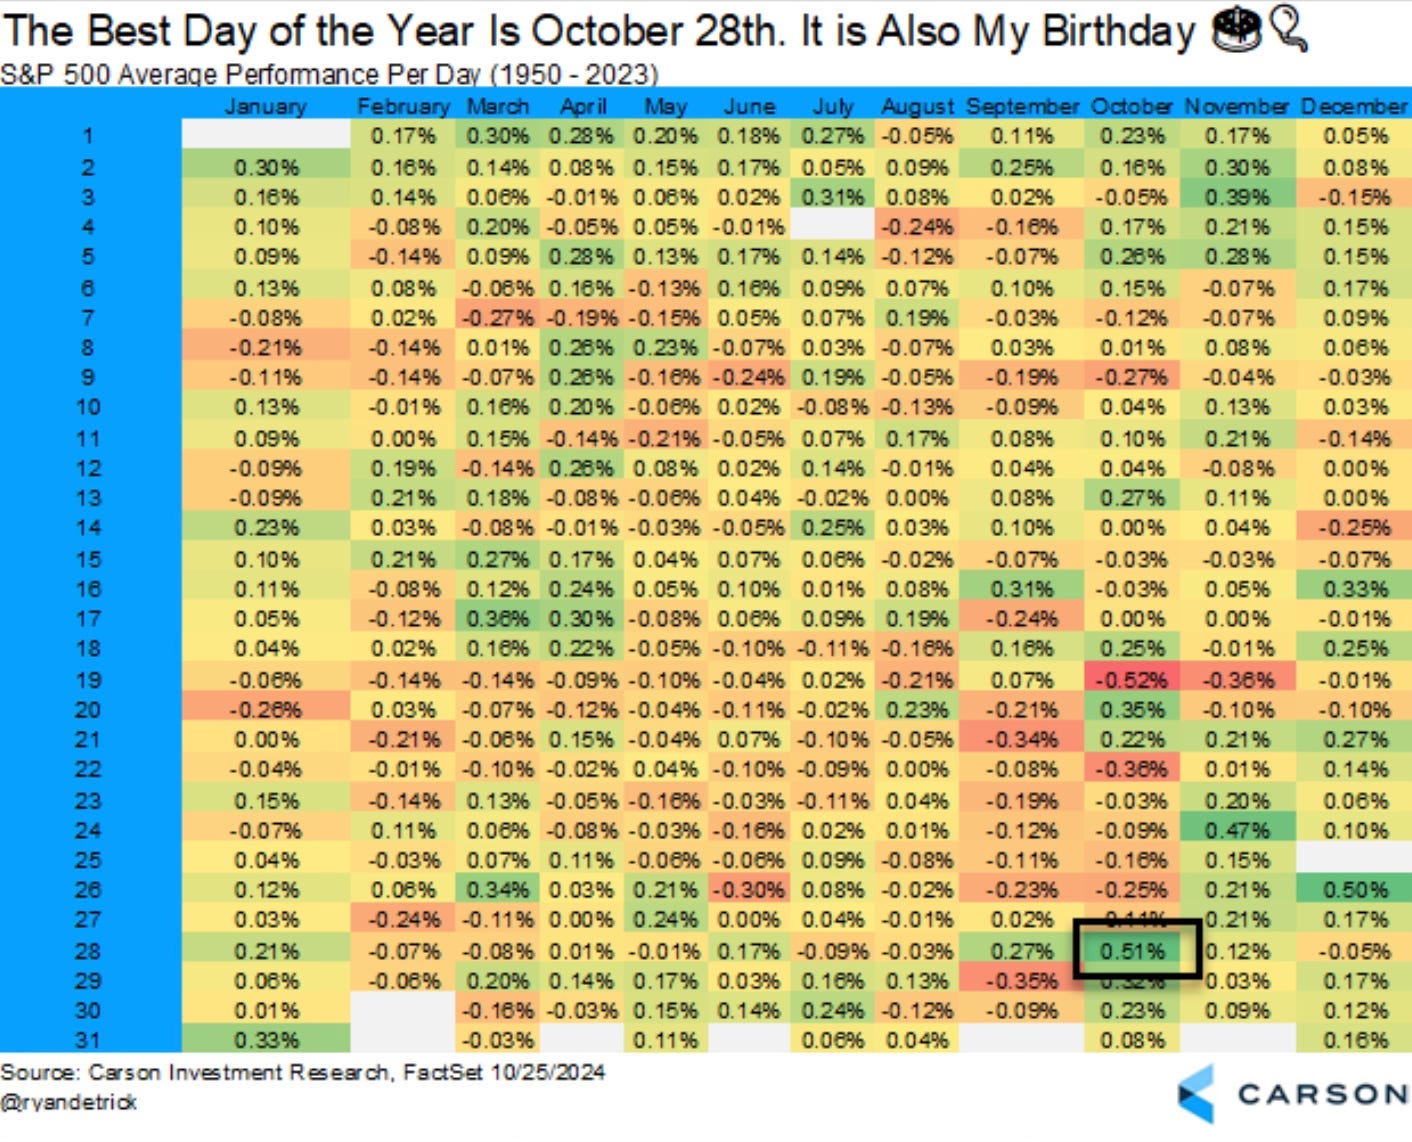
The table above is from Carson Investment Research.
(4) US Stock Markets: The Trend Is Your Friend Until It Is No More
The trend is your friend until it is no more - until a significant trend line has been broken and a trend reversal may have occurred. We may have witnessed the beginnings of this last week.

The Nasdaq 100 long-term bullish trend is intact. The index closed the last of the three gaps (bearish break-away, continuation gap, and exhaustion gap) since the summer of 2024 and failed to reach a new ATH.

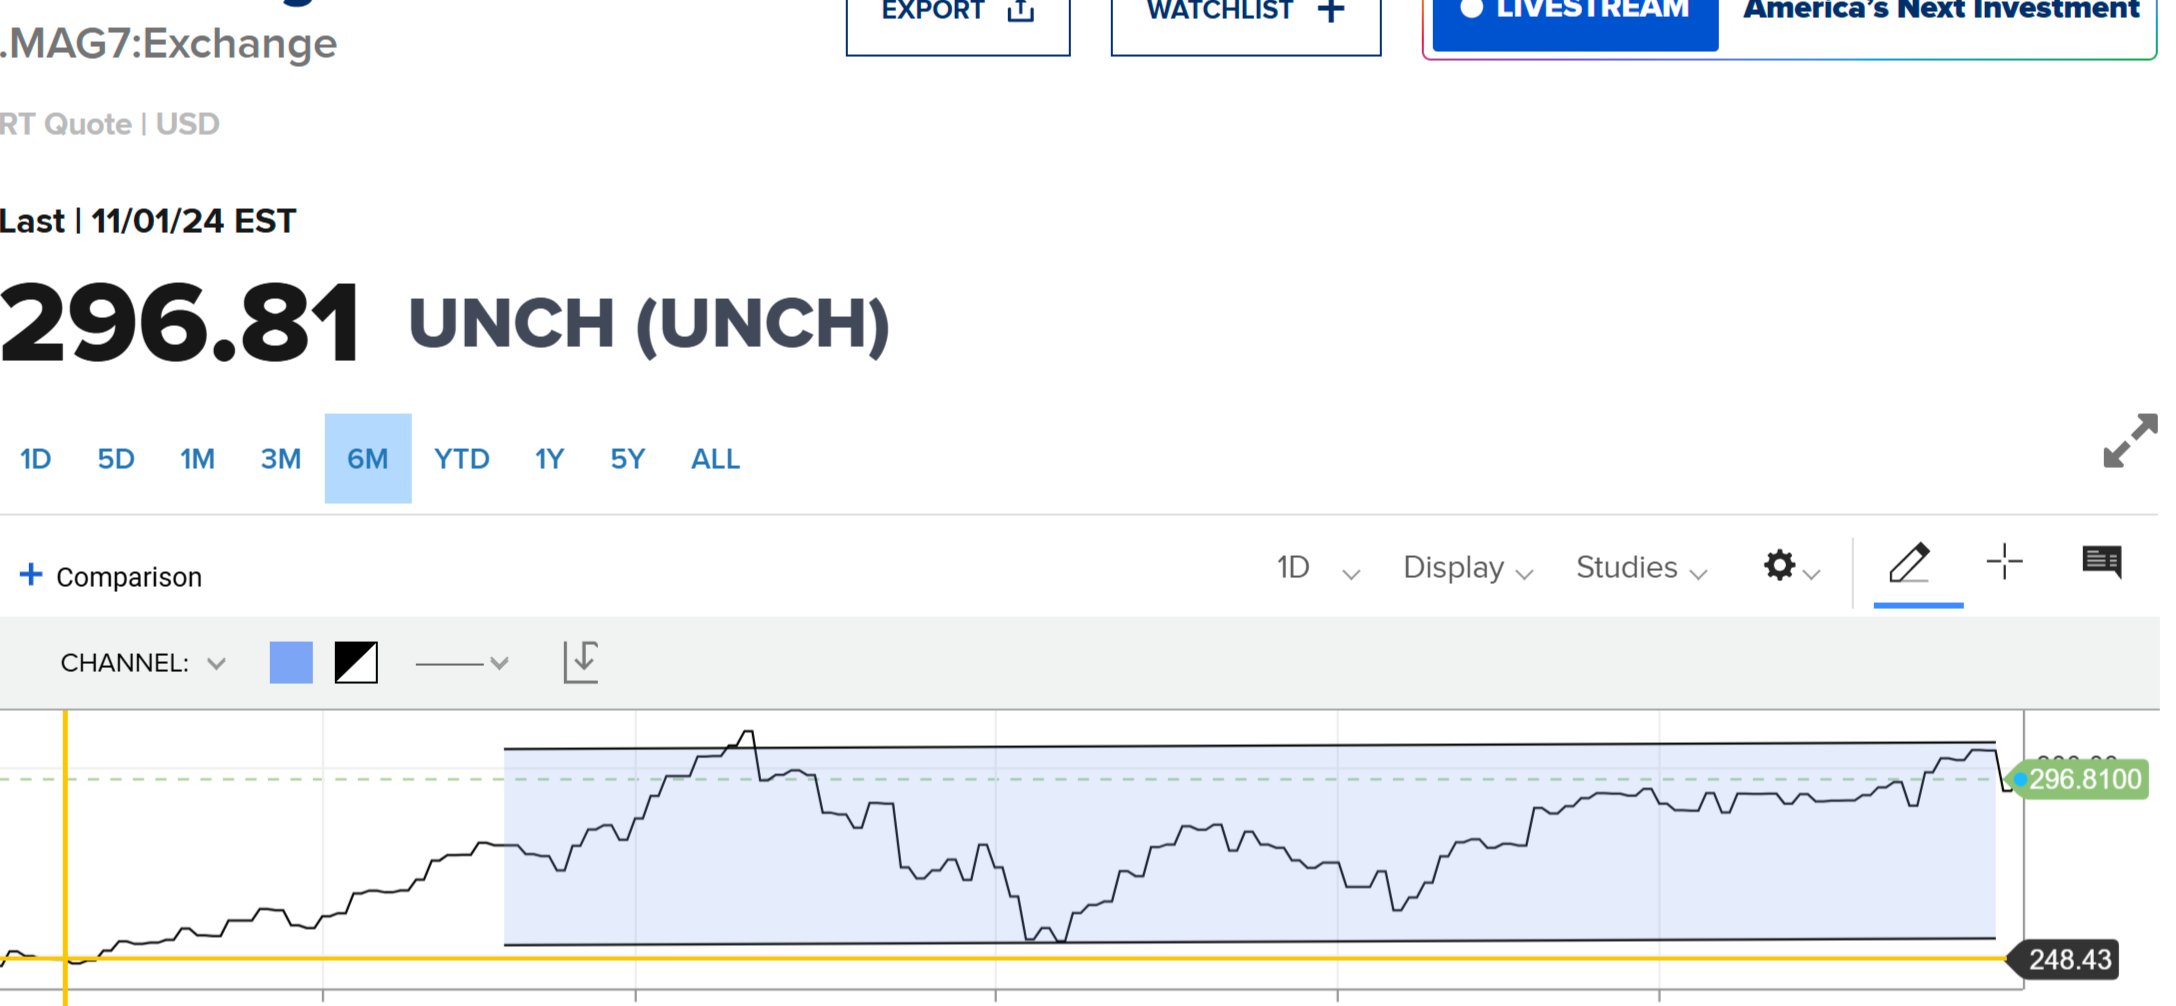
The Mag-7 index also failed to make a new ATH but performed better than the Nasdaq or Nasdaq 100.
Unless there is a bad earnings print from Nvidia, I expect the outperformance of the Mag-7 stocks to resume in a higher yield environment.
(5) Long-Term Analysis: Elliott Waves - Nasdaq 100
Nasdaq 100 has been in a bull market since autumn 2022. It may have completed nine waves up.
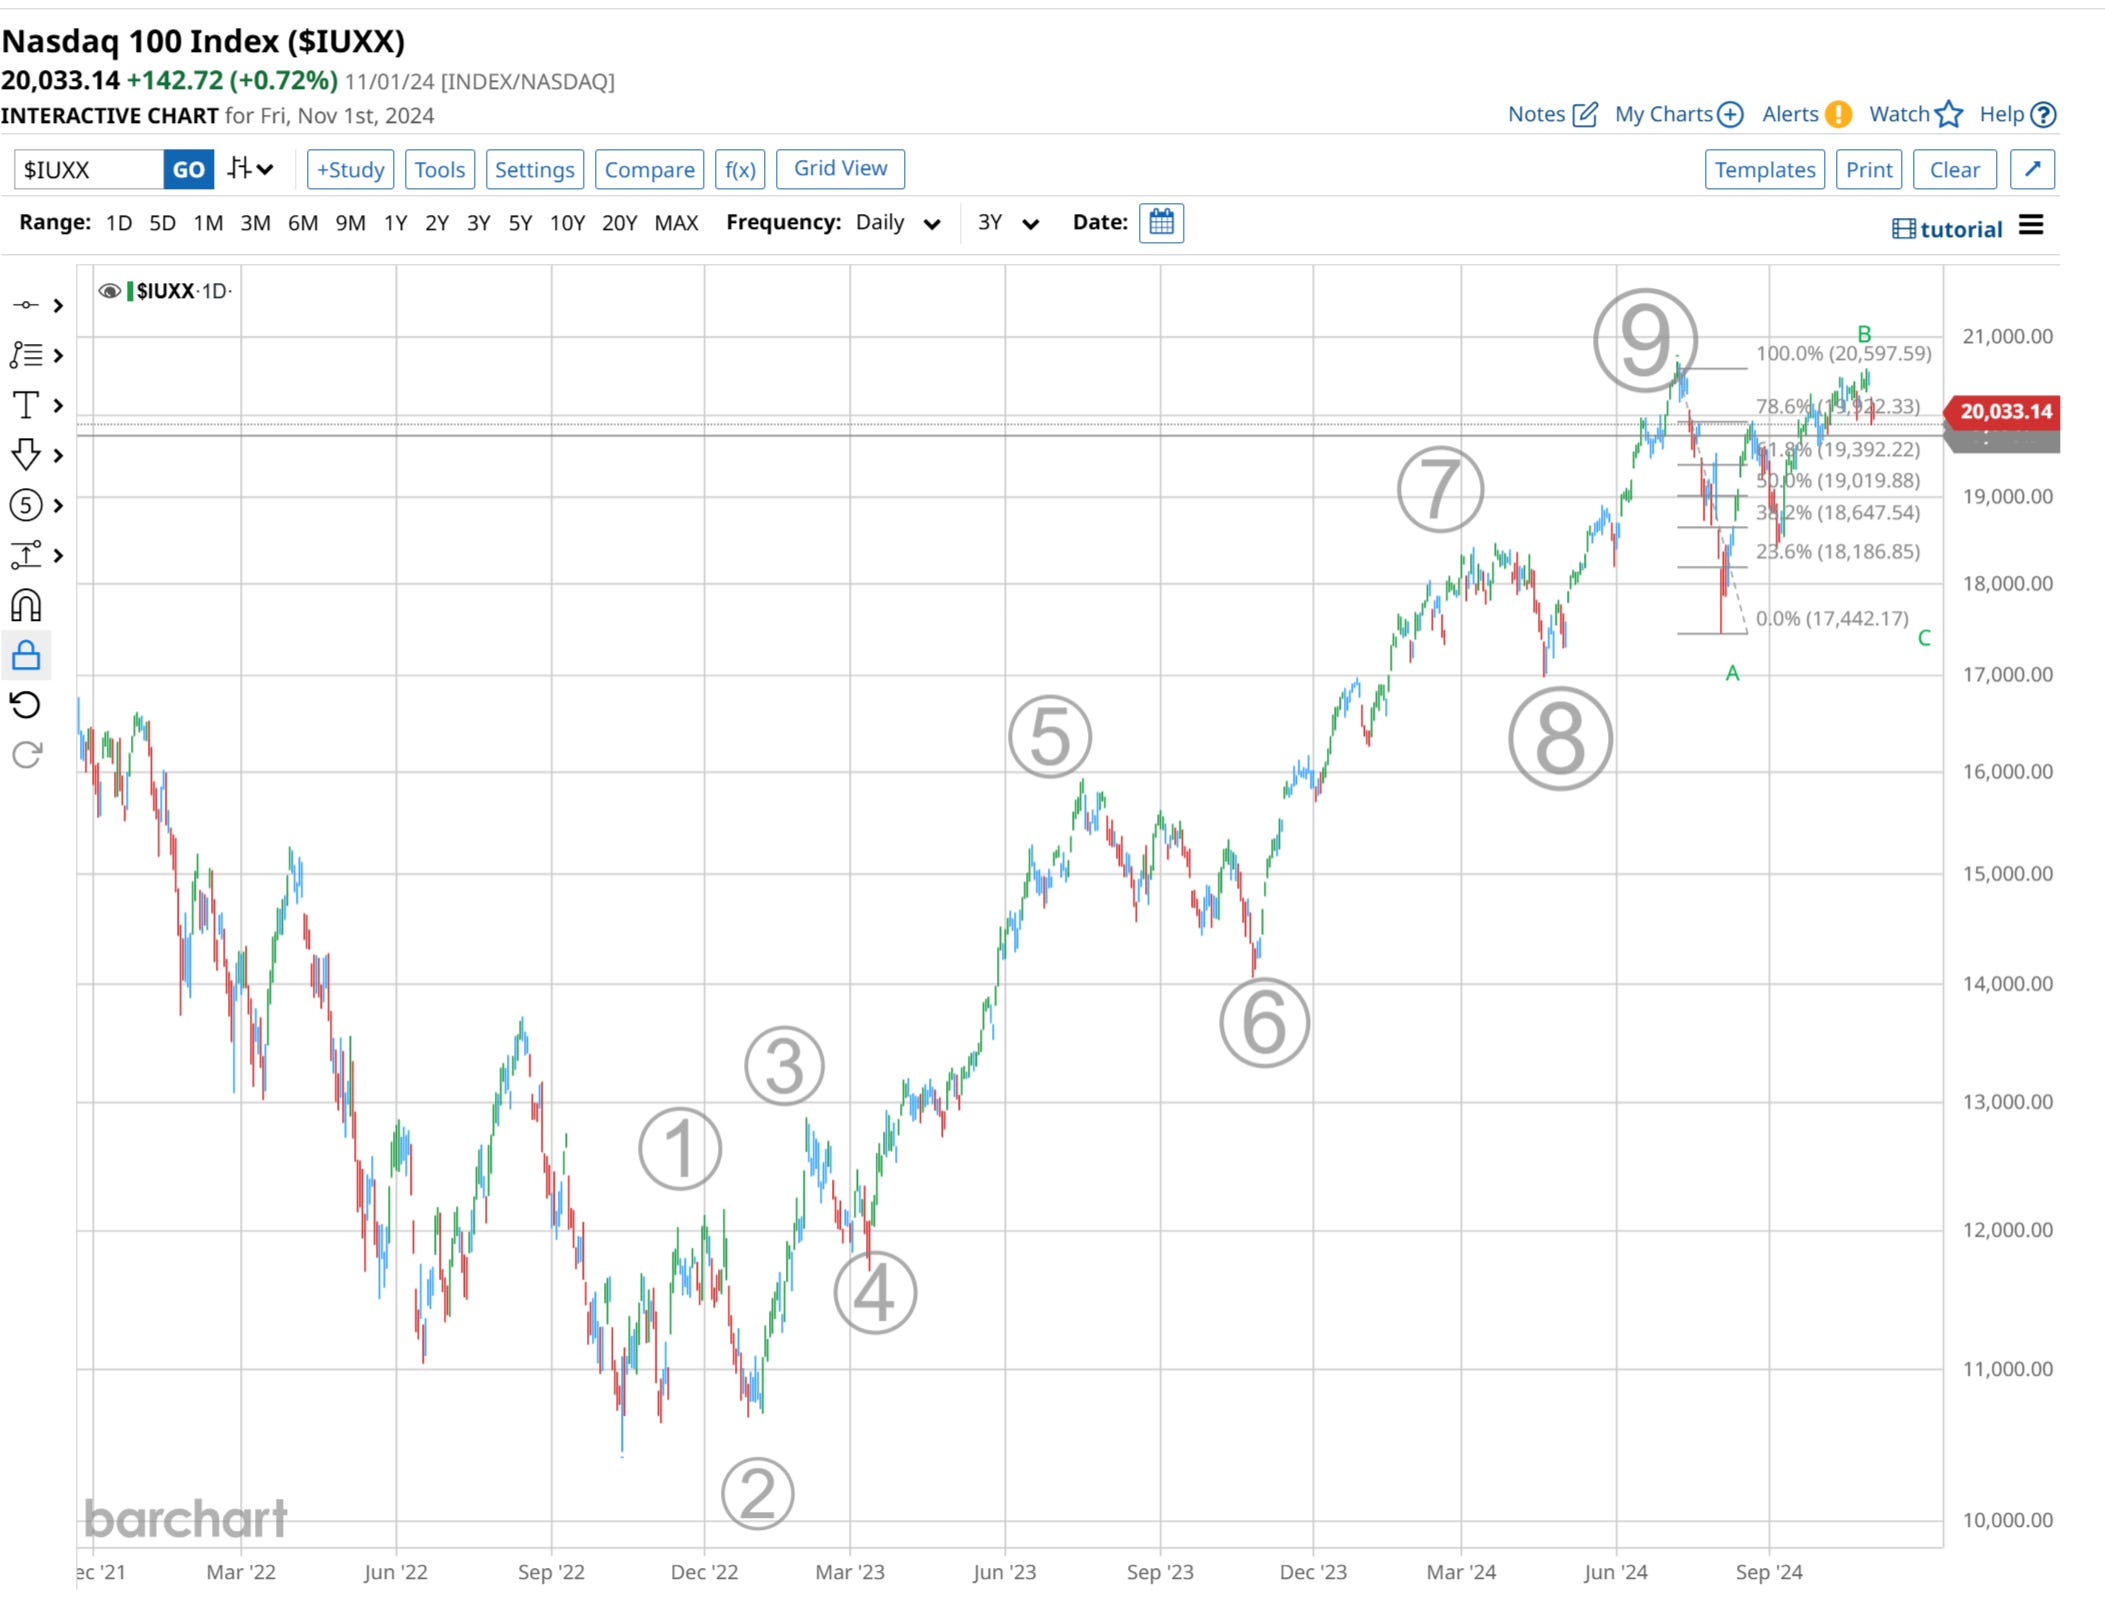
The current move until last week's top looks like a wave b. Contrary to popular belief, we may see no year-end rally starting directly after the election but rather a wave c and a test of the August lows first.
The year-end rally may start on November 20 when Nvidia reports earnings.
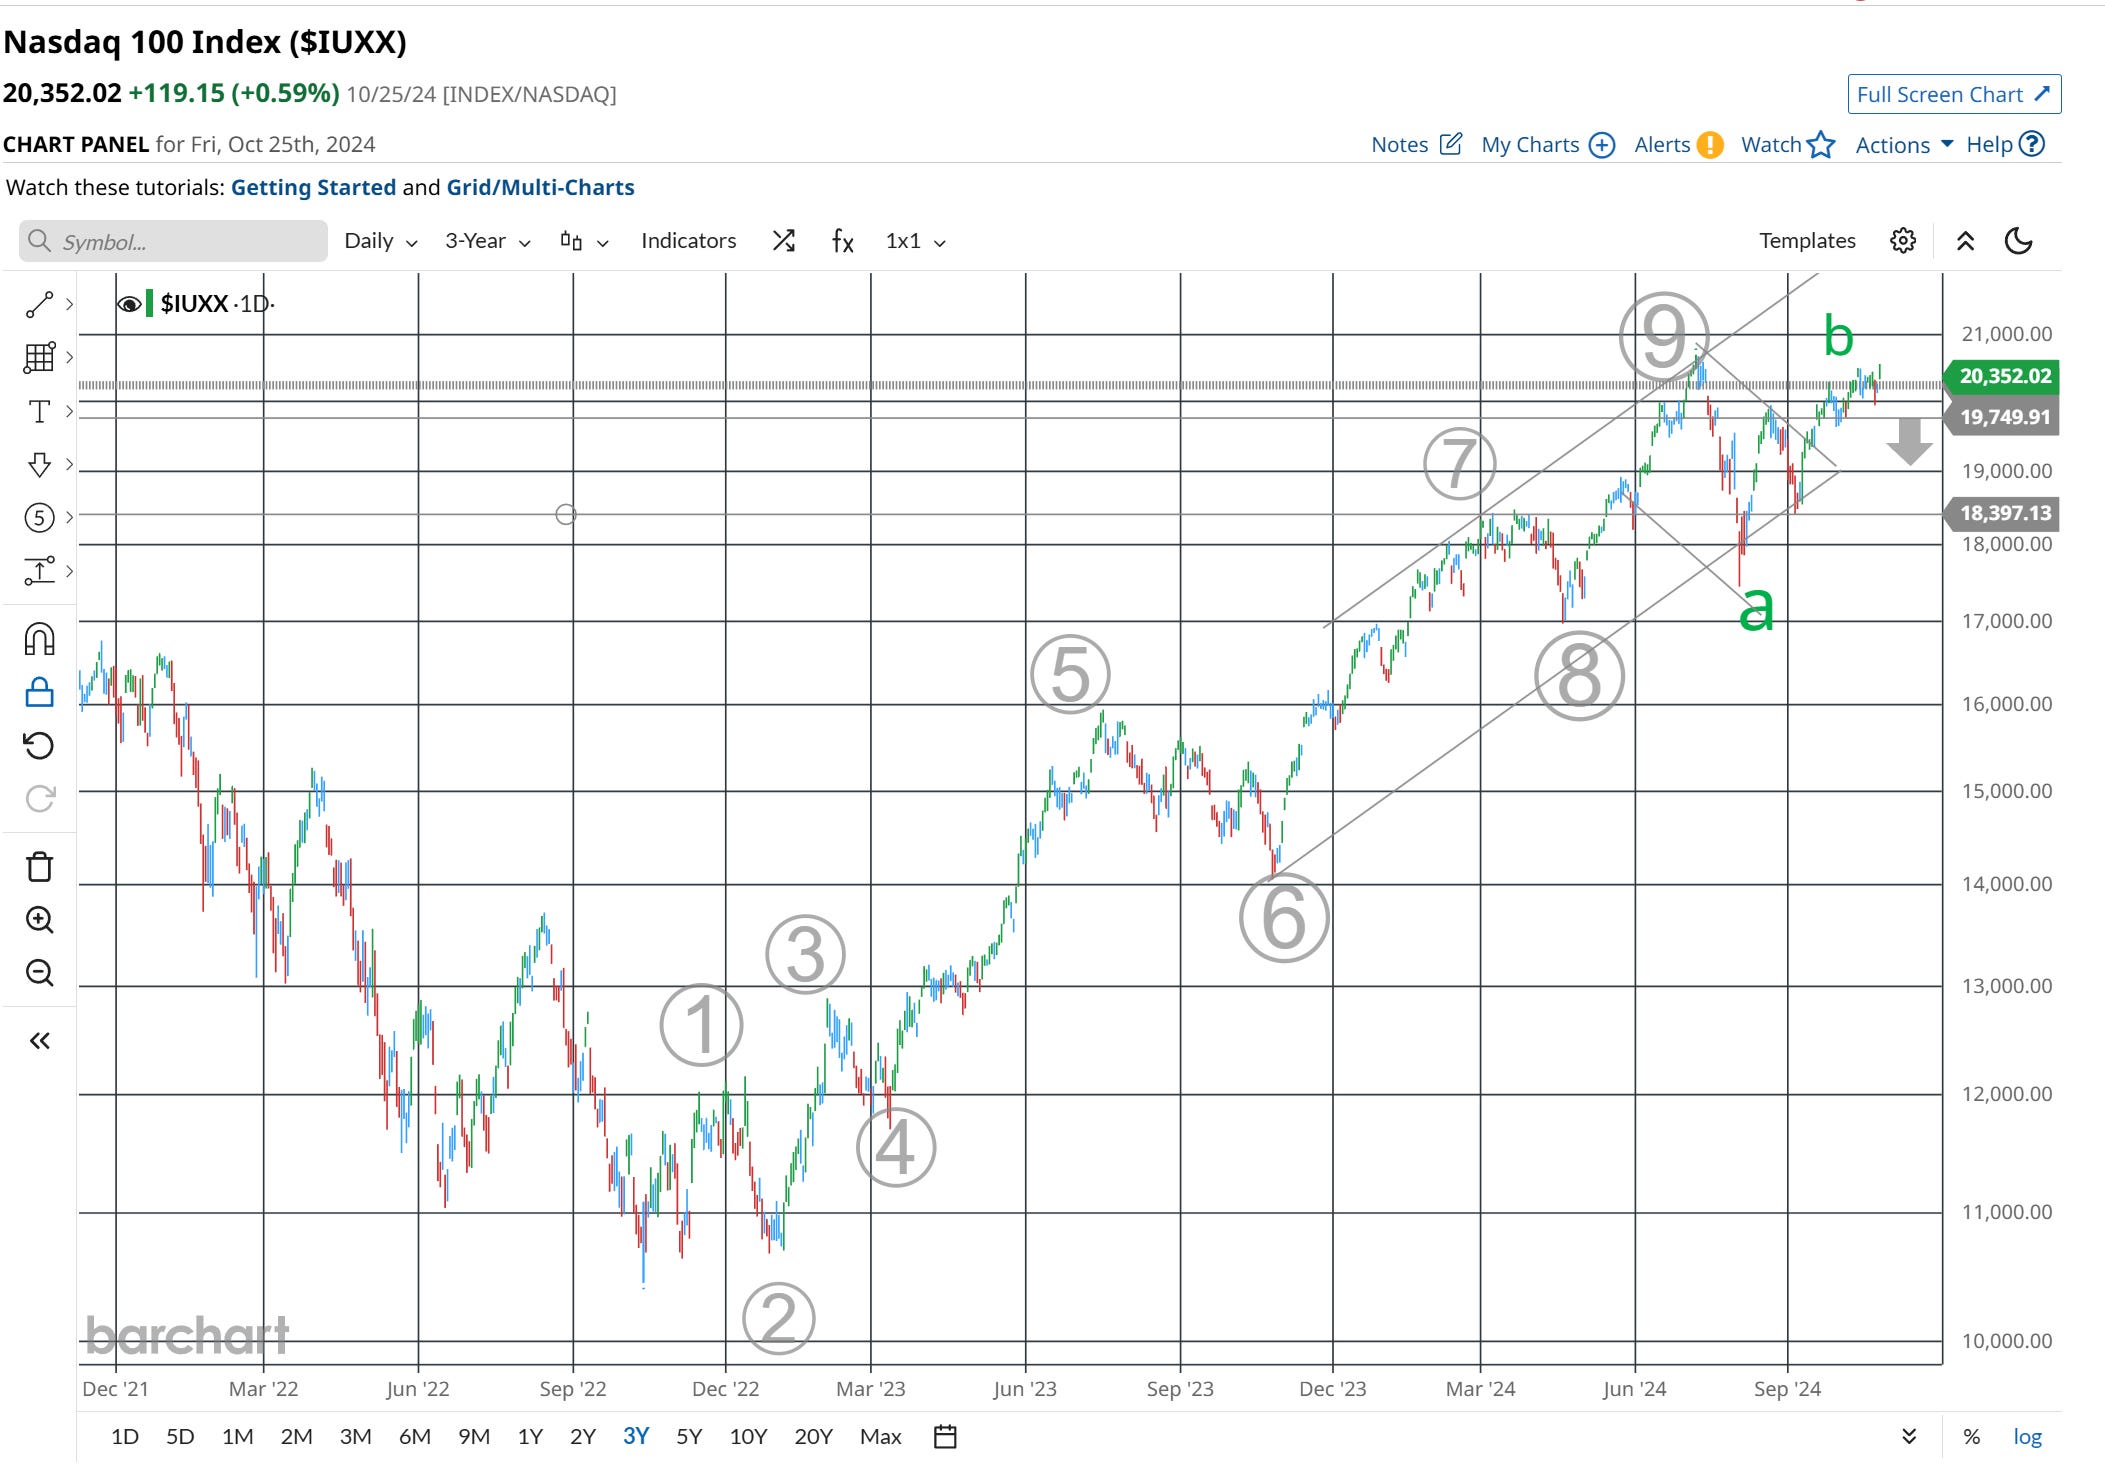
The chart below shows some Fibonacci levels that may become important again.

The chart below shows Fibonacci fans and their alignment with different trend channels.

The chart below shows my preferred Elliott wave count for the Nasdaq 100.

In this scenario, a final leg up now would lead to a larger consolidation pattern in early 2025.
