
Weekly Signal — TLT: The Crowded Trade
Week of Mon 25 May 2026 · Feature instrument: TLT (iShares 20+ Year Treasury Bond ETF)
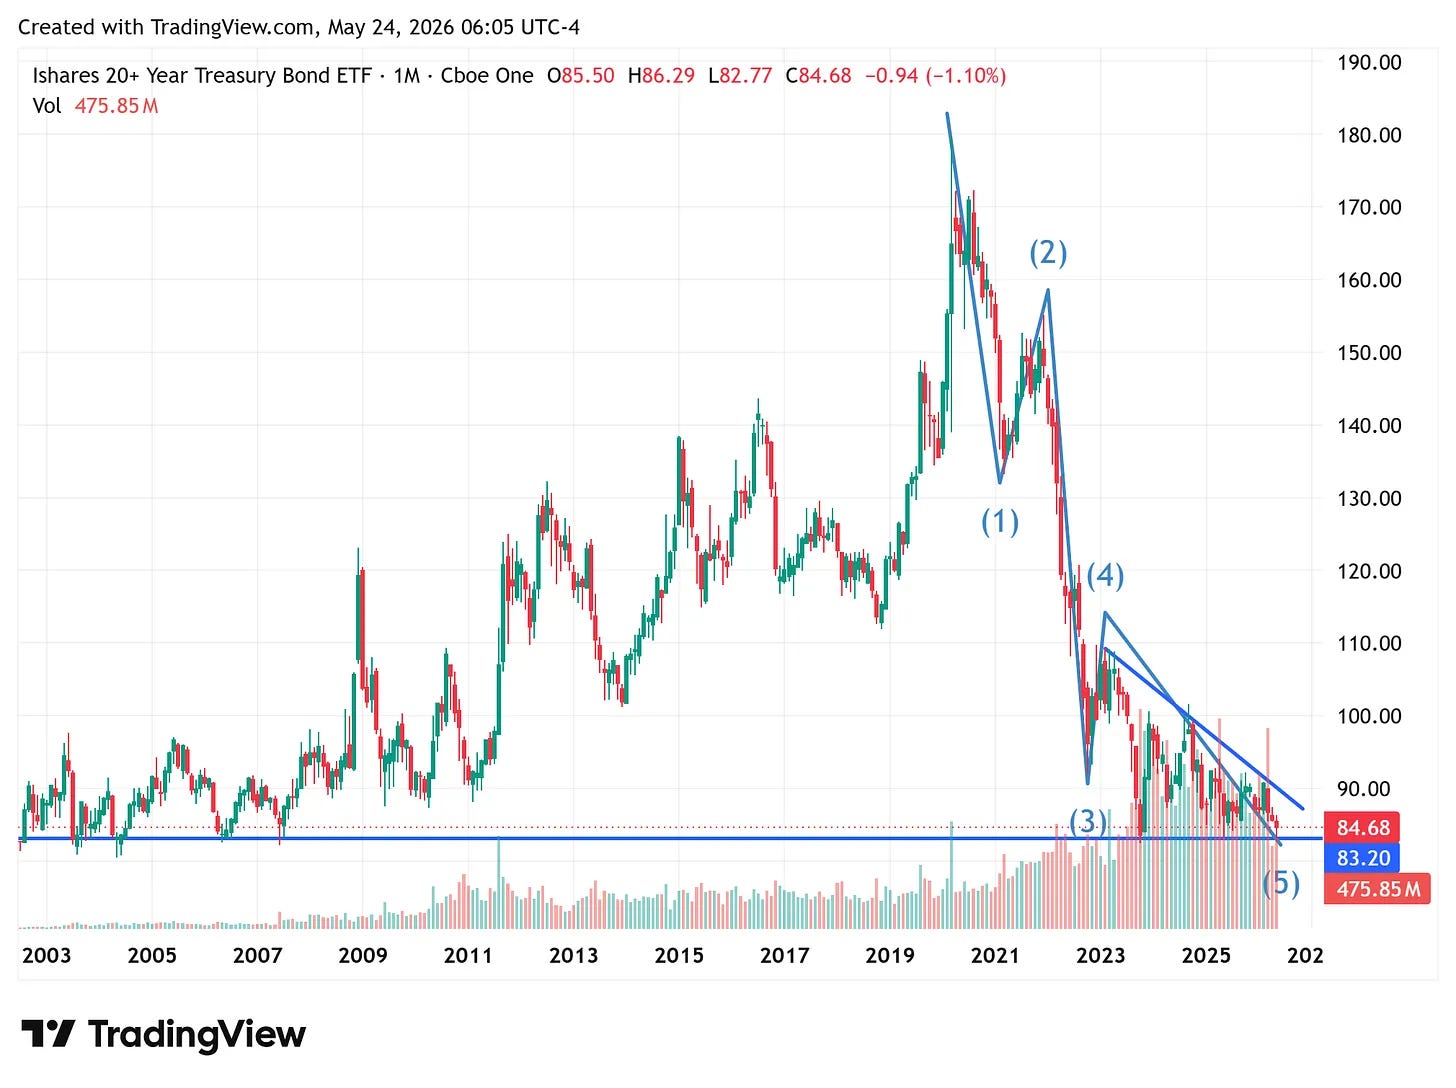
TLT, monthly. A five-wave decline from the 2020 high (~180); wave (5) is testing the wave (3) low at ~83 — the line in the sand. Source: TradingView, 24 May 2026.
Signal of the week: The whole thesis fits on one number. Hold 83 on a monthly close, and long-duration Treasuries may be carving a major bottom. Break it decisively, and the message flips to a durable inflationary regime. The bottom isn’t validated yet — but with the rate-sensitive cohort refusing to break, the contrarian case is gaining credibility.
Aggregate read: 🟡 Contested — long-duration bottoming watch. The cross-asset evidence is firmly on the bottoming side; the hold-out is TLT’s own price, which still has to defend 83 on a monthly close. A regime-decision week, not a regime-confirmation week.
The Grid (L1–L3)
Directional read drawn from the tape and the chart. Numeric scores plug in from the data lake.
* Sentiment is scored on the contrarian axis: extreme one-sided positioning reads as opportunity, not trend confirmation. A reader used to the trend frame should know the sign is deliberately flipped here.
L1 · Regime
The market is priced for a durable higher-rates world. The internal evidence is ambiguous. That makes this a week where the regime is decided, not confirmed — and the deciding level is published below.
L2 · Trend (Structure)
A five-wave decline from the 2020 high (~180). The count is valid: wave (4) (~115) stays below the wave (1) low (~132), so there’s no overlap. Wave (5) is testing the wave (3) low rather than extending decisively through it — the classic shape of a fifth that runs out of sellers.
L3 · Health (Cross-Asset)
This is the spine of the contrarian case, and it’s a cohort signal — not a single index. The most rate-sensitive corners of the equity market are the canaries: small caps, real estate, regional banks. In a genuine higher-for-longer regime they break first, because they’re the most funding-cost-sensitive. They are not breaking. The Russell 2000 is the best major index over 52 weeks, YTD and the last month; REITs aren’t crashing; small and regional banks aren’t either. The cohort that should be weakest if a high-rate regime were arriving is instead behaving as if the peak in rates is already in. The equity market is voting against the inflation headline.
Russell 2000 (IWM), intraday, 18–22 May. Small caps rallied off ~270 to clear 282.49 and hold near 285 — the rate-sensitive cohort leading, not breaking. Source: Barchart, 22 May 2026.
L4 · Context
The “higher rates” trade has become obvious — maybe too obvious. Everyone can see the same thing now: sticky inflation, rising yields, pressure on long duration. It’s a clean macro thesis, but a very crowded one. That is exactly why TLT is interesting here: the chart may be saying something different from the narrative.
L5 · Timing
The monthly close versus 83 is the only trigger that counts. The intramonth reclaim of 84 doesn’t confirm a bottom, but it does suggest sellers failed to break the key level when they had the chance. Same with the latest Japanese inflation print (timestamp / source before publishing) — inflation is still the headline, but markets often turn before the story does.
L6 · Decision — The Line in the Sand
• Hold 83 (monthly close): Constructive. Wave (5) testing the wave (3) low, sellers failing at the level → long-duration bottoming setup, contrarian to the crowd.
• Decisive break below 83: Thesis invalidated. The message changes to a more durable inflationary regime where long bonds stay under pressure → favour short duration, real assets, equities-over-bonds.
L7 · Risk
Invalidation is a clean monthly close below 83. Beyond that: Elliott counts are discretionary; small-cap leadership has alternate explanations (risk-on rotation, squeeze) that aren’t a rates call; and the crowd may simply be right. For now the crowd is still focused on higher rates — but the chart may already be whispering: be careful.
For all Weekly Signals, turn to closelook.net/weekly.
Closelook Weekly Signal — analytical framework, skin in the game, reference portfolios. Not investment advice.


