


Closelooknet is a reader-supported publication — to receive new posts and support the work, become a free or paid subscriber.
This week’s edition of Closelook@Global Stock Markets is dated July 11, 2026.
Last week, we showed you that the ex-US rally is six regions wearing a twenty-six-region costume — a concentrated AI-chip bet led by Taiwan and Korea. This week, we follow the money to show why it looks that way: we trace what happens to every $100 the hyperscalers spend, how much of it lands in Asia, and which two buckets within the AI rack account for three-quarters of the bill. The market spent the week drawing the same map — and concluded by taking Korea’s champion to New York.
1 · This Week’s Action
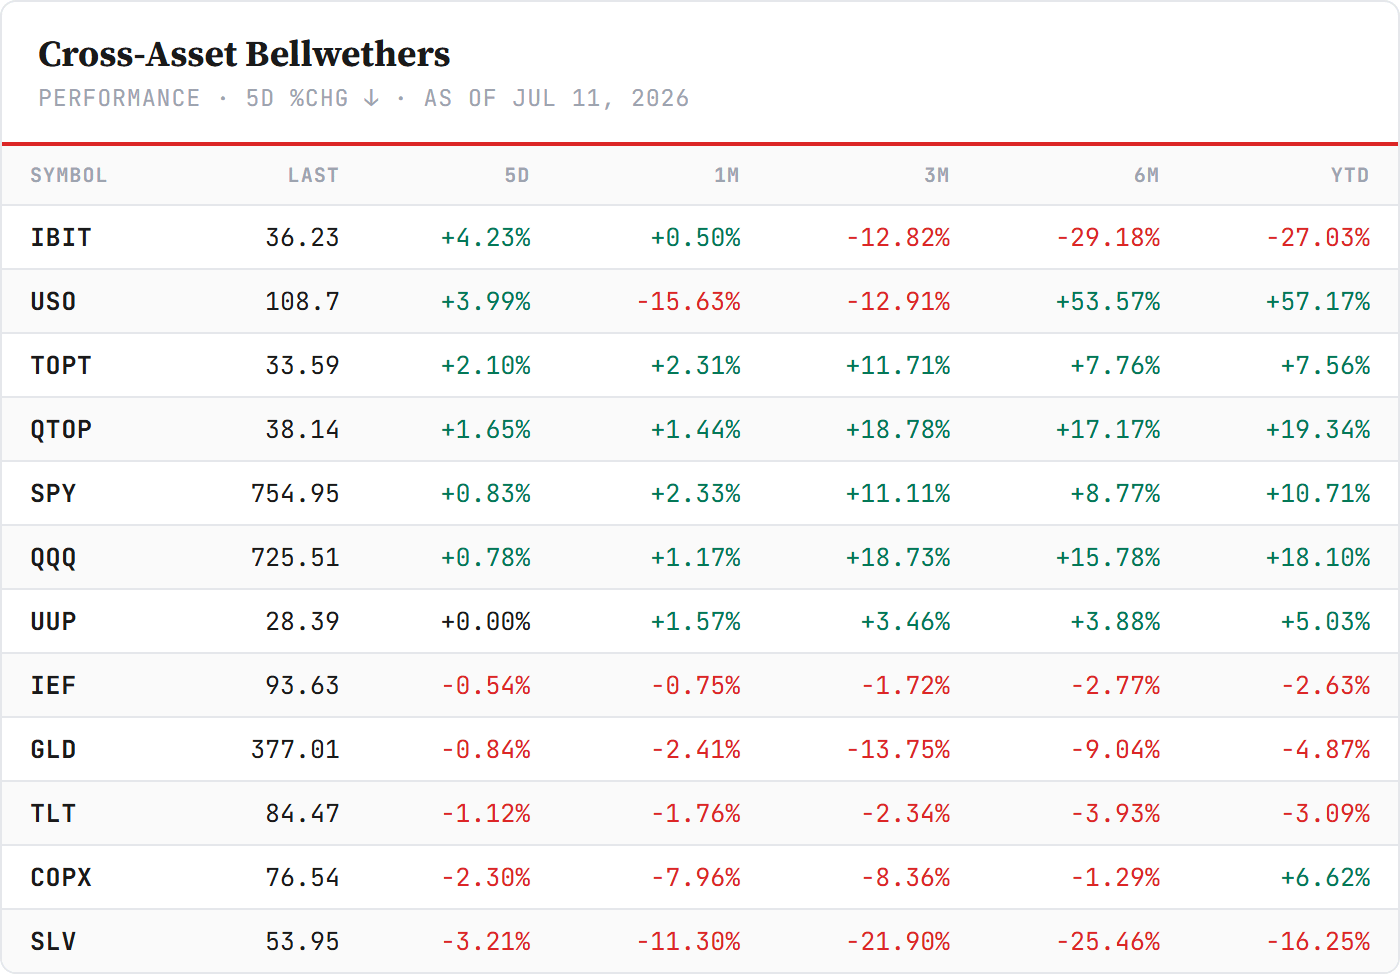
The cross-asset backdrop. The board reads risk-on with a commodity accent. Oil led the week (USO +4.0%, now +57% year-to-date) — the “oil isn’t buying the war” read of recent weeks got at least a partial rebuttal. Bitcoin continued its repair (IBIT +4.2%), and the mega-cap concentrates outran the broad market (TOPT +2.1%, QTOP +1.7%, against SPY +0.8%). On the other side, gold eased 0.8% but held comfortably above the 4,000 belief line, and the long end sold off again (TLT −1.1%) after the hawkish minutes. The rates question is not resolved — it is just not this week’s headline.
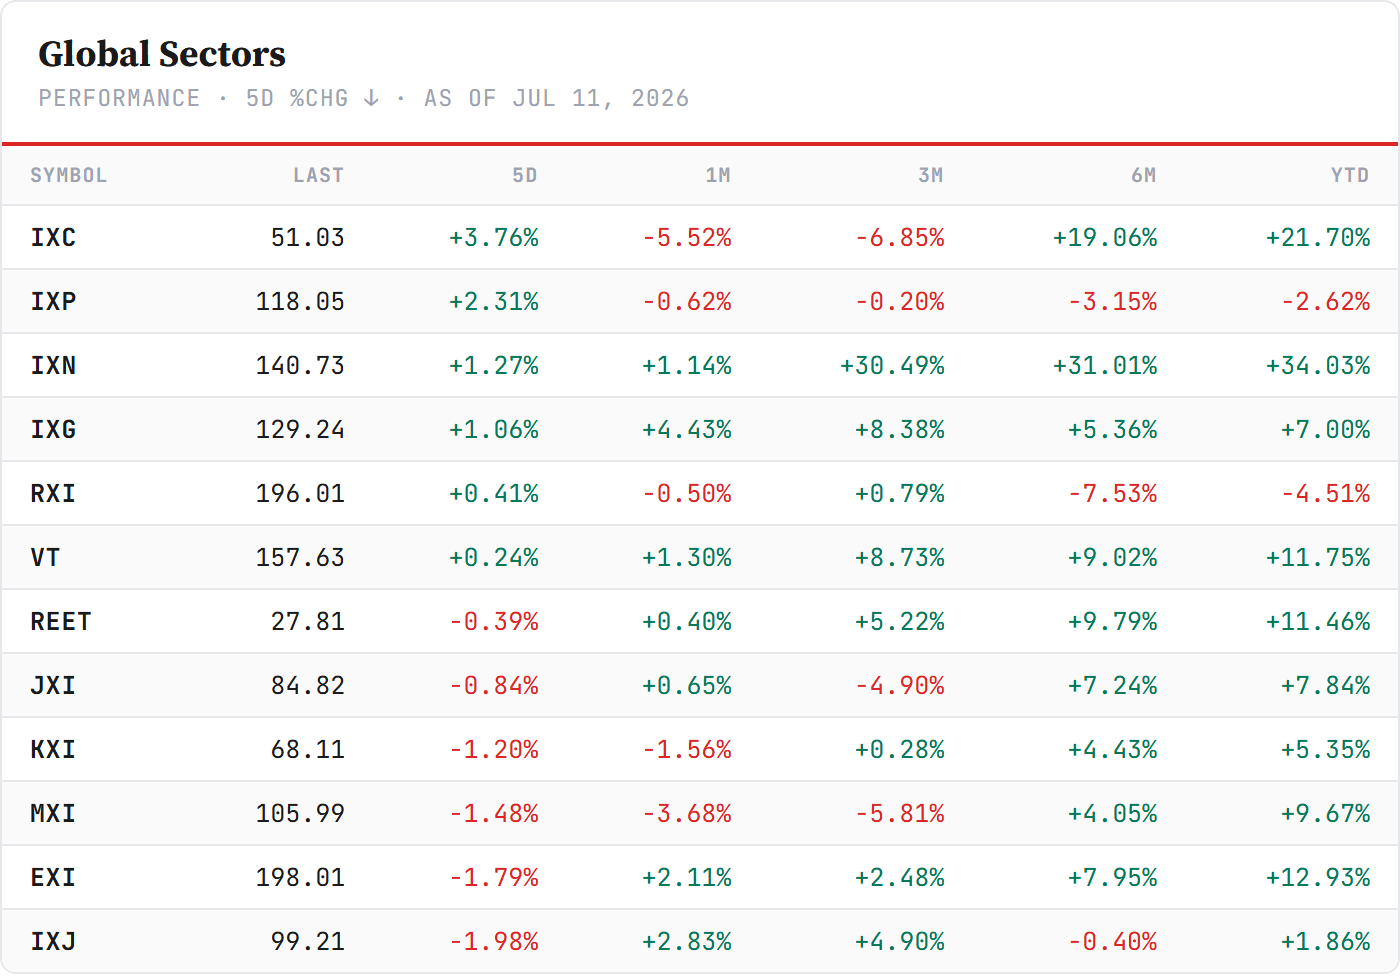
The global sectors. Energy led (+3.8%) as oil caught its bid, followed by telecom (+2.3%), tech (+1.3%), and financials (+1.1%) — while every classic defensive closed red: healthcare −2.0%, staples −1.2%, utilities −0.8%. That is a risk-on rotation inside a barely-moving global tape (VT +0.2% on the week).
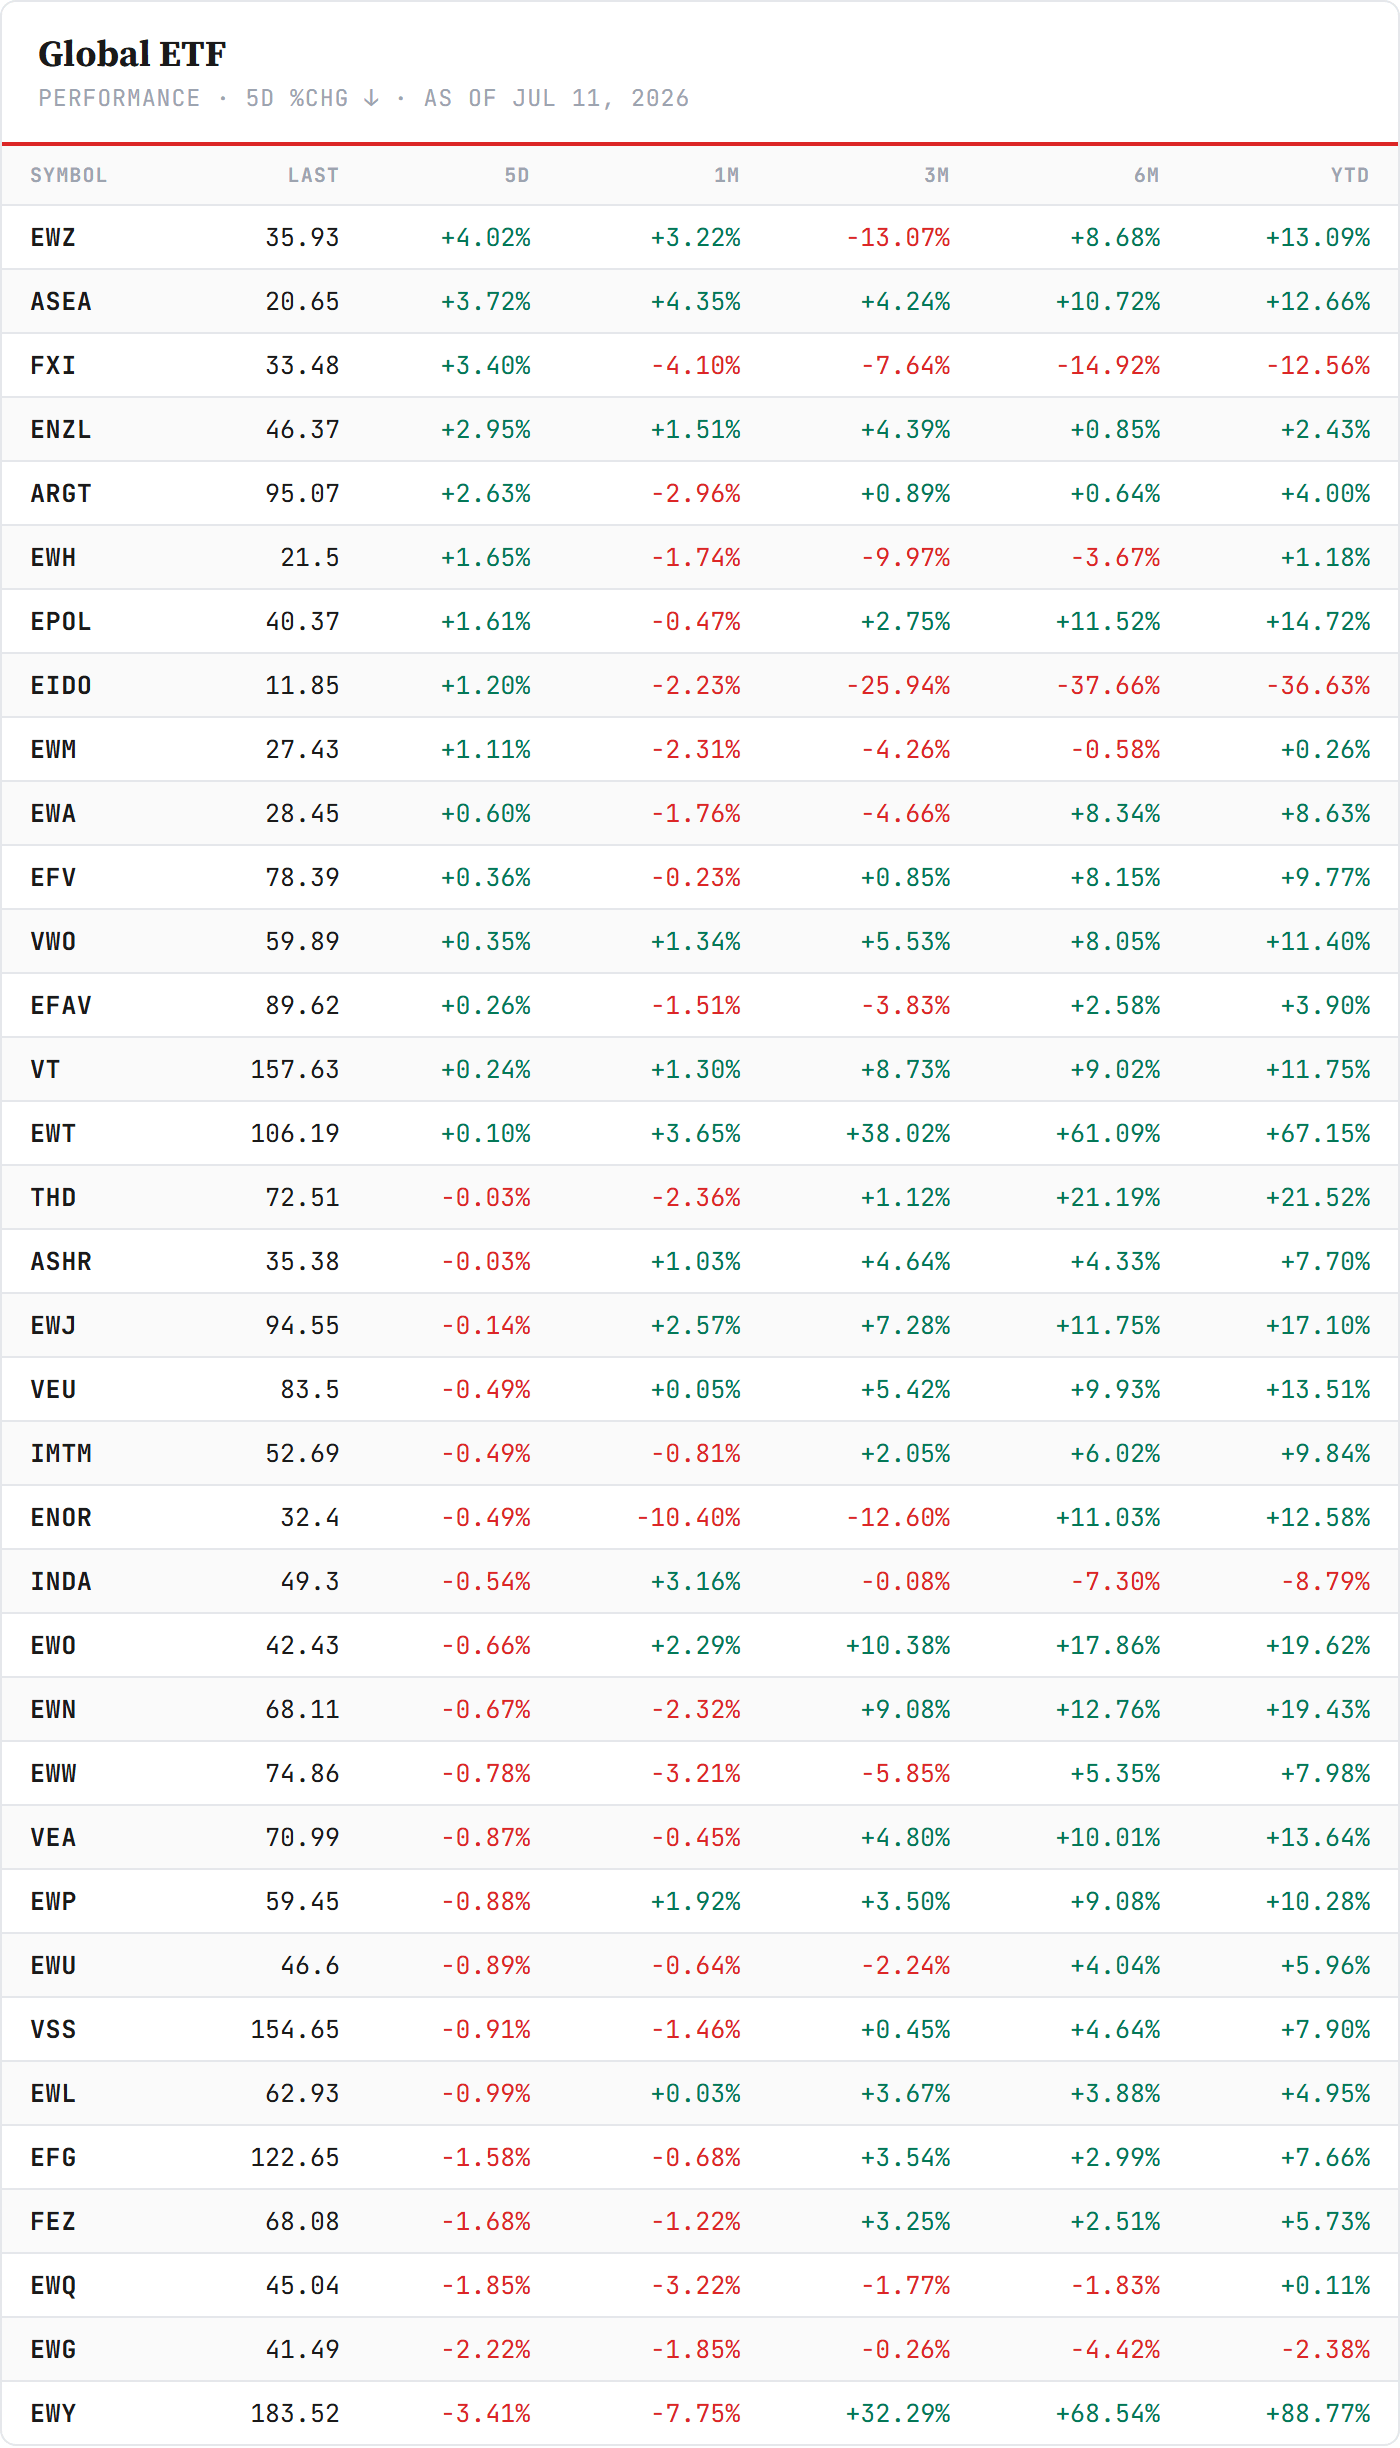
The regions. The board answers last week’s question — and inverts it. We asked whether participation would broaden beyond the two chip countries. It did, but not the way a trend-follower would have guessed: the periphery led — Brazil +4.0%, Southeast Asia +3.7%, China +3.4%, New Zealand +3.0%, Argentina +2.6% — while Korea rested (EWY −3.4% after its +89% year-to-date run) and Taiwan sat flat. The year-to-date count moved from six regions beating VEU to seven; Poland joined the club. Breadth is broadening at the margin — one week, one region at a time.
2 · The State
The event of the week — the listing. The demand question got answered three times in one week. SK Hynix — the HBM leader and the cheapest large AI name in the world — sold $26.5 billion of ADRs in the largest US listing by a foreign company on record. The book was covered multiple times over. The deal priced at $149, a 2.9% premium to Seoul’s close, where offerings of this size normally price at a discount. And when the ADRs opened on Nasdaq on Friday, the first trades printed near $170 — with an intraday high of $177 — before closing at $168.31, thirteen percent above the offer. The ticker converts from SKHYV to SKHY on Monday.
The tension worth naming. The same week the primary market paid up, the secondary market sold: Micron gave back part of its trillion-dollar week, and the memory complex traded red into the debut. That is not a contradiction — it reads like capital rotating from the expensive expression of the thesis (Micron at ~6.6x forward) into the cheaper new one (SK Hynix at ~4.8x at the offer, ~5.5x after the pop). The Korea discount is not closing by argument; it is closing by arbitrage.
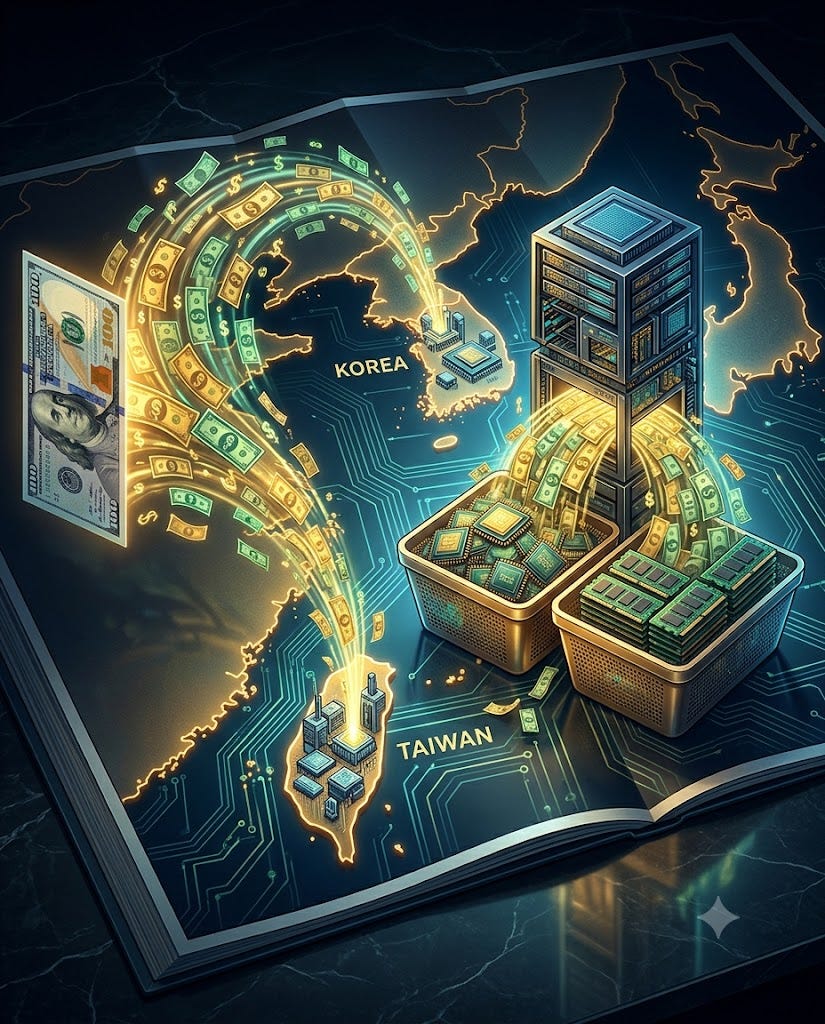
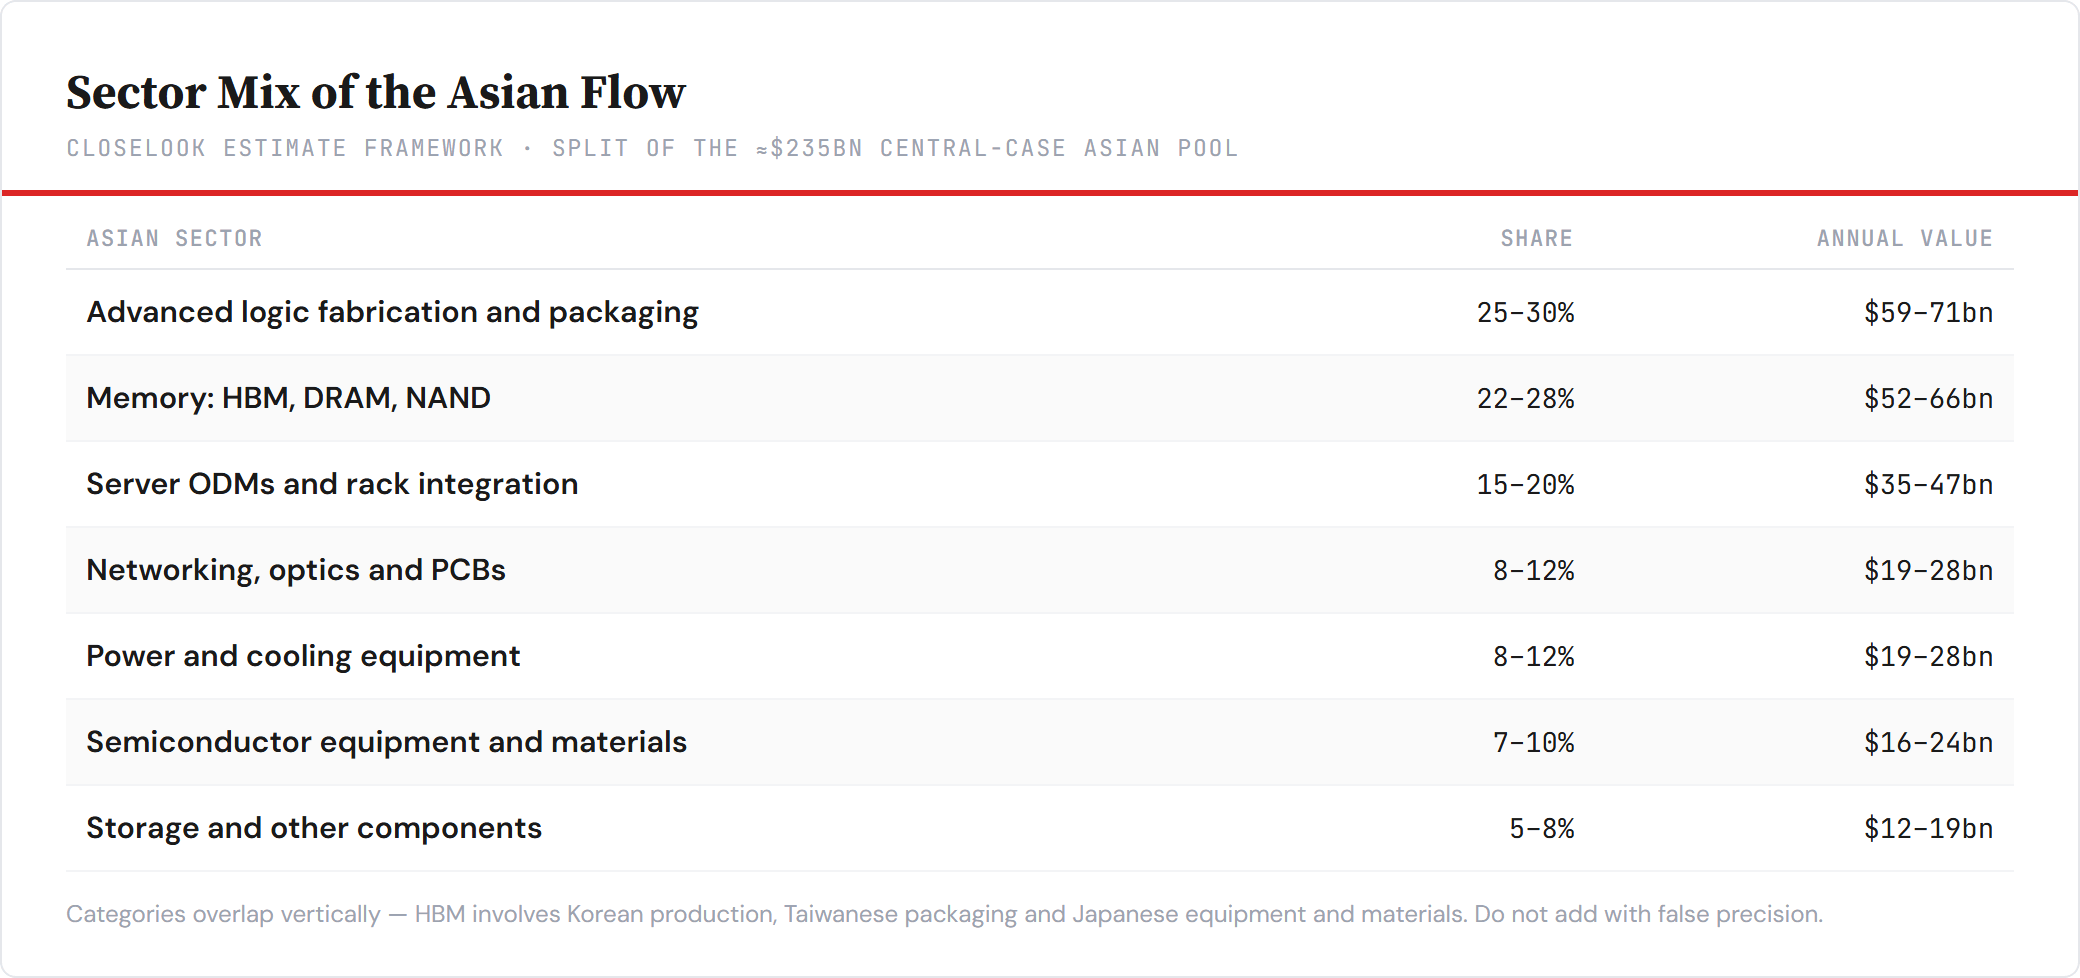
Follow the dollar. The listing is the visible end of a pipeline worth tracing in full. The four large US hyperscalers are heading toward roughly $650–700 billion of combined 2026 capex — Alphabet guides to $180–190 billion, Meta to $125–145 billion, and Microsoft says it is expanding AI capacity by more than 80% while roughly doubling its data-center footprint over two years. Our working estimate for where that money lands: of every $100, $45–55 stays in the US or wherever the data center is built, $10–20 goes to Europe, Mexico and other regions — and $30–40 ultimately accrues to Asian production and suppliers. For the incremental AI-compute dollar the Asian share is higher, around $40–50 of every $100, because the marginal AI dollar contains more GPUs, HBM, advanced packaging, server assembly and cooling — and less land and conventional construction. At a $675 billion midpoint, that implies an Asian revenue pool of roughly $200–270 billion a year, with a central estimate of around $235 billion. This is an economic-value estimate, not a reported accounting number — hyperscalers do not disclose the geography of their capex, and an invoice paid to Nvidia in California ultimately funds wafers in Taiwan and HBM stacks in Korea.
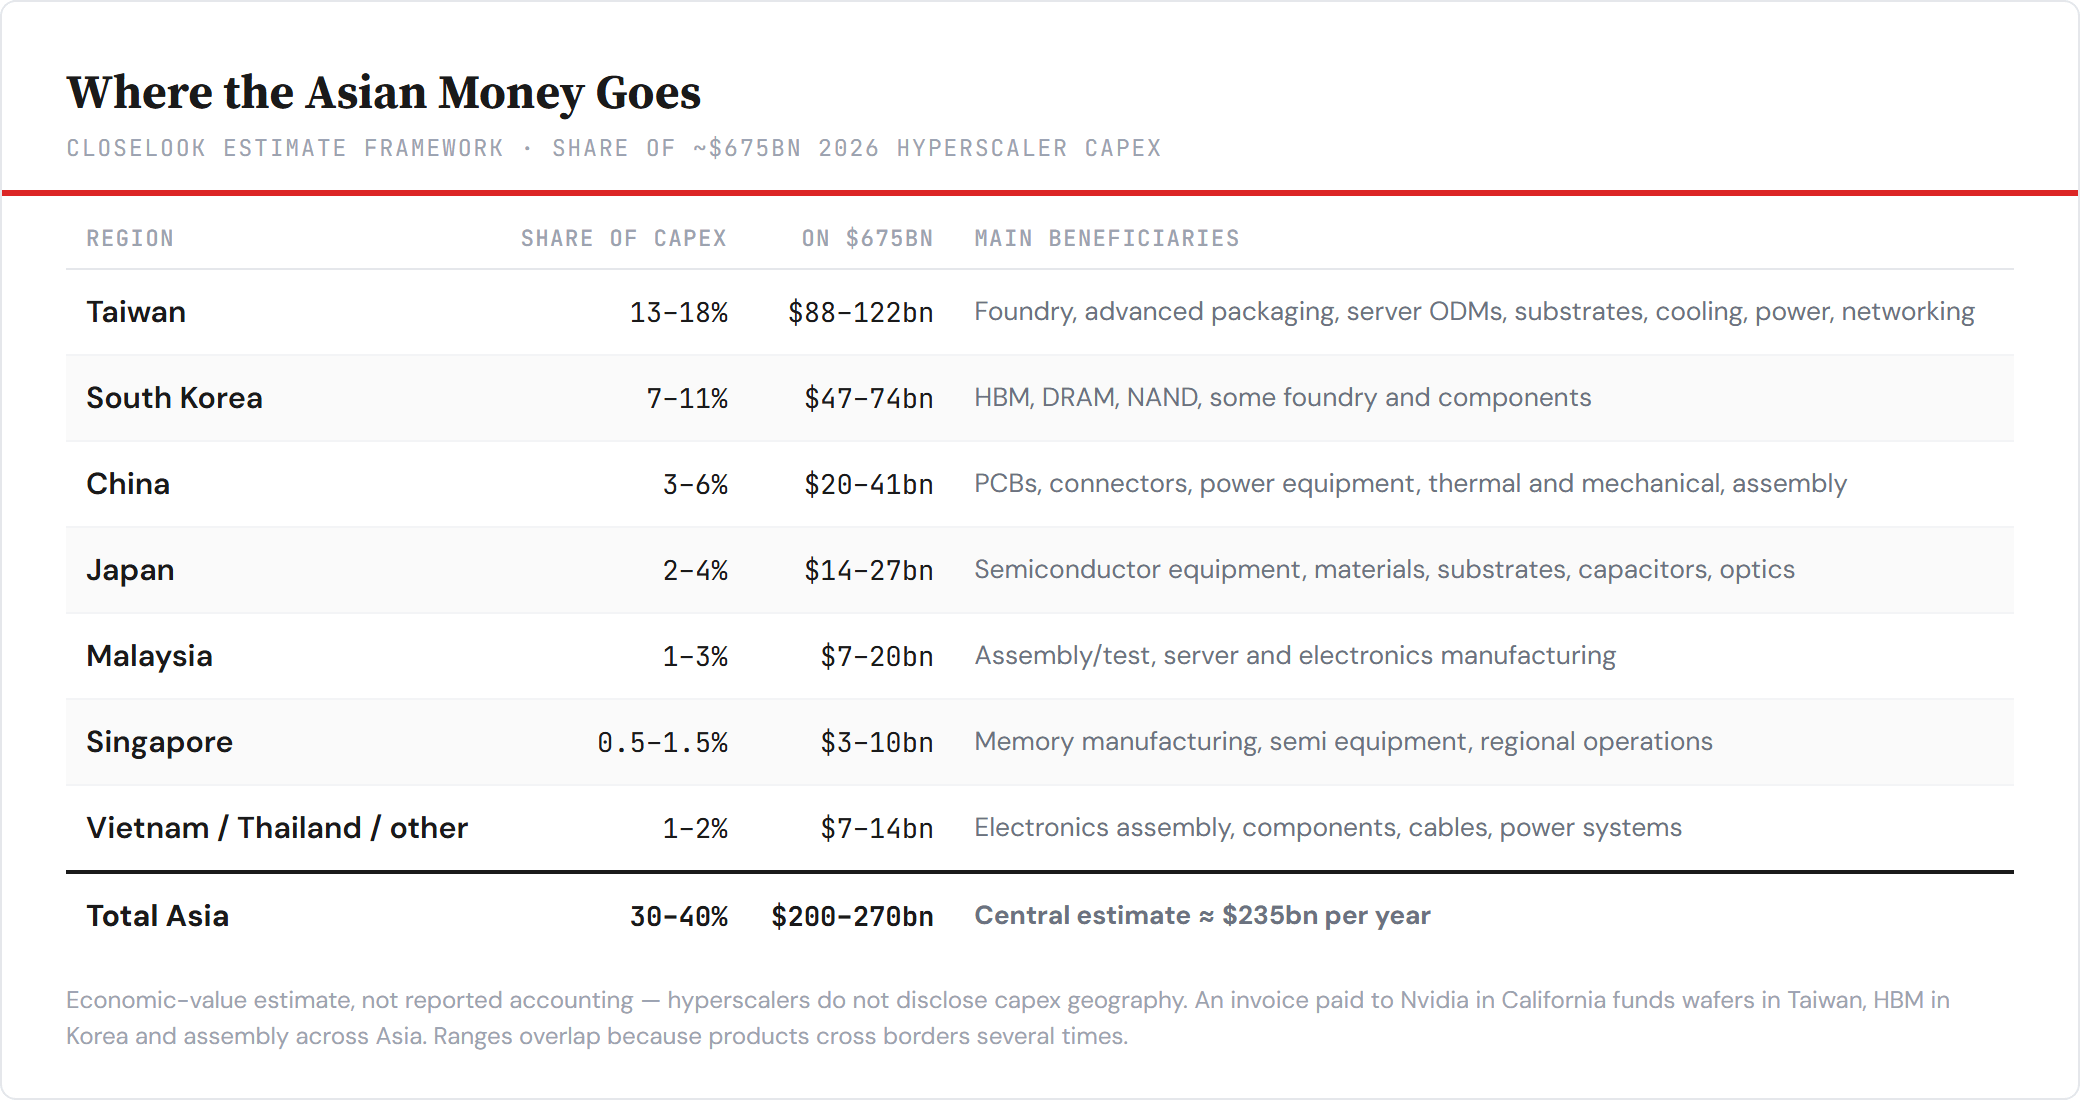
Taiwan is the largest single destination — 13–18% of total capex, $88–122 billion across foundry, advanced packaging, server ODMs, substrates, cooling, and power. Korea’s share is narrower but more concentrated — 7–11%, $47–74 billion — because it flows almost entirely into the single most profitable bucket: memory. Korean producers accounted for nearly 80% of global HBM revenue in the first quarter (SK Hynix 58%, Samsung 21%, per Counterpoint). Japan sits one or two layers upstream — equipment, wafers, photoresists, substrates — collecting its share when TSMC, SK Hynix, and Samsung spend to expand. China’s manufacturing footprint is larger than its profit capture. Malaysia and the rest of Southeast Asia are the China-plus-one winners.
Inside the AI rack. Cut the same $100 differently — not hyperscaler capex, but the AI system itself — and the concentration sharpens further. Our 2026 central case: memory takes $38 of every AI-hardware $100 (HBM alone is $18–25 of complete rack cost), accelerator and host-CPU compute takes $40 (with the design and IP margin staying largely in the US, and TSMC capturing the fabrication and packaging slice), and everything else — networking, power, cooling, boards, assembly — competes for the remaining $22.
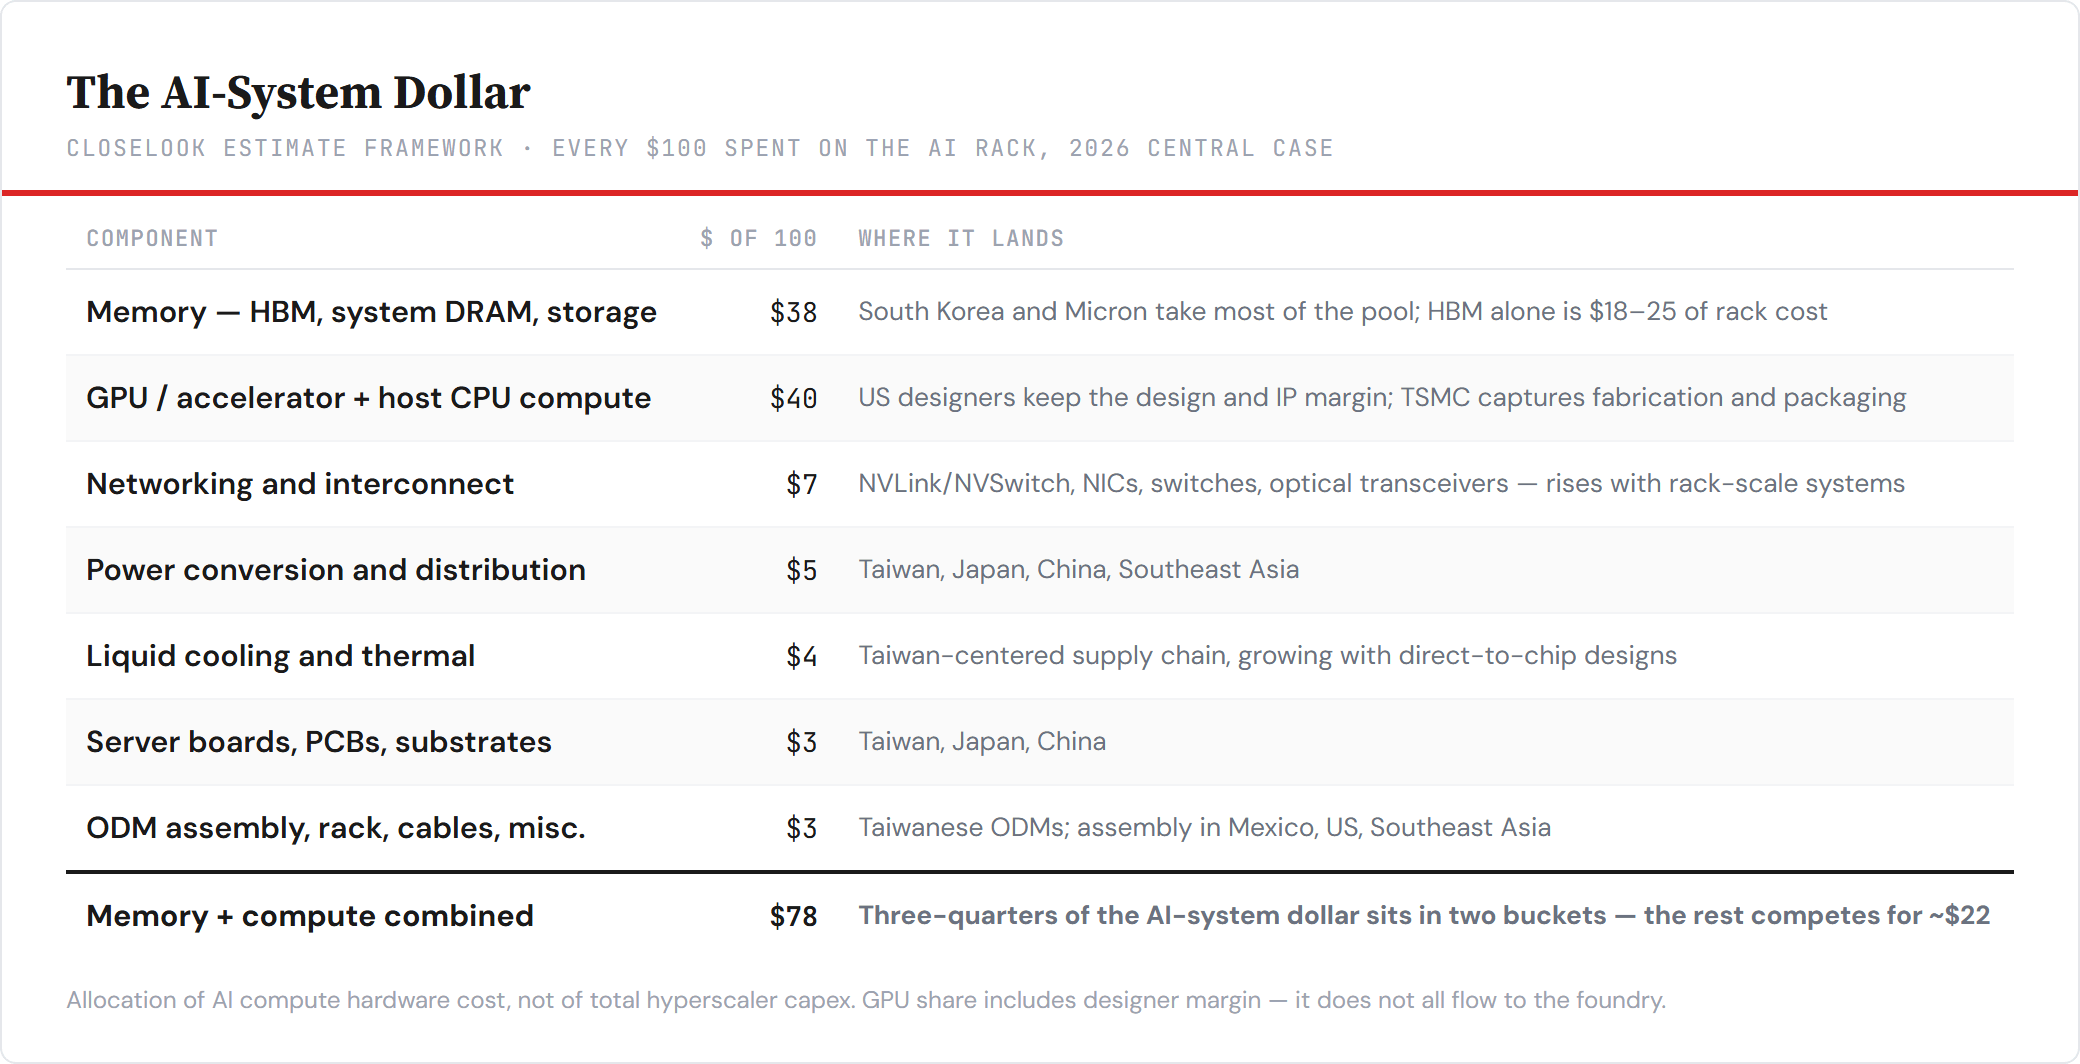
Memory and compute now divide roughly three-quarters of the AI-system dollar between them. That is why the economic leverage sits with HBM suppliers, accelerator designers, and advanced-packaging capacity rather than with conventional server assemblers — and why the memory story keeps forcing itself into this letter. Within the Asian pool itself, the two largest slices are advanced logic fabrication with packaging, and memory:
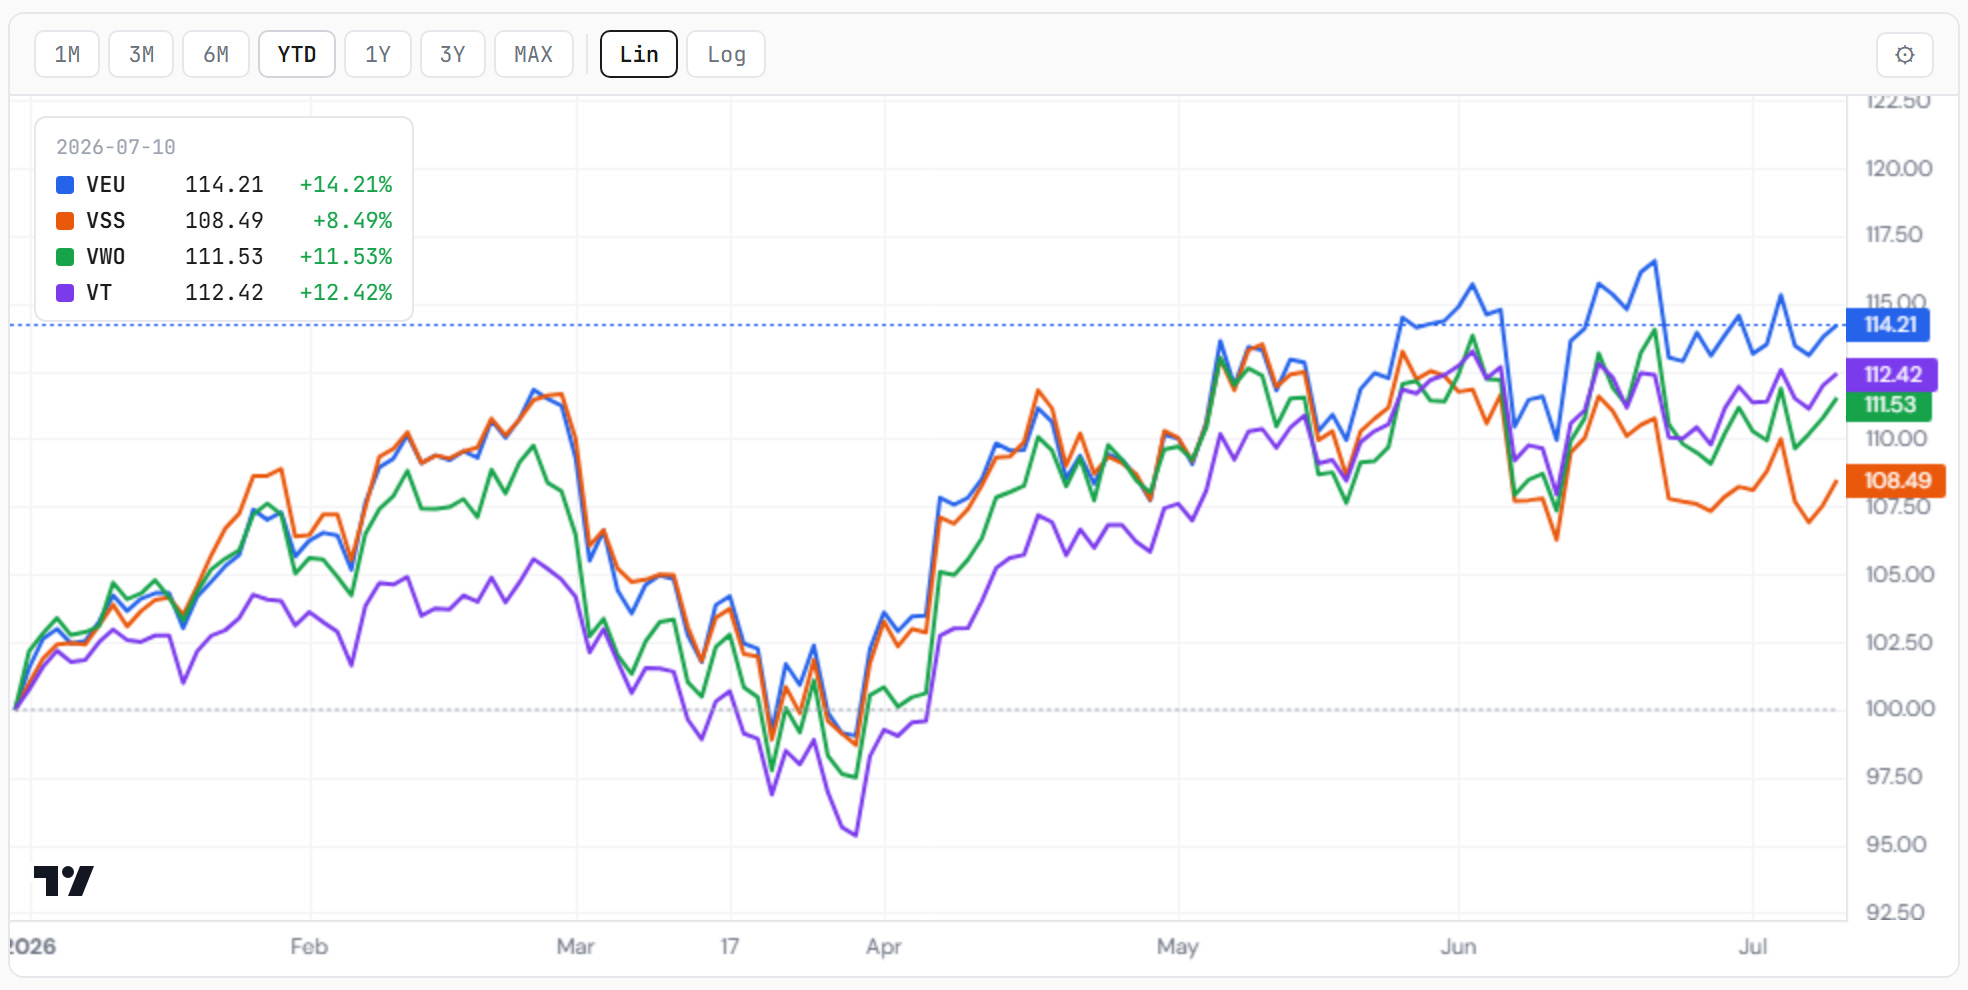
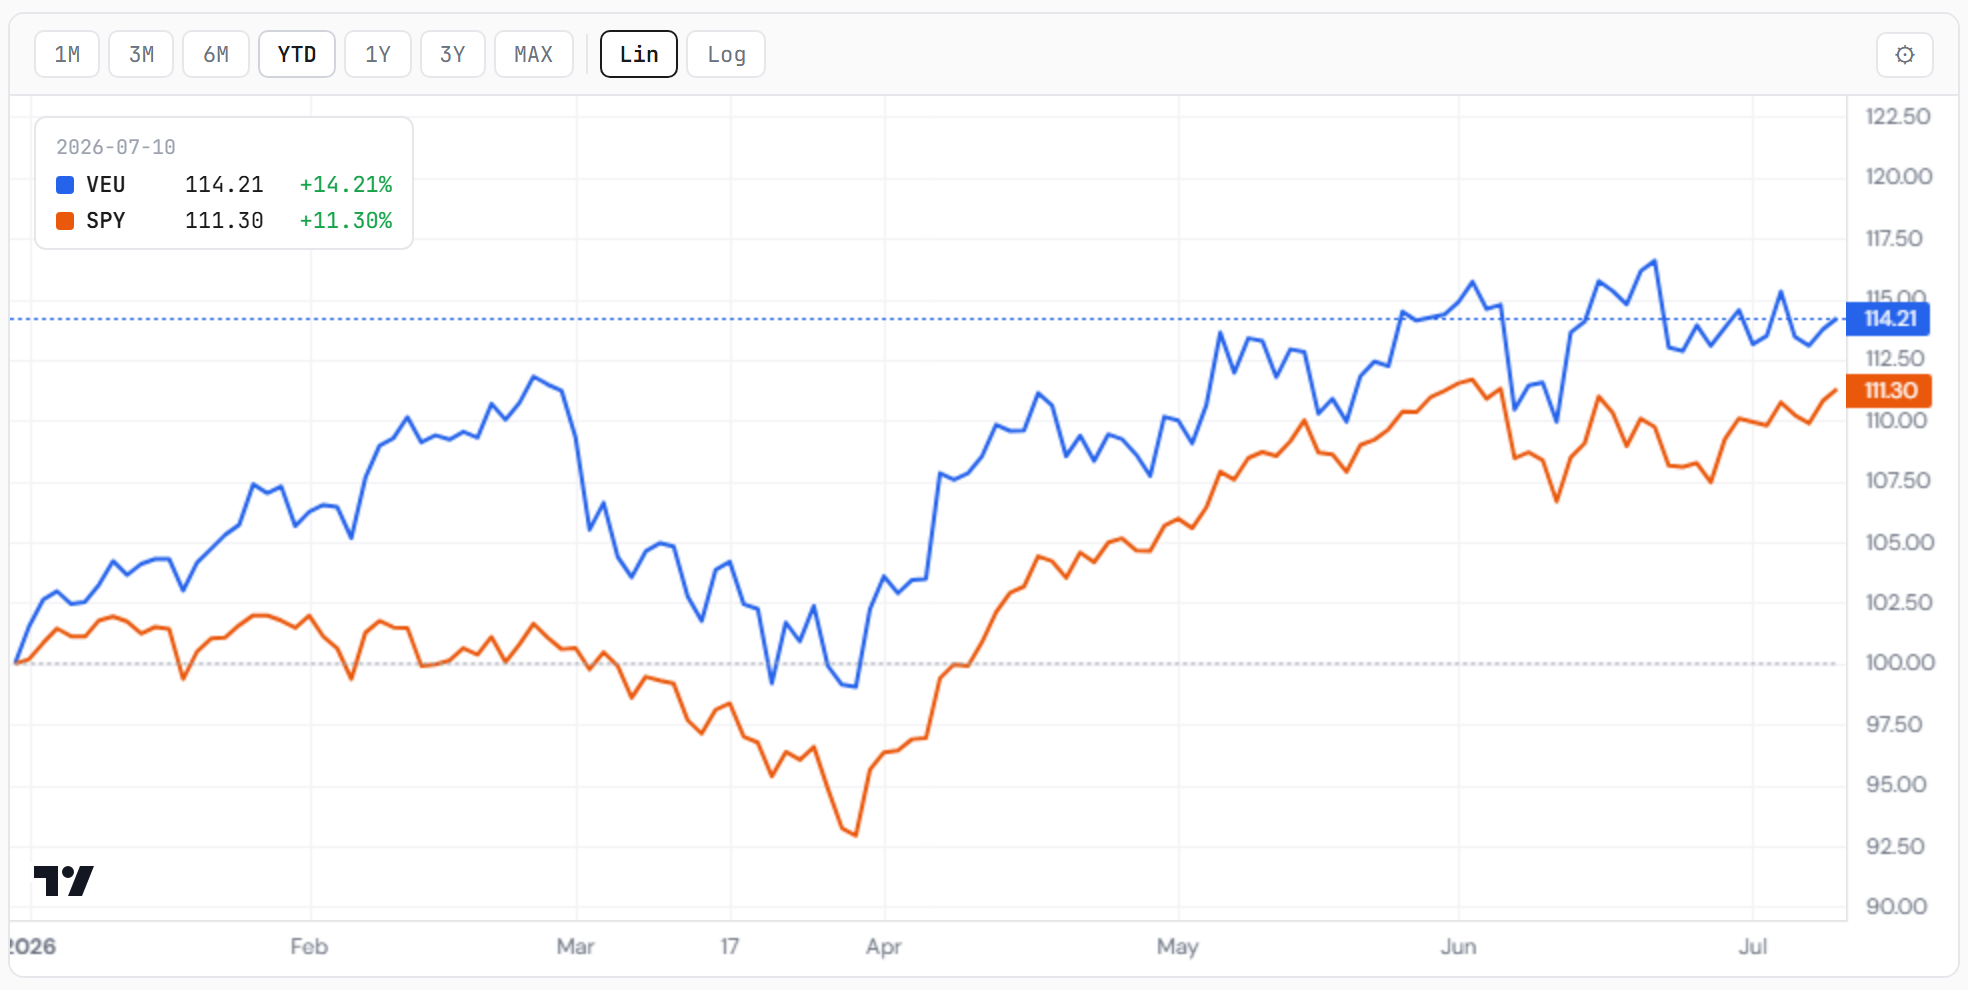
The concentration check, week two. The Vanguard four-slice comparison keeps score on the same story from the top down: VEU (large-cap-tilted, chip-heavy at the top) finished Friday at +14.2% year-to-date against VSS (small-caps, no mega-cap chip names) at +8.5% — the gap widened to 5.7 percentage points from 5 a week ago. The rally is still being carried by exactly the names the flow framework says are collecting the capex dollar.
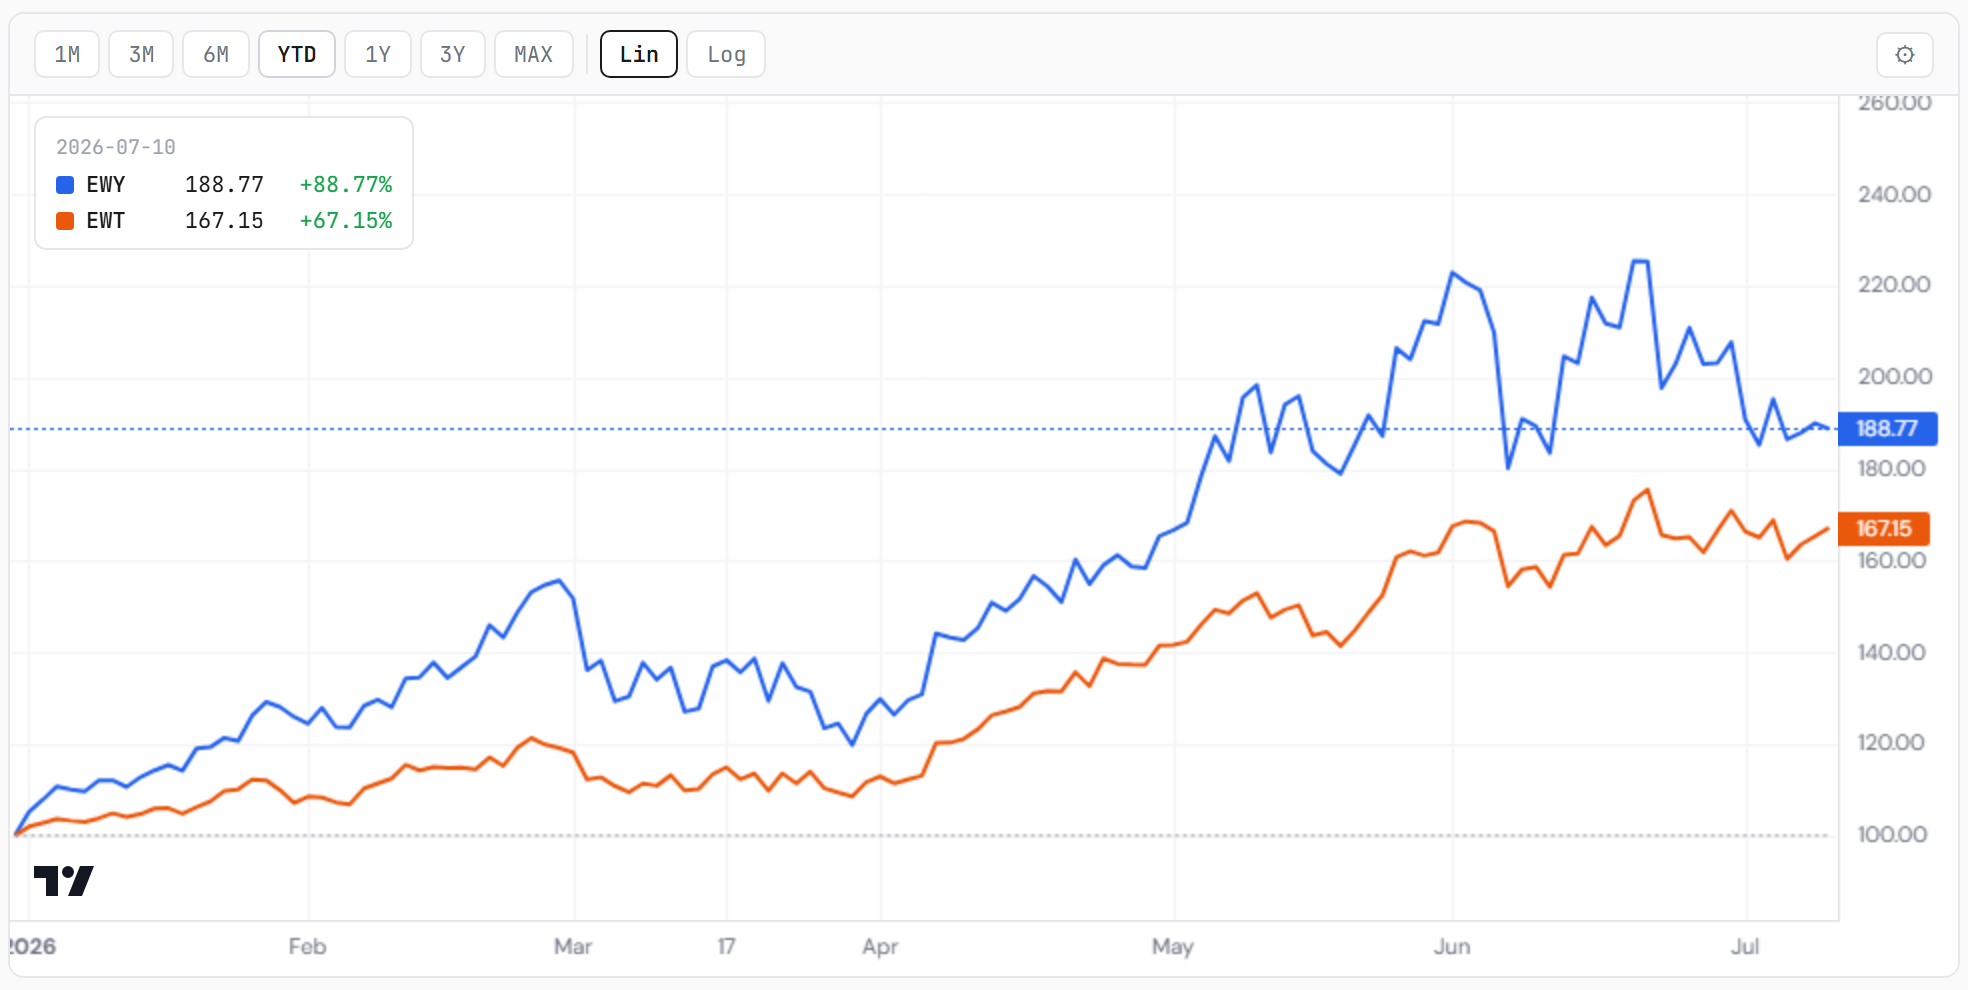
The two legs against each other. Taiwan compounded steadily all year; Korea went vertical from May. This week the two swapped character — Taiwan flat, Korea digesting. That is what a hand-off inside a theme looks like, not a top.
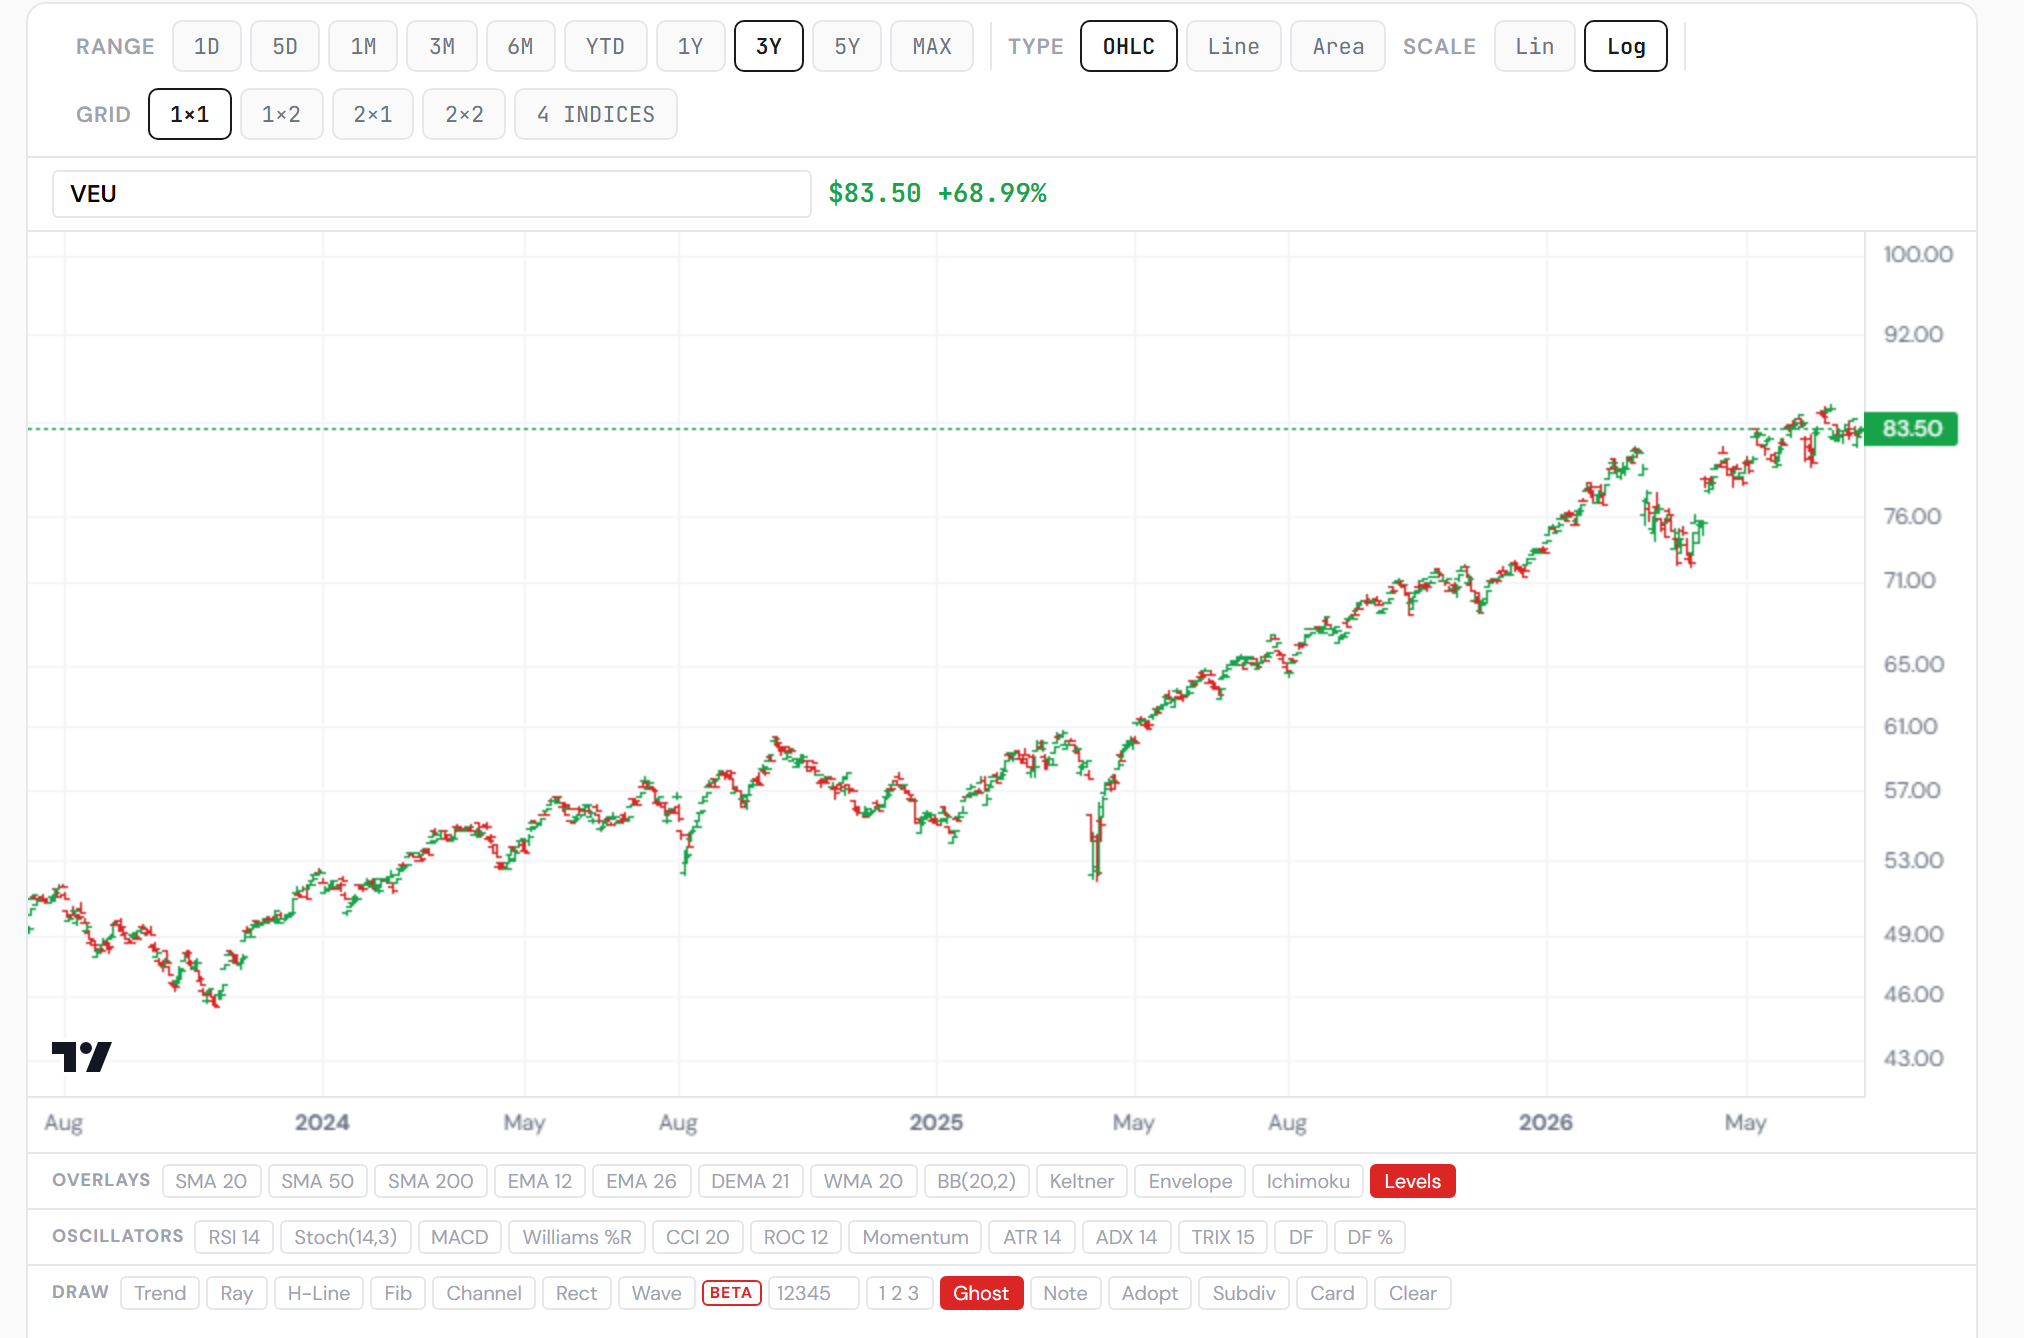
The structural read. The three-year log view keeps the story honest: a staircase from the 2023 low — +69% over the window — with every correction holding above the prior shelf, including April’s fast flush. VEU trades above both its 50-day (82.6) and 200-day (76.5) averages with RSI at 52: stretched in price, mid-range in momentum. Our chart terminal’s machine wave read (beta) counts the advance as an impulse now in a fifth-wave extension, with invalidation far below at 52.54 — nothing in the structure argues against the trend. The risk at this altitude is breadth and rate path, not pattern.
3 · The Outlook
The four indices. The week told the whipsaw story honestly. Rubin fell 5.6% on Tuesday, recovered 3.9% on Thursday — the first all-green day since Monday — and finished the week at −0.1%: a round trip. The agentic side led into Thursday and then gave back 3.3% on Friday, into the debut, ending the week at +1.4% (AEI). AW40 added +1.7%, HALO lost −2.6%. Year-to-date the ladder reads: Rubin +119%, AEI +47%, HALO +5%, AW40 −21% (equal-weight variants). The barbell swapped sides twice and ended the week close to balance — this is a tug-of-war, not a regime change. Friday’s give-back on the agentic side is the same rotation §2 describes: capital moving toward the cheaper expressions of the same theme.
